The evolution of CNO isotopes: a new window on cosmic star-formation history and the stellar IMF in the age of ALMA
Abstract
We use state-of-the-art chemical models to track the cosmic evolution of the CNO isotopes in the interstellar medium (ISM) of galaxies, yielding powerful constraints on their stellar initial mass function (IMF). We re-assess the relative roles of massive stars, asymptotic giant branch (AGB) stars and novae in the production of rare isotopes such as 13C, 15N, 17O and 18O, along with 12C, 14N and 16O. The CNO isotope yields of super-AGB stars, novae and fast-rotating massive stars are included. Having reproduced the available isotope enrichment data in the solar neighbourhood, and across the Galaxy, and having assessed the sensitivity of our models to the remaining uncertainties, e.g. nova yields and star-formation history, we show that we can meaningfully constrain the stellar IMF in galaxies using C, O and N isotope abundance ratios. In starburst galaxies, where data for multiple isotopologue lines are available, we find compelling new evidence for a top-heavy stellar IMF, with profound implications for their star-formation rates and efficiencies, perhaps also their stellar masses. Neither chemical fractionation nor selective photodissociation can significantly perturb globally-averaged isotopologue abundance ratios away from the corresponding isotope ones, as both these processes will typically affect only small mass fractions of molecular clouds in galaxies. Thus the Atacama Large Millimetre Array now stands ready to probe the stellar IMF, and even the ages of specific starburst events in star-forming galaxies across cosmic time unaffected by the dust obscuration effects that plague optical/near-infrared studies.
keywords:
nuclear reactions, nucleosynthesis, abundances – Galaxy: abundances – Galaxy: evolution – galaxies: star formation – stars: luminosity function, mass function.1 Introduction
Measurements of isotope abundances and abundance ratios allow us to perform key tests of mixing mechanisms inside stars, and provide powerful diagnostics of chemical enrichment in galaxies across cosmic time. Some carry valuable information about the state of the early Universe, which can be used to probe fundamental physics. Determinations of the 6Li/7Li ratios in metal-poor stars (Cayrel et al., 2007; García Pérez et al., 2009; Lind et al., 2013), for instance, constrain Big Bang nucleosynthesis theories (Cyburt et al., 2016) and the degree of 7Li depletion possible in Galactic halo stars (Spite & Spite, 2010). The CNO isotope ratios measured in presolar grains (Clayton & Nittler, 2004; Zinner, 2014) and in the atmospheres of evolved stars (Gratton et al., 2000; Smiljanic et al., 2009, and references therein) can be compared to expectations from stellar evolution and nucleosynthesis models to shed light on the nature of non-standard mixing processes acting on the giant branches (see Charbonnel, 1994; Wasserburg et al., 1995; Charbonnel & Zahn, 2007; Palmerini et al., 2009, among others). Peculiar isotopic features in C-rich grains can be explained by considering the effects of hydrogen ingestion into the helium shell of core-collapse supernovae before the shock hits the outer layers (Pignatari et al., 2015). Beginning with Boesgaard (1968), magnesium isotope abundances have been measured in stars in order to provide insights into the production sites of the two minor, neutron-rich isotopes, 25Mg and 26Mg. Last but not least, measurements of barium (Gallagher et al., 2015, and references therein), europium, samarium and neodymium isotope ratios in stars (Roederer et al., 2008) allow us to establish whether the dominant formation process is slow or rapid neutron capture by heavy seed nuclei, thus contributing significantly to our understanding of how neutron-capture elements are created in galaxies.
In principle, large samples of stars with precise chemical abundances over the full range of plausible metallicities should provide a complete fossil record of the history of chemical enrichment for their host galaxies (provided the data are corrected for stellar evolutionary effects when needed; see Placco et al., 2014). Alongside accurate determinations of stellar ages, distances and kinematics, abundance data can meaningfully constrain models of galaxy formation and evolution (Freeman & Bland-Hawthorn, 2002; Ivezić et al., 2012). However, when it comes to the determination of isotopic abundance ratios in stars, very high-resolution, high signal-to-noise spectroscopic data are invariably needed, which severely limits current observational studies. It is then useful to turn to measures of the gas-phase isotopic abundances in interstellar clouds, which enables us to look significantly further afield. On the other hand, each observation provides merely a snapshot in time, and information about the temporal sequence of events that led to the observed configuration is thus missing. Based on these diagnostics, however, crucial information on the present-day gradients of 12C/13C, 14N/15N, 16O/18O and 18O/17O across the Milky Way disc can be obtained (Wilson & Rood, 1994).
Indeed, in the era of the Atacama Large Millimetre Array (ALMA) it has become possible to peer back to the epoch when gas-rich galaxies dominated the Universe, at , which should lead to a better understanding of the evolutionary links between these galaxies and their descendents. Exploiting isotopologue line intensity ratios as probes of the corresponding elemental isotope ratios will open a new window onto the isotope enrichment history of the Universe across cosmic epoch. Such observations were already plentiful in the local Universe, even before ALMA (e.g. Sage et al., 1991; Casoli et al., 1992; Henkel & Mauersberger, 1993; Aalto et al., 1995; Papadopoulos et al., 1996; Paglione et al., 2001; Greve et al., 2009), and now extend out to (Henkel et al., 2010; Spilker et al., 2014, Zhang et al., in preparation). Even more importantly, isotopologue line ratios are the only probe of isotope ratios that are unaffected by dust extinction, as isotopologue lines (e.g. 12CO, 13CO, C18O, H13CN, HC15N rotational transitions) are found in the millimetre/submillimetre (submm) regime. Besides the obvious advantage of a method insensitive to dust extinction, it is in the highly dust-enshrouded star-forming environments of compact starbursts (e.g. Ikarashi et al., 2015; Simpson et al., 2016) where very different average initial conditions of star formation (Papadopoulos, 2010) can lead to a different stellar initial mass function (IMF, see Papadopoulos et al., 2011). Yet it is exactly in these dust-obscured galaxies where the stellar IMF is inaccessible via standard methods (e.g. star counts) where the different isotope enrichment of the interstellar medium (ISM) would provide the best evidence for a different stellar IMF. In short, in the dust-obscured environments of star-forming galaxies, isotope abundance ratios provide the next best constraint on the prevailing stellar IMF, other than starlight itself. This prevailing IMF is important to our understanding of galaxy evolution since it is a key ingredient of the recipes used to determine the instantaneous star-formation rate, for example, where extrapolations are made from the number of massive stars to the total mass of stars. The evolution of galaxies is often explored in the observational framework of the so-called ‘main sequence’ (e.g. Elbaz et al., 2011), plotted usually as star-formation rate versus stellar mass. Where both measurements are sensitive to the IMF, the implications may be profound.
In past years many theoretical efforts (including Audouze et al., 1975; Dearborn et al., 1978; Tosi, 1982; Matteucci & D’Antona, 1991; Wilson & Matteucci, 1992; Timmes et al., 1995; Prantzos et al., 1996; Fenner et al., 2003; Romano & Matteucci, 2003; Chiappini et al., 2008; Hughes et al., 2008; Kobayashi et al., 2011) have been devoted to the evolution of isotope ratios in the Galaxy. Hughes et al. (2008) also discuss observations of carbon and sulphur isotopes in a spiral galaxy and a damped Ly system at . Although there is no doubt that progress has been made, some questions remain unanswered. For example, we know that 12C is produced as a primary element in stars (i.e. starting from the original H and He; Burbidge et al., 1957) and that the relative contributions from low- and intermediate-mass stars and from massive stars change with time and position within the Galaxy (e.g. Akerman et al., 2004); the actual proportions are still debated, however.
Regarding 14N, it has been acknowledged for a long time that significant primary nitrogen production is needed to explain observations of low-metallicity systems (e.g. Edmunds & Pagel, 1978; Matteucci, 1986). The physical process responsible for this production remained elusive for decades, until very low-metallicity, fast-rotating massive star models proved able to convert part of the freshly made 12C into primary 14N (and 13C), quite efficiently, because of rotation-induced mixing between the convective hydrogen shell and the helium core (Meynet & Maeder, 2002a; Chiappini et al., 2008). However, chemical evolution models that adopt 14N yields from fast-rotating stellar models still predict a much lower nitrogen abundance in the ISM than observed in the metallicity range (Chiappini et al., 2006; Romano et al., 2010). In intermediate-mass stars climbing the asymptotic giant branch (AGB), proton-capture nucleosynthesis leads to primary 14N (and 13C) production if the base of the convective envelope becomes hot enough (a process referred to as hot bottom burning; see Iben, 1975). Moreover, a large fraction of 14N is synthesised as a secondary element, at the expense of 12C, through the CN cycle in stars of all masses and –at a much slower rate– at the expense of 16O in the ON cycle. Adding these contributions, however, does not help to solve the aforementioned problem.
Another outstanding issue is that of 15N evolution. Novae have been identified as 15N polluters on a Galactic scale (Dearborn et al., 1978; Matteucci & D’Antona, 1991; Romano & Matteucci, 2003), but observations of low 14N/15N at high redshift (Muller et al., 2006) suggest an additional production channel, possibly hydrogen ingestion in the helium shell of massive stars (Pignatari et al., 2015).
The synthesis of 16O in stars, on the other hand, is well understood, both qualitatively and quantitatively, and chemical evolution models can fit the relevant data, regardless of the specific set of yields adopted (see figure 8 of Romano et al., 2010). The less abundant, neutron-rich oxygen isotopes, 17O and 18O, are made as secondary elements by the CNO cycle during hydrogen burning and by -captures on 14N during helium burning, respectively. While intermediate-mass stars, massive stars and novae all contribute significantly to 17O production, the situation for 18O is less clear; it seems, in fact, that intermediate-mass stars destroy 18O rather than produce it.
In this work, we focus on the evolution of the CNO isotopes in the ISM of galaxies –those associated with the most abundant molecule after , namely carbon monoxide (CO). First, we re-assess the relative roles of massive stars, AGB stars and novae in the production of the rare isotopes 13C, 15N, 17O and 18O on a Galactic scale, in the light of newly published stellar yields and more recent isotopic abundance determinations in the Milky Way. Second, we discuss how new measurements of 12C/13C and 16O/18O ratios in starburst galaxies can constrain their stellar IMF. We stress that these constraints on the stellar IMF are ultimately set by the stellar physics underlying the chemical evolution model, and as such are extremely powerful, regardless of remaining uncertainties. In this work we examine these uncertainties, focusing on the assumed stellar yields, star-formation histories and the astrochemical effects on molecules, such as fractionation and selective photodissociation. These two effects, if widespread, could in principle prevent us from directly deducing isotope abundance ratios from the corresponding isotopologues. In the age of ALMA, numerous isotopologue line ratios can now be measured for the molecular gas of dust-obscured galaxies, where there is no hope of measuring the stellar IMF directly via star counts or integrated starlight, leaving these ratios as the next best thing for constraining the IMF (Papadopoulos et al., 2014).
The paper is organised as follows: in §2, we review the available data. In §3, we briefly describe the chemical evolution models. In §4, we present the model results and compare them to data for both the Milky Way (§4.1) and other galaxies (§4.2), with special emphasis on intense starburst galaxies. We discuss our findings and conclusions in §5.
2 Observational data
| Name | Type | Redshift | SFRa | 12CO/13CO | 12CO/C18O | 13CO/C18O | Method | Referencesb |
| (M⊙ yr-1) | ||||||||
| SPT stackingc | SMG | 3.0 | 500–2,000 | 100–200 | –200 | () | LVG modeling | 1 |
| Cloverleaf | QSO | 2.5579 | 1,000 | 300–10,000 | – | – | LVG modeling | 2, 3 |
| MA2.53 | DLA | 2.525 | – | 40 | – | – | Optical absorption | 4 |
| Eyelashd | SMG | 2.3 | 400 | 100e | 100 | 0.8 | LVG modeling | 5 |
| MA1.15 | DLA | 1.15 | – | 53 () | – | – | Optical absorption | 6 |
| MA0.89 | Spiral | 0.89 | – | 1.9 | Absorption + LVG modeling | 7 | ||
| MA0.68 | Spiral | 0.68 | – | 2 | Absorption + LVG modeling | 8 | ||
| Mrk 231 | ULIRG | 0.042170 | 100 | 100 | 100 | 1.0 | CN modeling | 9 |
| NGC 6240 | ULIRG | 0.0245 | 100 | 300–500 | – | 1.6 | LVG modeling | 10, 11 |
| Arp 193 | ULIRG | 0.023299 | 100 | – | – | LVG modeling | 10 | |
| VV 114 | LIRG | 0.020067 | 48 | 229 | – | – | LVG modeling | 12 |
| Arp 220 | ULIRG | 0.018126 | 220 | – | 70–130 | 1.0 | OH and absorption | 13 |
| Arp 220 | ULIRG | 0.018126 | 220 | – | –100 | 1.0 | Line ratio limits | 14 |
| NGC 1614 | LIRG | 0.015938 | 41 | 130 | – | 6.6 | LVG modeling | 15 |
| LMC | Dwarf | 0.000927 | one clump | 49 | 2000 | 279 | LVG modeling | 16, 17 |
| NGC 253 | LIRG | 0.000811 | 2.8 | 2.6 | Line ratio limits + CN modeling | 18, 9, 19 | ||
| M 82 | LIRG | 0.000677 | 4.6 | 2.2-3.7 | Line ratio limits + CN modeling | 18, 20, 21 | ||
| NGC 1068 | LIRG | 0.003793 | 25 | – | – | 3.33 | 22 | |
| NGC 1614 | LIRG | 0.015938 | 55 | 36.5 | 23 | |||
| NGC 4945 | LIRG | 0.001878 | 17 | 3.6 | 24 | |||
| Cen A | Radio | 0.001825 | 0.16 | 17 | Absorption + modeling | 25, 26 | ||
| NGC 2903 | Normal | 0.001834 | 2.7 | – | () | 27 | ||
| IC 860 | LIRG | 0.011164 | 25 | 1 | 28 | |||
| NGC 3079 | Normal | 0.003723 | 9.3 | 5.4 | 28 | |||
| NGC 4194 | LIRG | 0.008342 | 20 | 28 | ||||
| NGC 7469 | LIRG | 0.016317 | 67 | 6.8 | 28 | |||
| NGC 7771 | LIRG | 0.014267 | 38 | 4.7 | 28 | |||
| NGC 660 | Normal | 0.002835 | 5.3 | 6.9 | 28 | |||
| NGC 3556 | Normal | 0.002332 | 4 | 12.9 | 28 | |||
| NGC 7674 | LIRG | 0.028924 | 54 | 2.8 | 28 | |||
| UGC 2866 | Radio | 0.004110 | 8 | 5.8 | 28 | |||
| Circinus | Normal | 0.001448 | 8 | 5.1 | 29, 30, 31 | |||
| IC 10 | Normal | 0.001161 | 0.2 | () | 32, 33 | |||
| IC 342 | Normal | 0.000103 | 2.5 | 3-7 | 34 | |||
| M 51 | Normal | 0.002000 | 4.5 | 4.5 | 35 | |||
| Maffei 2 | Normal | 0.000057 | 0.26 | 4.3 | 36 | |||
| NGC 1808 | Normal | 0.003319 | 8.8 | 3 | 37 | |||
| NGC 3256 | LIRG | 0.009354 | 63 | 4 | 37 | |||
| NGC 7552 | LIRG | 0.005365 | 18 | 3 | 37 | |||
| NGC 4826 | Normal | 0.001361 | 0.2 | 4 | 37 | |||
| NGC 2146 | LIRG | 0.002979 | 20 | 3 | 37 | |||
| NGC 4418 | LIRG | 0.007268 | 20.7 | – | – | 8.3 | 38 | |
| IRAS 04296+2923 starburst | Normal | 0.007062 | 16 | 3.7 | 39 | |||
| IRAS 04296+2923 CNZ | Normal | 0.007062 | 16 | 1.7 | 39 | |||
| NGC 6946 | Normal | 0.000133 | 2.5 | 13.3 | 2.5 | 40 |
Notes. a The star-formation rates are from standard IMFs. b 1: Spilker et al. (2014); 2: Henkel et al. (2010); 3: Lutz et al. (2007); 4: Noterdaeme et al. (2017); 5: Danielson et al. (2013); 6: Levshakov et al. (2006); 7: Muller et al. (2006); 8: Wallström et al. (2016); 9: Henkel et al. (2014); 10: Papadopoulos et al. (2014); 11: Pasquali et al. (2004); 12: Sliwa et al. (2013); 13: González-Alfonso et al. (2012); 14: Martín et al. (2011); 15: Sliwa et al. (2014); 16: Wang et al. (2009); 17: Heikkilä et al. (1998); 18: Martín et al. (2010); 19: Harrison et al. (1999); 20: Mao et al. (2000); 21: Tan et al. (2011); 22: Papadopoulos & Seaquist (1999); 23: König et al. (2016); 24: Curran et al. (2001); 25: Espada et al. (2010); 26: Salomé et al. (2016); 27: Muraoka et al. (2016); 28: Costagliola et al. (2011); 29: Zhang et al. (2014); 30: Davis (2014); 31: For et al. (2012); 32: Nishimura et al. (2016); 33: Yin et al. (2010); 34: Meier & Turner (2001); 35: Watanabe et al. (2014); 36: Meier et al. (2008); 37: Aalto et al. (1995); 38: Costagliola et al. (2015); 39: Meier et al. (2014); 40: Meier & Turner (2004). cStacking results of the strongly lensed SMGs found by the South Pole Telescope (SPT) survey. All galaxies have been shifted to . The C18O lines only have a 3- upper limit, while the 13CO lines were detected at the 3- level. The infrared (IR) luminosity is L⊙ which translates to a star-formation rate, M⊙ yr-1. However, these are lensed systems, therefore the inferred SFRs have been scaled down using a suitable magnification factor. dWe adopt the best-fitting results over the whole galaxy. The uncertainty is large (see figure 7 of Danielson et al., 2013). eDanielson et al. (2011) report a 3- limit 12CO/13CO 60.
2.1 Milky Way galaxy
The 12C/13C ratio does not display significant variability within the Solar System; we adopt the value inferred from CO infrared lines in the solar spectrum using 3D convection models (91.41.3; Ayres et al., 2013) as indicative of the ISM composition in the solar vicinity 4.5 Gyr ago. Observations of CO, H2CO (taken from the compilation of Wilson & Rood, 1994), CO2 (from Boogert et al., 2000) and CN (Savage et al., 2002; Milam et al., 2005) and their 13C-bearing isotopologues are used to trace the behaviour of the 12C/13C ratio across the disc of the Galaxy at the present time. The gradients derived from CO and CN agree closely, which, together with the lack of correlation of the ratios with gas kinetic temperature, , suggests that the effects of chemical fractionation and isotope-selective photodissociation are negligible (Milam et al., 2005). Indeed there are simple reasons why these two astrochemical effects cannot significantly perturb isotopologue abundance ratios from the corresponding isotopic ratios for the bulk of the molecular gas reservoir in galaxies, which we briefly outline in §2.3.
The 12C/13C ratios derived from both H2CO and CO2 tend to be higher than those derived from other tracers (Boogert et al., 2000). The carbon isotope ratio varies significantly in the local ISM; we take the average value of suggested by Milam et al. (2005) as typical of the local ratio. It is worth noting that because of the significant heterogeneity in interstellar carbon isotope ratios, it is unclear whether the solar value is truly representative of the average local 12C/13C ratio 4.5 Gyr ago. On top of that, the Sun might have migrated to its current position from a birthplace closer to the Galactic Centre (Wielen et al., 1996) and its composition could thus reflect chemical enrichment occurring on faster time scales. Measurements of 12C/13C ratios in statistically significant samples of nearby dwarf stars would usefully constrain the models, but they are challenging. In brighter, giant stars, on the other hand, mixing may have altered the original abundances. In this paper, we use 12C/13C data from Spite et al. (2006) for a sample of ‘unmixed’ halo giants, i.e. stars lying mostly on the low red giant branch where the original CNO abundances were likely unaltered by mixing processes.
The nitrogen isotope ratio presents extreme variations among different Solar System objects (e.g. Füri & Marty, 2015); we adopt as a proxy for the proto-solar nebula the estimate for the bulk Sun from Marty et al. (2011), namely . Considerations discussed in the previous paragraph about the representativeness of the solar 12C/13C ratio also apply to the 14N/15N ratio. Accurate measurements of the 14N/15N ratios toward warm molecular clouds spanning a range of Galactocentric distances have been obtained by Adande & Ziurys (2012) from millimetre-wave observations of rotational lines of CN and HNC and their isotopologues. Direct (from CN, correcting for opacities when needed) and indirect (from HNC, using the 12C/13C ratios previously established by Milam et al., 2005, for each source) determinations yield the same gradient, within the uncertainties. The 14N/15N ratios derived by Adande & Ziurys (2012), however, are systematically lower than those obtained by Dahmen et al. (1995) from H13CN/HC15N data, likely because of the use of 12C/13C ratios from H2CO in Dahmen et al. (1995). Indeed, scaling the HCN data of Dahmen et al. (1995) with 12C/13C ratios from CN yields HCN values that agree with those from the other indicators, within the uncertainties (see figure 3 of Adande & Ziurys, 2012). It is worth noting that, while Romano & Matteucci (2003) had to offset their model predictions to match Dahmen et al. (1995) data, the new estimates of the 14N/15N ratio across the Galaxy by Adande & Ziurys (2012) make such a correction unnecessary. The mean local ISM value suggested by Adande & Ziurys (2012), , agrees with that measured in nearby diffuse clouds from CN absorption lines in the optical (27418; Ritchey et al., 2015).
We adopt the solar photospheric ratios and from Ayres et al. (2013) as indicative of the local ISM composition 4.5 Gyr ago. A radial 18O/17O gradient is suggested by Wouterloot et al. (2008), who combine observations of different CO transitions in Galactic sources covering the Galactocentric distance range . Their finding is further supported by recent independent analysis and observations by Li et al. (2016). Ratios of 16O to 18O across the disc are taken from the compilation of Wilson & Rood (1994), from OH data of Polehampton et al. (2005), and derived by combining the CO data from Wouterloot et al. (2008) with the 12C/13C gradient from Milam et al. (2005) following Young et al. (2011).
2.2 Other galaxies
CNO isotopic abundances can be precisely measured on the Earth and in the Sun. However, they are more difficult to obtain in the Galactic ISM and –even more so– in the extragalactic ISM, due to the limits of past observational capabilities and the high optical depths of the molecular lines of the most abundant isotopologues. Because of past sensitivity limitations, measurements of the extragalactic isotopic CO transitions have been limited to local gas-rich and metal-enriched galaxies (e.g. Paglione et al., 2001; Costagliola et al., 2011; Tan et al., 2011; Davis, 2014). With the help of gravitational lensing, which can greatly amplify the flux densities, isotopic lines at have now been measured in a few cases (Muller et al., 2006; Henkel et al., 2010; Danielson et al., 2013).
Isotopic abundances are difficult to derive from the measured molecular lines, especially for the 12C-bearing species, which are the most abundant and thus their transitions have the highest opacities. Observed line ratios do not translate directly to the abundance ratios –one needs to correct for the unknown optical depths. As a result, the 12C/13C and 16O/18O abundance ratios from the line ratios are often significantly underestimated. The most straightforward method to derive the optical depths and obtain the isotopic abundance ratios uses the line ratios between the optically thin double isotopologue (e.g. 13C18O) and a single isotopic molecular line (e.g. C18O) of the same quantum transition. However, should the isotopologue line (e.g., C18O) not be completely optically thin, would mean an underestimate of the derived 12C/13C abundance ratio. Moreover, the emission lines from the double isotopologues are so weak that it has only been possible to detect them in a few bright targets, even with the most sensitive radio telescopes (e.g. M 82, NGC 253; Martín et al., 2010). ALMA will improve this situation considerably, but a large survey of nearby normal galaxies, or high-redshift star-forming galaxies, will remain difficult, unless lensed objects are used in the later case.
A second method derives the abundance ratios using the absorption features of molecular isotopologues against strong radio continuum sources. This is perhaps the most accurate method to derive the column densities from the measured equivalent widths, as measured directly from the isotopologues. This method is also insensitive to distance and angular resolution. Its main drawback, however, is that a very strong background source is needed. Only the combination of galactic ISM in the line of sight to the brightest radio-loud quasars, or very strong continuum emission from the target itself, is adequate for such studies. This method has been used to measure the diffuse ISM in our Milky Way galaxy (e.g. Lucas & Liszt, 1996, 1998), local galaxies (e.g. González-Alfonso et al., 2012) and a few distant galaxies (e.g. Wiklind & Combes, 1995, 1996; Muller et al., 2014). Targets lending themselves to such studies are thin on the ground because of the rare configuration requirements. Optical observations of Damped Lyman- system (DLA) absorbers also present the ability to probe isotopologue ratios in high- objects (Levshakov et al., 2006; Noterdaeme et al., 2017).
A third method requires two steps, deriving the optical depths and the abundance ratios separately using the N-bearing molecular line. Most often, 13CN, 12CN and its hyperfine structure lines are observed, and the optical depth of 12CN is derived. Then the opacity-corrected 12CN is compared with the emission of 13CN, which is assumed to be optically thin. Their ratio yields the 12C/13C abundance ratio, which can be further converted to the 16O/18O ratio using observations of 13CO and C18O (e.g. Savage et al., 2002; Milam et al., 2005). However, this method relies on measurements of the CN molecule, which requires high-density conditions ( cm-3; Shirley, 2015) like those found in the dense cores of star-forming regions, where optical depths are also high. Furthermore, the assumption of an optically thin 13CO may not always hold, as with the first method.
A fourth method models the average gas physical conditions using multiple rotational transitions of the isotopologues and radiative transfer models based on the large velocity gradient (LVG) approximation (Scoville & Solomon, 1974; Goldreich & Kwan, 1974) or the mean-escape probability (MEP) approximation (Osterbrock, 1989; Curran et al., 2001). This allows an estimate of the optical depths of both the major and minor isotopologues, which allows the appropriate correction of the observed line ratios to get the abundance ratios. It is much easier to obtain multiple transitions of CO isotopologues rather than for other even rarer molecules. However, because of the degeneracy of the collisional coefficient between density and temperature, , the degeneracy between molecular abundances and other gas properties (e.g. average ) that set a given line optical depth, and the assumption of uniformly distributed physical conditions in studied regions, the uncertainty of the deduced abundance ratio can be considerable. Moreover, in the case of the CO/13CO (or CO/C18O) line ratio, the stronger radiative trapping expected for the much more abundant CO than for 13CO can also play some role in boosting their values in some galaxies in addition to enhanced global CO/13CO abundances in their ISM (e.g., Aalto et al., 1995).
In Table 1 we list the abundance ratios published in the literature. There are many detections of a single transition of 13CO in galaxies, both in their centres and in the off-nuclear arm/disc regions (e.g. Paglione et al., 2001; Tan et al., 2011; Davis, 2014). In this study, we adopt only the abundance ratios; we neglect the line ratios which, in principle, could be used to set the lower limits.
2.3 From isotopologue to isotope abundance ratios: the road is now clear
The first detections of isotopologue 13CO and C18O line emission in the Galaxy (Penzias et al., 1971) were soon followed by numerous detections of other, more distant galaxies (Encrenaz et al., 1979; Rickard & Blitz, 1985; Young & Sanders, 1986; Sage & Isbell, 1991; Wall et al., 1993; Aalto et al., 1995; Papadopoulos et al., 1996; Papadopoulos & Seaquist, 1998; Paglione et al., 2001). This facilitated the use of isotopologue abundance ratios as direct measures of isotope abundance ratios in the ISM of other galaxies (see Langer & Penzias, 1993, for Galactic studies of the 13CO, 12CO isotopologues). It was this new observational capability, and the discovery that 12CO/13CO intensity ratios are typically much larger in extreme merger/starburst galaxies than in ordinary star-forming spirals (Casoli et al., 1992; Henkel & Mauersberger, 1993; Henkel et al., 1993; Aalto et al., 1995; Papadopoulos & Seaquist, 1998) which triggered investigations into whether or not isotopologue abundance ratios translate directly to isotopic ratios (e.g. [12CO/13CO] = [12C/13C]).
Two astrochemical effects stand in the way of obtaining an isotope abundance ratio from the corresponding isotopologue abundance ratio, namely: 1) selective photodissociation of the rarer isotope (Casoli et al., 1992) and 2) isotope chemical fractionation (Langer et al., 1984; Röllig & Ossenkopf, 2013). The first operates in the far-ultraviolet (FUV)-illuminated, warm outer layers of molecular clouds (the so-called ‘photodissociation regions’, PDRs); the second operates in the cold, FUV-shielded inner regions of those molecular clouds. In past work selective photodissociation of 13CO with respect to 12CO has been investigated as the cause of the high 12CO/13CO intensity ratios in (ultra)luminous infrared galaxies [(U)LIRGs], but found unlikely for large masses of their molecular gas reservoirs (Casoli et al., 1992).
This can be shown for the metal-rich, high-pressure molecular gas reservoirs expected in merger/starbursts such local (U)LIRGs and distant submm-selected galaxies (SMGs). Indeed in such metal-rich environments it can be shown that the gas mass fraction expected to be in PDRs (the only gas that could be affected by selective photodissociation effects) is small, and thus can not perturb global isotopologue abundance ratios away from the elemental isotopic abundance ratios. Indeed, following the method developed in Papadopoulos et al. (2014, section 5.1, Equation 6),
| (1) |
where is the visual extinction corresponding to a transition (between Hi and H2) column density, is the dust cross section ratio for FUV and optical lights, is the H2 self-shielding fraction over the Hi/H2 transition layer, is the PDR radiation field, s-1 is the H2 dissociation rate, is the average gas density, s-1, and (solar) is the metallicity.
We find the PDR gas mass fraction per cloud to be –0.06 (H i+) for the metal-rich and high-pressure (and thus high-density) molecular gas of (U)LIRGs. Even for less extreme conditions, with cm-3, K, cm-3, we obtain –0.17, of which only around half will be molecular gas, and a smaller fraction still will be affected by selective photodissociation of the rarer isotopologues. These small gas mass fractions ensure that selective photodissociation cannot play a major role for the bulk of the molecular gas found in dust-enshrouded starbursts. Finally, the fact that cloud-volumetric heating processes such as cosmic rays (CRs) and/or X-rays rather than (cloud surface)-heating FUV photons of PDRs seem to be responsible for the average thermal state of molecular gas in LIRGs (e.g., Panuzzo et al., 2010; van der Werf et al., 2010; Papadopoulos et al., 2012; Indriolo et al., 2017), makes it even more unlikely that a FUV-driven isotopologue selective dissociation process affects much of their molecular gas mass reservoirs.
At the cold end, isotope fractionation operates via exothermic isotope-exchange chemical reactions whose -sensitivity lies in a range where molecular gas is found in ordinary spirals. Indeed, the three most important reactions behind the theory of 12C/13C fractionation are:
| (2) |
| (3) |
| (4) |
(Röllig & Ossenkopf, 2013; Tunnard et al., 2015, and references therein). The effects of isotope fractionation have recently been invoked to explain the isotopologue 13CO, 12CO and H13CN, H12CN line ratios observed in the (U)LIRG, NGC 6240 (Tunnard et al., 2015). However, this work did not consider the minimum set by the CR heating that is expected to be ubiquitous in the environments of starbursts, and argued that dense ( cm-3) and very cold ( K) gas comprises the most massive phase of in NGC 6240. At such low temperatures, isotopic fractionation can indeed operate (e.g. Röllig & Ossenkopf, 2013), but these conditions can only be found in dense gas cores, deep inside giant molecular clouds in the relatively quiescent Milky Way, with its low levels of average CR energy density.
Using figure 1 from Papadopoulos et al. (2011), we find –30 K is the minimum value set by CRs in FUV-shielded dense gas in (U)LIRGs, where CR energy densities are 100–500 that in the Galaxy and cm-3. This temperature can be higher still if turbulent gas heating and/or heating from IR-heated dust remains significant in such regions. Moreover, the discovery of high HCN() brightness temperatures in high-resolution ALMA maps of the (U)LIRG, Arp 220 (Project: 2015.1.00702S, PI: L. Barcos-Munoz), with –80 K sets a lower limit for in the dense, line-emitting HCN gas that is well above the regime where isotope fractionation can operate.
For NGC 6240, ALMA observations (Project: 2012.00077.S, PI: N. Scoville) give K at 70-pc spatial resolution; thus for its observed HCN() global brightness ratio of 0.18 it would be: K as the corresponding lower limit for the temperature of the dense gas. This is well above the temperature range where chemical fractionation can operate. On the other hand, the K found in NGC 6240 (Lisenfeld et al., 2000), and for a normal gas-to-dust mass ratio, there is no room for a significant mass of colder dust. Since in the bulk of the ISM (irrespective of whether the energetics are FUV- and/or CR-driven), a scenario involving large amounts of gas at low temperatures and high densities (where chemical fractionation can operate) is highly unlikely. We thus conclude that isotope chemical fractionation cannot operate for the bulk of the molecular gas in star-forming galaxies.
Thus the road is now clear to use global isotopologue abundance ratios to obtain the corresponding average isotope abundance ratios in the ISM of galaxies. Nevertheless, serious uncertainties remain, associated with the radiative transfer modeling of molecular line emission. Indeed, careful radiative transfer modeling is needed to obtain the range of isotopologue abundance ratios, such as [12CO/13CO], from multi- 12CO and 13CO emission line observations. Even when multiple lines are available, degeneracies still remain (e.g. Papadopoulos et al., 2014). Better angular resolution is also needed to resolve the local variation of the isotopologue line ratios, which can be resolved easily with ALMA now (e.g., Jiménez-Donaire et al., 2017). In the age of ALMA, with its extraordinary sensitivity, angular resolution and flexible, wide-band correlator, simultaneous isotopologue line observations will allow such degeneracies to be considerably reduced. Moreover, using multi- and multi-species isotopologue line observations to determine a single isotope ratio (e.g. 12CO, 13CO and H12CN, H13CN lines to determine 12C/13C – Paglione et al., 1997) will further reduce the model degeneracies.
3 Chemical evolution models
| Model | LIMS | Super-AGB stars | Massive stars | Novae |
|---|---|---|---|---|
| 1 | Karakas (2010) | – | Nomoto et al. (2013) | No |
| 2 | Karakas (2010) | Doherty et al. (2014a,b) | Nomoto et al. (2013) | No |
| 3 | Karakas (2010) | – | Meynet & Maeder (2002b), Hirschi et al. (2005), Hirschi (2007), Ekström et al. (2008) | No |
| 4 | Karakas (2010) | Doherty et al. (2014a,b) | Meynet & Maeder (2002b), Hirschi et al. (2005), Hirschi (2007), Ekström et al. (2008) | No |
| 5 | Karakas (2010) | Doherty et al. (2014a,b) | Nomoto et al. (2013) | Yes |
The chemical evolution model for the Milky Way used in this study was established in a series of papers (Chiappini et al. 1997, 2001; Romano et al. 2000, 2010; Spitoni et al. 2015; see also Matteucci & Greggio 1986; Matteucci & François 1989) to which we refer the reader for a thorough discussion of the adopted formalism, the basic equations and the assumptions. It is a multi-zone model, where the Galactic disc is divided in several concentric annuli that evolve at different rates; this ensures the establishment of a Galactic abundance gradient.
For the other galaxies, we run simpler single-zone models. We do not aim to reproduce the CNO isotopic data available for each specific object; rather, we seek to give a broad overview of how the CNO isotopic ratios are expected to evolve in systems with different star-formation histories and/or stellar IMFs. In these models, fresh gas is accreted according to an exponentially-decreasing law, d/d –where is the total mass accreted and is the infall timescale– and turned into stars following a Kennicutt-Schmidt relation, , where is the star-formation efficiency and is the mass of neutral gas (Schmidt, 1959; Kennicutt, 1998). The free parameters, and , are set to different values in order to frame different evolutionary paths. A more detailed description of the adopted formalism can be found in section 3.1 of Romano et al. (2015).
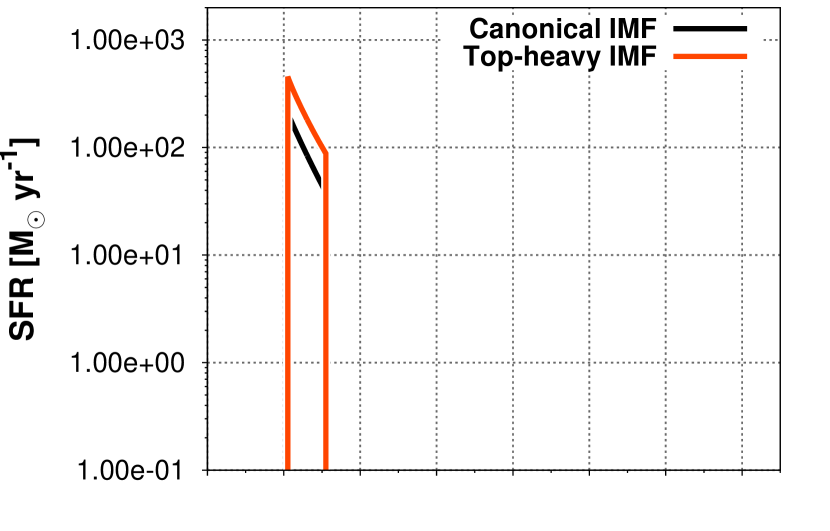
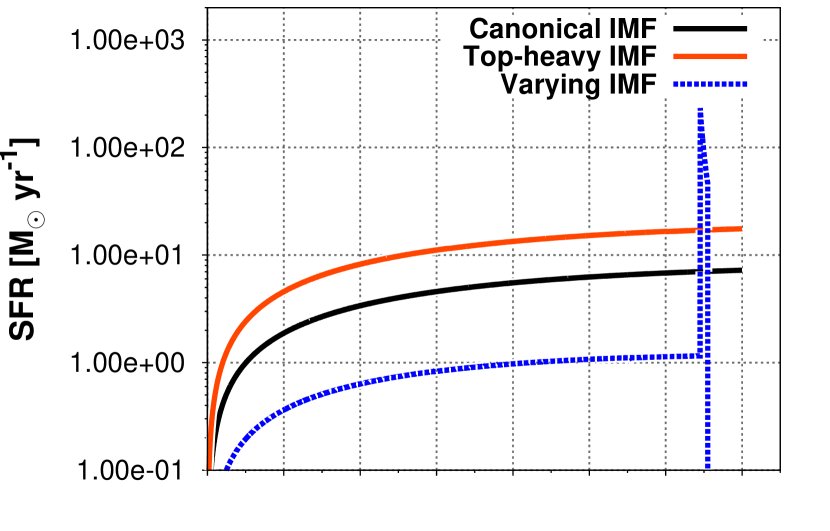
Specifically, we consider: (i) a template for massive systems ( M⊙, M⊙) that accrete gas rapidly ( Gyr) and experience powerful starbursts (–2 Gyr-1) at high redshift, followed by passive evolution thereafter111These objects would appear as sub-mm galaxies (SMGs; e.g. Smail et al., 1997) at redshifts –3 and as ‘red and dead’ massive ellipticals at (see, e.g., Toft et al., 2014).; (ii) a template for massive spirals ( M⊙, M⊙) that accrete gas slowly ( Gyr) and experience steady star formation (–0.1 Gyr-1) over a Hubble time; (iii) a model similar to the latter, but for galaxies of lower mass ( M⊙, M⊙) where secular evolution is followed suddenly by an extremely efficient ( Gyr-1) burst of star formation. The star-formation histories of these systems are shown in the top panels of Fig. 7, for different choices of the stellar IMF (see next paragraph; see also discussion in §4.2).
The probability that a newly born star has an initial mass within a given mass range is given by the Kroupa (2002) IMF, with a slope for high masses, normalised to unity in the 0.1–100-M⊙ range. For the starbursts, we also investigate the effects of an IMF skewed toward high masses ( in the high-mass regime), similar to the one proposed by Ballero et al. (2007) for the Galactic bulge.
All our computations avoid the instantaneous recycling approximation by detailed accounting of the finite stellar lifetimes. This is a necessary prerequisite for a proper treatment of elements that are produced on different timescales by stars of different initial masses and chemical compositions. The nucleosynthetic outcomes of binary stars exploding as type Ia supernovae (SNe Ia) and novae are included in our computations, adopting the single-degenerate scenario for their progenitors (Matteucci & Recchi, 2001, and references therein) for SNe Ia and our previous work (Romano et al. 1999, 2001; based on D’Antona & Matteucci 1991) for novae. Since CNO elements are produced in negligible amounts in SN Ia explosions (Iwamoto et al., 1999), the exact choice of the route leading to such events does not affect the results presented in this paper. Classical novae, instead, are thought to significantly overproduce 13C, 15N and 17O with respect to their solar abundances (e.g. José & Hernanz, 2007) making assumptions about their precursors a much more thorny problem (see next section).
The adopted nucleosynthesis prescriptions are summarised in Table 2. The stellar yields for low- and intermediate-mass stars are from Karakas (2010). For massive stars, we adopt the grid of yields suggested by Nomoto et al. (2013, Models 1, 2 and 5). However, since the important effects of stellar rotation are not accounted for in this case, we also consider the grid of CNO yields from fast-rotating massive stars provided by the Geneva group (Meynet & Maeder, 2002b; Hirschi et al., 2005; Hirschi, 2007; Ekström et al., 2008, Models 3 and 4). Detailed yields for super-AGB stars (Doherty et al., 2014a, b) –often neglected in chemical evolution studies– are implemented in Models 2, 4 and 5, while nova nucleosynthesis –also disregarded in most studies– is included in one case (Model 5). All the adopted yields for single stars are dependent on mass and metallicity. For novae, we assume average yields, independent of mass and metallicity (see discussion in §4.1). The different sets of yields were all tested against the Milky Way data, while only the set labeled ‘1’ was used in the models for the other galaxies.
4 Results
4.1 Milky Way galaxy
In this section, we present the results of our chemical evolution models for the Milky Way. These models differ in their adopted nucleosynthesis prescriptions (see Table 2). First, we discuss the predictions of Models 1, 2, 3 and 4, where the CNO elements come only from single stars. We then analyse the results of Model 5, which includes CNO production during nova outbursts.
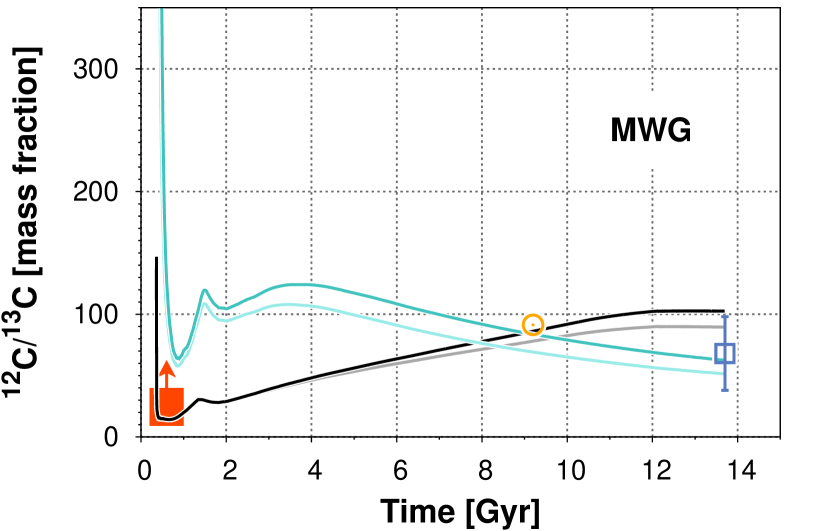
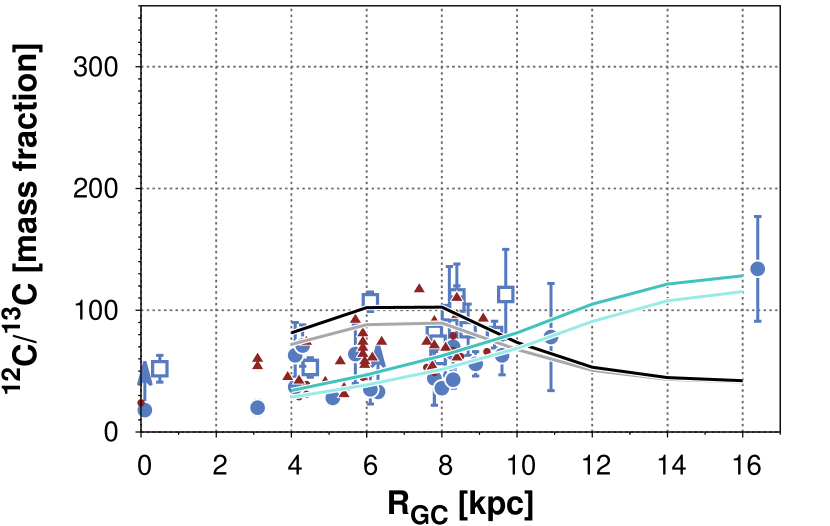
Fig. 1 shows the evolution of the carbon isotope ratio in the solar neighbourhood (left panel) and its current behaviour across the Milky Way disc (right panel) predicted by Models 1 (green lines), 2 (light green lines), 3 (black lines) and 4 (grey lines). Models 1 and 3, which do not include the contribution to C synthesis from super-AGB stars, successfully reproduce the solar data (Ayres et al., 2013); adding the super-AGB star contribution, the solar 12C/13C ratio is slightly underestimated (Models 2 and 4). However, one must be aware that the Sun probably moved to its current position from a birthplace closer to the Galactic centre (Wielen et al., 1996) and its chemical composition may not quite reflect that of the local ISM 4.5 Gyr ago. All the models predict current 12C/13C ratios in the solar neighbourhood that agree with the average local ISM value (Milam et al., 2005), within the errors. Furthermore, Models 3 and 4, assuming CNO yields from fast-rotating massive stars, can account for the range of carbon isotope ratios of ‘unmixed’ halo stars (i.e. giant stars in which the mixing with the deep layers affecting the original CNO abundances is not expected to have occurred; Spite et al., 2006). This result was already discussed by Chiappini et al. (2008), who stressed the important role played by fast rotators as ISM enrichers at low metallicities. When looking at the C isotope ratio as a function of the distance from the Galactic centre, , however, we find that Models 1 and 2 without fast rotators perform better. They predict an increasing trend of the ratio with increasing Galactocentric distance, as is indeed observed (Wilson & Rood, 1994; Boogert et al., 2000; Savage et al., 2002; Milam et al., 2005), whilst Models 3 and 4 predict a decrease in the 8–12-kpc Galactocentric distance range, followed by a flattening at the outermost radii. In order to explain the 12C/13C ratios of both halo stars and molecular clouds, we conclude that fast rotating massive stars must be common in the early Universe, but must become rarer when the metallicity exceeds dex. In our model, this metallicity threshold is reached only 40 Myr after the star formation begins, during the halo phase.

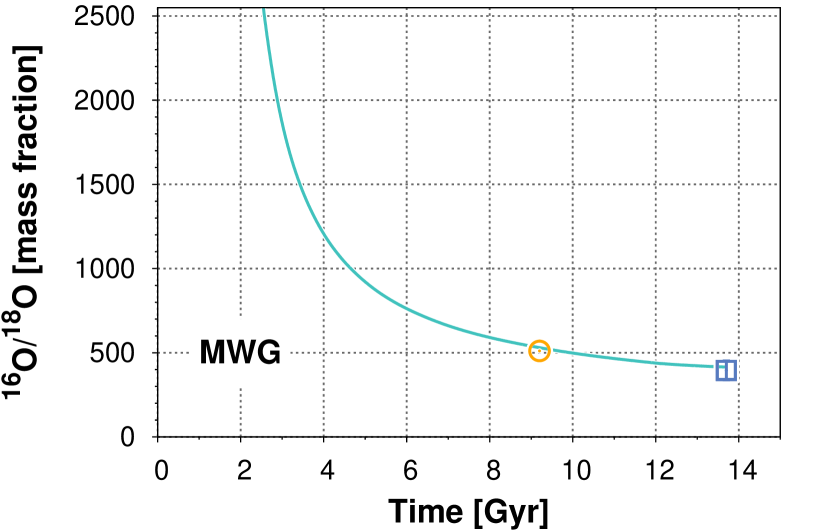
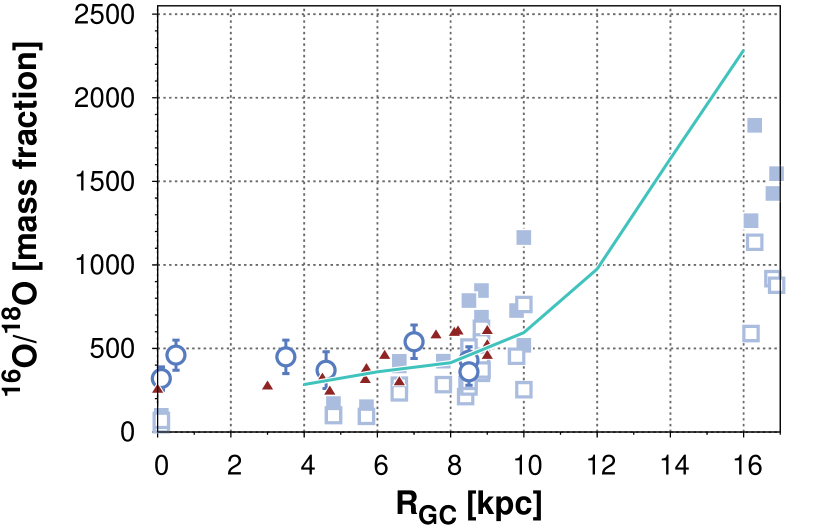
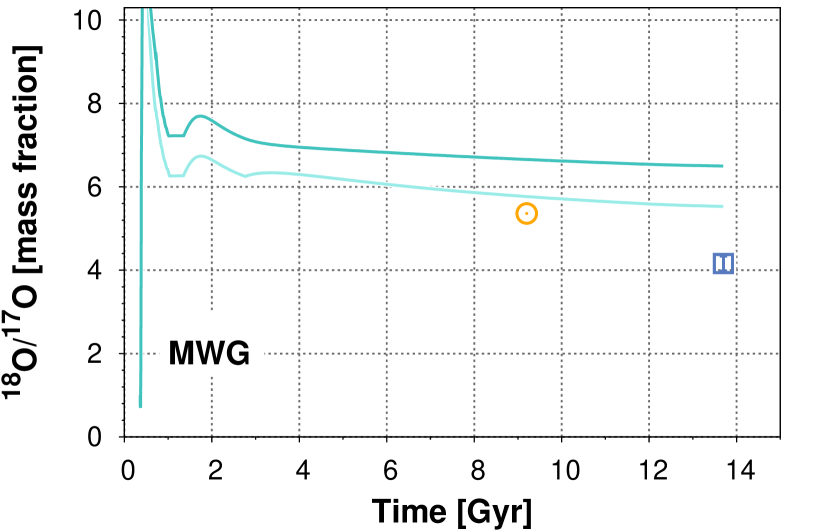
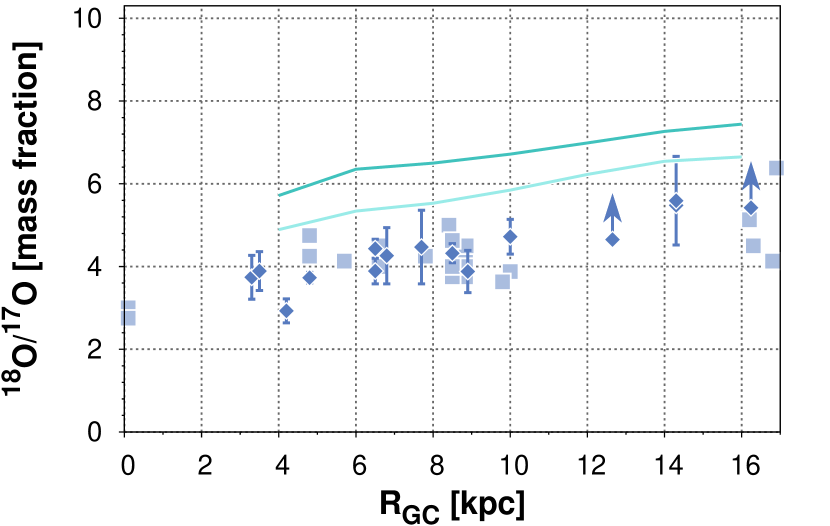
Models 1 and 2 also reproduce the 16O/18O ratios measured in the Sun (Ayres et al., 2013) and along the Galactic disc (Wilson & Rood, 1994; Polehampton et al., 2005; Wouterloot et al., 2008, the latter in combination with the 12C/13C gradient of Milam et al. 2015) with the possible exception of the outermost regions (see Fig. 2, left and right panels, respectively). In the plots, Model 2 predictions are hidden behind those of Model 1 (which is expected since the two differ only in the treatment of super-AGB stars, while 16O and 18O are synthesised mostly in massive stars). The shortcomings of the models for kpc might be due to insufficient 18O production from low-metallicity ( dex) stellar models. The 18O/17O ratios, on the other hand, are severely overestimated, even when considering the significant contribution to 17O synthesis from super-AGB stars (Fig. 3). This may indicate the need for additional 17O factories, that we naturally seek in nova systems. Novae are also thought to be powerful 15N producers on a galactic scale.
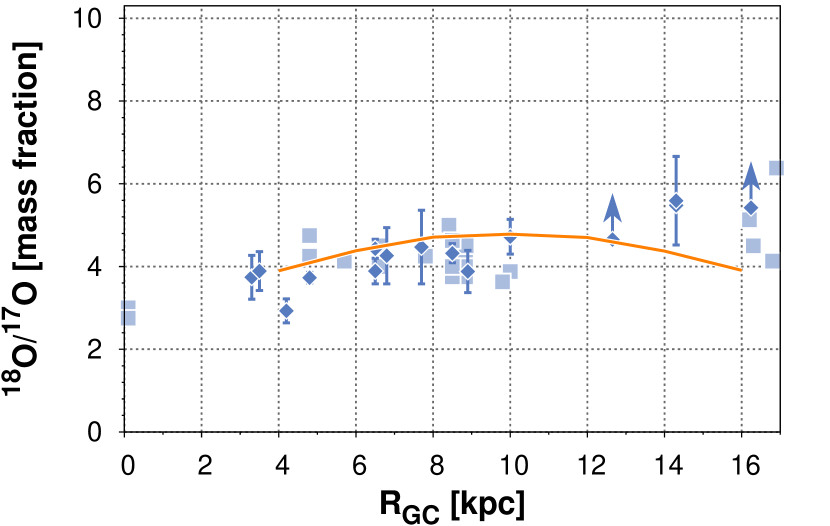
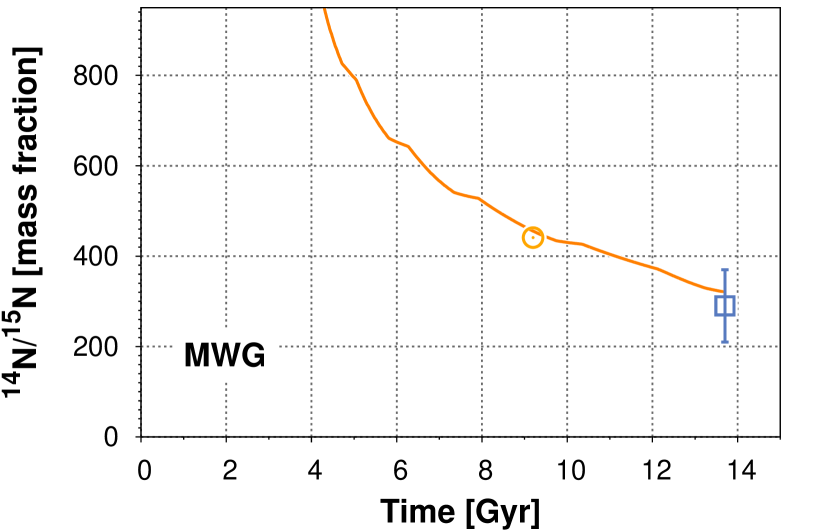
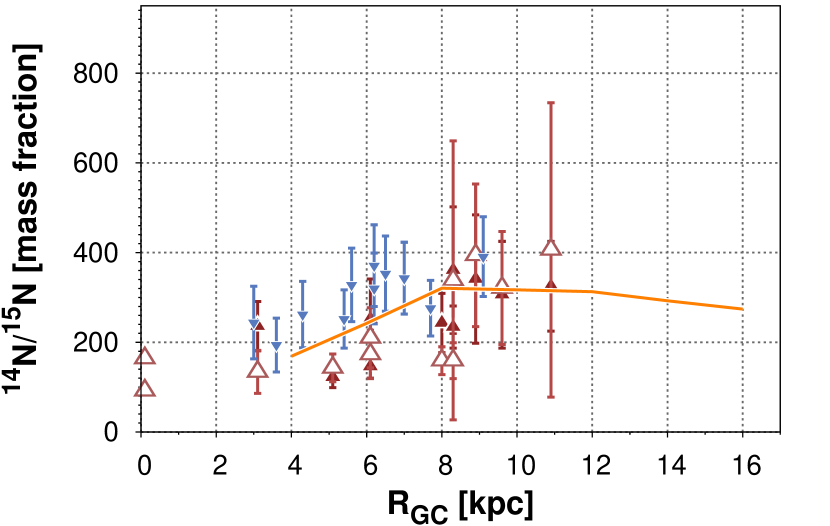
In Model 5 we have added a contribution to the CNO synthesis from novae. The left-hand panels of Figs 4 and 5 show, respectively, the evolution of the 18O/17O and 14N/15N ratios in the solar neighbourhood; the radial behaviour of the same ratios at the present time are depicted in the right-hand panels. Model 5 predictions (orange full lines) are compared to the relevant observations. The solar 18O/17O ratio (Ayres et al., 2013) can be explained by Model 5, which also fits the measurements across the disc (the lower-than-observed 18O/17O ratios predicted by the model for 12 kpc likely arise from insufficient 18O production from low-metallicity massive stars, rather than from over-synthesis of 17O in nova outbursts –see the discussion in the previous paragraph). The model convincingly matches the nitrogen isotope ratios measured in solar wind ion samples by the Genesis spacecraft (Marty et al., 2011), in molecular clouds in the local ISM, and across the whole Galactic disc (Adande & Ziurys, 2012). The flattening of the theoretical 14N/15N gradient for kpc is due to the absence of a substantial primary 14N component in the adopted yields for massive stars (Nomoto et al., 2013). While the need for significant primary 14N production from low-metallicity massive stars has been recognized for a long time (see e.g. Matteucci, 1986, and references therein), more data are needed in order to assess the shape of the 14N/15N gradient at large Galactic radii, kpc, which would place important and independent constraints on the amount of primary nitrogen produced by massive stars in low-metallicity environments.
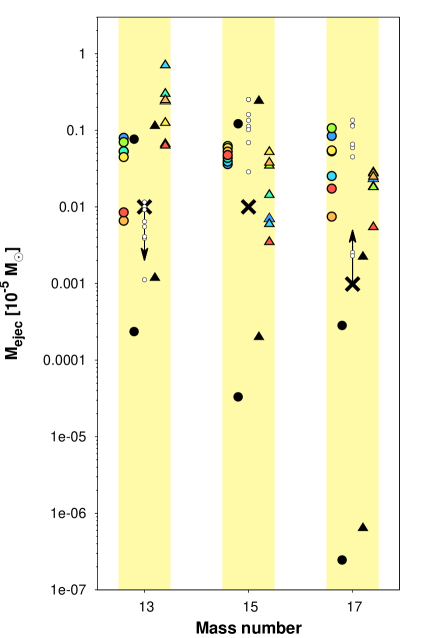
Only a few attempts have been made to include novae as additional CNO sources in Galactic chemical evolution models, even though allowing CNO production only from single stars fails to reproduce at least some of the CNO isotope abundance data available for the Milky Way (e.g. Romano & Matteucci, 2003; Kobayashi et al., 2011). This reluctance is partly driven by the ill-constrained parameters that describe the evolution of the close, mass-transferring binary systems that lead to classical nova outbursts. Over the last 45 years, however, hydrodynamic simulations of nova outbursts by different groups –using different codes and reaction rate libraries, and spanning different ranges of white dwarf masses and initial luminosities, mass-transfer rates from the main-sequence companions and mixing levels between the accreted envelope and the underlying white dwarf core– have generally found ejecta enriched in 13C, 15N and 17O at a level that would significantly impact Galactic evolution (see José, 2012, for a recent review). In Fig. 6, we show the masses ejected in the form of 13C, 15N and 17O from nova models for CO (triangles) and ONe (circles) white dwarfs. Coloured symbols refer to models (José & Hernanz, 1998) for different white dwarf masses and degrees of mixing between core and envelope, but fixed white dwarf luminosity and mass-accretion rate. The black symbols represent models for different masses and mass-transfer rates, but fixed white dwarf temperature from Yaron et al. (2005, their table 6). The small empty circles refer to simulations of 1.25-M⊙ white dwarfs and 1.35-M⊙ white dwarfs using the same initial conditions but four different reaction-rate libraries for each mass (Starrfield et al., 2009). It is evident that the mass ejected in the form of a given element in one outburst may vary by several orders of magnitude, depending on the specific combination of parameters which produces the eruption.
Following Romano et al. (1999, and references therein), in Model 5 the birthrate of binary systems with the characteristics necessary to give rise to nova eruptions is computed as a fraction of the white dwarf formation rate222This computation takes into account a delay time of 1 Gyr, to ensure that the white dwarfs have cooled enough to lead to strong nova outbursts.. The value of is fixed so as to have a current Galactic nova outburst rate of 20 yr-1, consistent with the observed rate (20–34 yr-1; Della Valle & Livio 1994). Computation of the theoretical nova outburst rate involves some knowledge of the average number of outbursts that a typical nova system is expected to experience; we take this number to be (Bath & Shaviv, 1978). The average masses ejected in the form of 13C, 15N and 17O in a single eruption are fixed by the requirement of reproducing the observations of the CNO isotope ratios in the Milky Way. We find that the ejection of M⊙ of 15N and M⊙ of 17O in a single outburst leads to agreement between model and data. However, if current 18O yields from massive stars are underestimated, the latter quantity should be regarded as a lower limit. In fact, in this case novae should eject even higher amounts of 17O to compensate for the increased 18O production from massive stars. Now regarding 13C, we can only set an upper limit of M⊙ per event, above which the predictions of Model 5 deviate significantly from measurements of 12C/13C ratios in the Galaxy. Our empirically determined nova yields are shown as signs in Fig. 6.
4.2 Other galaxies
|
 |
|
 |
 |
 |
In this section, we deal with the interpretation of 12C/13C and 16O/18O ratios in other galaxies found using isotopologue line intensities available from the literature; we do not consider objects for which only lower limits are provided (see §2.2 and Table 1). In particular, we are interested in starburst galaxies, where the conditions of star formation differ from those typical in the local Universe (Papadopoulos 2010), and which may result in a top-heavy (flatter) IMF. As we will see, varying the IMF dramatically affects our predictions for CNO isotope evolution.
Already, 25 years ago, Faber et al. (1992) and Worthey et al. (1992) speculated that IMF variations could be responsible for the -element overabundance inferred from measurements of Fe and Mg indices in their sample of elliptical galaxies: an IMF favouring more massive stars in more massive galaxies naturally leads to an overproduction of Mg (which is produced mostly by massive stars on short timescales) with respect to Fe (produced mostly by type Ia SNe with low-mass progenitors on longer timescales) in larger systems, as observed (see also Matteucci & Tornambè, 1987). However, they also stressed that differences in star-formation timescales and/or selective galactic winds could act in the same way, thereby leaving the issue of IMF variations unsettled (see also Matteucci, 1994). Nowadays, there is compelling observational evidence against the notion of a universal IMF (see e.g. the review in Weidner et al., 2013).
On the theoretical side, it has been suggested that when the SFR on a galactic scale exceeds 10 M⊙ yr-1, stars form in more massive and denser clusters, characterised by IMFs flatter than the canonical one; consequently, the galaxy-wide IMF also becomes top heavy (Weidner et al., 2004; Weidner et al., 2013; Marks et al., 2012). Such IMF variations lead to significant effects on many galaxy properties, ranging from the inferred stellar masses and SFRs (e.g. Clauwens et al., 2016) to the detailed chemical composition of the galaxy constituents (e.g. Recchi et al., 2009).
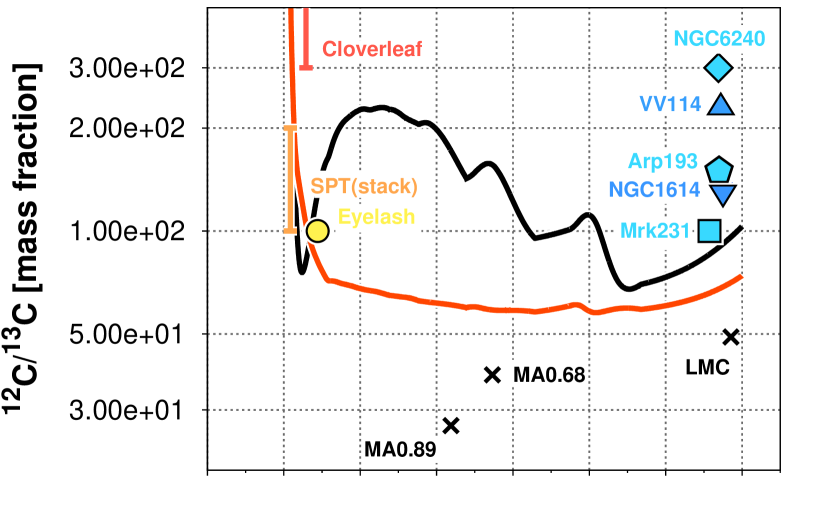
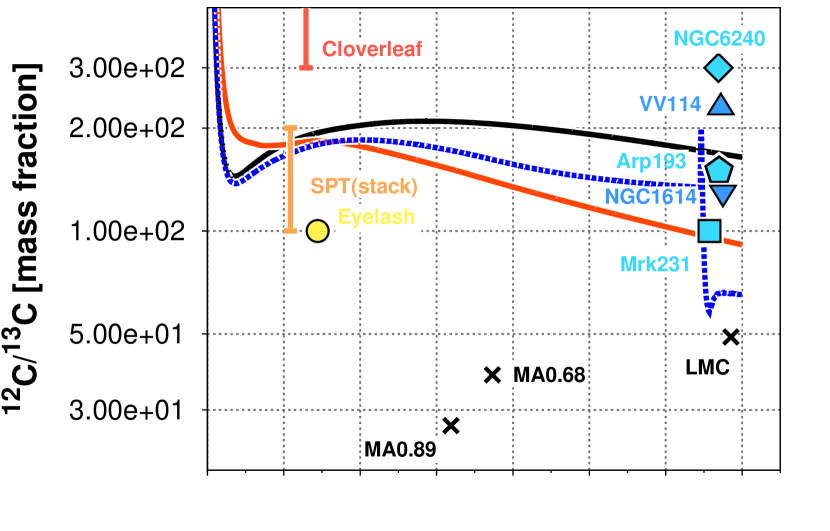
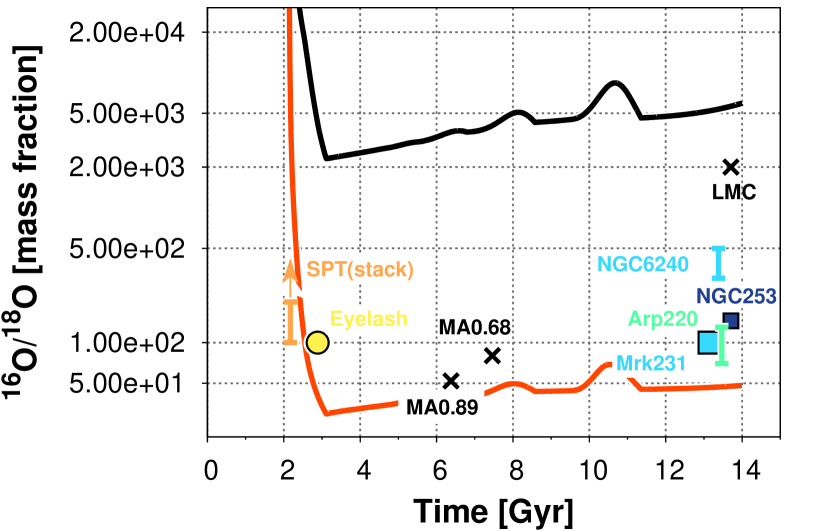
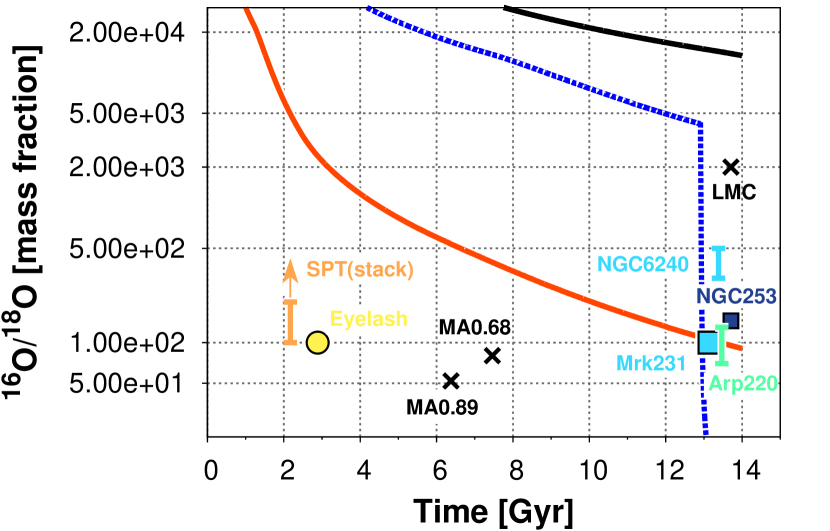
Being the ratios of primary to secondary elements, the 12C/13C and 16O/18O isotope ratios are expected to show a pronounced dependence on the IMF slope33313C has both a primary and a secondary nucleosynthetic component.. In the middle and lower panels of Fig. 7 we show, respectively, the evolution of the 12C/13C and 16O/18O ratios predicted by our models, for different assumptions about the mass assembly and star-formation history (see §3 and Fig. 7, upper panels), as well as the stellar IMF. The left panels of Fig. 7 refer to template galaxies that suffer an intense burst of star formation at high redshift, then evolve passively thereafter, whereas the right panels show the predictions for systems that experience secular evolution, followed by a late starburst in one case. In all panels, the black curves refer to models adopting a canonical IMF (Kroupa, 2002, with for the high masses), while the red ones are for models with a top-heavy IMF (Ballero et al., 2007, with in the high-mass regime). The blue dashed lines (right panels only) refer to a template galaxy that forms stars according to a canonical IMF during most of its lifetime, with a sudden burst of star formation initiated later, inducing a top-heavy IMF during the burst. The nucleosynthesis prescriptions are the same as in Model 1 for the Galaxy, benchmarked by its good reproduction of the 12C/13C and 16O/18O data for the Milky Way. The data for the galaxies listed in Table 1 (detections only) are displayed as symbols and bars, and are colour-coded according to the intensity of the star formation on a rainbow scale where red and blue stand for higher and lower rates, respectively.
The models on the left ( M⊙) convert gas into stars at high redshift (–3), in relatively brief ( Gyr) but extremely powerful starbursts (–450 M⊙ yr-1, for the top-heavy IMF; –200 M⊙ yr-1, for the canonical IMF). The differences in the SFR are dictated by the requirement that, when the star-formation activity ceases, a stellar mass of M⊙ must be in place, independently of the choice of the IMF (see figure 2 in Durkalec et al., 2015, for a relation between the stellar mass and the halo mass ). The modeled galaxies are expected to show up as SMGs at high redshifts; indeed, the theoretical 12C/13C and 16O/18O ratios compare well with observational estimates of these ratios in high-redshift dusty, star-forming galaxies (Henkel et al., 2010; Danielson et al., 2013; Spilker et al., 2014).
In the starburst scenario we see a large variation of the 12C/13C abundance ratio for the regular IMF, with this ratio remaining significantly higher than for the top-heavy IMF over a period of 3–10 Gyr. This is caused by the later release of large amounts of 13C by intermediate-mass stars (4 M 7), and the much lower numbers of such stars in the case of a top-heavy IMF, where most of the 13C injected into a galaxy’s ISM occurs soon, from fast-evolving high-mass stars. This demonstrates the need for good chemical evolution models that avoid instantaneous element releases, and incorporate the stellar-physics driven timescales for the release of the various isotopes.
Nevertheless the global 12C/13C abundance ratio does settle to very similar values for both types of IMF after a period of Gyr. Here it is worth emphasising that while the final anticipated global 12C/13C ratio seems rather insensitive to the underlying stellar IMF, values of 16O/18O as low as 100 found in the ‘Cosmic Eyelash’ (Swinbank et al., 2010; Danielson et al., 2013) and, possibly, in the stacked SMG spectrum in Spilker et al. (2014), are reached only by an IMF skewed towards massive stars (Fig. 7, lower left panel). This conclusion is invariant of the assumed star-formation history; in particular, we tested the case of a constant or increasing SFR with time, as well as a regime consisting of successive bursts separated by quiescent periods.
According to our computations, values of 12C/13C as high as 300 –or even higher measured toward the Cloverleaf quasar (Henkel et al., 2010)– indicate that the host galaxy is caught in a very early evolutionary phase, no later that Myr from the beginning of the star-formation episode; concordant with this dating, we predict that measurements of the globally-averaged 16O/18O ratio in the Cloverleaf should yield values in excess of 2,000.
In the right-hand panels of Fig. 7 we show the predictions of our models for smaller galaxies (– M⊙, – M⊙) that experience a quieter, continuous star formation; in the case of the model for the lowest mass, the evolution ends after a short ( Myr), vigorous starburst ( M⊙ yr-1). As we already found for the high-redshift systems, it is immediately apparent that the 12C/13C and 16O/18O isotopic ratios for the low-redshift starbursts can be reproduced simultaneously only by assuming a top-heavy IMF. A canonical IMF leads to 16O/18O ratios that are higher than observed (Fig. 7, lower right panel, black solid line). However, if the secular evolution –in which the stellar masses are distributed according to a canonical IMF– is followed by a burst of star formation with a flatter IMF, the 16O/18O ratio tends to values in agreement with those observed (Fig. 7, lower right panel, blue dashed line). In the local Universe such a sequence of galaxy evolution events could be mirrored by two gas-rich spirals evolving in isolation, before they merge inducing a strong merger/starburst late in their histories. This could indeed be the story behind local gas-rich starbursts, which makes the comparison of their global isotopologue ratios with the predictions of our ‘starburst model’ appropriate.
Finally, while a detailed analysis of the data available for local starbursts is beyond the scope of the present paper, it is worth noticing that our ‘starburst model’ predicts 12C/13C and 16O/18O ratios that span almost the full range of values covered by observations of local systems. Nevertheless, regardless of the details of the underlying star-formation scenario, a top-heavy IMF seems necessary for building some part of their eventual stellar mass, with the low 16O/18O abundance ratios proving decisive. The fact that such ratios have been implied for many years, even for isolated (but vigorously star-forming) spiral galaxies (e.g., Papadopoulos et al., 1996), but nevertheless could not be attributed uniquely to a top-heavy IMF, underscores the value of good CNO evolutionary models in setting such important constraints.
5 Conclusions
In this paper, we use state-of-the-art chemical evolution models to track the evolution of CNO isotopes in the ISM of galaxies. We take advantage of recently published stellar yields, as well as new isotopologue molecular line data for the Milky Way and many other galaxies. First, we use a multi-zone model for the Milky Way to re-assess the relative roles that AGB stars, massive stars, and novae have in the production of the CNO elements, focusing on the rare isotopes. We find that:
-
1.
In order to reproduce the 12C/13C ratios observed in both nearby halo stars and molecular clouds spanning a large range of Galactocentric distances, fast-rotating massive stars must be common in the early Universe, and become rarer when a metallicity threshold of dex is reached; this happens very early on in our model, about 40 Myr after the beginning of the star formation in the halo phase.
-
2.
Super-AGB stars synthesise significant amounts of 17O; yet, in order to bring the theoretical predictions for the 18O/17O ratio into agreement with the relevant Galactic data, one also needs to consider a contribution to 17O synthesis from novae.
-
3.
Novae are basic producers of 15N; taking their contribution into account, we are able to reproduce both the declining trend of 14N/15N in the solar neighbourhood suggested by recent determinations of this ratio for the protosolar nebula (Marty et al., 2011) and the 14N/15N Galactic gradient recently revised by Adande & Ziurys (2012). Hydrogen ingestion into the helium shell of core-collapse supernovae has been suggested as an additional source of the rare 15N isotope by Pignatari et al. (2015) who, however, do not provide a full grid of yields for use in chemical evolution models. This prevents us from testing their interesting proposal by means of our models.
-
4.
By assuming yields from Karakas (2010) for low- and intermediate-mass stars, from Nomoto et al. (2013) for massive stars, and average ejected masses of M⊙, M⊙ and M⊙ per nova outburst, we find excellent agreement between most of our model predictions and the Milky Way CNO data; the model could be further constrained and improved when new data on the Galactic gradient at large radii become available.
Furthermore, we show that as far as galaxy-averaged abundance ratios are concerned, neither FUV-driven selective photodissociation nor chemical fractionation can seriously ‘skew’ isotopologue ratios away from isotopic ones. Then after selecting the best set of yields, we use single-zone models for other galaxies to investigate qualitatively the dependence of the 12C/13C and 16O/18O ratios on the star-formation history and stellar IMF. By comparing the model predictions to observations of isotopologue (and thus isotopic) abundance ratios for the molecular gas reservoirs of high- and low-redshift starbursts, we conclude that:
-
1.
In order to explain simultaneously the measurements of 12C/13C and 16O/18O ratios in starbursts, an IMF skewed towards high stellar masses is needed; this requirement is driven by the higher-than-observed 16O/18O ratios obtained with a canonical IMF, whilst the final 12C/13C ratio is not dramatically affected by the choice of the IMF.
-
2.
The high 12C/13C ratios observed in some systems imply that either the galaxy is caught in its very early phases of evolution or, alternatively, that it is being ‘rejuvenated’ by a starburst that has erased the memory of the preceding evolution and reset the 12C/13C ratio to a high value; this, however, is possible only if the IMF becomes top-heavy during the starburst.
-
3.
For the host of the Cloverleaf quasar, at , given the observational estimate of 300–10,000 for the 12C/13C ratio, we predict that a value of 16O/18O in excess of 2,000 should be found.
-
4.
Changing the details of the CNO isotope evolution, or the assumptions about the histories of mass assembly and star formation does not affect the main conclusion that a top-heavy IMF is needed in starbursts.
In closing, we re-iterate how important these issues are for galaxy evolution, with ALMA now able to provide the data necessary to re-examine them, in the context of the concurrent CNO isotope evolution models, which can then give us the ages of starburst events and the prevailing stellar IMFs across cosmic time.
Acknowledgements
This research was supported by the Munich Institute for Astro- and Particle Physics (MIAPP) of the DFG cluster of excellence “Origin and Structure of the Universe”. This work also benefited from the International Space Science Institute (ISSI) in Bern, thanks to the funding of the team “The Formation and Evolution of the Galactic Halo” (PI D. Romano). PPP is supported by an Ernest Rutherford Fellowship. RJI and ZYZ acknowledge support from ERC in the form of the Advanced Investigator Programme, 321302, COSMICISM.
References
- Aalto et al. (1995) Aalto S., Booth R. S., Black J. H., Johansson L. E. B., 1995, A&A, 300, 369
- Adande & Ziurys (2012) Adande G. R., Ziurys L. M., 2012, ApJ, 744, 194
- Akerman et al. (2004) Akerman C. J., Carigi L., Nissen P. E., Pettini M., Asplund M., 2004, A&A, 414, 931
- Audouze et al. (1975) Audouze J., Lequeux J., Vigroux L., 1975, A&A, 43, 71
- Ayres et al. (2013) Ayres T. R., Lyons J. R., Ludwig H.-G., Caffau E., Wedemeyer-Böhm S., 2013, ApJ, 765, 46
- Ballero et al. (2007) Ballero S. K., Matteucci F., Origlia L., Rich R. M., 2007, A&A, 467, 123
- Bath & Shaviv (1978) Bath G. T., Shaviv G., 1978, MNRAS, 183, 515
- Boesgaard (1968) Boesgaard A. M., 1968, ApJ, 154, 185
- Boogert et al. (2000) Boogert A. C. A., et al., 2000, A&A, 353, 349
- Burbidge et al. (1957) Burbidge E. M., Burbidge G. R., Fowler W. A., Hoyle F., 1957, Reviews of Modern Physics, 29, 547
- Casoli et al. (1992) Casoli F., Dupraz C., Combes F., 1992, A&A, 264, 55
- Cayrel et al. (2007) Cayrel R., et al., 2007, A&A, 473, L37
- Charbonnel (1994) Charbonnel C., 1994, A&A, 282, 811
- Charbonnel & Zahn (2007) Charbonnel C., Zahn J.-P., 2007, A&A, 467, L15
- Chiappini et al. (1997) Chiappini C., Matteucci F., Gratton R., 1997, ApJ, 477, 765
- Chiappini et al. (2001) Chiappini C., Matteucci F., Romano D., 2001, ApJ, 554, 1044
- Chiappini et al. (2006) Chiappini C., Hirschi R., Meynet G., Ekström S., Maeder A., Matteucci F., 2006, A&A, 449, L27
- Chiappini et al. (2008) Chiappini C., Ekström S., Meynet G., Hirschi R., Maeder A., Charbonnel C., 2008, A&A, 479, L9
- Clauwens et al. (2016) Clauwens B., Schaye J., Franx M., 2016, MNRAS, 462, 2832
- Clayton & Nittler (2004) Clayton D. D., Nittler L. R., 2004, ARA&A, 42, 39
- Costagliola et al. (2011) Costagliola F., et al., 2011, A&A, 528, A30
- Costagliola et al. (2015) Costagliola F., et al., 2015, A&A, 582, A91
- Curran et al. (2001) Curran S. J., Johansson L. E. B., Bergman P., Heikkilä A., Aalto S., 2001, A&A, 367, 457
- Cyburt et al. (2016) Cyburt R. H., Fields B. D., Olive K. A., Yeh T.-H., 2016, Reviews of Modern Physics, 88, 015004
- D’Antona & Matteucci (1991) D’Antona F., Matteucci F., 1991, A&A, 248, 62
- Dahmen et al. (1995) Dahmen G., Wilson T. L., Matteucci F., 1995, A&A, 295, 194
- Danielson et al. (2011) Danielson A. L. R., et al., 2011, MNRAS, 410, 1687
- Danielson et al. (2013) Danielson A. L. R., et al., 2013, MNRAS, 436, 2793
- Davis (2014) Davis T. A., 2014, MNRAS, 445, 2378
- Dearborn et al. (1978) Dearborn D., Tinsley B. M., Schramm D. N., 1978, ApJ, 223, 557
- Della Valle & Livio (1994) Della Valle M., Livio M., 1994, A&A, 286, 786
- Doherty et al. (2014a) Doherty C. L., Gil-Pons P., Lau H. H. B., Lattanzio J. C., Siess L., 2014a, MNRAS, 437, 195
- Doherty et al. (2014b) Doherty C. L., Gil-Pons P., Lau H. H. B., Lattanzio J. C., Siess L., Campbell S. W., 2014b, MNRAS, 441, 582
- Durkalec et al. (2015) Durkalec A., et al., 2015, A&A, 576, L7
- Edmunds & Pagel (1978) Edmunds M. G., Pagel B. E. J., 1978, MNRAS, 185, 77
- Ekström et al. (2008) Ekström S., Meynet G., Chiappini C., Hirschi R., Maeder A., 2008, A&A, 489, 685
- Elbaz et al. (2011) Elbaz D., et al., 2011, A&A, 533, A119
- Encrenaz et al. (1979) Encrenaz P. J., Stark A. A., Combes F., Wilson R. W., 1979, A&A, 78, L1
- Espada et al. (2010) Espada D., et al., 2010, ApJ, 720, 666
- Faber et al. (1992) Faber S. M., Worthey G., Gonzales J. J., 1992, in Barbuy B., Renzini A., eds, IAU Symposium Vol. 149, The Stellar Populations of Galaxies. p. 255
- Fenner et al. (2003) Fenner Y., Gibson B. K., Lee H.-C., Karakas A. I., Lattanzio J. C., Chieffi A., Limongi M., Yong D., 2003, Publ. Astron. Soc. Australia, 20, 340
- For et al. (2012) For B.-Q., Koribalski B. S., Jarrett T. H., 2012, MNRAS, 425, 1934
- Freeman & Bland-Hawthorn (2002) Freeman K., Bland-Hawthorn J., 2002, ARA&A, 40, 487
- Füri & Marty (2015) Füri E., Marty B., 2015, Nature Geoscience, 8, 515
- Gallagher et al. (2015) Gallagher A. J., Ludwig H.-G., Ryan S. G., Aoki W., 2015, A&A, 579, A94
- García Pérez et al. (2009) García Pérez A. E., Aoki W., Inoue S., Ryan S. G., Suzuki T. K., Chiba M., 2009, A&A, 504, 213
- Goldreich & Kwan (1974) Goldreich P., Kwan J., 1974, ApJ, 189, 441
- González-Alfonso et al. (2012) González-Alfonso E., et al., 2012, A&A, 541, A4
- Gratton et al. (2000) Gratton R. G., Sneden C., Carretta E., Bragaglia A., 2000, A&A, 354, 169
- Greve et al. (2009) Greve T. R., Papadopoulos P. P., Gao Y., Radford S. J. E., 2009, ApJ, 692, 1432
- Harrison et al. (1999) Harrison A., Henkel C., Russell A., 1999, MNRAS, 303, 157
- Heikkilä et al. (1998) Heikkilä A., Johansson L. E. B., Olofsson H., 1998, A&A, 332, 493
- Henkel & Mauersberger (1993) Henkel C., Mauersberger R., 1993, A&A, 274, 730
- Henkel et al. (1993) Henkel C., Mauersberger R., Wiklind T., Huettemeister S., Lemme C., Millar T. J., 1993, A&A, 268, L17
- Henkel et al. (2010) Henkel C., Downes D., Weiß A., Riechers D., Walter F., 2010, A&A, 516, A111
- Henkel et al. (2014) Henkel C., et al., 2014, A&A, 565, A3
- Hirschi (2007) Hirschi R., 2007, A&A, 461, 571
- Hirschi et al. (2005) Hirschi R., Meynet G., Maeder A., 2005, A&A, 433, 1013
- Hughes et al. (2008) Hughes G. L., Gibson B. K., Carigi L., Sánchez-Blázquez P., Chavez J. M., Lambert D. L., 2008, MNRAS, 390, 1710
- Iben (1975) Iben Jr. I., 1975, ApJ, 196, 525
- Ikarashi et al. (2015) Ikarashi S., et al., 2015, ApJ, 810, 133
- Indriolo et al. (2017) Indriolo N., Bergin E. A., Goicoechea J. R., Cernicharo J., Gerin M., Gusdorf A., Lis D. C., Schilke P., 2017, ApJ, 836, 117
- Ivezić et al. (2012) Ivezić Ž., Beers T. C., Jurić M., 2012, ARA&A, 50, 251
- Iwamoto et al. (1999) Iwamoto K., Brachwitz F., Nomoto K., Kishimoto N., Umeda H., Hix W. R., Thielemann F.-K., 1999, ApJS, 125, 439
- Jiménez-Donaire et al. (2017) Jiménez-Donaire M. J., et al., 2017, ApJ, 836, L29
- José (2012) José J., 2012, Bulletin of the Astronomical Society of India, 40, 443
- José & Hernanz (1998) José J., Hernanz M., 1998, ApJ, 494, 680
- José & Hernanz (2007) José J., Hernanz M., 2007, Journal of Physics G Nuclear Physics, 34, R431
- Karakas (2010) Karakas A. I., 2010, MNRAS, 403, 1413
- Kennicutt (1998) Kennicutt Jr. R. C., 1998, ApJ, 498, 541
- Kobayashi et al. (2011) Kobayashi C., Karakas A. I., Umeda H., 2011, MNRAS, 414, 3231
- König et al. (2016) König S., Aalto S., Muller S., Gallagher J. S., Beswick R. J., Xu C. K., Evans A., 2016, A&A, 594, A70
- Kroupa (2002) Kroupa P., 2002, in Grebel E. K., Brandner W., eds, Astronomical Society of the Pacific Conference Series Vol. 285, Modes of Star Formation and the Origin of Field Populations. p. 86
- Langer & Penzias (1993) Langer W. D., Penzias A. A., 1993, ApJ, 408, 539
- Langer et al. (1984) Langer W. D., Graedel T. E., Frerking M. A., Armentrout P. B., 1984, ApJ, 277, 581
- Levshakov et al. (2006) Levshakov S. A., Centurión M., Molaro P., Kostina M. V., 2006, A&A, 447, L21
- Li et al. (2016) Li H.-K., Zhang J.-S., Liu Z.-W., Lu D.-R., Wang M., Wang J., 2016, Research in Astronomy and Astrophysics, 16, 47
- Lind et al. (2013) Lind K., Meléndez J., Asplund M., Collet R., Magic Z., 2013, A&A, 554, A96
- Lisenfeld et al. (2000) Lisenfeld U., Isaak K. G., Hills R., 2000, MNRAS, 312, 433
- Lucas & Liszt (1996) Lucas R., Liszt H., 1996, A&A, 307, 237
- Lucas & Liszt (1998) Lucas R., Liszt H., 1998, A&A, 337, 246
- Lutz et al. (2007) Lutz D., et al., 2007, ApJ, 661, L25
- Mao et al. (2000) Mao R. Q., Henkel C., Schulz A., Zielinsky M., Mauersberger R., Störzer H., Wilson T. L., Gensheimer P., 2000, A&A, 358, 433
- Marks et al. (2012) Marks M., Kroupa P., Dabringhausen J., Pawlowski M. S., 2012, MNRAS, 422, 2246
- Martín et al. (2010) Martín S., Aladro R., Martín-Pintado J., Mauersberger R., 2010, A&A, 522, A62
- Martín et al. (2011) Martín S., et al., 2011, A&A, 527, A36
- Marty et al. (2011) Marty B., Chaussidon M., Wiens R. C., Jurewicz A. J. G., Burnett D. S., 2011, Science, 332, 1533
- Matteucci (1986) Matteucci F., 1986, MNRAS, 221, 911
- Matteucci (1994) Matteucci F., 1994, A&A, 288, 57
- Matteucci & D’Antona (1991) Matteucci F., D’Antona F., 1991, A&A, 247, L37
- Matteucci & François (1989) Matteucci F., François P., 1989, MNRAS, 239, 885
- Matteucci & Greggio (1986) Matteucci F., Greggio L., 1986, A&A, 154, 279
- Matteucci & Recchi (2001) Matteucci F., Recchi S., 2001, ApJ, 558, 351
- Matteucci & Tornambè (1987) Matteucci F., Tornambè A., 1987, A&A, 185, 51
- Meier & Turner (2001) Meier D. S., Turner J. L., 2001, ApJ, 551, 687
- Meier & Turner (2004) Meier D. S., Turner J. L., 2004, AJ, 127, 2069
- Meier et al. (2008) Meier D. S., Turner J. L., Hurt R. L., 2008, ApJ, 675, 281
- Meier et al. (2014) Meier D. S., Turner J. L., Beck S. C., 2014, ApJ, 795, 107
- Meynet & Maeder (2002a) Meynet G., Maeder A., 2002a, A&A, 381, L25
- Meynet & Maeder (2002b) Meynet G., Maeder A., 2002b, A&A, 390, 561
- Milam et al. (2005) Milam S. N., Savage C., Brewster M. A., Ziurys L. M., Wyckoff S., 2005, ApJ, 634, 1126
- Muller et al. (2006) Muller S., Guélin M., Dumke M., Lucas R., Combes F., 2006, A&A, 458, 417
- Muller et al. (2014) Muller S., et al., 2014, A&A, 566, A112
- Muraoka et al. (2016) Muraoka K., et al., 2016, PASJ, 68, 89
- Nishimura et al. (2016) Nishimura Y., Shimonishi T., Watanabe Y., Sakai N., Aikawa Y., Kawamura A., Yamamoto S., 2016, ApJ, 829, 94
- Nomoto et al. (2013) Nomoto K., Kobayashi C., Tominaga N., 2013, ARA&A, 51, 457
- Noterdaeme et al. (2017) Noterdaeme P., et al., 2017, A&A, 597, A82
- Osterbrock (1989) Osterbrock D. E., 1989, Astrophysics of gaseous nebulae and active galactic nuclei. University Science Books, Mill Valley, CA
- Paglione et al. (1997) Paglione T. A. D., Jackson J. M., Ishizuki S., 1997, ApJ, 484, 656
- Paglione et al. (2001) Paglione T. A. D., et al., 2001, ApJS, 135, 183
- Palmerini et al. (2009) Palmerini S., Busso M., Maiorca E., Guandalini R., 2009, Publ. Astron. Soc. Australia, 26, 161
- Panuzzo et al. (2010) Panuzzo P., et al., 2010, A&A, 518, L37
- Papadopoulos (2010) Papadopoulos P. P., 2010, ApJ, 720, 226
- Papadopoulos & Seaquist (1998) Papadopoulos P. P., Seaquist E. R., 1998, ApJ, 492, 521
- Papadopoulos & Seaquist (1999) Papadopoulos P. P., Seaquist E. R., 1999, ApJ, 516, 114
- Papadopoulos et al. (1996) Papadopoulos P. P., Seaquist E. R., Scoville N. Z., 1996, ApJ, 465, 173
- Papadopoulos et al. (2011) Papadopoulos P. P., Thi W.-F., Miniati F., Viti S., 2011, MNRAS, 414, 1705
- Papadopoulos et al. (2012) Papadopoulos P. P., van der Werf P. P., Xilouris E. M., Isaak K. G., Gao Y., Mühle S., 2012, MNRAS, 426, 2601
- Papadopoulos et al. (2014) Papadopoulos P. P., et al., 2014, ApJ, 788, 153
- Pasquali et al. (2004) Pasquali A., Gallagher J. S., de Grijs R., 2004, A&A, 415, 103
- Penzias et al. (1971) Penzias A. A., Jefferts K. B., Wilson R. W., 1971, ApJ, 165, 229
- Pignatari et al. (2015) Pignatari M., et al., 2015, ApJ, 808, L43
- Placco et al. (2014) Placco V. M., Frebel A., Beers T. C., Stancliffe R. J., 2014, ApJ, 797, 21
- Polehampton et al. (2005) Polehampton E. T., Baluteau J.-P., Swinyard B. M., 2005, A&A, 437, 957
- Prantzos et al. (1996) Prantzos N., Aubert O., Audouze J., 1996, A&A, 309, 760
- Recchi et al. (2009) Recchi S., Calura F., Kroupa P., 2009, A&A, 499, 711
- Rickard & Blitz (1985) Rickard L. J., Blitz L., 1985, ApJ, 292, L57
- Ritchey et al. (2015) Ritchey A. M., Federman S. R., Lambert D. L., 2015, ApJ, 804, L3
- Roederer et al. (2008) Roederer I. U., Lawler J. E., Sneden C., Cowan J. J., Sobeck J. S., Pilachowski C. A., 2008, ApJ, 675, 723
- Röllig & Ossenkopf (2013) Röllig M., Ossenkopf V., 2013, A&A, 550, A56
- Romano & Matteucci (2003) Romano D., Matteucci F., 2003, MNRAS, 342, 185
- Romano et al. (1999) Romano D., Matteucci F., Molaro P., Bonifacio P., 1999, A&A, 352, 117
- Romano et al. (2000) Romano D., Matteucci F., Salucci P., Chiappini C., 2000, ApJ, 539, 235
- Romano et al. (2001) Romano D., Matteucci F., Ventura P., D’Antona F., 2001, A&A, 374, 646
- Romano et al. (2010) Romano D., Karakas A. I., Tosi M., Matteucci F., 2010, A&A, 522, A32
- Romano et al. (2015) Romano D., Bellazzini M., Starkenburg E., Leaman R., 2015, MNRAS, 446, 4220
- Sage & Isbell (1991) Sage L. J., Isbell D. W., 1991, A&A, 247, 320
- Sage et al. (1991) Sage L. J., Mauersberger R., Henkel C., 1991, A&A, 249, 31
- Salomé et al. (2016) Salomé Q., Salomé P., Combes F., Hamer S., Heywood I., 2016, A&A, 586, A45
- Savage et al. (2002) Savage C., Apponi A. J., Ziurys L. M., Wyckoff S., 2002, ApJ, 578, 211
- Schmidt (1959) Schmidt M., 1959, ApJ, 129, 243
- Scoville & Solomon (1974) Scoville N. Z., Solomon P. M., 1974, ApJ, 187, L67
- Shirley (2015) Shirley Y. L., 2015, PASP, 127, 299
- Simpson et al. (2016) Simpson J. M., et al., 2016, preprint, (arXiv:1611.03084)
- Sliwa et al. (2013) Sliwa K., et al., 2013, ApJ, 777, 126
- Sliwa et al. (2014) Sliwa K., Wilson C. D., Iono D., Peck A., Matsushita S., 2014, ApJ, 796, L15
- Smail et al. (1997) Smail I., Ivison R. J., Blain A. W., 1997, ApJ, 490, L5
- Smiljanic et al. (2009) Smiljanic R., Gauderon R., North P., Barbuy B., Charbonnel C., Mowlavi N., 2009, A&A, 502, 267
- Spilker et al. (2014) Spilker J. S., et al., 2014, ApJ, 785, 149
- Spite & Spite (2010) Spite M., Spite F., 2010, in Charbonnel C., Tosi M., Primas F., Chiappini C., eds, IAU Symposium Vol. 268, Light Elements in the Universe. Cambridge Univ. Press, Geneva, p. 201
- Spite et al. (2006) Spite M., et al., 2006, A&A, 455, 291
- Spitoni et al. (2015) Spitoni E., Romano D., Matteucci F., Ciotti L., 2015, ApJ, 802, 129
- Starrfield et al. (2009) Starrfield S., Iliadis C., Hix W. R., Timmes F. X., Sparks W. M., 2009, ApJ, 692, 1532
- Swinbank et al. (2010) Swinbank A. M., et al., 2010, Nature, 464, 733
- Tan et al. (2011) Tan Q.-H., Gao Y., Zhang Z.-Y., Xia X.-Y., 2011, Research in Astronomy and Astrophysics, 11, 787
- Timmes et al. (1995) Timmes F. X., Woosley S. E., Weaver T. A., 1995, ApJS, 98, 617
- Toft et al. (2014) Toft S., et al., 2014, ApJ, 782, 68
- Tosi (1982) Tosi M., 1982, ApJ, 254, 699
- Tunnard et al. (2015) Tunnard R., Greve T. R., Garcia-Burillo S., Graciá Carpio J., Fuente A., Tacconi L., Neri R., Usero A., 2015, ApJ, 815, 114
- Wall et al. (1993) Wall W. F., Jaffe D. T., Bash F. N., Israel F. P., Maloney P. R., Baas F., 1993, ApJ, 414, 98
- Wallström et al. (2016) Wallström S. H. J., Muller S., Guélin M., 2016, A&A, 595, A96
- Wang et al. (2009) Wang M., Chin Y.-N., Henkel C., Whiteoak J. B., Cunningham M., 2009, ApJ, 690, 580
- Wasserburg et al. (1995) Wasserburg G. J., Boothroyd A. I., Sackmann I.-J., 1995, ApJ, 447, L37
- Watanabe et al. (2014) Watanabe Y., Sakai N., Sorai K., Yamamoto S., 2014, ApJ, 788, 4
- Weidner et al. (2004) Weidner C., Kroupa P., Larsen S. S., 2004, MNRAS, 350, 1503
- Weidner et al. (2013) Weidner C., Kroupa P., Pflamm-Altenburg J., Vazdekis A., 2013, MNRAS, 436, 3309
- Wielen et al. (1996) Wielen R., Fuchs B., Dettbarn C., 1996, A&A, 314, 438
- Wiklind & Combes (1995) Wiklind T., Combes F., 1995, A&A, 299, 382
- Wiklind & Combes (1996) Wiklind T., Combes F., 1996, A&A, 315, 86
- Wilson & Matteucci (1992) Wilson T. L., Matteucci F., 1992, A&ARv, 4, 1
- Wilson & Rood (1994) Wilson T. L., Rood R., 1994, ARA&A, 32, 191
- Worthey et al. (1992) Worthey G., Faber S. M., Gonzalez J. J., 1992, ApJ, 398, 69
- Wouterloot et al. (2008) Wouterloot J. G. A., Henkel C., Brand J., Davis G. R., 2008, A&A, 487, 237
- Yaron et al. (2005) Yaron O., Prialnik D., Shara M. M., Kovetz A., 2005, ApJ, 623, 398
- Yin et al. (2010) Yin J., Magrini L., Matteucci F., Lanfranchi G. A., Gonçalves D. R., Costa R. D. D., 2010, A&A, 520, A55
- Young & Sanders (1986) Young J. S., Sanders D. B., 1986, ApJ, 302, 680
- Young et al. (2011) Young E. D., Gounelle M., Smith R. L., Morris M. R., Pontoppidan K. M., 2011, ApJ, 729, 43
- Zhang et al. (2014) Zhang Z.-Y., et al., 2014, A&A, 568, A122
- Zinner (2014) Zinner E., 2014, in Davis A. M., ed., Treatise on Geochemistry, 2nd edn. Vol. 1, Meteorites and Cosmochemical Processes. Elsevier, Oxford, p. 181
- van der Werf et al. (2010) van der Werf P. P., et al., 2010, A&A, 518, L42