A Polarization Sequence for Type Ia Supernovae?
Abstract
Early polarization observations on Type Ia supernovae (SNe Ia) may reveal the geometry of supernova ejecta, and then put constraints on their explosion mechanism and their progenitor model. We performed a literature search of SNe Ia with polarization measurements and determined the polarization and relative equivalent width (REW) of Si II 635.5-nm absorption feature at -5 days after the maximum light. We found that either the distribution of observed polarization degree is bimodal, i.e. the broad line SNe Ia have systematically higher polarization than all other SNe Ia, or all kind of SNe Ia share the same polarization sequence, i.e. the polarization of Si II 635.5-nm absorption feature increases with the REW. We also discussed the potential meaning of the discovery on the explosion mechanism and progenitor model of SNe Ia.
1 INTRODUCTION
There is a consensus that type Ia supernovae (SNe Ia) are thermonuclear explosions of carbon-oxygen white dwarfs (CO WDs) in binary systems (Wang & Han 2012; Maoz, Mannucci & Nelemans 2014). Although they are used empirically to measure the cosmological parameters, which resulted in the discovery of the accelerating expansion of the universe (Riess et al. 1998; Perlmutter et al. 1999), their progenitor nature and explosion mechanism are still unclear (Hillebrandt & Niemeyer 2000; Leibundgut 2000; Meng et al. 2015).
A CO WD in a binary system accretes material from its companion to increase its mass to a maximum stable mass, where an explosive nuclear burning is ignited, and then the WD explodes as a SN Ia, leaving no remnant (Hillebrandt & Niemeyer 2000; Wang & Han (2012); Maoz, Mannucci & Nelemans 2014). There is a decade-long debate on the companion nature, and on how the explosive nuclear burning is triggered and how burning front propagates through the WD. The resulting chemical structures are dramatically different from various models, which may leave some essential information via a polarized spectrum (Wang & Wheeler 2008). Models successfully reproducing the spectrum of SNe Ia generally start from a subsonic nuclear burning, or deflagration, but there are endless arguments on whether the burning front becomes supersonic after the early deflagration, and recently on where there is a deflagration (Khokhlov 1991; Nomoto, Thielemann & Yokoi 1984). Generally, a long deflagration phase may result in more chemical clumps within a wider velocity range (Reinecke et al. 2002; Blondin et al. 2011). Spectropolarimetry and spectral analysis may probe clump structure and velocity distribution of supernova ejecta, which may constrain the explosion model, even the progenitor model of SNe Ia, although all extragalactic supernovae remain point-like in the sky (Wang & Wheeler 2008).
It is well known that SNe Ia show spectroscopic, photometric and spectropolarimetric diversity (Filippenko 1997; Leibundgut 2000; Wang et al. 2007; Branch et al. 2009). Among normal SNe Ia, these properties are correlated to form 1 parameter sequences, although the sequences may not be perfectly correlated. Various peculiar SNe Ia sub-classes buck some, but not all, of these trends. For example, it has been shown that the polarization of Si II 635.5-nm absorption feature at -5 days after the maximum light correlates with the light curve width parameter (Wang et al. 2007), and also that the polarization correlates with the velocity-gradient parameter, , inferred from the Si II 635.5 nm absorption feature (Maund et al. 2010a). However, there are always some SNe Ia deviating from these correlations. It becomes significantly meaningful that whether or not there exists a sequence, in which all kind of SNe Ia follow the sequence. We try to find such a sequence.
In section 2, we simply describe our method, and present the results in section 3. In section 4, we show discussions and conclusions.
| SN | Phase | Phase | pEW() | Branch | Ref | ||
|---|---|---|---|---|---|---|---|
| for polarization | for spectrum | of 6355 | type | ||||
| 1996X | -4.2 | 0.50(20) | -4 | 83.22 | 0.61 | CN | 1, 2 |
| 1997bp | -5.0 | 0.90(10) | -3 | 184.1 | 0.74 | BL | 1, 2 |
| 1997bq | -3.0 | 0.40(20) | -6 | 175.5 | 0.71 | BL | 1, 2 |
| 1997br | -2.0 | 0.20(20) | -7 | 18.60 | 0.14 | SS | 1, 3 |
| 1999by | -2.5 | 0.40(10) | -4 | 87.09 | 0.58 | CL | 1, 2 |
| 2001V | -7.3 | 0.00(07) | -5 | 56.08 | 0.35 | SS | 1, 2 |
| 2001el | -4.2 | 0.45(02) | -4 | 93.70 | 0.51 | CN | 1, 4 |
| 2002bo | -5.0 | 0.90(05) | -5 | 156.10 | 0.71 | BL | 1, 2 |
| 2002el | -6.4 | 0.72(09) | +12 | 123.8 | 0.68 | CL | 1, 3 |
| 2002fk | -5.5 | 0.67(10) | -3 | 64.83 | 0.49 | CN | 1, 2 |
| 2003W | -4.5 | 0.64(10) | -5 | 152.30 | 0.59 | BL | 1, 3 |
| 2004dt | -7.3 | 1.60(10) | -6.5 | 200.80 | 0.71 | BL | 1, 3 |
| 2004ef | -4.1 | 1.10(30) | -4 | 132.90 | 0.61 | BL | 1, 3 |
| 2004eo | -5.9 | 0.71(08) | -5.6 | 103.20 | 0.59 | CL | 1, 3 |
| 2005cf | -9.9 | 0.44(05) | -5 | 88.80 | 0.50 | CN | 1, 5 |
| 2005de | -4.4 | 0.67(14) | -1 | 102.80 | 0.67 | CL | 1, 3 |
| 2005hk | -4 | 0.36(17) | -4.3 | 20.69 | 0.16 | SS | 3, 6 |
| 2005ke | -7 | 0.39(08) | 0 | 102.1 | 0.62 | CL | 2, 7 |
| 2006X | -5 | 1.00(10) | -7 | 189.4 | 0.72 | BL | 8, 9 |
| 2007le | -5 | 0.85(10) | -6 | 122.2 | 0.55 | BL | 3, 10 |
| 2011fe | -6 | 0.33(03) | -6 | 87.71 | 0.56 | CN | 11, LJT |
| 2012fr | -5 | 0.30(05) | -4 | 70.63 | 0.45 | SS | 12, 13, LJT |
| 2014J | -3 | 0.50(10) | -3 | 111.7 | 0.62 | CN | 14, LJT |
| 2016coj | -9.1 | 0.90(10) | -7 | 128.4 | 0.67 | CN | 15 |
| 2002bf | +3 | 0.40(10) | +3 | 170.9 | 0.77 | BL | 3, 16 |
| +2 | 150.8 | 0.65 | 3 | ||||
| 2003hv | +5 | 0.25(05) | +5 | 112.8 | 0.64 | CN | 10, 17 |
| +1 | 112.0 | 0.66 | 17 | ||||
| 2004S | +9 | 0.26(04) | +8.3 | 62.2 | 0.51 | CN | 3, 18 |
| +2 | 99.56 | 0.53 | 3 | ||||
| 2009dc | +5.6 | 0.50(10) | +7 | 58.08 | 0.44 | S-Ch | 19, 20 |
| -4 | 59.08 | 0.38 | 19 |
Reference: 1. Wang et al. (2007); 2. Blondin et al. (2012); 3. Silverman et al. (2012); 4. Wang et al. (2003); 5. Wang et al. (2009); 6. Maund et al. (2010b); 7. Patat et al. (2012); 8. Patat et al. (2009); 9. Yamanaka et al. (2009a); 10. Maund et al. (2010a); 11. Smith et al. (2011); 12. Maund et al. (2013); 13. Zhang et al. (2014); 14. Patat et al. (2014); 15. Zheng et al. (2016); 16. Leonard et al. (2005); 17. Leloudas et al. (2009); 18. Chornock & Filippenko (2008); 19. Taubenberger et al. (2011); 20. Tanaka et al. (2010).
2 METHOD
2.1 The method to treat the data
We collected the polarizational and spectral data of Si II 635.5-nm line for various SNe Ia from published literatures. All the polarization data and most of the spectral data are collected from the literatures and some spectrum are taken with the LiJiang 2.4-m telescope of Yunnan Observatories. The details of the data are summarized in Tab. 1. The sample (see Tab. 1) includes all sub-classes of SNe Ia, even a peculiar object SN 2005hk (Branch et al. 2009).
Generally, the peak level of the polarization of Si II 635.5-nm line in polarization spectrum is taken as the polarization degree of the line, and the peak value usually appears at the absorption minimum of the line in flux spectrum. The degree of polarization across the silicon line changes with time after explosion, and the relation between the polarization degree and the time may be fitted by a second order polynomial (Wang et al. 2007). It is found that the polarization degrees of some SNe Ia at -5 days after maximum light are correlated to their maximum light (Wang et al. 2007). In this paper, for the collected polarization data, we normalized polarization degree to the value at -5 days after maximum light by subtracting from the observed degree of polarization, where is the day after the optical maximum light of a SN Ia (Wang et al. 2007).
In the polarization sample, the polarization observations for four SNe Ia were carried out after their maximum light, and their polarization degrees at -5 days after their maximum light were estimated based on their velocity evolution of Si II 635.5-nm absorption feature (Maund et al. 2010a), i.e.
| (1) |
where is the expansion velocity gradients of photosphere inferred from the Si II 635.5 nm absorption feature (see Table. 1).
We then looked for the spectrum closest to -5 days in literatures and defined a relative equivalent width (REW), which is defined as the ratio of the pseudo-equivalent width (pEW) to the relative depth () of an absorption feature. For the meaning of the REW, please see the next subsection. The measurements of the pEW and for the absorption feature of Si II 635.5 nm are exactly the same to the method in Silverman et al. (2012). The REW values of the four SNe Ia whose polarization measurements were carried out after the maximum light are derived from the spectra closest to the time of -5 days after their maximum light.
2.2 The meaning of REW
In this paper, REW is defined as the ratio of the pseudo-equivalent width (pEW) to the relative depth () of an absorption feature (Silverman et al. 2012). Actually, based on the definition of the REW, it can always be written into a form of
| (2) |
in first order approximation (Rybicki & Hummer 1978), where and are coefficients which are related to the species of an element and temperature. and are the corresponding frequencies at the blue and red wings of an absorption feature, and and are the expansion velocities of inner and outer boundary of a given element in the supernova ejecta. Generally, is equal to the expansion velocity of photosphere. We show a simple proof as follows. In a co-moving reference system, for a line profile from an expanding atmosphere, the line profile can be expressed by
| (3) |
where is the specific intensity at the point () in direction (Huang 1998). and are coordinates in cylindrical coordinate and is the value at the surface of the atmosphere. is dimensionless frequency in co-moving reference system and can be expressed as a linear combination of frequency and material velocity field , i.e. , where and are correlated with the thermal velocity of an species and the central frequency of a line, and is related to the thermal velocity of the species and . For simplicity, we normalized the continuum flux to be 1, and then the REW is defined as
| (4) |
where is the value at linecore, and . Via a Taylor series expansion at , we may get
| (5) |
which shares the same form as Equation (2). Therefore, although the definition of REW is simple, it relates to two physical quantities on supernova ejecta, and we expect to see a linear relation between the REW and a kind of velocity difference which can reflect the distribution of an element in supernova ejecta and be derived from an absorption feature.
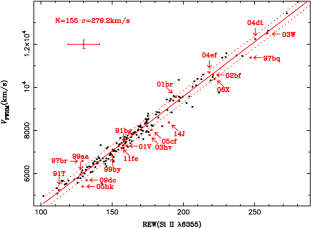
In Fig. 1, we show the correlation between the REW and the full width at half-maximum (FWHM) intensity of Si II 635.5-nm absorption feature in velocity space, , for SNe Ia around maximum light. We can see that there is a very good linear relation between the REW and , as expected from the definition of the REW. Since an absorption feature may reflect the properties of an element outside the photosphere in the supernova ejecta of a SN Ia, REW may present the distribution of silicon outside the photosphere in the velocity space of the supernova ejecta.

3 RESULT
3.1 The distribution of REW
From Fig. 1, we can see that the value of the REW consecutively varies. To get the intrinsic distribution of the REW, we collected the spectrum of SNe Ia from literatures, and the sample is mainly from Silverman et al. (2012) and Wang et al. (2013). Since the spectrum at -5 day after the maximum light is rare, we just collected spectrum around maximum light. There is not any bias when we were collecting the sample. Although it is very likely that the value of REW may evolve with time, the distribution of REW around maximum light may reflect the distribution at -5 day to a great extent, at least in a sense of the distribution’s tendency and shape. In Fig. 2, we show the distribution of the REW around maximum light. The distribution may be well fitted by a Gaussian with an average value of and , and there is not a significant signal to show a bimodal distribution. If REW may reflect the nature of the explosion mechanism of SNe Ia, the one Gaussian distribution imply that all SNe Ia could share the same explosion mechanism.
3.2 The correlation between the polarization and REW
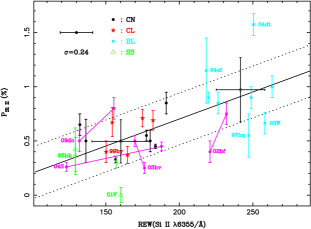
In Fig. 3, we show the correlation between the polarization and REW of Si II 635.5-nm line for SNe Ia. It seems that the SNe Ia are divided into two groups based on their position in the plane, i.e. one is a high- high-REW group including only the broad-line (BL) SNe Ia, the other is a low- low-REW group including core-normal (CN), shallow-silicon (SS) and cool (CL) SNe Ia (Branch et al. 2009). This appearance is mainly derived from the gap around REW 200 Å. The high- high-REW group has a value of (, REW) = ( Å), and the low- low-REW group has a value of (, REW) = ( Å), i.e. on average, the polarization degree of the high- high-REW group is higher than that of the low low-REW group by about 0.5%, and the REW value by about 80 Å. Interestingly, the low- low-REW group has an almost equal average value of the REW to that of the REW distribution in Fig. 2, and the REW value of the high- high-REW group is clearly beyond the level of the REW distribution.
The two-group appearance is mainly derived from the existence of the gap of REW in Fig. 3. It is still not clear why there is the gap in Fig. 3. One possible reason is that the dependence of REW on a parameter in a successful model is bifurcated. However, the distribution of REW is consecutive (see Fig. 1), and there is not the signal of the bifurcated distribution of the REW. Especially, the REW distribution may well be fitted by one Gaussian (see Fig. 2). The small size of the sample may also contribute to the gap. To test the probability that the gap is derived from a statistical fluctuation, we performed a simple Monte-Carlo simulation. By assuming a Gaussian distribution as shown in Fig. 2, we found that the appearance of the gap in REW can be attributed to statistical fluctuation by 19.5% if the observational error of the REW is not considered, while by 72.9% if the observational error is considered. Therefore, considering the Gaussian distribution of the REW, the gap of REW in Fig. 3 is very likely derived from the small size of the polarization sample. Another possible reason is from an artificial selection effect, i.e. more attentions about polarization observations are payed to special SNe Ia than CN SNe Ia, which could miss some CN SNe Ia locating in the gap. For example, SN 2016coj, which is a CN SN Ia (Zheng et al. 2016), has a REW value of Å, higher than any other SS, CN and CL SNe Ia in the sample here.
At the same time, there seems to be a trend that the polarization degree increases with the REW and a linear relation may fit the correlation, i.e.
| (6) |
where the correlation coefficient is 0.6641 and the observational error is taken as the weight for the fitting. The vertical deviation of statistical error for the linear fit is . For most SNe Ia, their observational error bars are consistent with level, except SN 2004dt and SN 2001V. At present, the sample size is small and the observational error is still large, which affect the confident level of the correlation between the polarization and REW as shown by the correlation coefficient. However, combining with the Gaussian distribution of REW, it is still very possible to exist such a correlation based on the present data, e.g. the average value of the polarization degree of the high- high-REW group is significantly higher than that of the low low-REW group, although the error bar is partly overlapped. Moreover, even the three most deviate SNe Ia, SN 2001V, 2004dt and 2004ef, are removed, we still can not use a horizontal line to fit the data points, but a tighter () and smaller slope () line may fit the date points well.
In Fig. 3, the polarization observation for four SNe Ia were carried our after the maximum light (purple points in Fig. 3). Their positions in the plane still follow the polarization sequence except that the polarization of SN 2009dc seems to slightly beyond the range (but still consistent with the sequence within observational error). SN 2002bf belongs to BL sub-class, and SN 2003hv and 2004S to CN sub-class.
4 DISCUSSIONS AND CONCLUSIONS
4.1 Two polarization group?
In Fig. 3, the SNe Ia seem to be divided into a high- high-REW group and a low- low-REW group, where the high- high-REW group are only included the BL SNe Ia. Maund et al. (2010a) also found that among normal SNe Ia, the high-velocity-gradient (HVG) SNe Ia show a higher polarization than the low-velocity-gradient (LVG) SNe Ia. Generally, the HVG SNe Ia classified by Benetti et al. (2005) overlap with the BL SNe Ia classified by Branch et al. (2009), except some peculiar SNe Ia. For example, a HVG SN Ia in Benetti’s classification, SN 2001V, belongs to SS SNe Ia in Branch’s classification, and SN 2001V has a very low polarization. Here, the high- high-REW group consists exclusively of BL SNe Ia. At early phase, BL SNe Ia often exhibit a high and low-velocity components in their absorption profiles, and the high-velocity component has the high polarization (Maund et al. 2013). However, the high-velocity feature (HVF) is a ubiquitous property of SNe Ia (Mazzali et al. 2005a, b). For example, SN 2012fr, which belongs to the SS subclass, shows the clear high-velocity components of the spectral features, but its polarization at 5 days before the maximum light is not as high as those BL SNe Ia. Why don’t the HVF in SS, CL and CN SNe Ia show such high polarization shown in BL SNe Ia?
If the appearance of the two groups in the plane is the exact nature for SNe Ia, the results imply that SNe Ia are derived from at least two explosion models (Hillebrandt & Niemeyer 2000) or two progenitor models (Wang et al. 2013), e.g. the violent merger model (Pakmor et al. 2010) produces the high- high-REW SNe Ia, while the Chandrasekhar-mass model (Khokhlov 1991) and the double-detonation model (Livne 1990) produce the low- low-REW SNe Ia. However, numerical simulations show that the polarization degree predicted from the violent model is much higher than that of the high- high-REW SNe Ia, and the Chandrasekhar mass model may well reproduce the polarization distribution of all SNe Ia (Bulla et al. 2016a, b). As discussed in section 3, the two-group appearance is mainly derived from the existence of the REW gap in Fig. 3, but the gap is very likely to attribute to the small sample size.
4.2 A polarization sequence?
The polarization of silicon line reflects the asymmetry of the silicon distribution in supernova ejecta, while the REW is a measure of the velocity difference of silicon layer in velocity space. Even for a spherically symmetric structure of supernova ejecta, the different REW values are still expected from different supernovae due to their different explosion energy. So, the polarization degree and the REW are independent parameters, and a correlation between the two parameter is not necessary. Therefore, if there exists a correlation between and REW and the correlation shown in Fig. 3 is intrinsic for all SNe Ia, the correlation will put strong constraints on the successful explosion models of SNe Ia, since all kinds of subclasses of SNe Ia seem to obey the same sequence, which need to be explained by any successful model. At present stage of theoretical modelling, deflagration (Nomoto, Thielemann & Yokoi 1984), delayed-detonation (Khokhlov 1991, Livne 1999), gravitationally confined detonation (GCD, Plewa et al. 2004), detonating failed deflagration (DFD, Plewa 2007), and violent-merger (Pakmor et al. 2010) models can all plausibly be argued to produce clumps in the ejecta, which may contribute to the polarized absorption lines.
As shown in section 2.2, the REW of an absorption line is proportional to a kind of velocity difference which can reflect the distribution of an element in supernova ejecta and be derived from an absorption feature. As expected, the REW of Si II 635.5-nm absorption feature is indeed proportional to the full width at half-maximum (FWHM) intensity of absorption feature in velocity space. Therefore, if the correlation between and REW is intrinsic for all SNe Ia, we may expect that the more the asymmetric of the distribution of silicon in the supernova, the wider the velocity interval of silicon layer. At present, no any simulation clearly shows such correlation in literatures. Whatever, some simulations showed that the delayed-detonation model is an interesting one and may give a reasonable physical explanation in principle. In addition, one fact must be kept in mind that the polarization degree of the continuum of a SN Ia is generally very low, i.e. generally less than 0.2%, which may exclude any progenitor model or explosion model predicting a highly asymmetric distribution of supernova ejecta (Wang & Wheeler 2008).
Generally, for the delayed-detonation model, a strong detonation is more likely to produce a less turbulent silicon layer, and a later detonation, i.e. the deflagration flame has propagated sufficiently close to the low-density part of a expanding white dwarf, has to bear the imprint of the complex structure of the prior deflagration. It is then expected that the earlier the transition from deflagration to detonation occurs, the less asymmetric the silicon is. At the same time, the earlier the deflagration-detonation transition occurs, the narrower the velocity interval of silicon layer is, as shown by some numerical simulations (Blondin et al. 2011; Gamezo et al. 2005). Therefore, it is expected that there exists a correlation between the polarization degree of silicon lines and the velocity interval of silicon distributed in supernova ejecta, as deduced from Fig. 3. So, the delayed-detonation model may qualitatively explain the correlation in Fig. 3.
Different models use different free parameters to denote the transition from deflagration to detonation. Multi-dimensional numerical simulations generally used a transition time from deflagration to detonation as a free parameter (Kasen et al. 2009; Gamezo et al. 2005), which translates into a transition density from deflagration to detonation as the free parameter in 1D simulations. The models with different in 1D simulations may provide excellent fits to SN Ia spectra and light curves and account for the energetics of SNe Ia (Hillebrandt & Niemeyer 2000). If the delayed-detonation may explain the correlation in Fig. 3, a correlation between the free parameter denoting the transition from deflagration to detonation and the velocity interval of silicon layer in supernova ejecta could be expected. To test this idea, we search for the silicon distribution in velocity space from published literature. The distribution should fulfil the following two criterions: 1. it is the silicon distribution presented in the whole velocity interval, and 2. at least three value of the free parameter was adopted. We found that the 1D simulation in Iwamoto et al. (1999) completely fulfils the above criterions. Here, based on the result of a 1D numerical simulation (Iwamoto et al. 1999), we define the velocity interval of the silicon layer in supernova ejecta as the velocity difference between the two velocity points, where the mass fraction of the silicon is 0.1 (see Figure 25 in Iwamoto et al. 1999). In Fig. 4, we show the correlation between the velocity interval of silicon as the function of the transition density . We can see from the figure that the correlation is well fitted by a linear relation. As shown in section 2.2, REW presents the velocity interval of the silicon layer above photosphere. At -5 day, the location of the photosphere is still inside the silicon layer, and then the REW is not the exact measure of the velocity interval of the silicon layer in supernova ejecta. However, the REW may still represent the velocity interval to a great extent since rather a part of silicon layer is on top of photosphere at -5 day, especially for those high-velocity part which contributes to a sizable part of the velocity interval of silicon layer (Iwamoto et al. 1999; Benetti et al. 2005). Therefore, although it is not the exact same, defined here may represent to a great extent. Combining the linear relation between the REW and , we expect a linear relation between the REW and the . Considering that the free parameter of the in 1D simulation plays a similar role to the numerical simulation results of explosion model as the transition time from deflagration to detonation in multi-dimensional numerical simulations, a linear relation between the and the REW is expected. Especially, the later the , the closer to WD surface the deflagration, and then more complex density structure the following detonation has to bear. In addition, the later the , the wider the velocity interval of silicon layer is (Blondin et al. 2011; Gamezo et al. 2005). Therefore, a high polarization degree and a large REW are simultaneously expected from a later transition from deflagration to detonation. Moreover, since it is close to a spherically symmetric structure for the supernova ejecta from the delayed-detonation model, the low polarization degree of the continuum is also not a problem for delayed-detonation model.
The above discussion is a deduction based on some present numerical simulations and an assumption that may represent to a great extent. Especially, we also notice that the simulations on the delayed-detonation models are not always consistent with each other. For example, the 3D delayed-detonation model in Seitenzahl et al. (2013) shown that the models with weaker deflagration have more asymmetric silicon layers, which seems to be exactly opposite to the expectations from Fig. 3. Moreover, at -5 days after the maximum light, the Si II line widths are not exactly measures of the velocity intervals of silicon layer in supernova ejecta. So, the above discussion on the delayed-detonation model is just a qualitative analysis. More quantitative simulation is needed to check whether or not the delayed-detonation model may reproduce the correlation between the polarization degree and REW as shown in Fig. 3.

4.3 The origin of the scatter
However, there is still a large scatter of for the correlation in Fig. 3. For most SNe Ia, their observational error bars are consistent with level, except SN 2004dt and SN 2001V. The origin of the scatter is still not clear. One possible origin is the effect of the viewing angle, e.g. the level of the scatter of for the correlation is well consistent with that predicted by the delayed-detonation model (Bulla et al. 2016b). It has been verified that the viewing angle may significantly affect the properties of SNe Ia, such as the absolute magnitude, the time of maximum light, the optical spectra and especially the polarization degree of absorption features (Kasen et al. 2004; Blondin et al. 2011; Bulla et al. 2016a). The effect of viewing angle on the polarization degree is not a simple monotonic function (Kasen et al. 2004; Bulla et al. 2016a), and the level of the polarization uncertainties due to the viewing angle is heavily model-dependent, especially on the progenitor model. For the single-degenerate model, even if the explosion is spherically symmetric, supernova ejecta may still become asymmetric due to the existence of its companion, i.e. the companion carves out a conical hole in the supernova ejecta (Marietta et al. 2000; Meng et al. 2007; Gray et al. 2016), which leads to an uncertainty of the polarization degree of silicon line as large as 0.5% (Kasen et al. 2004), consistent with the level of the polarization sequence in Fig. 3. As a subclass of the double degenerate model, the violent-merger model predicts that the difference of the polarization degree of silicon line from different viewing angels for the same SN Ia may be as large as , and then the uncertainty of the polarization degree is even higher than level obtained here (Bulla et al. 2016a). Considering the polarization degree of the continuum predicted by the violent merger model is always significantly higher than that from observations (Bulla et al. 2016a, b), the violent-merger model seems not to be a reasonable one to explain the polarization sequence here and the low continuum polarization of SNe Ia. Similarly, the predicted properties of SNe Ia from the WD-WD collision model is also quite viewing-angle dependent and the supernova ejecta is also highly asymmetric (Raskin et al. 2009; Rosswog et al. 2009). Therefore, the WD-WD collision model also has no ability to simultaneously explain the polarization sequence and the low continuum polarization of SNe Ia. The polarization degree of SN 2004dt and SN 2001V is beyond range of the polarization trend, as found in Wang et al. (2007) and Maund et al. (2010a). If the viewing angle is the origin of the polarization uncertainties, the SN 2004dt and SN 2001V would be observed along a very special viewing angle.
In addition, there are at leat two populations contributing to SNe Ia observationally (Wang et al. 2013), which suggests that at least two progenitor scenarios contribute to SNe Ia. Since the sequence in Fig. 3 includes all subclasses of SNe Ia, the result here implies that all SNe Ia could share the same explosion mechanism, no matter what their progenitor models are, if the correlation is intrinsic for all SNe Ia.
4.4 The peculiar SN 2005hk
Among the SNe Ia shown in Fig. 3, SN 2005hk was classified as a peculiar SN Ia (Chornock et al. 2006) and was suggested to arise from the pure deflagration model of a Chandrasekhar-mass CO WD(Kromer et al. 2013). Recently, the peculiar SN Ia like SN 2005hk was suggested to arise from the hybrid WDs where a CO core is surrounded by an oxygen-neon (ONe) mantle (Meng & Podsiadlowski 2014; Wang et al., 2014; Kromer et al. 2015). For a low carbon abundance in the ONe mantle, the deflagration flame may be switched off in the mantle region and does not translate into detonation. If the switched-off deflagration model is taken as a special case of the delayed-detonation model, the low polarization degree of SN 2005hk is then naturally explained. The following detonation after a deflagration flame may play a great role on the final density structure of supernova ejecta in velocity space, i.e. amplifying the velocity distribution of a given element, and then possibly the asymmetry of supernova ejecta. Due to the absence of the amplification of the following detonation, a low polarization degree and a low REW may be simultaneously expected from a SN Ia arising from the switched-off deflagration model. Whatever, a detailed numerically polarization simulation on this suggestion is needed.
4.5 The super-luminous SN 2009dc
The polarization degree of SN 2009dc is consistent with the range of the linear relation in Fig. 3 within observational error. SN 2009dc is a super-luminous SN Ia and the total mass of the supernova ejecta exceeds the canonical Chandrasekhar mass limit (Howell et al. 2006; Yamanaka et al. 2009b). The supernova was suggested to arise from the merger of a double degenerate system, where the final exploding WD is more likely to have a Chandrasekhar mass, surrounded by a large amount of carbon-oxygen circumstellar medium (CSM) (Taubenberger et al. 2013). Generally, the supernova ejecta of a SN Ia from the double-degenerate model is highly asymmetric, and then a high polarization degree is expected, which is inconsistent with the low continuum polarization degree of SN 2009dc (Tanaka et al. 2010). Two possible reasons may contribute to the low polarization degree of SN 2009dc. One is that its polarization degree at -5 days after their maximum light was underestimated since the ejecta velocity evolution of a super-Chandrasekhar-mass SN Ia is completely different from a normal SN Ia, e.g. the ejecta velocity of a super-luminous SNe Ia is generally much lower than that of a normal SN Ia (Howell et al. 2006). Another possible reason is that, if the supernova arises from a Chandrasekhar-mass WD exploding in a dense carbon-oxygen CSM, the WD could experience a short deflagration phase, which becomes a detonation soon. Such a short deflagration phase does not produce a highly asymmetric distribution of silicon, either a large velocity range. At the same time, early transition from deflagration to detonation means a large amount of nickel-56 (Blondin et al. 2011). Such a Chandrasekhar-mass explosion is also needed by a small continuum polarization (Tanaka et al. 2010). If so, the high amount of nickel-56, low polarization degree and narrow silicon absorption feature may be explained simultaneously, i.e. even if a SN Ia arise from a double- degenerate system with super-Chandrasekhar mass, there is not any special thing for its explosion mechanism.
The low polarization of SN 2009dc could also arise from the effect
of viewing angle, i.e. it was observed from a special viewing
angle (Bulla et al. 2016a). However, it seems impossible for the
effect of the viewing angle to explain the high luminosity and low
polarization degree of SN 2009dc simultaneously, i.e a high
luminosity due to the effect of viewing angle also means a high
polarization degree of silicon line
(Blondin et al. 2011; Hillebrandt et al. 2007).
In summary, we found that either SNe Ia are divided into two
groups in -REW plane, or all SNe Ia follows a
polarization sequence. However, considering the Gaussian
distribution of the REW, it is very likely that the two-group
result is derived from the small size of the polarization sample
here. If the correlation between the polarization degree and the
REW is intrinsic for all SNe Ia, it will put strong constraints on
the explosion model. At present, no any explosion model clearly
shows such a correlation, but the delayed-detonation model is an
interesting one to qualitatively explain the sequence.
Acknowledgments
We are grateful to the anonymous referee for his/her constructive suggestions that greatly improved this manuscript, and to Ivo Seitenzahl for his detailed discussion on this work. This work was supported by the NSFC (No. 11473063, 11522327, 11403096, 11390374 and 11521303), CAS light of West China Program and CAS (No. KJZD-EW-M06-01). Z.H. thanks the support by the Science and Technology Innovation Talent Programme of the Yunnan Province (No. 2013HA005).
References
- Benetti et al. (2005) Benetti, S., Cappellaro, E., Mazzali, P. A. et al., 2005, ApJ, 623, 1011
- Blondin et al. (2011) Blondin, S., Kasen, D., Röpke, F. K., Kirshner, R. P. & Mandel, K. S., 2011, MNRAS, 417, 1280
- Blondin et al. (2012) Blondin, S., Matheson, T., Kirshner, R. P. et al., 2012, AJ, 143, 126
- Branch et al. (2009) Branch, D., Dang, L. C. & Baron, E., 2009, PASP, 121, 238
- Bulla et al. (2016a) Bulla, M., Sim, S. A., Pakmor, R. et al., 2016a, MNRAS, 455, 1060
- Bulla et al. (2016b) Bulla, M., Sim, S. A., Kromer, M. et al., 2016b, MNRAS, 462, 1039
- Chornock et al. (2006) Chornock, R., Filippenko, A. V., Branch, D. et al., 2006, PASP, 118, 722
- Chornock & Filippenko (2008) Chornock, R. & Filippenko, A. V., 2008, AJ, 136, 2227
- Filippenko (1997) Filippenko A.V., 1997, ARA&A, 35, 309
- Gamezo et al. (2005) Gamezo, V. N., Khokhlov, A. M. & Oran, E. S., 2005, ApJ, 623, 337
- Gray et al. (2016) Gray, W. J., Raskin, C., Owen, J. M., 2016, ApJ, 833, 62
- Hillebrandt & Niemeyer (2000) Hillebrandt, W., Niemeyer, J.C., 2000, ARA&A, 38, 191
- Hillebrandt et al. (2007) Hillebrandt, W., Sim, S. A. & Röpke, F. K., 2007, A&A, 465, L17
- Howell et al. (2006) Howell, D. A., Sullivan, M., Nugent, P. E. et al., 2006, Nature, 443, 308
- Huang (1998) Huang, R. stellar physics. Science. press, Beijing, 1998, 657
- Iwamoto et al. (1999) Iwamoto, K., Brachwitz, F., Nomoto, K. et al., 1999, ApJS, 125, 439
- Kasen et al. (2004) Kasen, D., Nugent, P., Thomas, R. C. & Wang, L., 2004, ApJ, 610, 876
- Kasen et al. (2009) Kasen, D., Röpke, F. K. & Woosley, S. E., 2009, Nature, 460, 869
- Khokhlov (1991) Khokhlov, A. M., 1991, A&A, 245, 114
- Kromer et al. (2013) Kromer, M., Fink, M., Stanishev, V., 2013, MNRAS, 429, 2287
- Kromer et al. (2015) Kromer, M., Ohlmann, S. T., Pakmor, R. et al., 2015, MNRAS, 450, 3045
- Leibundgut (2000) Leibundgut, B., 2000, A&ARv, 10, 179
- Leloudas et al. (2009) Leloudas, G., Stritzinger, M. D., Sollerman, J. et al., 2009, A&A, 505, 265
- Leonard et al. (2005) Leonard, D. C., Li, W., Filippenko, A. V., Foley, R. J. & Chornock, R., 2005, ApJ, 632, 450
- Livne (1990) Livne, E., 1990, ApJ, 354, L53
- Livne (1999) Livne, E. 1999, ApJ, 527, L97
- Maoz, Mannucci & Nelemans (2014) Maoz D., Mannucci F., Nelemans G., 2014, ARA&A, 52, 107
- Maund et al. (2010a) Maund, J. R., Höflich, P., Patat, F. et al., 2010a, ApJL, 725, L167
- Maund et al. (2010b) Maund, J. R., Wheeler, J. C., Wang, L. et al., 2010b, ApJ, 722, 1162
- Maund et al. (2013) Maund, J. R., Spyromilio, J., Höflich, P. A. et al., 2013, MNRAS, 433, L20
- Mazzali et al. (2005a) Mazzali P.A., Benetti S., Stehle M. et al., 2005a, MNRAS, 357, 200
- Mazzali et al. (2005b) Mazzali P.A., Benetti S., Altavilla G. et al., 2005b, ApJL, 623, L37
- Marietta et al. (2000) Marietta E., Burrows A., Fryxell B., 2000, ApJS, 128, 615
- Meng et al. (2007) Meng X., Chen X., Han Z., 2007a, PASJ, 59, 835
- Meng & Podsiadlowski (2014) Meng, X. & Podsiadlowski, Ph., 2014, ApJL, 789, L45
- Meng et al. (2015) Meng X., Gao Y., Han Z., 2015, IJMPD, 24, 14, 1530029
- Nomoto, Thielemann & Yokoi (1984) Nomoto, K., Thielemann, F-K., Yokoi, K., 1984, ApJ, 286, 644
- Pakmor et al. (2010) Pakmor, R., Kromer, M., Röpke, F. K. et al., 2010, Nature, 463, 61
- Patat et al. (2009) Patat, F.; Baade, D.; Höflich, P. et al., 2009, A&A, 508, 229
- Patat et al. (2012) Patat, F., Höflich, P., Baade, D. et al., 2012, A&A, 545, A7
- Patat et al. (2014) Patat, F., Taubenberger, S., Baade, D. et al., 2014, ATel, 5830, 1
- Perlmutter et al. (1999) Perlmutter, S. et al., 1999, ApJ, 517, 565
- Plewa et al. (2004) Plewa, T., Calder, A. C. & Lamb, D. Q., 2004, ApJ, 612, L37
- Plewa (2007) Plewa, T. 2007, ApJ, 657, 942
- Raskin et al. (2009) Raskin, C., Timmes, F. X., Scannapieco, E., Diehl, S. & Fryer, C., 2009, MNRAS, 399, L156
- Reinecke et al. (2002) Reinecke, M., Hillebrandt, W. & Niemeyer, J. C., 2002, A&A, 391, 1167
- Riess et al. (1998) Riess, A. et al., 1998, AJ, 116, 1009
- Rosswog et al. (2009) Rosswog, S., Kasen, D. Guillochon, J. & Ramirez-Ruiz, E., 2009, ApJ, 412, L128
- Rybicki & Hummer (1978) Rybicki, G. B., & Hummer, D. G., 1978, ApJ, 219, 654
- Seitenzahl et al. (2013) Seitenzahl, I. R., Ciaraldi-Schoolmann, F., Röpke, F. K. et al., 2013, MNRAS, 429, 1156
- Silverman et al. (2012) Silverman, J. M., Kong, J. J., & Filippenko, A. V., 2012, MNRAS, 425, 1819
- Smith et al. (2011) Smith, P. S., Williams, G. G., Smith, N. et al., 2011, arXiv: 1111.6626
- Tanaka et al. (2010) Tanaka, M., Kawabata, K. S., Yamanaka, M. et al., 2010, ApJ, 714, 1209
- Taubenberger et al. (2011) Taubenberger, S., Benetti, S., Childress, M. et al., 2011, MNRAS, 412, 2735
- Taubenberger et al. (2013) Taubenberger, S., Kromer, M., Hachinger, S. et al., 2013, MNRAS, 432, 3117
- Wang & Han (2012) Wang, B., & Han, Z. 2012, NewAR, 56, 122
- Wang et al., (2014) Wang, B., Meng, X., Liu, D., Liu, Z., Han, Z., 2014, ApJL, 794, L28
- Wang et al. (2003) Wang L., Baade D., Höflich P. et al., 2003, ApJ, 591, 1110
- Wang et al. (2007) Wang, L., Baade, D. & Patat, E., 2007, Science, 315, 212
- Wang & Wheeler (2008) Wang, L. & Wheeler, J. C., 2008, ARA&A, 46, 433
- Wang et al. (2009) Wang, X., Li, W., Filippenko, A. V., 2009, ApJ, 697, 380
- Wang et al. (2013) Wang, X., Wang, L., Filippenko, A. V. et al., 2013, Science, 340, 170
- Yamanaka et al. (2009a) Yamanaka, M., Naito, H., Kinugasa, K. et al., 2009a, PASJ, 61, 713
- Yamanaka et al. (2009b) Yamanaka, M., Kawabata, K. S., Kinugasa, K., 2009b, ApJ, 707, L118
- Zhang et al. (2014) Zhang, J., Wang, X., Bai, J. et al., 2014, AJ, 148, 1
- Zheng et al. (2016) Zheng, W., Filippenko, A. V., Mauerhan, J. et al., 2016, arXiv: 1611.9438