Alane adsorption and dissociation on the Si(001) surface
Abstract
We used DFT to study the energetics of the decomposition of alane, AlH3, on the Si(001) surface, as the acceptor complement to PH3. Alane forms a dative bond with the raised atoms of silicon surface dimers, via the Si atom lone pair. We calculated the energies of various structures along the pathway of successive dehydrogenation events following adsorption: AlH2, AlH and Al, finding a gradual, significant decrease in energy. For each stage, we analyse the structure and bonding, and present simulated STM images of the lowest energy structures. Finally, we find that the energy of Al atoms incorporated into the surface, ejecting a Si atom, is comparable to Al adatoms. These findings show that Al incorporation is likely to be as precisely controlled as P incorporation, if slightly less easy to achieve.
1 Introduction
1.1 Background
Ever since the transistor was first developed in 1948, dopants have been used to control the characteristics of semiconductor devices. Although a relatively low dopant concentration (1013 atoms cm-3) is sufficient to materially change substrate conductivity each successive reduction of device dimensions has required a corresponding increase in dopant concentration[1]. But concentration is ultimately limited by mutual Coulombic repulsion to about 1020 ions cm-3.
To ensure reliable operation a device requires a statistically significant number (100s or 1000s) of dopant ions in its active region such as the MOSFET channel. If there are too few charge carriers unacceptable performance variations will arise. For example, a channel with dimensions 50x50x10 nm3, comparable with present-day devices, might contain as few as 100 carriers when strongly doped to a concentration of 5x1018 cm-3.
If dopant atoms can be confined to a 2-dimensional sheet with local concentration N2D cm-2 then an equivalent bulk concentration N3D = (N2D)3/2 cm-3 is attained. So, in the MOSFET case a sheet with N = 3x1012 cm-2 placed in the channel conduction region would suffice. This technique requires accurate placement of the dopant atoms and can be achieved by interrupting substrate growth during MBE or CVD. Ultimately, downscaling will require that dopant atoms be individually addressable, rather than manipulated in bulk through the application of charge.
Currently attention is directed towards donor single-dopant devices, and a FET transistor based on a single phosphorus atom on a silicon substrate has been demonstrated[2]. The device is fabricated by Patterned Atomic Layer Epitaxy (PALE) with phosphine doping[3, 4, 5]. In this experiment the bare Si(100) surface is passivated by exposure to atomic hydrogen, forming a monatomic resist. An STM in lithography mode selectively desorbs the resist from a group of three adjacent Si dimers. During exposure to phosphine gas at room temperature three molecules are adsorbed at dimer end positions. Each quickly loses an H ligand which migrates to the opposite dimer end. An annealing phase at 350∘C causes two PH2 species to recombine with H from the gas phase and desorb. As they do so, the H atoms of the remaining PH2 progressively dissociate to the newly-vacant sites leaving a single phosphorus atom on the surface. This is incorporated in a subsequent annealing step, ejecting an Si in the process.
Less progress has been seen with acceptor dopants. The variety of devices which can be fabricated with both p and n-type dopants is much greater than when only p-type is available. These might include p-n junction devices such as the tunnel FET or improved n-type devices that would benefit from an increased barrier potential around active elements e.g. qubit devices.
Historically boron has been used as an acceptor dopant, introduced either by ion implantation or through direct addition to molten silicon. However, it is unsuited to precision PALE application because its diborane precursor is known to promote H desorption from silicon[6, 7]. Its small size would cause a delta-doped layer to be strained[8], causing relatively fast diffusion within bulk Si and tending to smear out atomically precise dopant profiles. Aluminium, adjacent to silicon in the periodic table, may be a better choice. Unfortunately, the phosphine analogue alane (AlH3) is not a useful precursor, existing in a solid crystalline form at room temperature and decomposing at higher temperatures. However, it can be synthesized by evaporating metallic aluminium in a molecular hydrogen stream at low pressures[9]. Alternatively, the amine alanes are donor-acceptor complexes known to be viable precursors in thin film deposition of Al[10]. The trimethylamine complex decomposes in the gaseous phase giving alane and the tertiary amines[11], and it is plausible that this reaction would also be effective in the PALE setting.
This work is motivated by the expectation that Al will emerge as a viable acceptor dopant for Si in the PALE fabrication process. This will complement P donor doping, increasing the range and functionality of molecular devices. The initial goal will be creation of Si structures with embedded delta-doped Al layers.
A survey of all possible adsorption and subsequent dissociation modes of the alane molecule on the Si(100) surface is attempted. Although this might seem to imply many configuration possibilities, the actual number ( 60) remains manageable because the H atoms are required to stay near the initial adsorption site at each dissociation. This approach is similar to that of Warschkow (2005) for phosphine adsorption[12] and reflects the highly selective nature of PALE deposition. The survey reveals the relative stability of each intermediate configuration and the dissociation pathways that are energetically favoured.
2 Methods
2.1 Structural survey
We use DFT to survey all feasible AlHn structures on Si(100). We show a progressive increase in stability as dissociation proceeds and characterize the more stable surface configurations using simulated STM and electron localization plots. A full kinetic analysis will be presented in a subsequent paper[13].
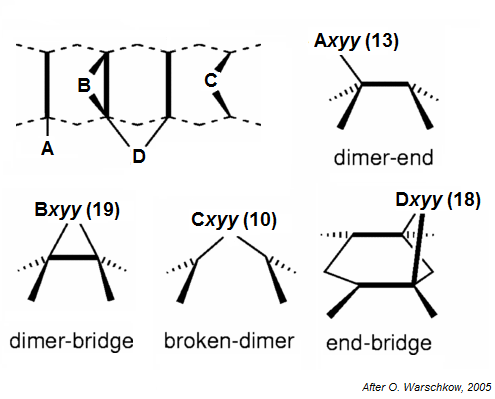
As noted above, the initial adsorption assumes that any required precursor reaction has already occurred and that free alane molecules are available within bonding distance of the substrate. There are four possible initial absorption sites as shown in Figure 1.
2.2 Computational details
All calculations used density functional theory[14], as implemented in the Vienna Ab-initio Simulation Package (VASP versions 5.3.1/5.4.1)[15] with the Perdew-Burke-Enzerhof (PBE) generalised gradient approximation (GGA) exchange-correlation functional[16]. The VASP projector-augmented-wave[17, 18] (PAW) potentials for aluminium, silicon and hydrogen were used. These potentials describe both core and valence electrons and the files (POTCAR) were dated 4/5th January 2001 and 15th June 2001, respectively. We used a 400 eV energy cut-off. This value is required for proper operation of the aluminium PAW pseudopotential.
The convergence criterion for atom forces was set to 0.02 eV/Å and that for total energy to 10-6 eV. These parameters yield relative energies reliable to within 0.02 eV when the Brillouin zone sampling mesh is set appropriately. For the supercell employed here, energy values were found to converge with a 3x3x1 Monkhorst-Pack mesh[19]. These calculations used a quasi-Newton ionic relaxation algorithm.
2.3 Supercell
The Si(100) surface was modelled on a slab of eight Si layers with a c(4x2) surface cell reconstruction, separated by a 12Å vacuum gap. This surface dimension (15.36 Å15.36 Å) has been adopted in other studies of this kind[20] and accommodates two dimer rows of buckled dimers (four in each row) at approximately 18∘ to the surface plane. The relatively large surface supports adsorption configurations spanning adjacent dimer rows. There is less agreement over optimum cell depth, and the chosen value is a compromise that achieves reasonable convergence and acceptable processing times. The experimental bulk Si lattice parameter (5.431Å) was used and is within 1% of the PBE lattice constant. The bottom layer of Si atoms was left in bulk-like positions, terminated with pairs of hydrogen atoms, and fixed.
During optimization a single AlH +(3-x)H ensemble is adsorbed on the surface while the deepest Si and H termination layers are constrained in fixed positions. Dissociation is modelled by progressively detaching atoms from the Al centre and placing them elsewhere on the surface. The energy change at each stage is calculated by:
| (1) |
where is the energy of the clean optimized supercell, the energy of an optimized alane molecule in vacuo and the optimized energy of the supercell including the adsorbed AlHx and dissociated (3-x)H species.
2.4 Electron localization function (ELF)
ELF[21] is a function of the spatial coordinates which is large in regions where electron pair density is high such as covalent bonds and lower in regions of delocalized electronic density. It provides a useful quantitative representation of the chemical bond in molecules and crystals[22], and is employed here to depict interactions. The function can be computed from the orbitals as the definition is:
| (2) | |||||
| (3) | |||||
| (4) |
with the electronic density given by:
| (5) |
and the sums are over the singly-occupied Kohn-Sham (or Hartree-Fock) orbitals . is the probability of finding an electron near a reference electron of the same spin, and is the value of for a homogeneous electron gas. It is interesting to note the same dependency on kinetic energy density (the Laplacian of the orbitals) that occurs in ‘meta-GGA’ functionals e.g. TPSS[23]. The ELF formulation inverts and rescales it with respect to the HEG. A low probability, leading to a high ELF, implies a localized electron and vice versa. A perfectly localized orbital, such as the H2 bonding orbital, would have an ELF of 1. High ELF in an interatomic region can be interpreted as covalent bonding, with any asymmetries attributed to bond polarity. The HEG represents a fully delocalized state with an ELF of 0.5. Values lower than 0.5 can interpreted as nodal accumulations from higher order orbitals occurring in the inter-atomic region. However, the ELF generally passes through zero between local maxima, termed attractors. An isosurface value of 0.8 has proven to be a useful bonding indicator in classical valence compounds.
For the high stability configurations, we show the ELF as contour plots in sections through the supercell. For dimer-end, dimer-bridge and broken-dimer configurations the section is the vertical plane containing the Al atom and the dimer, unless otherwise noted. For the other configurations, the plane is usually horizontal or parallel to the dimer row. The chosen isovalues are separated by an interval of 0.2, with an additional contour in the high ELF region.
A complete set of ELF plots is available on figshare[24].
2.5 Simulated STM images
Simulated STM images can show that a theoretical adsorption configuration has an electronic structure compatible with experimental appearance. Conversely, they can aid the identification of experimental images. Therefore, we provide topographical (constant current) images for the high stability configurations discovered in our survey. These have been prepared using the Tersoff-Hamann approximation[25]as implemented for by the bSKAN 3.3 program[26]. Under this approximation the tunnelling current is proportional to the local density of surface states at the centre of the STM tip, whose own electronic structure is not explicitly modelled.
We show representative simulated surface images for both positive (1.5V) and negative (-2.0V) bias voltages. The positive value indicates current flow into unoccupied surface states (electrons move from tip to surface) and the negative a flow from occupied surface states (electrons move from surface to tip).
A complete set of STM images is available on figshare[24].
3 Results and discussion
3.1 Overview of the entire decomposition pathway
Some 60 configurations were evaluated, showing progressive increase in stability as dissociation proceeds. Figure 2 shows the calculated energies as columns of bars versus the dissociation stage horizontally. Stability of a configuration depends on the nature of the Al-Si bonding, and the local disposition of the adsorbed H atoms. Eight incorporation configurations are shown to demonstrate feasibility of these structures.
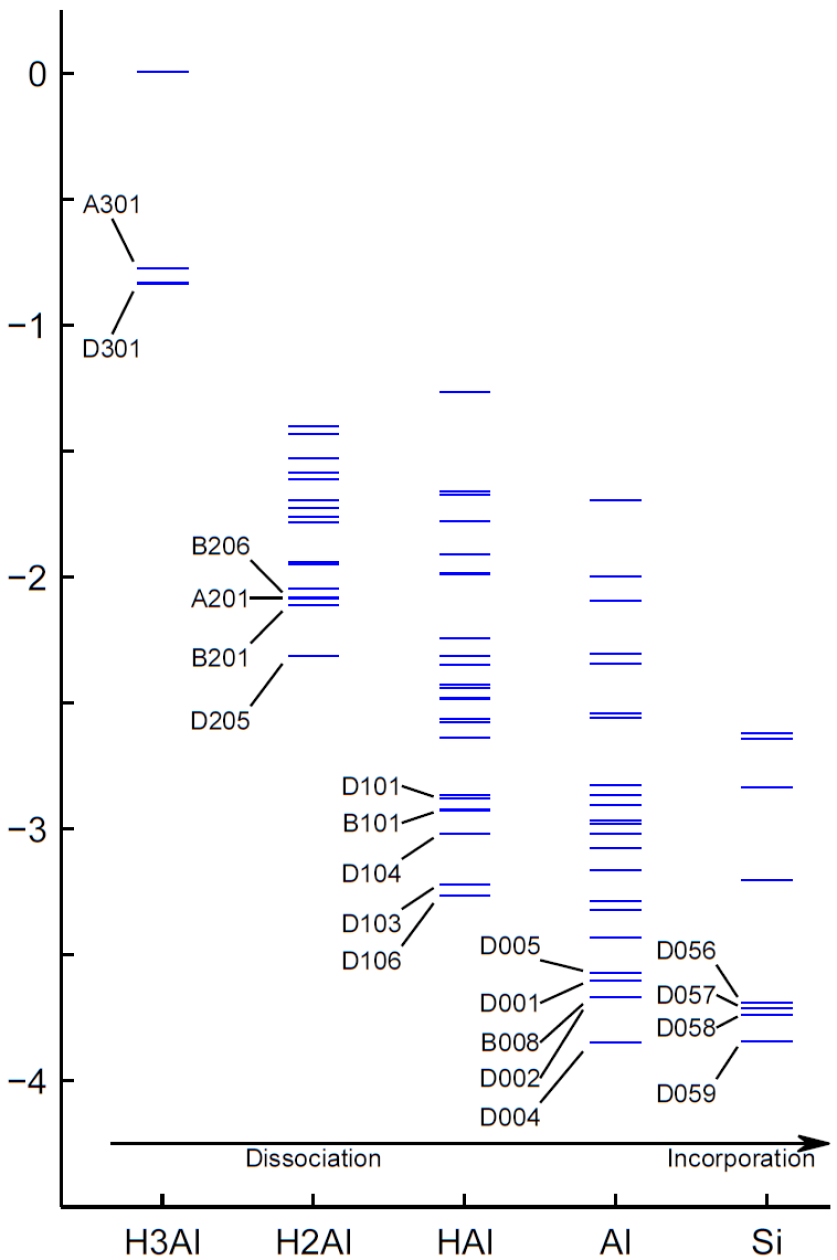
In each group, there are a few structures notably more stable than any other in the same group, and a thermodynamically favoured dissociation pathway is likely to involve these configurations. We have characterized these high stability structures using ELF and simulated STM plots, and show their relative energies and bond lengths in Table 1. Of course, some structures may be rendered inaccessible by kinetic considerations, and an analysis based on DFT NEB (nudged elastic band) calculations will be the subject of another paper[13].
| Config. | E (eV) | Al-Si (Å) | Si-Si (Å) | |
| H3Al: initial adsorption | D301 | -0.84 | 2.58/(4.41) | 2.37/2.36 |
| A301 | -0.78 | 2.61 | 2.39 | |
| B301 | +0.01 | (4.01)/(4.15) | 2.36 | |
| H2Al: first dissociation | D205 | -2.31 | 2.55/2.62 | 2.35/2.40 |
| B201 | -2.11 | 2.45/2.81 | 2.43 | |
| B206 | -2.08 | 2.48/2.54 | 2.54 | |
| A201 | -2.08 | 2.49 | 2.44 | |
| HAl: second dissociation | D106 | -3.27 | 2.49/2.49 | 2.42/2.43 |
| D103 | -3.22 | 2.46/2.51 | 2.38/2.42 | |
| D104 | -3.02 | 2.44/2.58 | 2.37/2.50 | |
| B101 | -2.93 | 2.40/2.43 | 2.48 | |
| A103 | -2.49 | 2.58/2.63 | 2.48/2.52 | |
| C106 | -2.24 | 2.43/2.46 | (3.90) | |
| Al: third dissociation | D004 | -3.85 | 2.48/2.49 | 2.42/2.46 |
| D002 | -3.67 | 2.47/2.47 | 2.41/2.42 | |
| B008 | -3.67 | 2.42/2.60/2.63 | 2.40/2.53 | |
| D001 | -3.60 | 2.46/2.47 | 2.42/2.42 | |
| D005 | -3.57 | 2.48/2.48 | 2.38/2.39 | |
| A001 | -3.28 | 2.61 | 2.41 | |
| C004 | -3.07 | 2.37/2.38 | (4.75) | |
| Si: incorporation | D059 | -3.84 | 2.42/2.42/2.44 | |
| D058 | -3.74 | 2.39/2.39/2.44 | ||
| D057 | -3.71 | 2.39/2.39/2.45 | ||
| D056 | -3.69 | 2.40/2.40/2.47 | ||
| C050 | -3.29 | 2.40/2.41/2.45 |
3.2 The Si(100) surface
Figure 3 shows ELF and simulated STM output for the bare, reconstructed Si(100) surface. The alternately buckled dimers are 0.2 eV more stable than when parallel to the surface plane and are the most stable reconstruction possible. At ambient temperatures, the dimers ‘flip’ at a rate greater than the STM can accommodate, and so the STM images shown may not be observed. However, the presence of an adsorbing Al or H atom will be sufficient to ‘pin’ the dimer in the buckled configuration, justifying use of the reconstruction.
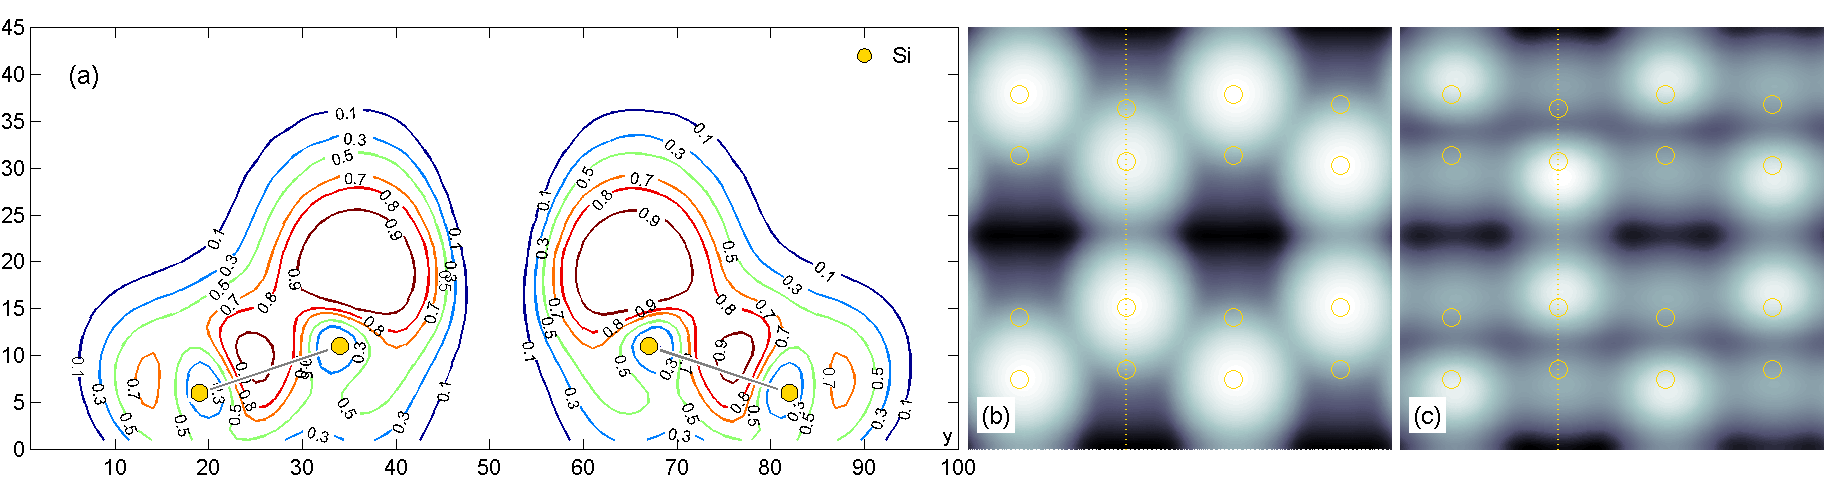
The STM filled state plot shows that reconstruction eliminates one dangling bond and concentrates electronic density at the ‘up’ dimer end, and dimer length is found to be 2.36 Å in this supercell. The filled state STM plot shows the DOS centred on the surface atoms. As the ELF is determined over occupied states it might be expected to correspond with the filled-state STM image, although no theoretical basis has been established for this. However, the plot reveals large attractor regions above the ‘up’ dimer ends with ELF values exceeding 0.9, characteristic of a non-bonding (lone) electron pair.
3.3 Initial adsorption: H3Al Si(100)
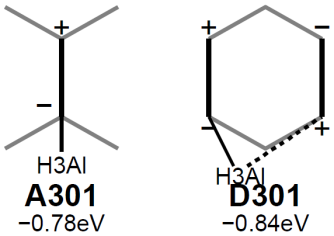
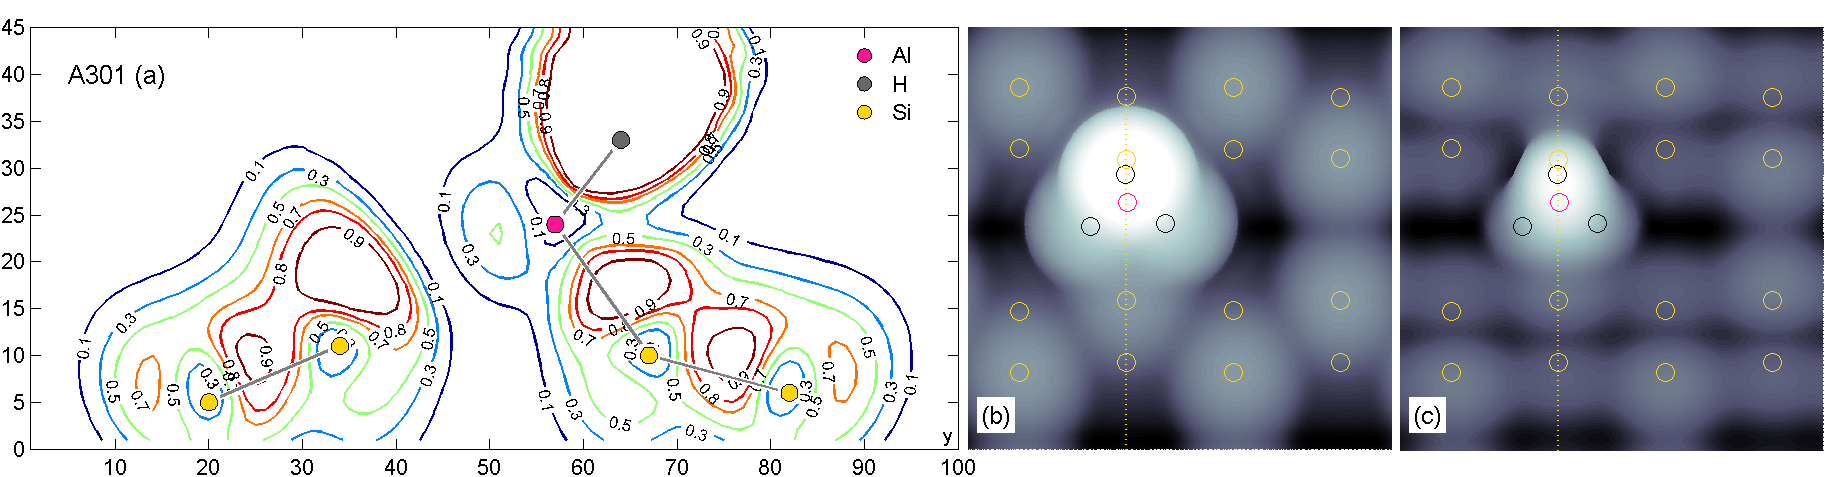
Stable configurations were discovered at dimer-end, dimer-bridge and end-dimer sites. No stable broken-dimer configuration was found, with an H atom tending to detach and migrate to the adjacent dimer row or adopt a central position ‘buried’ beneath the dimer. The dimer-bridge configuration (B301) showed a slight surface repulsion and was not considered further. Figure 4 shows the two remaining structures and their relative energies and Figure 5 shows the ELF plot and simulated STM images for the dimer-end configuration A301 where a bond with stability -0.78eV was found with the up-atom and the Al atom in pyramidal coordination. No bonding was possible with the down-atom.
Alane has six electrons in its valence shell and can accept a further two to complete its octet. These are provided by the excess electronic density at the surface dimer ‘up’ end, and form a dative bond with alane acting as a Lewis acid and the substrate as Lewis base. The Al-Si bond length of 2.61 Å obtained here can be compared with 2.08 Å calculated for the dative Al-N bond in ammonia alane[27]. Although both have sp3 hybridization the latter has greater s character due to the H ligands of the ammonia. This, together with the greater electronegativity of the nitrogen atom, account for the shorter Al-N bond. However, the ELF plots of Figures 3 and 5 are consistent with the Lewis adduct model.
The adduct model implies that the end-bridge configuration possessing two surface bonds is unfeasible. This was confirmed by our optimization of configuration D301 which resulted in an asymmetrical configuration with only one bond substrate bond (see Table 1) and the ELF plot (not shown) confirmed the presence of just a single bond. The increased stability (0.06 eV) compared with the dimer-end configuration is due to a relative rotation of the alane molecule which was not explored during the optimization of the dimer-end configuration.
These results show the initial alane adsorption modes are analogous to those of phosphine, which bonds into the ‘down’ atom at dimer-end sites, but is unstable in the dimer-bridge, broken-dimer and end-bridge configurations[12].
3.4 First dissociation: H2Al+H Si(100)
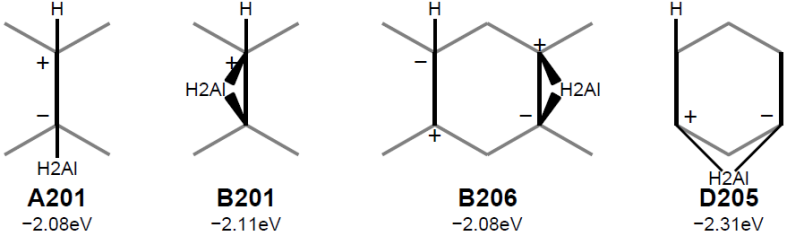
At this stage the high stability configurations show energies decreasing by 1.3-1.5 eV below the initial adsorption, with end-bridge configuration D205 the most stable, as shown in Figure 6. In the absence of kinetic barriers, these large margins suggest the initial configurations will be relatively short-lived on the surface. The end-dimer A201 and end-bridge D205 configurations were the most stable of their kind by margins of 0.3 and 0.5 eV respectively but two dimer-bridge configurations B201 and B206 had similar energies, differing only in the placement of the migrating H atom. A broken-dimer configuration appeared with the H atom placed beneath the dimer level in an apparently three-centred bond, but it was at least 0.5 eV less stable than the high stability group and not considered further. Figure 7 shows the ELF plots and simulated STM images for configurations A201, B206 and D205.
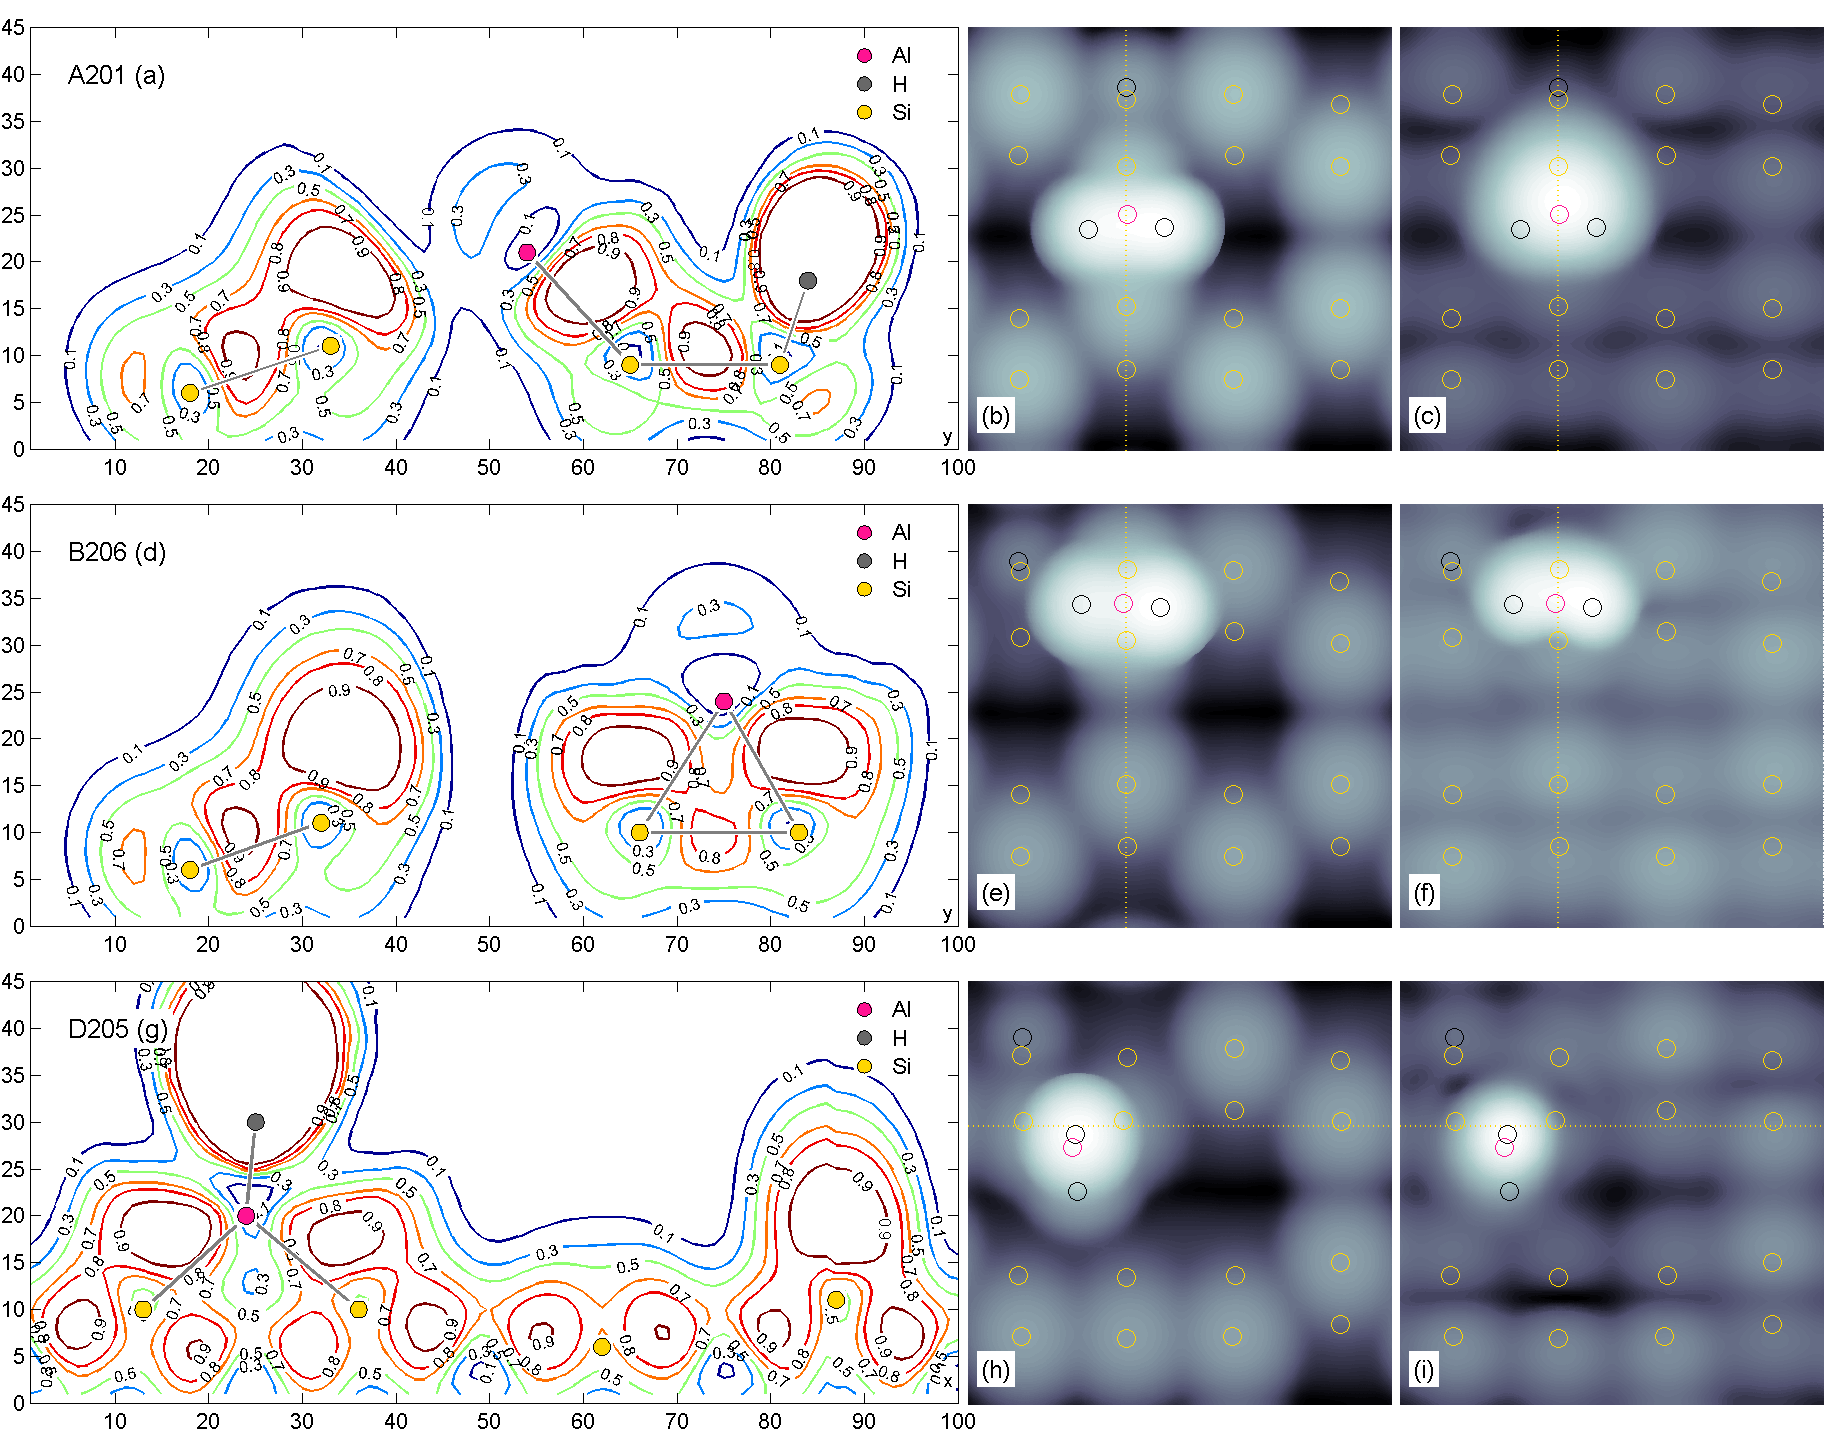
The end-dimer configuration A201 has the Al atom in trigonal planar coordination and an Al-Si bond of length of 2.49 Å, noticeably shorter than that of the A301 configuration. We surmise that the ligands, now having predominantly sp2 hybridization, provide improved overlap with the surface orbitals. This can be seen in the ELF plot as an enlarged inter-nuclear region with value 0.9 or greater. The effect of the adsorbed H on the down-dimer atom is to level the dimer, with both atoms making 2-centre, 2-electron bonds.
In the dimer-bridge and end-bridge configurations, Al adopts a tetrahedral configuration, although the bond angles are far from ideal. The end-bridge configuration is the more stable by a margin of 0.2 eV. In the dimer-bridge cases, B201 and B206, the Si-Si dimer bond lengths are 2.43 Å and 2.54 Å respectively, with both surface atoms making 2-centre, 2-electron bonds with the metal. In the end-bridge configuration D205 the dimer bond lengths are 2.35 Å and 2.40 Å, closer to the bare surface value and indicating that the stability gain occurs through sharing the adsorption stress across surface dimers.
3.5 Second dissociation: HAl+2H Si(100)
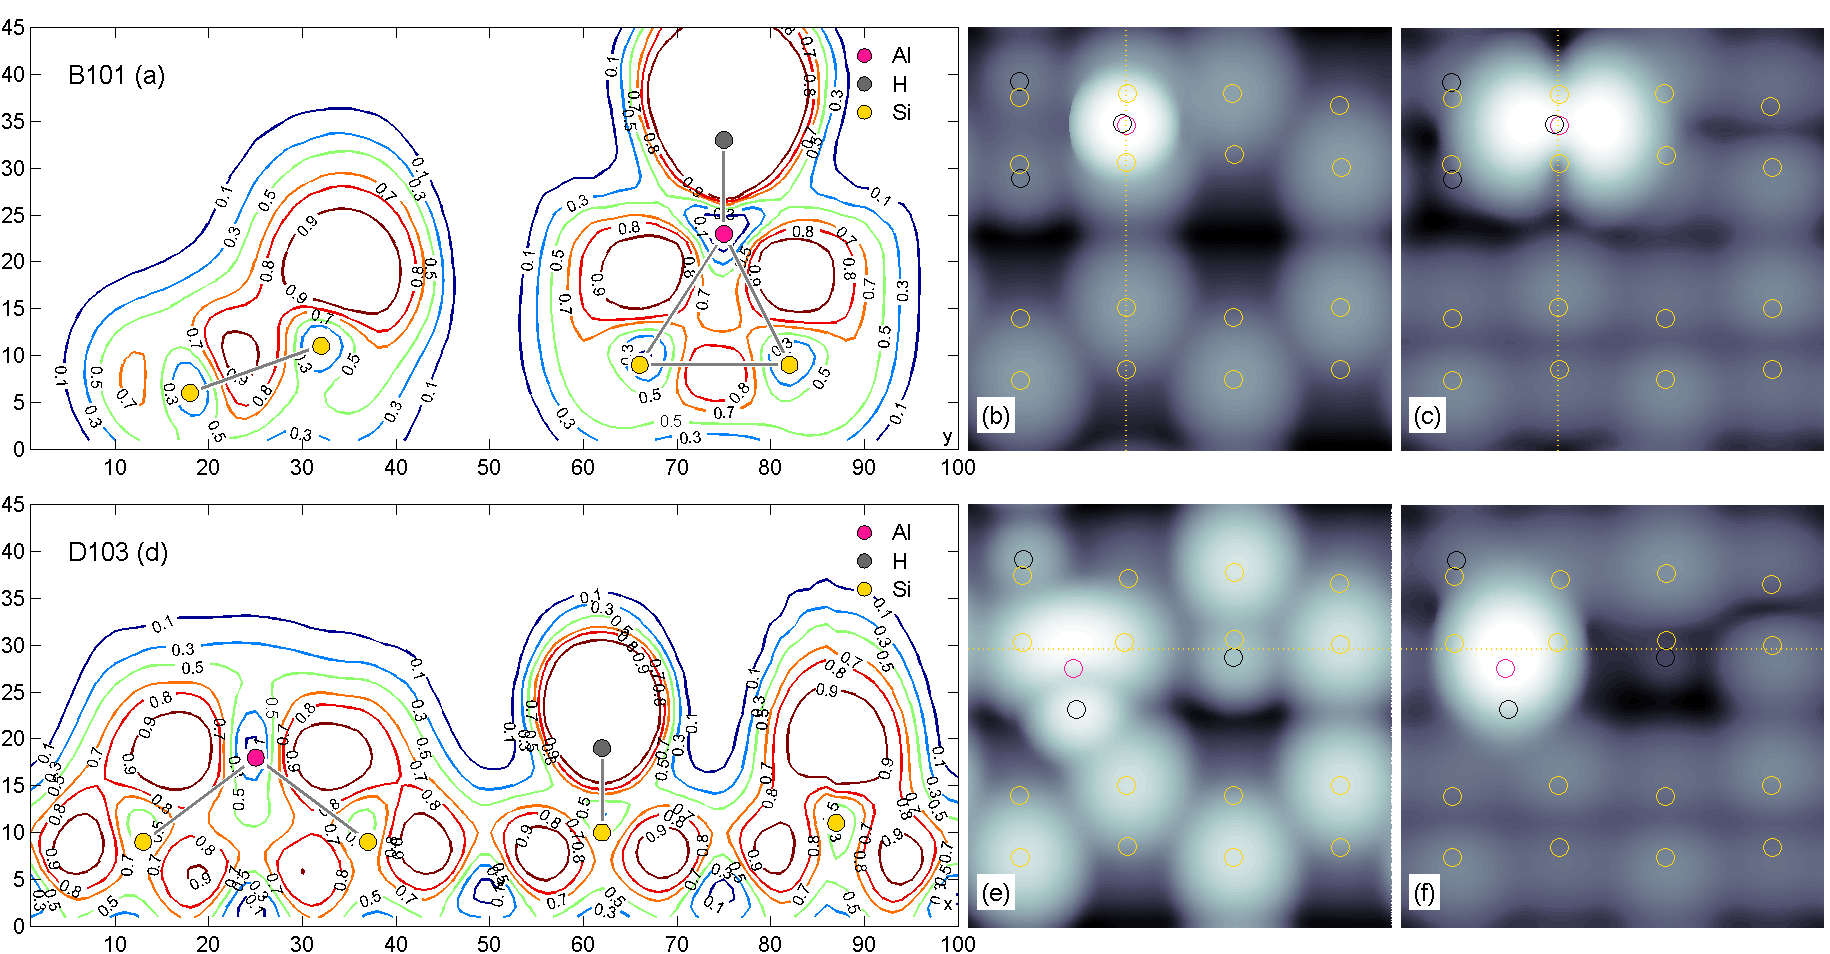
The loss of a further H ligand increased stability by up to 0.9 eV, depending on the surface configuration. In the absence of significant kinetic barriers, this energy loss would prompt dissociation in the PALE environment. The high stability configurations are all end or dimer-bridge (see Figure 8); these are the configurations likely to appear on a pathway towards complete dissociation and incorporation. We take D103 as representative of the end-bridge configurations and show ELF plots and simulated STM images for B101 and D103 in Figure 9.
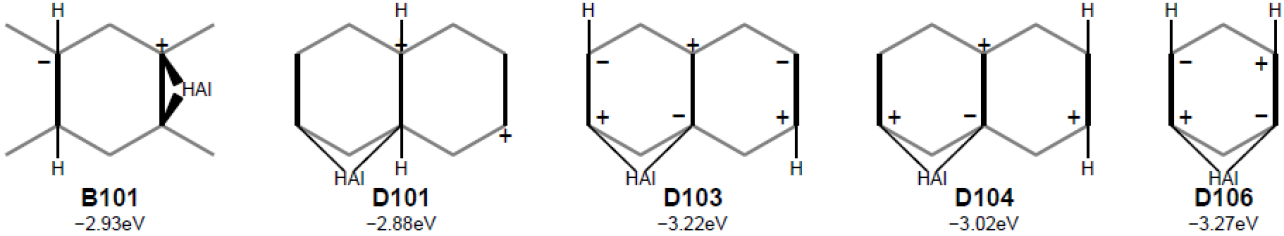
The ELF plots are like those of the bridged configurations of the previous stage (see Figure 7) with the Al atom now adopting a trigonal planar, rather than a tetrahedral coordination. In the dimer-bridge case B101 the adsorbate bonds shorten to 2.40 Å and 2.43 Å compared to 2.48 Å and 2.54 Å in B206, allowing the dimer bond to shorten to 2.48 Å from 2.54Å. This improved bonding can be attributed to the increased s character of the adsorbate bonds feeding into the dimer bond. As before, the sharing of surface stress in the end-bridge configuration D103 is responsible for its additional (0.3 eV) stability.
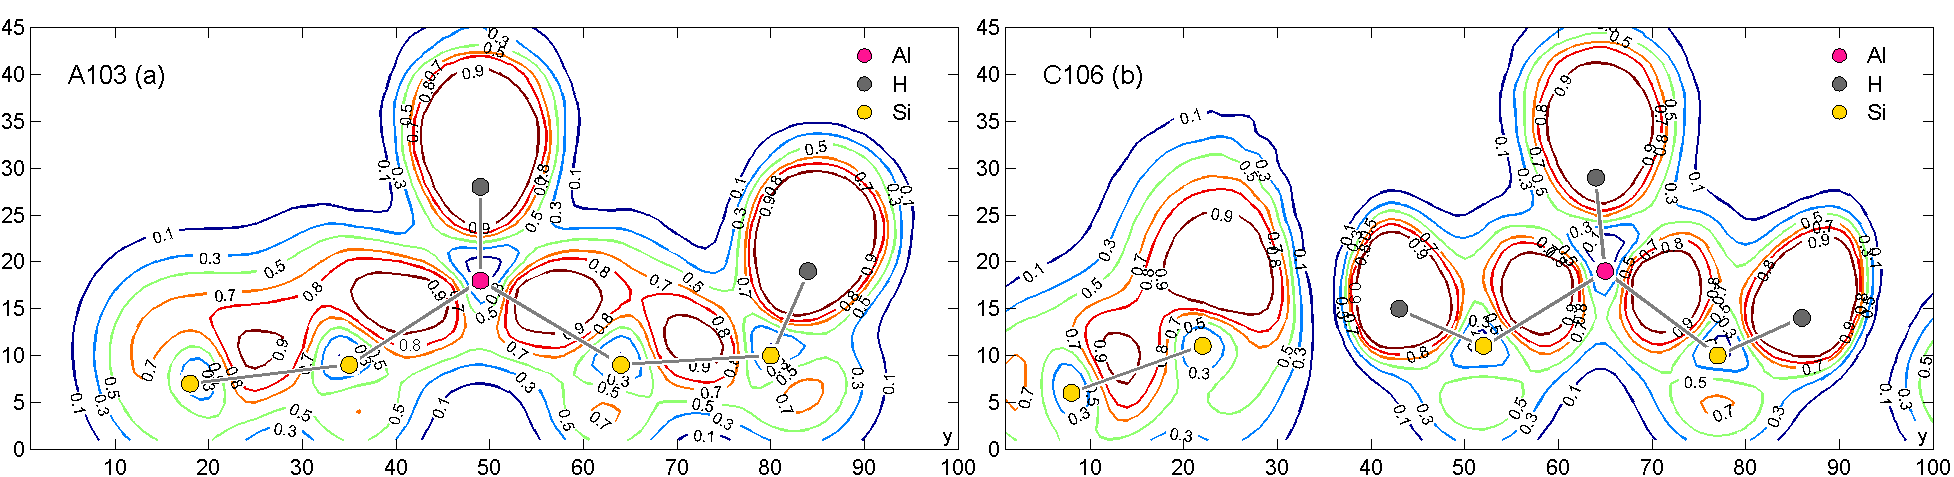
The most stable end and broken-dimer configurations are almost 0.5 eV less stable, and are depicted in Figure 10. Although their relative stabilities indicate they are unlikely to participate in a dissociation pathway they are of interest because they show the HAl fragment preserving a trigonal planar coordination with the substrate surface.
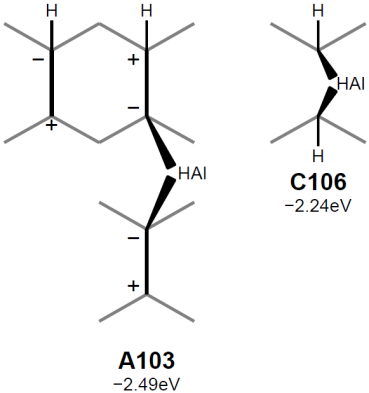
The corresponding ELF plots are shown in Figure 11. Configuration A103 in Figure 11(a) shows the Al atom located in a trigonal planar coordination between dimer rows, bridging to an up-dimer atom in each. Although the Si-Al-Si bond angle is a near perfect 119∘ the lack of stability is due to the elongated adsorbate and Si-Si dimer bonds of this configuration (Table 1). Similar results were seen in several other bridged-row configurations in the survey. In the broken-dimer configuration C106 (b) the Al-Si bonds are shorter but loss of the Si-Si dimer bond outweighs any gain in stability.
3.6 Third dissociation: Al+3H Si(100)
27 configurations were examined; all types were represented but the eight most stable were all the end or bridged-dimer variety. The most stable configuration D004 gains approximately 0.6 eV stability over its counterpart at the previous stage; a smaller energy loss than was seen in the first and second dissociations. Several configurations in the survey had increased energies, reflecting the reduced coordination possibilities available at this stage. The five most stable configurations span an energy range of less than 0.2 eV and are depicted in Figure 12.
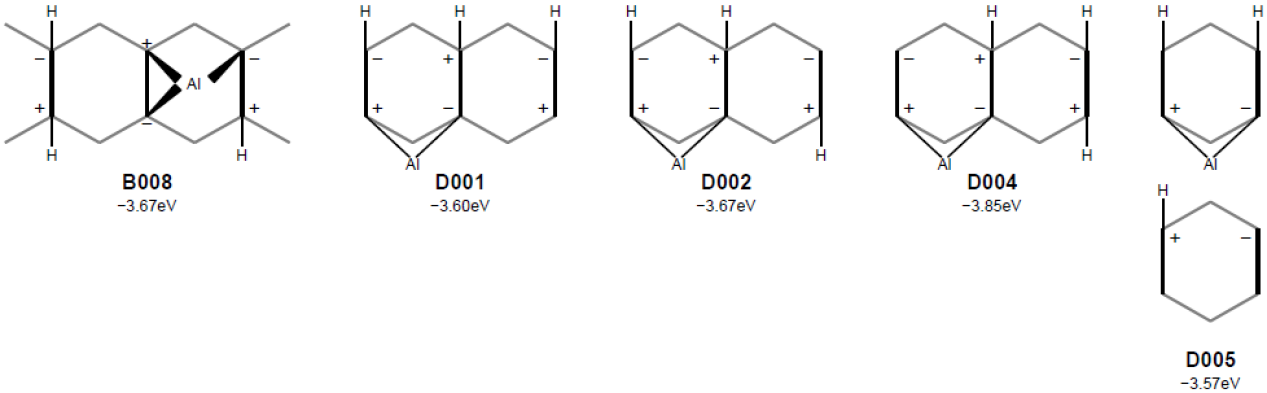
After optimization, the dimer-bridge configuration B008 had the Al adatom located between adjacent dimers, adopting a trigonal pyramidal coordination with three surface bonds. To illustrate this the ELF plot Figure 13(a) is taken in the horizontal plane containing the Al atom, above the dimers and at roughly the same elevation as nearby H atoms. Attempts to induce a square planar Al configuration, with four surface bonds and no surface H were unsuccessful. The bright STM images in the unfilled state images Figures 13(c) and (f) reflect the adsorbate’s vacant p orbital in this coordination.
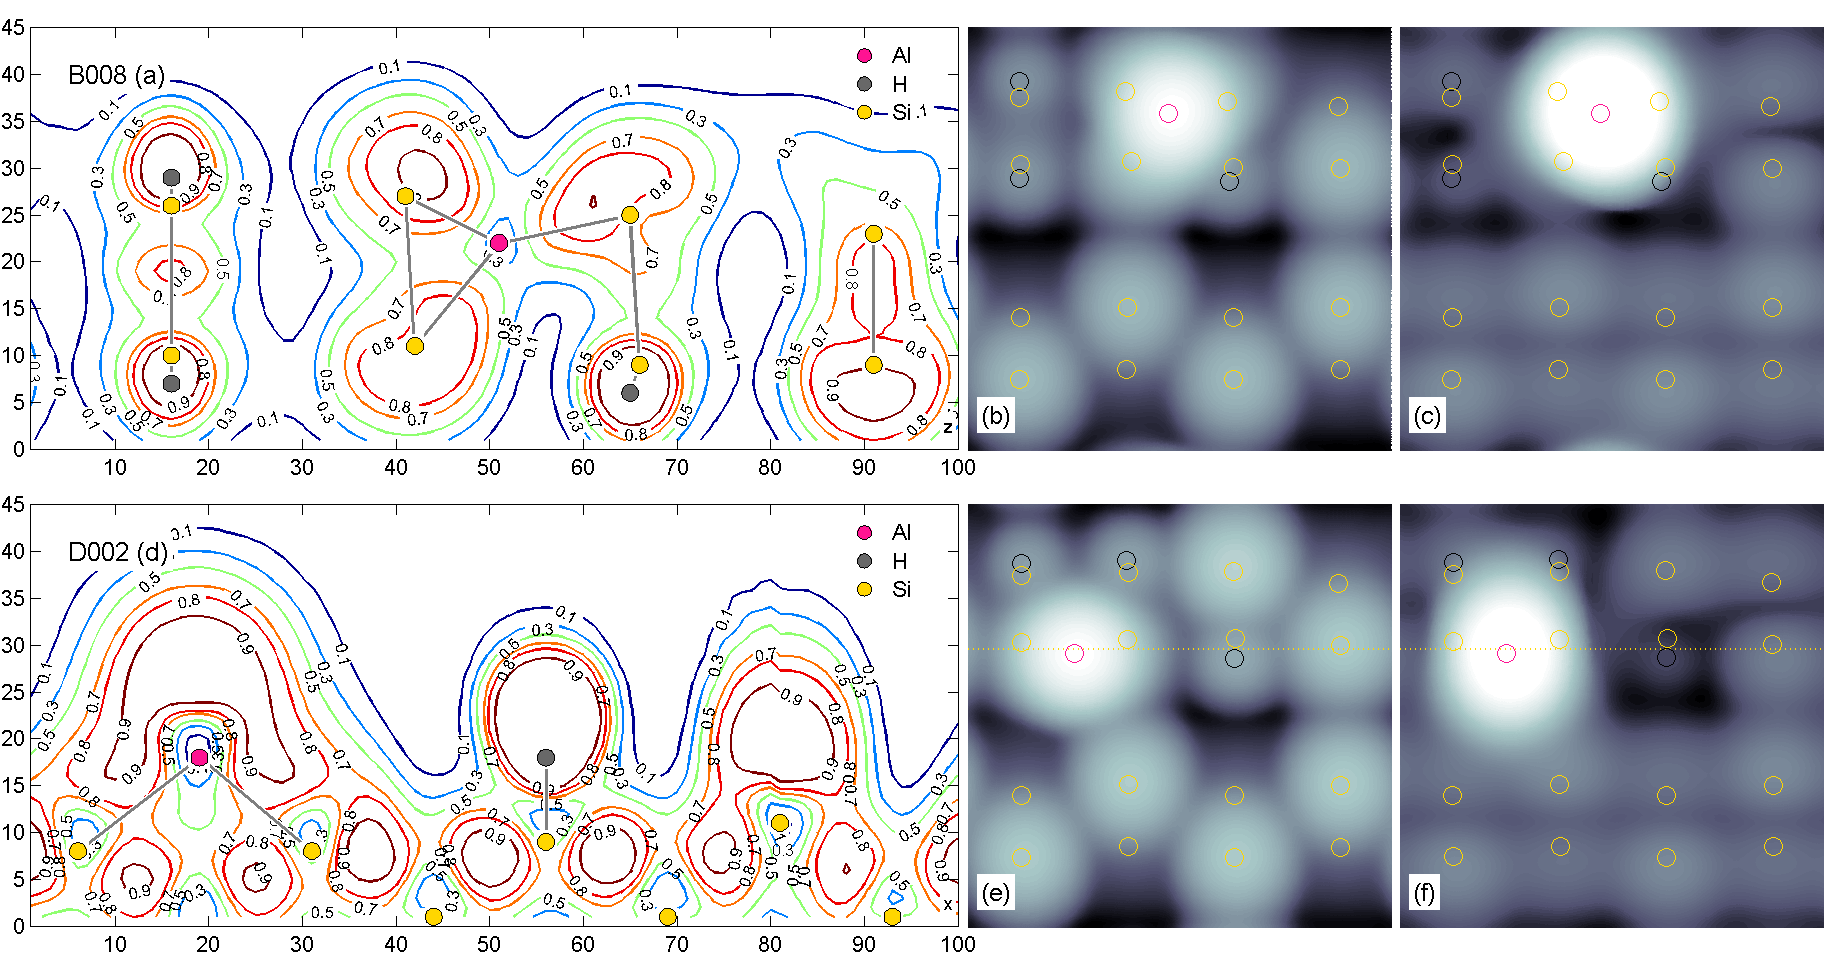
The four end-bridge configurations D001, D002, D004 and D005 are similar in character, differing in H placement only, and we take D002 as representative. ELF and simulated STM images for this configuration are shown at Figure 13(d), (e) and (f). The ELF plot Figure 13(d) is taken perpendicular to the surface and shows the Al adatom in trigonal planar coordination with two surface bonds and a large hybridized lone-pair region above.
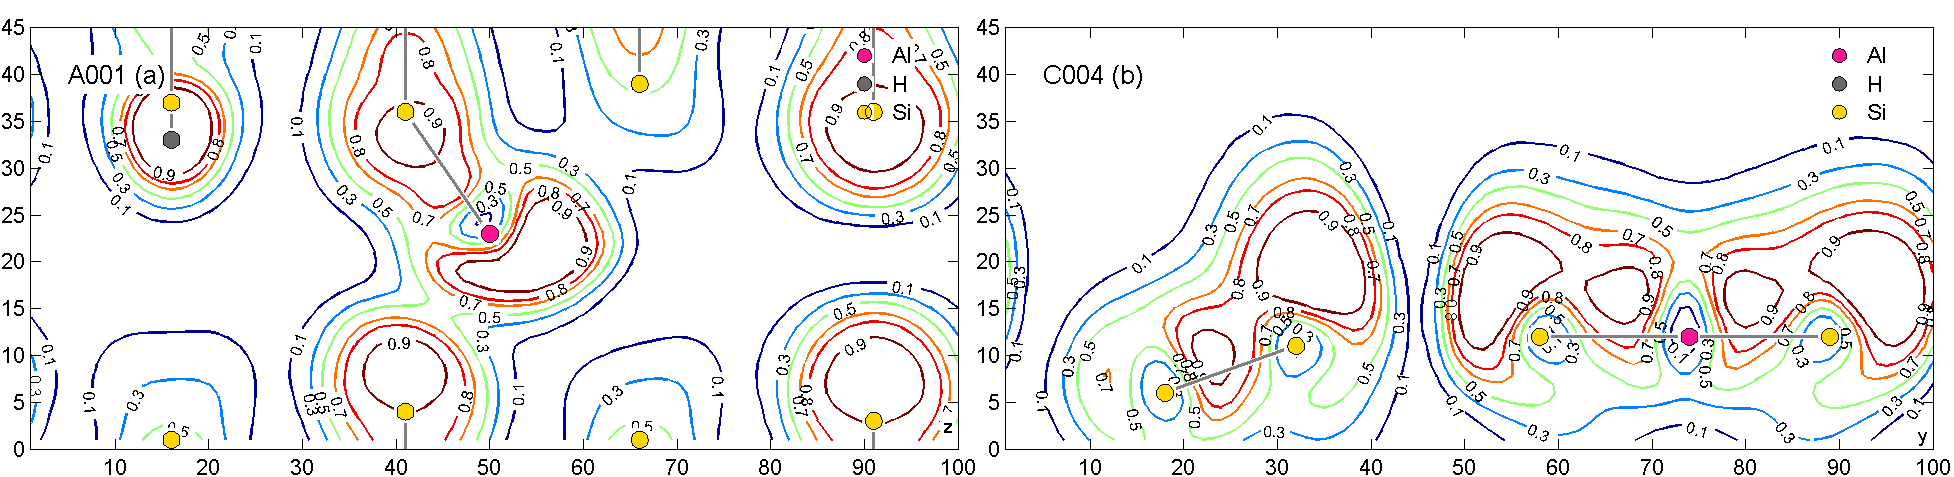
The most stable end (A001) and broken-dimer (C004) configurations are shown schematically at Figure 14. Configuration A001 has Al and three H atoms adsorbed on adjacent dimers, saturating them. The corresponding ELF plot at Figure 15(a) shows the Al veering along the trench between the dimer rows, but not bridging them as was seen for configuration A103 (Figure 11(a) above). Here the Al-Si bond length of 2.61 Å is identical to that found in the initial adsorption case A301 with similar lengths in the respective Si-Si dimers (Table 1). This suggests the same dative covalent character for the surface bond, with the unpaired Al valence electrons arranging themselves to maximize mutual repulsion. However, the single surface bond means that the configuration 0.3 eV less stable than any of the bridged modes. Several other mid-trench configurations were tried, but none proved particularly stable.
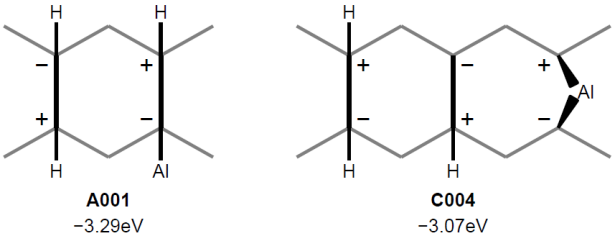
The broken-dimer configuration C004 at Figure 15(b) has a perfectly linear Al coordination with predominantly sp hybridization with Al-Si bond lengths of 2.37 Å, the shortest in the survey. It is interesting that this is a minimum energy configuration even though the Al-Si bonds do not pass through the regions of highest ELF. However, elimination of the surface dimer prevents any gain in overall stability, yielding a configuration 0.5 eV less stable than any bridged mode at this stage.
3.7 Incorporation
In the PALE process the surface reaction terminates when all unpassivated bonding sites become occupied, either by precursor fragments or hydrogen adatoms. The dopant atoms must then be incorporated into the surface as Si-Al heterodimers, prior to the deposition of further Si layers. The replacement of an Si-Si dimer by the heterodimer involves the breaking of surface bonds and requires elevated temperatures. Successful incorporation would result in the appearance of ejected Si atoms as surface adatoms and could be confirmed by STM examination. After ejection from the surface the Si adatom could reside in any one of the three bridged sites B, C or D and a systematic survey of all heterodimer structures having three adsorbed H, an incorporated Al and an Si adatom is beyond the present scope. Instead we have optimized a small number of configurations of each type to illustrate the energetics of Al incorporation.
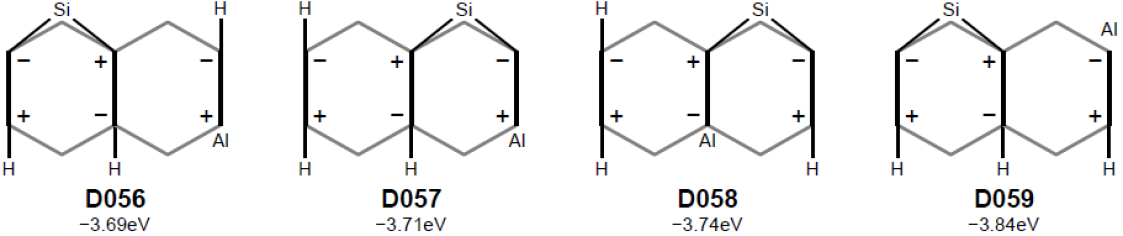
We examined eight incorporation configurations. Each has an ejected Si adatom with two surface bonds and an incorporated Al forming a Si-Al heterodimer. Their relative energies appear in Table 1 and are represented graphically in the rightmost column of Figure 2. The four configurations with the greatest stability were of the end-bridge variety and are shown schematically at Figure 16. They differ only in the placement of H atoms and fall within a 0.15 eV energy span. The most stable (D059, -3.84 eV) has almost the same stability (E = 0.004 eV) as configuration D004 at the final stage of dissociation. This margin is less than DFT accuracy and would result in a theoretical 50% incorporation assuming both states were equally stable and both kinetically accessible.
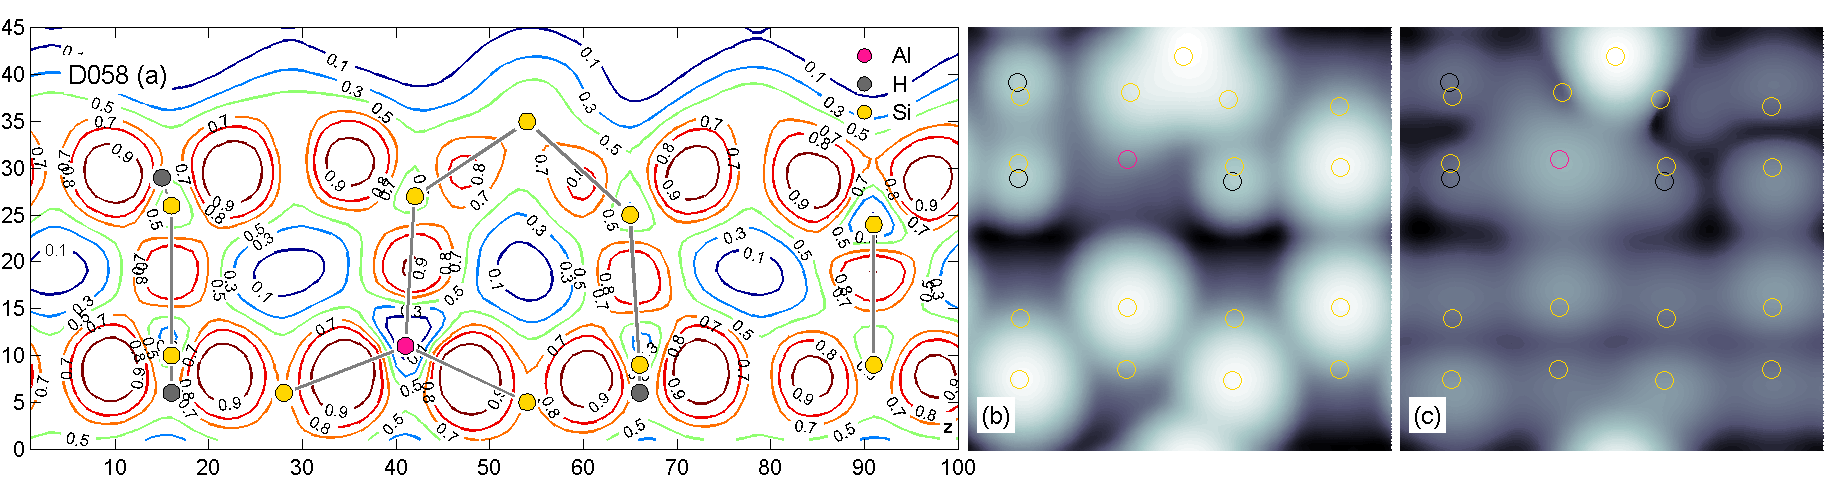
We take configuration D058 as representative and show ELF and simulated STM plots at Figure 17. Although the Al atom replaced an ‘up’ Si it becomes the ‘down’ atom after incorporation. It has a pyramidal coordination with two subsurface bonds of length 2.39 Å and the heterodimer of 2.44 Å. The adjacent dimers are levelled. The ELF plot Figure 17(a) confirms the covalent character of these bonds. The filled-state STM image Figure 17(b) shows the absence of a dangling bond.
4 Conclusion
We have used DFT to study the structure and energetics of the AlHx species which come from the adsorption and dissociation of AlH3 on the Si(100) surface, also considering several incorporation scenarios. We find a progressive, though declining, gain in stability as the dissociation and incorporation proceeds. The initial surface bond is dative and tetrahedral with the adsorbate fragment adopting trigonal geometries as dissociation proceeds. At each stage, we have identified high stability structures likely to occur on any dissociation pathway, and find that dimer bridging dominates. We have characterized each structure using ELF plots and simulated STM images to aid experiment.
The energetics indicate that decomposition should be as easy to achieve as that of PH3 on Si(001); in a forthcoming paper[13], we will discuss the kinetic barriers between the dissociation fragments described here. Overall, the energetics of the incorporated Al are close to those of the Al adatom, in contrast to P which continues to stabilise with incorporation. Nevertheless, there is good reason to expect at least 50% incorporation from Al adatoms, which may be further aided by kinetic effects.
The ability to incorporate acceptor dopants as well as donors in Si(001) with atomic precision will significantly advance the capabilities of patterned ALE. It opens the possibility of p-n junctions fabricated with atomic precision, as well as local control of the electrostatic potential using both positive and negative dopant ions. We keenly anticipate experimental measurements of these structures as a first realisation of this.
5 Acknowledgements
The authors acknowledge useful discussions with James Owen and John Randall of Zyvex Labs.
The authors acknowledge the use of the UCL Grace High Performance Computing Facility (Grace@UCL), and associated support services, in the completion of this work.
References
- [1] Dennard R H, Gaensslen F H, Rideout V L, Bassous E, and LeBlanc A R 1974 IEEE J. Sol. Stat. Circuits 5 256
- [2] Fuechsle M, Miwa J A, Mahapatra S, Ryu H, Lee S, Warschkow O, Hollenberg L C L, Klimeck G, and Simmons M Y 2012 Nature Nanotechnology 7 242
- [3] Lyding J W, Abeln G C, Shen T C, Wang C, and Tucker J R 1994 J. Vac. Sci. Technol. B 12 3735
- [4] Owen J H G, Ballard J, Randall J N, Alexander J, and Ehr J R V 2011 J. Vac. Sci. Technol. B 29 06F201
- [5] Shen T C, Wang C, Abeln G C, Tucker J R, Lyding J W, Avouris P, and Walkup R E 1995 Science 268 1590
- [6] Lew K K, Pan L, Bogart T E, Dilts S M, Dickey E C, and Redwing J M 2004 Appl. Phys. Lett. 85 3101
- [7] Perrin J, Takeda Y, Hirano N, Takeuchi Y, and Matsuda A 1989 Surf. Sci 210 114
- [8] Sarubbi F, Scholtes T L M, and Nanver L K 2010 J. Elec. Mater. 39 162
- [9] Breisacher P and Siegel B 1964 J. Am. Chem. Soc 86 5053
- [10] Jones A C and Hitchman M L, editors 2009 Chemical Vapour Deposition: Precursors, Processes and Applications RSC Publications
- [11] Gladfelter W L, Boyd D C, and Jensen K F 1989 Chem. Mater. 1 339
- [12] Warschkow O, Wilson H F, Marks N A, Schofield S R, Curson N J, Smith P V, Radny M W, McKenzie D R, and Simmons M Y 2005 Phys. Rev. B 72 125328
- [13] Smith R L and Bowler D R 2017 in preparation
- [14] Kohn W 1999 Rev. Mod. Phys 71 1253
- [15] Kresse G and Fürthmüller J 1996 Phys. Rev. B 54 11169
- [16] Perdew J P, Burke K, and Ernzerhof M 1996 Phys. Rev. Lett. 77 3865
- [17] Blochl P E 1994 Phys. Rev. B 50 17953
- [18] Kresse G and Joubert D 1999 Phys. Rev. B 59 1758
- [19] Monkhorst H J and Pack J D 1976 Phys. Rev. B 13 5188
- [20] Brazdova V and Bowler D R 2011 Phys. Chem. Chem. Phys. 13 11367
- [21] Becke A D and Edgecombe K E 1990 J. Chem. Phys. 92 5397
- [22] Savin A, Nesper R, Wengert S, and Faessler T F 1997 Angew. Chem. Int. Ed. Engl. 36 1808
- [23] Tao J, Perdew J P, Staroverov V, and Scuseria G E 2003 Phys. Rev. Lett. 91 146401
- [24] Smith R L and Bowler D R 2017 Doi:10.6084/m9.figshare.c.3727687
- [25] Tersoff J and Hamann D R 1985 Phys Rev B 31 805
- [26] Hofer W A 2003 Prog. Surf. Sci 71 147
- [27] Marsh C M B, Hamilton T P, Xie Y, and III H F S 1995 J. Chem. Phys. 99 14309