Electron-phonon scattering effects on electronic and optical properties of orthorhombic GeS
Abstract
Group-VI monochalcogenides are attracting a great deal of attention due to their peculiar anisotropic properties. Very recently, it has been suggested that GeS could act as a promissory absorbing material with high input-output ratios, relevant features for designing prospective optoelectronic devices. In this work, we use the ab-initio many body perturbation theory to study the role of the electron-phonon coupling on orthorhombic GeS. We identify the vibrational modes that efficiently couple with the electronic states responsible for giving rise to the first and second excitonic state. We also study the finite-temperature optical absorption and show that even at , the role of the electron-phonon interaction is crucial to properly describe the main experimental excitation peaks position and width. Our results suggest that the electron-phonon coupling is essential to properly describe the optical properties of the monochalcogenides family.
I Introduction
Layered materials have become prospective platforms for a next generation of technological devices due to their widely tunable physical properties.Geim and Grigorieva (2013); Wang et al. (2014) Their potential applications include optoelectronic,Buscema et al. (2015) photovoltaic,Furchi et al. (2014); Britnell et al. (2013) and thermoelectricZhao et al. (2014); Ding et al. (2015) properties. Besides the well-characterized hexagonal layered crystals such as: graphite,Senguptaa et al. (2011) boron nitride,Paine and Narula (1990); Pakdel et al. (2014) and transition metal dichalcogenides,Jariwala et al. (2014); Wang et al. (2012) recently, black phosphorus (BP)Castellanos-Gomez (2015); Ling et al. (2015) and group-VI monochalcogenides (GeS, GeSe, SnSe, and SnS)Gomes and Carvalho (2015); Singh and Hennig (2014) have gained renewed attention, fundamentally, as a direct consequence of their unique anisotropic properties. These layered materials possess an orthorhombic crystalline structure (Pnma space group) with a puckered atomic arrangement. This peculiarity gives rise to well-defined zigzag and armchair directions that are crucial in determining a number of interesting phenomena.Ribeiro et al. (2016); Villegas et al. (2016a); Xia et al. (2015); Zhao et al. (2014); Qin et al. (2016); Villegas et al. (2016b)
Orthorhombic GeS exhibits an optical gap of 1.65 eVEymard and Otto (1977) that, together with its low toxicityLatiff et al. (2015) and stability under normal conditions -superior to the one observed in BPLattif et al. (2015); Favron et al. (2015)- represents an appealing candidate for optoelectronic applications. In fact, a recent report indicates that GeS-based photodetectors could provide high ratios of external quantum efficiency and detectivity that are comparable with the ones found in current commercial photodetectors.Ulaganathan et al. (2016) In addition, it has been suggested that GeS could also have thermoelectric potential due to low values of thermal conductivity.Ding et al. (2015) These potential applications, highly temperature dependent, exhort to a comprehensive understanding of the finite-temperature properties of GeS.
While extensive experimental characterization of GeS, including optical measurements, have been carried out,Eymard and Otto (1977); Logothetidis et al. (1986); Hsueh et al. (1996); Cháb and Bartos (1984); F. Lukes (1981) ab-initio calculations of its fundamental properties are yet scarce. Albeit the accurate prediction of GeS vibrational properties,Hsueh et al. (1996) the prediction of its optical spectrum still present some discrepancies.Makinistian and Albanesi (2011); Gomes and Carvalho (2015); Tuttle et al. (2015); Makinistian and Albanesi (2006) For instance, Makinistian and Albansi,Makinistian and Albanesi (2011) studied the optical properties of GeS using different light-polarizations and pressures. Nonetheless, the authors used advanced methodologies based on the Bethe-Salpeter equation (BSE) combined with many-body perturbation theory (MBPT), their calculations fail in predicting the relative exciton intensities and peak positions. This is likely a consequence of comparing their results with finite temperature measurements. As a common feature, other state-of-the-art optical studies on GeSGomes and Carvalho (2015); Tuttle et al. (2015); Makinistian and Albanesi (2006) consider atoms frozen in their equilibrium positions thus neglecting the role of the electron-phonon (EP) interaction. Without including the EP interaction, temperature effects can not be described. Even at the electronic states can be strongly renormalized by the quantum nature of atoms, this is the quantum zero-point motion (ZPM) effect.Cannuccia and Marini (2011); Giustino et al. (2010)
From the discrepancies between experiments and current levels of theory one can conclude that the electron-phonon (EP) coupling plays a non-trivial role in GeS. In addition, the EP coupling could also play an important role in the entire family of monochalcogenide crystals. This is supported by recent theoretical works addressing the finite-temperature effects of semiconductors through the inclusion of EP coupling.Kawai et al. (2014); Marini (2008); Molina-Sánchez et al. (2016); Zacharias et al. (2015); Poncé et al. (2015)
In fact, it is well-known that lattice vibrations can affect the optical properties of semiconductors leading to changes in the exciton peak position, linewidth and selection rules.Cardona and Thewalt (2005); Yu and Cardona (2010); Shokhovets et al. (2014) Therefore, it is important to include temperature effects on the state-of-the-art simulations to better describe the optical properties and to elucidate the dynamics of the EP scattering mechanisms.
In this work, we provide a theoretical description of the effect of the EP coupling on the electronic and optical properties of orthorhombic GeS. We clearly identify the most important phonon modes that efficiently couple with the electronic states responsible for giving rise to the first and second excitonic states. Our results show that, at the band-edge, the infrared longitudinal mode is the main scattering source for the electronic states. This mode also couples efficiently with the first excitonic state. In contrast, the electronic states giving rise to the second excitonic state couples mostly with modes and . We also calculate the finite-temperature optical absorption and shown that even at , the role of EP coupling is crucial to better describe the absorption linewidth and exciton peak positions.
II Theory and Methodology
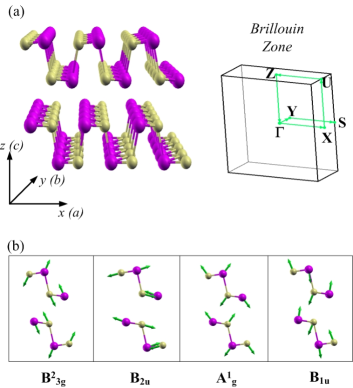
We consider a pristine GeS crystal as shown in Fig. (1-a). It consists of a layered puckered structure containing 8 atoms in the orthorhombic unit cell for which each Ge atom is bonded to three S atoms. The obtained fully relaxed lattice parameters (=4.30 Å, =3.67 Å, and =10.63 Å) are in good agreement with experimental ones.Hsueh et al. (1996)
Our study is conducted in three steps. First, plane-wave density functional theory is used to obtain the electronic ground-state. The Perdue-Burke-Ernzerhof (PBE) exchange-correlation potential including van der Waals corrections within the semi-empirical dispersion scheme (PBE-D) is used. We employed norm-conserving pseudopotentials, a 60 Ry kinetic energy cutoff and a k-sampling grid in the Monkhorst-Pack scheme of 884 as implemented in the Quantum-Espresso code.Giannozzi and et. al. (2009) The structures were fully optimized to their equilibrium position with forces smaller than 0.002 eV/Å.
Next, we use density functional perturbation theory (DFPT)Baroni et al. (2001) to compute the vibrational frequencies and the derivatives of the self-consistent Khon-Sham potential with respect to the atomic displacements, needed to evaluate the electron-phonon coupling matrix elements.
Many-Body perturbation theory (MBPT)Onida et al. (2002) is used to describe the temperature dependent electronic states. There, the electron-phonon interaction is treated perturbativelyPoncé et al. (2014a); Marini et al. (2015) by considering the first and a second order Taylor expansion in the nuclear displacement, commonly known as the Fan and Debye-Waller (DB) terms, respectively. The corresponding interacting Green’s function, whose poles define the quasiparticle excitations, can be written as
| (1) |
where is the Khon-Sham ground-state eigenenergies for frozen atoms. is the Fan contribution
| (2) |
and is the Debye-Waller term
| (3) |
Here and represent the Bose-Einstein and Fermi-Dirac distribution functions, while is the number of q points in the Brillouin zone. This last q-mesh is taken randomly to better map out the phonon transferred momentum Poncé et al. (2014b). We include 200 electronic bands and 60 random q-points for the phonon momentum to evaluate Eq. (2) and Eq. (3).
The electron-phonon coupling matrix elements , which represent the probability amplitude for an electron to be scattered due to emission or absorption of phonons, is given by
| (4) |
where, is the atomic mass of the sth atom, is the position of the atomic displacement in the unit cell, are the components of the phonon polarization vectors, and is the self-consistent DFT ionic potential. The second-order electron-phonon matrix elements are given by
| (5) |
Eq. (5) is rewritten, using translational invariance, in terms of the first order gradients only (see Ref. Poncé et al., 2014a and Marini et al., 2015).
The EP quasiparticle corrections to the Khon-Sham eigenenergies are calculated within the quasiparticle approximation (QPA). It consists in expanding, to first-order, the self-energy frequency dependence around the bare energies. In this way, one can write the temperature dependent EP electronic states asMarini et al. (2009)
| (6) |
where =- is the renormalization factor. Given that the Fan self-energy term is a complex function, it provides both the energy renormalization shift and the intrinsic quasiparticle lifetime.
The renormalization factor can be interpreted as the quasiparticle charge, and, constitutes a useful tool to assess the validity of the QPA; the closer is to 1, the more appropriate is the QPA. In fact, by assuming the validity of the QPA, one is able to rewrite Eq.(1) as
| (7) |
whose spectral function (SF), = , should resemble a Lorentzian function centered at . As the lattice vibrations become stronger, the SF gets wider and extends over large energy windows. Note, however, that one should be aware of the breakdown of the QPA that can be recognized by asymmetries and the appearance of new peaks in the SF.Molina-Sánchez et al. (2016); Cannuccia and Marini (2012); Gali et al. (2015)
Finally, the temperature dependent excitonic effects are included on top of the frozen-atom Bethe-Salpeter equation (BSE)
| (8) |
by considering the temperature dependent non-interacting electron-hole Green’s functionMarini (2008)
| (9) |
Here , comprises the electronic band index and represents the BSE kernel composed by the difference between the static screened and bare Coulomb potential. We adopt a static BSE kernel to describe excitonic effects following ref. Bechstedt et al., 1997 and ref. Marini and Sole, 2003 that have shown its accuracy in predicting optical properties in solids. By solving eq. (8) with the temperature dependent propagator, the frozen atom BSE Hamiltonian becomes non-Hermitian due to the presence of imaginary QP energies . This is crucial for computing the optical absorption since it provides an intrinsic exciton-phonon linewidth which removes the need of including an artificial broadening. Note that the electron-electron induced linewidths are disregarded in the present case since, as previously shown,Marini (2013, 2014) their contributions in semiconductors are zero for energy windows 2 close to the CBM and VBM. The BSE is calculated by considering 720 bands and 22 Ry energy cutoff in the screened electron-hole potential. The optical absorption is computed with the YAMBO codeMarini et al. (2009) using a fine grid with 24000 random k-points with seven valence and seven conduction bands in the - kernel. The parameter in Eq. (9) is set to 5 meV for numerical reasons.

III Results
We begin our study by describing the electronic structure, shown in Fig. (2-a) using PBE. There, we observe an indirect band-gap of 1.16 eV, whose valence band maximum (VBM) is located around three-fifths of the X path, while the conduction band minimum (CBM) is at . In Fig. (2-b) we show the -resolved density of states projected on Ge and S atoms. Overall, the valence (conduction) states are dominated by S (Ge) atoms mostly with -type contributions. These results are consistent with previous theoretical predictions.Malone and Kaxiras (2013); Makinistian and Albanesi (2006)
Note that the direct gap at is only 50 meV larger than the indirect gap. The oscillator strength reveals that the first excitonic state , is located at whereas the wavevector number of the second excitonic state , occurs from points v to c depicted in Fig (2-a). Due to the importance of these optical transitions, our EP coupling study will be conducted at these wavevector numbers. A schematic representation of the relevant optical transitions in GeS are shown in Fig. (2-b).
To properly describe the excitonic effects on the optical properties, one requires a good description of the electronic band-gap. Thus, we calculate the quasiparticle (QP) corrections within the approach and plot them as a function of the GGA eigenenergies in Fig. (2-c). We obtained a QP correction of 0.58 eV at which results in a QP gap of 1.79 eV. This is consistent with previous GW calculations.Malone and Kaxiras (2013) We also note that the QP corrections are slightly dispersive with respect to the GGA eigenenergies. In fact, by fitting the QP corrections data to a linear curve, we found that the conduction and valence bands are, in average, slightly stretched by 6% and 7%, respectively. This findings are important since the QP correction at and the average stretching of the bands are taken into account in the form of a scissor operator to formally solve Eq. (8). Notice that 720 bands and an energy cutoff of 18 Ry for the response function are included for evaluating the corrections.

We proceed with the study of the EP scattering mechanisms. To this aim, we compute the generalized Eliashberg function
| (10) |
which enables us to visualize the EP coupling strength for a given state . We defined the band-edge Eliashberg function as =–, where sub-index () refers to a given conduction (valence) state. This function provides useful information regarding the vibrational modes that eventually couple with an excitonic state rising at the same wavevector numbers.
In Fig. (3-a), we show the Eliashberg function at , for the highest valence state () and CBM, the wavevectors associated with the exciton state . At high frequencies present two dominant peaks spanning from 285 cm-1 to 320 cm-1 that result mainly from scattering events at . For frequencies below the phonon dispersion gap, the most important contributions cover the range from 50 to 140 cm-1. In Fig. (3d-e) we project on each mode. For simplicity, only the most representative modes are shown. Some of these modes are schematically represented in Fig. (1-b).

For frequencies below 90 cm-1, the electronic states couple mostly with the acoustic modes (AM) and with less intensity to the shear modes (SM). Notice that, in contrast to black phosphorus,Villegas et al. (2016b) present non-negligible negative contributions for frequencies below 50 cm-1, which guarantees the reduction of the band gap as the temperature increases; a feature observed in experiments.Logothetidis et al. (1986) Given that
| (11) |
the Bose-Einstein distribution will always weigh more heavily on the low-frequency region where is negative, causing this way, the monotonic decreases of the band gap with the temperature.
At higher frequencies, the dominant EP peaks are mostly attributed to modes B2u and B with B2u providing the most intense contribution, as shown in Fig. (3-e). Based on this information, one should expect that the first excitonic state couples efficiently with the infrared longitudinal mode B2u.
Moreover, in Fig. (3-c) we show the EP coupling at () and () states, whose wavevector numbers give rise to the exciton state . In contrast to the previous case, we note a significant enhancement of the EP strength around 250 cm-1 which results from the EP scattering events at state. In Fig. (3-f) we show the projection of onto the high frequency optical modes. It clearly shows that the electrons interact more strongly with mode B. Moreover, the coupling of electrons with mode A is considerably enhanced with respect to the excitonic state . Therefore, the exciton state should couple with the vibrational modes A, B and B2u which in turn will be responsible for the subsequent reduction of the peak intensity and linewidth increase of the optical absorption.
From Eq. (6) in the limit , we estimate the ZPM gap renormalization of meV at , which is more than twice the value found in bulk black phosphorus.Villegas et al. (2016b) It should be mentioned that albeit the similar orthorhombic crystal structure between BP and GeS, the dominant EP scattering processes at the band-edge of BP are the acoustical, A and B2u modes.Villegas et al. (2016b); Ling et al. (2016)
As previously stated, the MBPT approach allow us to take into account dynamical effects. Contrary to the single-particle description in which the states hold infinite lifetimes, the QP picture provides finite lifetimes in the form of the width of a Lorentzian curve centered at .
In Fig. (4a-b) we show the SF related to the and CBM states for different temperatures. The dashed blue lines depict the single particle (Khon-Sham) energy with an associated infinite lifetime. At , the SF present a Lorentzian shape which is particularly sharp at the CBM, reflecting the long QP lifetimes. As the temperature increases, the linewidth gets broader and the SF peaks are red-shifted (blue-shifted) for CBM (). This shift is a signature of the shrinking of the energy gap as the temperature increases. For completeness, the inset in Fig. (4-a) shows the SF at VBM which follows similar trends to .
| Theory | Exp. | Theory | Exp. | Theory | Exp. | Theory | Exp. | ||
|---|---|---|---|---|---|---|---|---|---|
| 1.702 | - | 1.69 | - | 1.68 | - | 1.66 | 1.65Eymard and Otto (1977) | ||
| 2.143 | 2.144 | 2.128 | 2.127 | 2.096 | 2.087 | 2.06 | 2.037 | ||
| 3.64 | 3.70 | 3.65 | 3.695 | 3.62 | 3.657 | 3.58 | 3.628 | ||
| 4.225 | 4.193 | 4.224 | 4.162 | 4.18 | 4.089 | 4.09 | 4.031 | ||

Analogously, in Fig. (4c-d) we show the SF of the states responsible for the exciton state . We observe similar features as in the previous case, regarding the temperature dependence. Note that the SFs keep their symmetric Lorentzian shape which is a signature of the validity of the QP picture. To further discuss this, in the inset of Fig. (4-d) we show the SF of an arbitrary point in the conduction band (labeled as in Fig. (2-a)). At , we observe a broad Lorentzian curve that, as the temperature increases, becomes highly asymmetric. For one can clearly see the formation of a second peak (new state). The new state can not be interpreted as a new electron-phonon state. In fact, it has been suggested that the appearance of new states are virtual transitions arising due to energy conservation, and constitute a clear signature of the quasiparticle breakdown Cannuccia and Marini (2012, 2011).
Finally, we explore the role of the EP interaction on the optical absorption and the relation between our calculations and experimental results. In Fig. (5-a) and Fig. (5-d) we present the imaginary part of the dielectric function at for light polarized in the and -direction, respectively. The purple (blue) lines show the spectra with (without) EP contribution. Note that even at , the region close to the band-edge of the absorption naturally gains a width. Also the position of the peaks including EP corrections are slightly red-shifted as a consequence of the ZPM renormalization. In addition, even with the choice of a dense -grid, the absorption without EP contribution shows spiky features over the entire energy range. This result clearly highlights the crucial role of including EP interactions for describing the optical properties of GeS, even at .
In Fig. (5b) and Fig. (5-c) we show the finite temperature absorption for -polarized light. We clearly observe the natural smoothness of the theoretical curves that describe nicely the position of the peaks and their corresponding linewidths without using any external parameter. For instance, experimental results by Logothetidis et. al,Logothetidis et al. (1986) estimated the position of peak at 2.127 eV and 2.087 eV for and , respectively. Our theoretical calculations locate the same peak at 2.128 eV and 2.096 eV, in an excellent agreement. We summarized the energy position of the relevant transitions in Table 1. Notice that as the temperature increases the linewidths of our results deviate from the experimental ones, especially for the case of light polarized in -direction. We argue that the reason for such deviation might be related to the accurate description of electronic states entering in Eq. (9). Indeed, by inspecting Eq. (2) and Eq. (3), we realized that the energy dispersion curvature can affect considerably the results, especially the broadening. Thus, a considerable improvement of the EP lifetimes could be achieved by computing the EP coupling on top of G0W0 electronic structure.Antonius et al. (2014) However this procedure is at this point computationally demanding and thus, not performing in this work. Although this drawbacks, overall, our GGA results predicts fairly well the optical properties of GeS, especially for -polarized light. Given the resemblance of the selection rules, band structures and optical absorption curvesEymard and Otto (1977); Makinistian and Albanesi (2011) among the group-VI monochalcogenides, one can expect that, indeed, the EP coupling could play an important role for the description of the optical properties of this entire family.
Finally, we would like to mention that in few-layers and single-layer GeS forms, one would also expect a monotonic reduction of the band gap with the temperature. This can be ascribed by the resemblance of our phonon dispersion results for lower frequencies - the ones responsible for the gap temperature dependence slope - to recent vibrational studies in monolayer GeS.Zhang et al. (2016) Moreover, due to the reduced screening in the few-layer forms, the EP and exciton-phonon coupling might be enhanced, especially for optical modes.
IV Conclusions
We provided a theoretical description of the electron-phonon coupling effects on the electronic and optical properties of orthorhombic GeS based on ab-initio many body perturbation theory. Our results shown that, at the band-edge, the longitudinal mode couples efficiently with the electronic states. In addition, the electronic states that give rise to the exciton couple mostly with the vibrational modes and . Our results for the optical absorption shown that even at , the role of EP coupling is crucial to properly describe the absorption linewithds and peak positions. Our findings suggest that in order to properly describe group-VI monochalcogenides one should include the electron-phonon interaction effects.
V Acknowledgements
CEPV acknowledges A. Molina-Sánchez for fruitfull discussions and the financial support from the Brazilian agency FAPESP grant number 2015/14899-0 and 2012/24227-1. AM acknowledges the funding received from the Futuro in Ricerca grant No. RBFR12SW0J of the Italian Ministry of Education, University and Research MIUR, the European Union project MaX Materials design at the eXascale H2020-EINFRA-2015-1, Grant agreement n. 676598 and Nanoscience Foundries and Fine Analysis - Europe H2020-INFRAIA-2014-2015, Grant agreement n. 654360. A. R. R. acknowledges support from ICTP-SAIRF (FAPESP project 2011/11973-4) and the ICTP-Simons Foundation Associate Scheme. This work uses the computational resources from GRID-UNESP and CENAPAD/SP.
References
- Geim and Grigorieva (2013) A. K. Geim and I. V. Grigorieva, Nature 499, 419 (2013).
- Wang et al. (2014) H. Wang, F. Liu, W. Fu, Z. Fang, W. Zhoue, and Z. Liu, Nanoscale 6, 12250 (2014).
- Buscema et al. (2015) M. Buscema, J. O. Island, D. J. Groenendijk, S. I. Blanter, G. A. Steele, H. S. J. van der Zanta, and A. Castellanos-Gomez, Chem. Soc. Rev. 44, 3691 (2015).
- Furchi et al. (2014) M. M. Furchi, A. Pospischil, F. Libisch, J. Burgdörfer, and T. Mueller, Nano Lett. 14, 4785–4791 (2014).
- Britnell et al. (2013) L. Britnell, R. M. Ribeiro, A. Eckmann, R. Jalil, B. D. Belle, A. Mishchenko, Y.-J. Kim, R. V. Gorbachev, T. Georgiou, S. V. Morozov, A. N. Grigorenko, A. K. Geim, C. Casiraghi, A. H. C. Neto, and K. S. Novoselov, Science 340, 1311–1314 (2013).
- Zhao et al. (2014) L.-D. Zhao, S.-H. Lo, Y. Zhang, H. Sun, G. Tan, C. Uher, C. W. V. P. Dravid, and M. G. Kanatzidis, Nature 508, 373–377 (2014).
- Ding et al. (2015) G. Ding, G. Gao, and K. Yao, Sci. Rep. 5, 9567 (2015).
- Senguptaa et al. (2011) R. Senguptaa, M. Bhattacharyaa, S. Bandyopadhyayb, and A. K. Bhowmick, Prog. Polym. Sci. 36, 638–670 (2011).
- Paine and Narula (1990) R. T. Paine and C. K. Narula, Chem. Rev. 90, 73–91 (1990).
- Pakdel et al. (2014) A. Pakdel, Y. Bandoa, and D. Golberg, Chem. Soc. Rev. 43, 934 (2014).
- Jariwala et al. (2014) D. Jariwala, V. K. Sangwan, L. J. Lauhon, T. J. Marks, and M. C. Hersam, ACS Nano 8, 1102–1120 (2014).
- Wang et al. (2012) Q. H. Wang, K. Kalantar-Zadeh, A. Kis, J. N. Coleman, and M. S. Strano, Nat. Nanotech. 7, 699–712 (2012).
- Castellanos-Gomez (2015) A. Castellanos-Gomez, Jour. Phys. Chem. Lett. 6, 4280 (2015).
- Ling et al. (2015) X. Ling, H. Wang, S. Huang, F. Xia, and M. S. Dresselhaus, Proc. Natl. Acad. Sci 112, 201416581 (2015).
- Gomes and Carvalho (2015) L. C. Gomes and A. Carvalho, Phys. Rev. B 92, 085406 (2015).
- Singh and Hennig (2014) A. K. Singh and R. G. Hennig, Appl. Phys. Lett. 105, 042103 (2014).
- Ribeiro et al. (2016) H. B. Ribeiro, C. E. P. Villegas, D. A. Bahamon, D. Muraca, A. H. Castro-Neto, E. A. T. de Souza, A. R. Rocha, M. A. Pimenta, and C. J. S. de Matos, Nat. Commun. 7, 12191 (2016).
- Villegas et al. (2016a) C. E. P. Villegas, A. Rodin, A. Carvalho, and A. R. Rocha, Phys. Chem. Chem. Phys. 18, 27829 (2016a).
- Xia et al. (2015) F. Xia, H. Wang, and Y. Jia, Nat. Commun. 5, 4458 (2015).
- Qin et al. (2016) G. Qin, Z. Qin, W.-Z. Fang, L.-C. Zhang, S.-Y. Yue, Q.-B. Yan, M. Hu, and G. Su, Nanoscale 8, 11306 (2016).
- Villegas et al. (2016b) C. E. P. Villegas, A. R. Rocha, and A. Marini, Nano Lett. 16, 5095 (2016b).
- Eymard and Otto (1977) R. Eymard and A. Otto, Phys. Rev. B 16, 1616 (1977).
- Latiff et al. (2015) N. Latiff, W. Z. Teo, Z. Sofer, S. Huber, A. C. Fisherc, and M. Pumera, RSC Adv. 5, 67485 (2015).
- Lattif et al. (2015) N. M. Lattif, W. Z. Teo, Z. Sofer, A. C. Fisher, and M. Pumera, Chem.-Eur. J. 21, 13991 (2015).
- Favron et al. (2015) A. Favron, E. Gaufrès, F. Fossard, A.-L. Phaneuf-L’Heureux, N. Y.-W. Tang, P. L. Lévesque, A. Loiseau, R. Leonelli, S. Francoeur, and R. Martel, Nat. Mat. 14, 826–832 (2015).
- Ulaganathan et al. (2016) R. K. Ulaganathan, Y.-Y. Lu, C.-J. Kuo, S. R. Tamalampudi, R. Sankar, K. M. Boopathi, A. Anand, K. Yadavm, R. J. Mathew, C.-R. Liu, F. C. Choue, and Y.-T. Chen, Nanoscale 8, 2284 (2016).
- Logothetidis et al. (1986) S. Logothetidis, P. Lautenschlager, and M. Cardona, Phys. Rev. B 33, 1110 (1986).
- Hsueh et al. (1996) H. C. Hsueh, M. C. Warren, H. Vass, G. J. Ackland, S. J. Clark, and J. Crain, Phys. rev. B 53, 14806 (1996).
- Cháb and Bartos (1984) V. Cháb and I. Bartos, Phys. Stat. Sol. (b) 121, 301–306 (1984).
- F. Lukes (1981) A. L. F. Lukes, E. Schmidt, Phys. Stat. Sol. (b) 39, 921 (1981).
- Makinistian and Albanesi (2011) L. Makinistian and E. A. Albanesi, Comp. Mat. Sci. 50, 2872 (2011).
- Tuttle et al. (2015) B. R. Tuttle, S. M. Alhassan, and S. T. Pantelides, Phys. Rev. B 92, 235405 (2015).
- Makinistian and Albanesi (2006) L. Makinistian and E. A. Albanesi, Phys. Rev. B 74, 045206 (2006).
- Cannuccia and Marini (2011) E. Cannuccia and A. Marini, Phys. Rev. Lett. 107, 255501 (2011).
- Giustino et al. (2010) F. Giustino, S. G. Louie, and M. L. Cohen, Phys. Rev. Lett 105, 265501 (2010).
- Kawai et al. (2014) H. Kawai, K. Yamashita, E. Cannuccia, and A. Marini, Phys. Rev. B 89, 085202 (2014).
- Marini (2008) A. Marini, Phys. Rev. Lett. 101, 106405 (2008).
- Molina-Sánchez et al. (2016) A. Molina-Sánchez, M. Palummo, A. Marini, and L. Wirtz, Phys. Rev. B 93, 155435 (2016).
- Zacharias et al. (2015) M. Zacharias, C. E. Patrick, and F. Giustino, Phys. Rev. Lett. 115, 177401 (2015).
- Poncé et al. (2015) S. Poncé, Y. Gillet, J. L. Janssen, A. Marini, M. Verstraete, and X. Gonze, J. Chem. Phys. 143, 102813 (2015).
- Cardona and Thewalt (2005) M. Cardona and M. L. W. Thewalt, Rev. Mod. Phys. 77, 1173 (2005).
- Yu and Cardona (2010) P. Y. Yu and M. Cardona, Fundamentals of Semiconductors (Springer-Verlag, Berlin, 2010).
- Shokhovets et al. (2014) S. Shokhovets, F. Barwolf, G. Gobsch, E. Runge, K. Köhler, and O. Ambacher, physica status solidi (c) 1, 297–301 (2014).
- Giannozzi and et. al. (2009) P. Giannozzi and et. al., J. Phys. Condens. Matter 21, 395502 (2009).
- Baroni et al. (2001) S. Baroni, S. de Gironcoli, A. D. Corso, and P. Giannozzi, Rev. Mod. Phys. 73, 515 (2001).
- Onida et al. (2002) G. Onida, L. Reining, and A. Rubio, Rev. Mod. Phys. 74, 601 (2002).
- Poncé et al. (2014a) S. Poncé, G. Antonius, Y. Gillet, P. Boulanger, J. L. Janssen, A. Marini, M. Côté, and X. Gonze, Phys. Rev. B. 90, 214304 (2014a).
- Marini et al. (2015) A. Marini, S. poncé, and X. Gonze, Phys. Rev. B. 91, 224310 (2015).
- Poncé et al. (2014b) S. Poncé, G. Antonius, P. Boulanger, E. Cannuccia, A. Marini, M. Côté, and X. Gonze, physica status solidi (c) 83, 341–348 (2014b).
- Marini et al. (2009) A. Marini, C. Hogan, M. Grüning, and D. Varsano, Computer Physics Communications 180, 1392 (2009).
- Cannuccia and Marini (2012) E. Cannuccia and A. Marini, Eur. Phys. Jour. B 85, 320 (2012).
- Gali et al. (2015) A. Gali, T. Demján, M. Vörös, G. Thiering, E. Cannuccia, and A. Marini, Nat. Commun. 7, 11327 (2015).
- Bechstedt et al. (1997) F. Bechstedt, K. Tenelsen, B. Adolph, and R. D. Sole, Phys. Rev. Lett. 78, 1528 (1997).
- Marini and Sole (2003) A. Marini and R. D. Sole, Phys. Rev. Lett. 91, 176402 (2003).
- Marini (2013) A. Marini, J. Phys.: Conf. Ser. 427, 012003 (2013).
- Marini (2014) A. Marini, Phys. Rev. Lett. 112, 257402 (2014).
- Malone and Kaxiras (2013) B. D. Malone and E. Kaxiras, Phys. Rev. B 87, 245312 (2013).
- Ling et al. (2016) X. Ling, S. Huang, E. H. Hasdeo, L. Liang, W. M. Parkin, Y. Tatsumi, A. R. T. N. A. A. Puretzky, P. M. Das, B. G. Sumpter, D. B. Geohegan, J. Kong, R. Saito, M. Drndic, V. Meunier, and M. S. Dresselhaus, Nano Lett. 16, 2260 (2016).
- Logothetidis et al. (1985) S. Logothetidis, L. Viña, and M. Cardona, Phys. Rev. B 31, 2180 (1985).
- Antonius et al. (2014) G. Antonius, S. Poncé, P. Boulanger, M. Côté, and X. Gonze, Phys. Rev. Lett. 112, 215501 (2014).
- Zhang et al. (2016) S. Zhang, N. Wang, S. Liu, S. Huang, W. Zhou, B. Cai, M. Xie, Q. Yang, X. Chen, and H. Zeng, Nanotechnology 27, 274001 (2016).