Dusty gas accretion onto massive black holes and infrared diagnosis of the Eddington ratio
Abstract
Evidence for dust around supermassive black holes (SMBHs) in the early Universe is strongly suggested by recent observations. However, the accretion mechanism of SMBHs in dusty gas is not well understood yet. We investigate the growth of intermediate-mass black-holes (IMBHs) of in dusty clouds by using one-dimensional radiative-hydrodynamics simulations. We find that the accretion of dusty gas onto IMBHs proceeds gently with small fluctuations of the accretion rate, whereas that of pristine gas causes more violent periodic bursts. At dust-to-gas mass ratios similar to the solar neighborhood, the time averaged luminosity becomes smaller than that for primordial gas by one order of magnitude and the time-averaged Eddington ratio ranges from to in clouds with initial gas densities of . Our calculations show that the effect of dust opacity alone is secondary compared to the radiation pressure on dust in regulating the BH growth. We also derive spectral energy distributions at IR bands by calculating dust thermal emission and show that the flux ratio between and is closely related to the Eddington ratio. Thermal emission from hot dust near the BH dominates only during the high accretion phase, producing higher flux density at . Therefore, we suggest that the combinations of MIR observations by JWST and FIR observation by ALMA or Spitzer can be used to estimate the Eddington ratio of massive BHs.
Subject headings:
radiative transfer – ISM: dust, extinction – galaxies: evolution – galaxies: high-redshift – quasars: supermassive black holes1. Introduction
Understanding the growth mechanism of massive black holes is one of the major challenges of modern astrophysics. It is known that the number density of supermassive black holes (SMBHs) steeply decreases in the early Universe (e.g., Richards et al., 2006). Yet, recent observations have detected SMBHs with masses even at cosmic times less than (Mortlock et al., 2011; Wu et al., 2015). However, the existence of SMBHs at high redshifts alone does not suggest clues about the initial seed mass and the subsequent growth history.
Various mechanisms have been suggested for the formation channel of SMBH seeds, that typically are assumed to have masses : (1) growth from stellar mass BHs of Population III star remnants by gas accretion (Alvarez et al., 2009; Jeon et al., 2012; Park & Ricotti, 2013); (2) direct collapse of supermassive stars (Omukai, 2001; Begelman et al., 2006; Volonteri & Begelman, 2010; Agarwal et al., 2012; Latif et al., 2013; Inayoshi et al., 2014; Sugimura et al., 2014); (3) formation in dense star clusters via collisions among stars (Rees, 1978; Portegies Zwart & McMillan, 2002; Devecchi et al., 2012; Katz et al., 2015; Yajima & Khochfar, 2016). After the formation of SMBH seeds, it is widely believed that further growth proceeds though gas accretion. However, the accretion mechanism has not been understood yet because the accreting gas is subject to feedback from radiation emitted near the accretion disks around BHs.
One of the mechanisms limiting the gas accretion rate is the balance between gravitational attraction and radiation pressure on free-electron, the so-called Eddington limit. Cosmological simulations showed that massive black holes of could grow up to supermassive ones of by using Eddington limited Bondi-Hoyle accretion prescription and a simple thermal feedback model (Li et al., 2007; Di Matteo et al., 2008, 2012; Sijacki et al., 2009). Di Matteo et al. (2012) carried out cosmological simulations in large cosmological volumes of in comoving unit and showed the accretion rate of SMBHs in rare massive galaxies was near the Eddington limit most of the time, resulting in SMBHs with at . However, due to computational limitations, in such cosmological simulations gas dynamics at the Bondi radius (where the gravity of BHs is dominant) is not well resolved, thus requiring sub-grid feedback models. Therefore there is a large uncertainty in the estimation of the gas accretion rate.
Using high-resolution radiation hydrodynamics simulations resolving the Bondi radius, Milosavljević et al. (2009) showed that the neighboring gas is ionized by the radiation from a central BH and the thermal pressure of Hii regions pushed gas away from the BH against the gravity. As a result, the accretion rate was significantly suppressed even at lower luminosities than Eddington. Park & Ricotti (2011) showed that the gas accretion periodically changed and the time-averaged accretion rate was of the Bondi rate regardless of some parameters, e.g., radiative efficiency, black hole mass, background density (see also, Park & Ricotti, 2012).
Inayoshi et al. (2016) suggested that gas accretion rate could exceed the Eddington limit when BHs accrete from extremely high-density gas clouds where the size of ionized bubble is smaller than Bondi radius (see also, Park et al., 2014a; Sakurai et al., 2016). In addition, assuming the anisotropic radiation feedback, Sugimura et al. (2016) showed that gas efficiently accretes onto a BH along the shadowed region and the accretion rate exceeds the Eddington limit. Thus, it is still unclear how much the growth of BHs is regulated by radiative feedback.
In local galaxies, it is well known that BH mass tightly correlates with bulge mass or velocity dispersion (Kormendy & Ho, 2013). This implies co-evolution of BHs with galaxies. Park et al. (2016) showed that the growth rate of massive BHs can be enhanced under the influence of gravitational potential of the bulge. In addition, as star formation proceeds, gas surrounding a BH is metal/dust enriched through type-I/II supernovae, and stellar winds. Observations of high-redshift quasars at suggest that a large mass in dust exists around SMBHs. Dust is detected via its thermal emission or dust extinction (Bertoldi et al., 2003; Priddey et al., 2003; Maiolino et al., 2004; Wang et al., 2013). In addition, recent discoveries of high-redshift sub-millimeter galaxies indicate that some galaxies can become dust rich at early times (Riechers et al., 2013; Watson et al., 2015). Theoretically, recent simulations show that the metallicity near the galactic centers could reach even at (e.g., Wise et al., 2012) or even higher depending on the halo mass (e.g., Ricotti & Gnedin, 2005; Ricotti et al., 2016).
The metallicity and dust amount of massive galaxies in an over-dense region could reach the level of solar-neighborhood even at (e.g., Yajima et al., 2015). Therefore BHs were likely to grow in a dusty medium even in the early Universe. If dust exists around a BH, radiation from the inner parts of an accretion disk around a BH can be obscured. This changes the observational properties of accreting BHs and the dynamics of accreting gas. In addition to dust opacity, the radiation force on dust can play a roll in determining the growth rate of BHs (Ciotti & Ostriker, 2007; Namekata et al., 2014; Hensley et al., 2014). However, the interplay between dust and the photo-ionization feedback, which is the main feedback mechanism suppressing the growth of stellar or intermediate-mass BHs (IMBHs), has not been studied in sufficient detail. In this work we investigate the impacts of dust on the growth of BHs by using one-dimensional radiation hydrodynamics simulations resolving the both the Bondi radius and ionized bubbles simultaneously. We also estimate self-consistently the thermal emission from dust in our time-dependent models and show that the emission from a hot dust component at is prominent only during luminosity bursts, while a warmer dust component produces a flux at that is roughly proportional to the mean accretion rate. We thus conclude that the flux ratio at is a good proxy for the Eddington ratio.
The paper is organized as follows. We describe our models in §2. In §3, we present simulation results that include time-average Eddington ratios, accretion histories with and without dust, dependences of the Eddington ratios on metallicity and BH mass, spectral energy distributions (SEDs) in the infrared (IR) considering dust thermal emission. We discuss the dust destruction processes and the condition for hyper-accretion in §5, and summarize our results in §6.
2. Model
We solve the dynamics of gas surrounding a BH under radiative feedback using one-dimensional radiation hydrodynamics simulations. In this work, we use a hydrodynamics code Zeus-MP (Stone & Norman, 1992; Hayes et al., 2006). Park & Ricotti (2011) incorporated the radiative transfer of X-ray and UV photons and chemical reactions of primordial gas into the Zeus-MP. Here we furthermore incorporate dust attenuation and radiation pressure on dust to the code. In spherical symmetric coordinates the basic equations, i.e., the conservations of mass, momentum and energy, are:
| (1) |
where is radiation force, is the heating rate by photo-ionization of hydrogen and helium, and is the radiative cooling rate. In this work, we consider radiation force on dust (), free electrons (), and neutral hydrogen (). For single-sized grains of dust the optical depth is
| (2) |
where is dust radius, is mass of a dust grain, is the absorption coefficient to geometrical cross section, is hydrogen mass, is mass density of a dust grain, and is dust-to-gas mass ratio. If the wavelength of the radiation is shorter than , then (Draine & Lee, 1984). Here we consider compact spherical dust grains, i.e., . Here we assume that the dust-to-gas mass ratio is proportional to metallicity as , motivated by observations of a nearly constant dust-to-metal mass ratio in local galaxies (Draine et al., 2007).
Observations of local galaxies indicate that dust has a continuum size distributions. For example, the dust in the Milky Way shows a power-law size distribution , often referred to as the MRN distribution (Mathis et al., 1977). However, for sake of simplicity here we use a single dust size model with a fiducial size . The choice of the fiducial size is motivated below. At wavelengths , where , the opacity of a power law distribution of dust radii , is the same of a single size dust model for
| (3) |
where is the dust size of the equivalent single-size model, and are minimum and maximum grain sizes in the grain distribution. Assuming realistic minimum and maximum dust sizes of and in a MRN model ( i.e., ), the equivalent single dust size model has .
Near active galactic nuclei (AGNs), the main components of dust are graphite and silicate because of their high sublimation temperature , whereas icy dust can be easily sublimated. Here we consider a mix of graphite and silicate dust grains with the mass ratio of . The difference of mass density between the graphite and silicate is small. In addition, when , the absorption cross section depends only on the surface area of a dust grain. Therefore, the simulation results are rather insensitive to the assumed mass ratio of the dust components.
Within fully ionized region, the radiation force on dust can be larger than that from Compton scattering on electrons by a factor
| (4) |
UV photons absorbed by dust are reemitted as IR photons via thermal emission of dust. However, the IR photons can escape from neighbor gas without further interaction with dust due to the lower absorption cross-section to the IR wavelengths. If the hydrogen column density exceeds , the IR photons can be absorbed by dust and impart additional momentum to the gas. In this work, we focus on spatial scales up to an ionized bubble. On these scales the absorption of IR photons by dust is negligible. Therefore, we neglect dust opacity to IR light.
Aside from the addition of dust physics, the simulations have the same physics and initial conditions as the ones presented in Park & Ricotti (2012). For our fiducial simulations we investigate the gas dynamics around BHs of embedded in gas clouds with uniform initial gas density. The radiative luminosity is with a constant radiative efficiency and estimated at the inner boundary in the logarithmically spaced radial grid. We assume a power-law spectrum with the frequency range , where is the Lyman-limit frequency. However the results can be easily scaled to different mass BHs and different densities as the problem is basically scale-free. Park & Ricotti (2012) showed that simulations with a fixed show identical behavior once the length and time scales are re-normalized appropriately. Park & Ricotti (2012) used the condition of as a fiducial run. For this parameters combination, if gas accretes onto the BH at the Bondi rate, the luminosity is close to the Eddington luminosity. Here we use the same fiducial run with to compare the impact of dust attenuation and radiation force on the gas accretion onto BHs to the dust-free case. Table 1 summarizes three different models we ran to understand the impact of dust.: (1) dust-free case (M5-Z0), (2) dusty case with without radiation pressure on dust (M5-Z1), and (3) dusty case with including radiation pressure on dust (M5-Z1rad). In all simulations we include and . The inner and outer boundaries are pc and , respectively. The number of cells is . We have checked that our results are convergent and do not change when increasing the number of cells from to . The cell size changes with radial distance with the equatorial ratio. To check that indeed the results are scalable to different BH masses we run simulations with BH masses of and keeping constant .
| Model | Dust attenuation | |||
|---|---|---|---|---|
| M5-Z0 | 100 | |||
| M5-Z1 | 100 | |||
| M5-Z1rad | 100 |
NOTES. is initial background density. is radiation pressure on dust.
3. Results
3.1. Time evolution of luminosity under radiative feedback
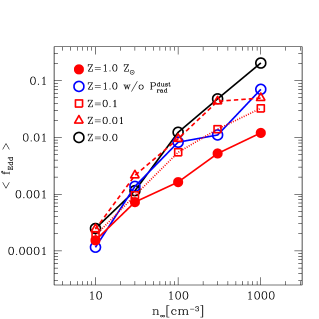
Figure 1 shows time-averaged BH luminosity , in units of the Eddington luminosity , for the simulations in Table 1. We calculate at various metallicities (), and initial gas densities . Regardless of dust amount, linearly increases with gas density. This means that the accretion rate normalized by the Bondi rate is constant as a function of the gas density. The Eddington ratio for gas of primordial composition and (i.e., M5-Z0 run), is of the Bondi rate. Thus for the case with , if we have:
| (5) |
This value is consistent with previous studies (Milosavljević et al., 2009; Park & Ricotti, 2011, 2012). As the metallicity and dust content increases, decreases. At , is similar to the cases without dust. When the metallicity is higher than , becomes smaller than that of primordial gas by a factor greater than . The M5-Z1rad run with radiation pressure on dust and solar metallicity has , while the same model without radiation pressure on dust (M5-Z1) has that is similar to the M5-Z0 run without dust. This suggests that the radiation force on dust significantly reduces the accretion rate, whereas the effect of dust opacity alone is secondary.

Figure 2 shows the time evolution of the luminosity for the simulations in Table 1. As shown in previous works (Park & Ricotti, 2011), the accretion of primordial gas periodically changes. During the bursts the luminosity is near the Eddington limit. When the luminosity is high, the Hii region expands far beyond the Bondi radius. At the ionizing front, the low-density hot ionized gas is almost in pressure equilibrium with the outside Hi gas, and suppress the gas inflow from the neutral region. This leads to a decrease of accretion rate. The minimum luminosity becomes smaller than the maximum one by about 5-6 orders of magnitude.
After each burst, the gas density within the Hii bubble decreases with time. In addition, the lowered luminosity allows recombination of hydrogen in Hii region with radiative cooling. Due to the recombination, the ionization degree and temperature in the Hii region decrease. These break the pressure equilibrium and allows gas inflow, resulting in the burst of luminosity again.
The mid panel shows the luminosity of M5-Z1 run (with dust). The burst cycle is shorter than that of M5-Z0 run (without dust). This is because the cycle time scale is proportional to the sound crossing time over ionized region (Park & Ricotti, 2012), and the size of Hii region () is decreased due to the dust attenuation. In order for the dust attenuation to work, the optical depth of dust in a Hii region should be higher than unity. We can roughly estimate the critical metallicity (and therefore dust abundance) that can have an effect at reducing the size of Hii region and therefore the period between bursts. First we estimate the size of Strömgren sphere:
| (6) |
where is the case-B recombination coefficient, and is the mean energy of ionizing photons. We here set as the temperature of ionized region in the above estimation. For a power-law spectrum, is estimated by , where is a slope of the power-law spectrum, and it is for . Using the estimated size of ionized region above, we can derive the critical metallicity for the dust attenuation as
| (7) |
Thus, the critical metallicity is given by
| (8) |
If the metallicity is higher than , the size of Hii region decreases and so does the period between bursts. Note that, even in the case with the dust attenuation (but no radiation pressure on dust), the size of ionized bubble is larger than the Bondi radius. Therefore, the gas density inside the Hii region is roughly the same as the run with no dust (M5-Z0), and so is the mean accretion rate. However, the peak luminosities are somewhat smaller than in the M5-Z0 run due to the smaller Hii bubbles. This might lead to the lower than the primordial gas cases by a factor .
The lower panel shows the luminosity for the run that includes the effect of both dust opacity and radiation pressure on dust (M5-Z1rad). Unlike M5-Z0 and M5-Z1 runs, the gas accretion of M5-Z1rad proceeds more gently and the luminosity varies between the burst and quiescent phases by one or two orders of magnitude (instead of 5 orders of magnitude as in the other runs). The maximum and minimum luminosities are and of , respectively. Due to the high radiation force on dust that, as shown in Eq. (4), at solar metallicity is nearly 700 times larger than Compton scattering on electrons, the gas inflow is significantly suppressed when , resulting in the lower maximum luminosity than in the M5-Z0 run by one order of magnitude. In the case of M5-Z1rad run, the period between bursts is not determined by the sound crossing time of the Hii region (). As will be shown in Sec. 3.2, the Hii bubble in the M5-Z1rad run maintains almost constant size, whereas the one in the M5-Z0 run recombines and collapses when the luminosity drops to the minimum (see also, Park & Ricotti, 2012). In the case of primordial gas, the expansion of the Hii bubbles significantly reduces the gas density and accretion rate, and then the rapid gas inflow during the collapse of the ionized bubble allows the luminosity to reach nearly the Eddington limit. On the other hand, in the case of dusty gas, the dust attenuation regulates the expansion of the Hii bubble, and the radiation force suppresses the gas inflow significantly. Thus, the dust plays a role in diminishing the large periodic variability of the luminosity and lead to more gentle gas accretion onto the BH.

Figure 3 presents the density profiles at the high and low luminosity phases for runs M5-Z0 and M5-Z1rad. At the high luminosity phase, the density of M5-Z0 run steeply increases at , and it reaches at the inner boundary. The inflow velocity exceeds sound speed at , and hence the density profiles are roughly as in the Bondi profile (free falling gas).
On the other hand, the density of M5-Z1rad slowly increases as the radial distance decreases. In the case with dust, the net inward force is significantly reduced due to the radiation force. By introducing an effective gravitational constant as , we estimate the transonic radius by . When , the transonic radius is smaller than the inner boundary of the calculation box. As a result, the gas inflow of M5-Z1rad is always sub-sonic in our calculation box. In addition, the temperature at increases as the radial distance decreases due to compression heating. Therefore, the pressure gradient force also works on suppressing the gas inflow. Thus the gas density does not increase steeply.
As shown in the lower panel of the figure, the gas density is decreased due to the photo-ionization feedback during the quiescent low-luminosity phase. At the ionization front, the gas is almost in pressure equilibrium with the gas outside the Hi region, i.e., , where the factor is due to the increased particle number from ionization. Since the temperature of the Hii region reaches via photo-ionization of hydrogen and helium (Park & Ricotti, 2011), the density of the Hii region is roughly lower than the ambient Hi gas by a factor . The gas density is even at the inner boundary in the simulation. Therefore the optical depth by dust inside the Hii region does not exceed unity as will be discussed in Sec. 3.2.

Figure 4 shows the gas outward acceleration due to radiation pressure normalized by the gravitational acceleration. Both and are roughly constant inside the Hii region. The number ratio of dust grains to free electrons is almost constant inside the Hii region. Therefore, the is higher than by a factor as shown by Eq. (4). During the burst of accretion the dust optical depth exceeds unity inside the Hii region, because the gas density increases near the BH as shown in Figure 3. Therefore the radiation pressure decreases as the distance increases due to the dust opacity. sharply drops outside the ionizing front because the electron abundance decreases, while gradually decreases since dust exists both in the ionized and neutral gas. The radiation force on Hi, , monotonically increases with the radial distance in the Hii region. Where , is simply proportional to the neutral fraction . Inside the Hii region, hydrogen is in ionization equilibrium:
| (9) |
For and , . increases somewhat more slowly than . This is due to the decrease of gas density as the radial distance increases at . Near the ionization front, steeply increases with increasing , and decreases exponentially in the neutral region. 111 We notice that there is a dip in near the ionizing front. At this radius, the flux steeply decreases as , while the neutral fraction increases at cells behind, producing the dip. This is due to the finite resolution. Increasing the number of cells makes this dip smaller. Since the radiation force on Hi is negligible, this feature does not affect our results.
3.2. Size of ionized bubble
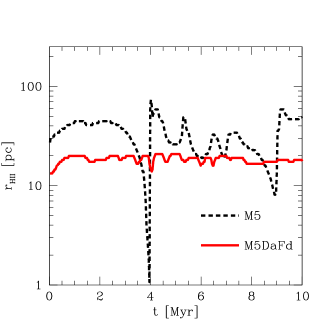
The time evolution of the position of the ionization front (defined where ) is presented in Fig. 5. The size of ionized bubble changes with the luminosity in the case of the M5-Z0 run without dust. When the pressure equilibrium at the ionization front breaks due to the decreased density and luminosity, the neutral gas free falls into the BH. In this case, the inflowing gas remains neutral until reaching near the BH, resulting in the collapse of the ionized bubble just before the next bursts of luminosity.
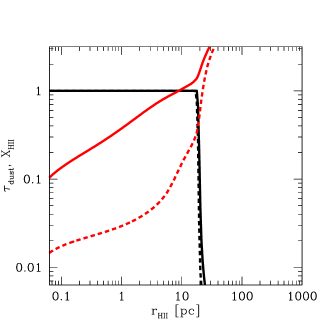
On the other hand, in the dusty gas simulation (M5-Z1rad) the size of the ionized bubble remains nearly constant, with . Even during the high luminosity phases, the size is several times smaller than that of the dust-free case (M5-Z0). This is because dust opacity regulates the evolution of the size of the ionized bubble. Figure 6 shows the optical depth of dust during the high and low luminosity phases. When the luminosity is high, the optical depth of dusty gas reaches unity at (M5-Z1rad). Therefore the ionizing front cannot propagate far beyond , whereas in the dust-free case (M5-Z0) the ionizing front (I-front) reaches . During the low luminosity phase, the optical depth does not exceed unity in the ionized bubble due to the lower gas density as shown in Fig. 3. In this case, the size of ionized bubble is determined by the ionizing luminosity. The gas density steeply increases over the transition from ionized to neutral regions. This density jump significantly increases the optical depth due to the high-density dust in the neutral region. Therefore, regardless of different luminosities, the optical depth exceeds unity just behind the ionizing front.
3.3. Metallicity dependence
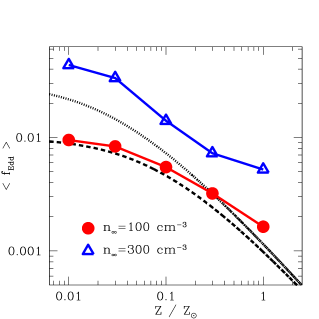
As star formation proceeds, the interstellar medium in galaxies becomes metal/dust enriched by type-II supernovae (e.g., Wise et al., 2012). Recent observations indicated a large dispersion of dust amount in high-redshift galaxies (Watson et al., 2015). Here we study the dependence of the BH accretion luminosity on the gas metallicity and therefore the dust abundance (since we assume a constant dust-to-metal mass ratio). Figure 7 shows as a function of metallicity. As the metallicity increases, monotonically decreases, and ranges from at to at . We examine the metallicity dependence based on the assumption of steady spherical inflow of ionized gas ( i.e., Bondi accretion inside the ionized bubble). In the case without dust, we estimate the accretion rate of Bondi-like inflow in the ionized region () as follows:
| (10) |
where is the dimensionless mass accretion rate, and are the density and the sound speed of ionized gas. The value of depends on the polytropic index of the equation of state, i.e., , and ranges from for an isothermal gas to for the adiabatic case. When we assume that the gas inflow is isothermal and consists of ionized hydrogen and helium with the temperature , the accretion rate from Eq. (10) is times smaller than the Bondi rate calculate from the density and temperature of the ambient medium. This reduction of the accretion rate is roughly similar to our simulation results and previous works (Milosavljević et al., 2009; Park & Ricotti, 2012; Sugimura et al., 2016). Note that, however, the inflow of primordial gas causes periodic bursts as shown in the Sec. 3.1. These bursts can increase the time averaged accretion rate with respect to that estimated above (see also, Park & Ricotti, 2012).
Next, we modify the above accretion rate by taking into account the radiation pressure on dust. Due to radiation pressure, the net inward force is reduced. In the optically thin regime (), the fractional reduction of the inward gravitational force is independent to the radial distance, and depends only on the BH luminosity. In this case, the accretion rate is
| (11) |
By solving this second order equation, we derive an analytical estimate of the accretion rate and luminosity. The analytically estimated Eddington ratios are shown as dashed () and dotted () lines in the Figure 7. As shown in the figure, the modified Bondi rate considering the radiation force roughly explains the metallicity dependence of the accretion rate in the simulations with radiation pressure on dust. Note that, in the high metallicity and high density cases differ from the value estimated above, whereas it in the case with our analytical estimate is good fit to the simulation results. When the density and metallicity are high, the size of Hii bubble is close to the Bondi radius (e.g., Park & Ricotti, 2012). Therefore, the gas density in the ionized region can become somewhat higher than that estimated assuming pressure equilibrium across the ionization front due to the BH gravitational potential, resulting in higher accretion rate.
3.4. Mass dependence
Here we study the BH mass dependence on the gas accretion rate for our fiducial runs with . Park & Ricotti (2012) showed that the accretion rate normalized by the Bondi rate did not change for different BH masses when . Figure 8 shows the time averaged Eddington ratios for different BH masses. As shown in Park & Ricotti (2012), independently of the BH mass in the case without dust. We find that the same result holds even when including dust. Thus, regardless of the dust and metallicity of the gas, we confirm that the results are scale-free under the condition .

3.5. Thermal emission from dust
Dust releases the energy absorbed at UV wavelengths as thermal emission in the IR. Here we investigate the IR properties of the dusty gas accreting onto the BH. The dust temperature can be estimated by assuming radiative equilibrium:
| (12) |
This equation assumes equilibrium between dust absorption of the radiation emitted by the BH (left-hand side) and the thermal emission from dust (right-hand side). By solving this equation, we estimate the dust temperature of each gas shell. We assume at UV wavelengths for the left-hand side of the equation, and use estimated in Laor & Draine (1993) for the right-hand side. In order to estimate the thermal emission by dust we post-process the simulation results, calculating the absorbed flux by dust. In the estimation of the dust thermal emission, we neglect the absorption of ionizing photons by hydrogen and helium. This is because the absorbed energy is converted into recombination and cooling radiation, e.g., Ly photons. These recombination UV photons are eventually absorbed by dust. In addition, by considering only dust absorption, the IR properties do not change significantly even if we consider different choices for the SED from the accretion disk, e.g., a SED extending to soft-UV range. Figure 9 shows the dust temperature as a function of distance from the BH. During the high-accretion phase, the dust temperature is near the inner boundary of the simulation, and decreases as the distance increases due to the geometrical attenuation of the flux . Due to the strong attenuation of UV flux outside the I-front, the dust temperature sharply drops at . In regions where , the dust temperature of silicate is somewhat lower than graphite. This is because of silicates is higher than graphite in that temperature range, thus the efficient thermal photon emissivity results in the lower temperature.
In order to better understand the radial profile of the dust temperature, we re-write Equation (12) as:
| (13) |
where is radiation flux and is the frequency-averaged dust absorption coefficient. Therefore, the dust temperature is
| (14) |
For , this equation is scaled as follows:
| (15) |
As shown by the figure, the dust temperature roughly decreases as . However, note that, decreases as the dust temperature decreases. Therefore, the radial profile of the dust temperature is somewhat shallower than .
The lower panel of Fig. 9 shows the radial dependence of the fraction of energy absorbed by the dust per unit radial log bin, normalized by the total luminosity. During the quiescent accretion phase, most of energy is absorbed by dust near the ionizing front. This is because the optical depth at is much smaller than unity as shown in Fig. 6. Therefore, most of IR emission comes from cold dust with near the ionizing front. As the accretion rate increases, a fraction of the radiation is absorbed by dust near the inner boundary of calculation box due to higher gas and dust density. This results in a large contribution to the IR luminosity by the inner hot dust with .


By integrating the thermal emission of each spherical shell, we derive SEDs. Figure 10 shows the SEDs at (red line), (green line), and (blue line). The red and blue lines correspond to the ones in Fig. 9. We also show the frequency ranges of Spitzer, JWST, Hershel and ALMA. Due to the contribution to the IR luminosity by hot dust, the SED during the high accretion phase shows stronger IR emission at . The specific luminosity at these wavelengths varies by several orders of magnitude between the quiescent phase with low Eddington ratio and the bursty phase at higher Eddington ratio. On the other hand, at the specific luminosity remains nearly constant during the accretion cycle, because the cold dust with near the ionization front, always absorbs and reprocesses a large fraction of the radiation. Recently, Shimizu et al. (2017) showed that the IR SEDs of AGNs selected from their hard X-ray luminosity using Swift BAT, correlates with the X-ray luminosity : with increasing , the flux at short wavelength also increases. If the BH masses of the observed AGNs in the sample are similar each other, these variations of the SEDs can be explained by the different phases of accretion and the Eddington ratios as explained above. An estimate of the masses and Eddington ratios of these hard X-ray selected AGNs is currently in progress (T. Shimizu, private communication). With the caveat of being able to isolate the AGN contribution from the stellar contribution in the IR SEDs, the results of this study can be used to test our model predictions.
We also show the contributions of graphite and silicate grains, separately. The stretching resonance of astronomical silicate grains produces the bump in the SED at . At shorter wavelengths (), the contribution from graphite grains is dominant. In this work, we have not considered re-absorption of the thermal emission by dust, because the absorption cross-section of dust to IR photons is quite small and we assume that the ambient gas is optically thin at IR wavelengths. However, if the hydrogen column density of the gas reservoir fueling the BH is much higher than , some IR radiation emitted by hot dust can be absorbed by the dust and re-processed to thermal emission at lower dust temperature. This can somewhat suppress the IR flux at short wavelength.
Fig. 11 shows the relation between the Eddington ratio, , and the flux density ratio between and () multiplied by the square root of bolometric luminosity, (in units of ). As shown in Fig. 10, the flux at depends sensitively on the presence of a hot dust component. Therefore we choose the flux at as diagnostic of the high-accretion phase. The wavelengths and correspond to the peak emission of two black body spectra with temperatures of K and , respectively. We find that this flux ratio tightly correlates with . The correlation between and varies with the BH mass, and dust size, mainly because the temperature of the warm and hot dust components depend on these physical parameters. However, tightly correlates with regardless of the assumed initial background density. Yet, we can use our knowledge of to correct for these effects and recover regardless of the different physical parameters of the SMBH, that are generally unknown observationally. The different panels in the figure illustrate the tight correlation between and , that holds by varying different physical parameters by many orders of magnitude. We find that the correlation can be roughly fitted by the following relationship:
| (16) |
Therefore, keeping into account that our model is still very simplistic, it may be possible to use IR observations of warm and hot dust obscuring SMBHs to estimate and , and therefore derive and the SMBH mass as
| (17) |
Since , we can use Eq. (16) to show that . Therefore, for a fixed BH mass, we indeed find . Instead, keeping constant , while varying the density and/or BH mass, we find (see Eq. 6). Using Eq. 15, the dust temperature at is (here we ignore a weak dependence on ). Therefore, the weak mass dependence in the figure indicates decreases as decrease with increasing the BH mass (and ).
We also study the SEDs for different dust size models, and . The right panel of Fig. 11 shows the correlations in the cases of different dust sizes. Unlike the tight correlations found for different BH masses and densities, models with the different dust sizes produce a systematic change in shape of the relationship. Since at IR band decreases with dust size, smaller dust grains become hotter when irradiated by the same UV flux as shown in Eq. (15). Moreover, the size of the Hii region becomes smaller as the dust size decreases (see Eq. (2)). Thus, models with smaller dust tend to have higher for a fixed . In the same panel we also show the correlation for the low-metallicity (low-dust) case with . As the metallicity decreases, the BH luminosity and the ionize bubble radius, , increase. As a result, the dust temperature does not change significantly, producing the same correlation as in the fiducial case with . Therefore we suggest the uncertainty of metallicity is not needed to be considered.
Can JWST or ALMA observe thermal emission from the dust obscuring massive BHs in nearby galaxies? For low-redshift AGNs, the flux from hot dust at rest-frame can be observed by JWST, while the warm dust emission at is in the wavelength range covered by Spitzer. Even if we measure the flux density ratio between and (instead of ) that is in the waveband covered by ALMA, as similar relationship between and the flux ratio is found. Therefore ALMA can also be used to trace the cold dust at .
Using the specific luminosities derived above, we estimate the flux densities from dust around massive BHs at a specific redshift as where is the luminosity distance, is the frequency in the observer rest frame, and is the frequency in the galaxy’s rest frame. Here we artificially put BHs at , and discuss their observability by JWST or ALMA. Figure 12 shows the flux densities as a function of redshift. The dotted lines show the sensitivities of JWST and ALMA. We show the flux densities at (), () and () in the observer frame. Due to the negative K-correction, the flux density at decreases slowly with increasing redshift, whereas that at decreases more steeply at . At higher redshift, the flux at in observer rest frame corresponds to a wavelength in the galaxy’s rest frame of which can be shorter than the peak wavelength of modified black body of even hot dust, resulting in the decreases of the flux. As a result, the flux density at becomes higher than that at at . The relation between and changes depending on the BH mass and . As shown above, is lower than or when is low. Even at high-accretion phase (), is higher than in the case of massive BH with . Under the constraint , we have (see Eq. 6). Therefore, the dust temperature at the ionization front is lower in massive BHs (see Eq. 15), leading to a higher .
In summary, we find that only massive BH of mass at can be observed by ALMA. On the other hand, JWST will allow us to observe the dust thermal emission from more distant massive BHs. It will be able to probe hot dust obscuring BHs of with up to . When , even a BH at can be observed. Thus we suggest JWST and ALMA will be powerful tools to probe IMBHs via the observation of dust thermal emission. In general, the IR flux increases as the product increases. For instance, for the case of a accreting from gas with density and metallicity , ALMA and JWST can probe BHs up to . However, even upcoming new telescopes will be difficult to observe IMBHs at in the IR.
In our simulations, we have investigated the accretion dynamics of spherically symmetric clouds with isotropic radiation field in which the accretion rate and luminosity can be suppressed significantly. Recently, Sugimura et al. (2016) suggested the gas efficiently accreted onto a BH if the radiation is anisotropic due to shadowing effects near the edge of the BH accretion disk or torus. In this case, can become , and even relatively massive BHs at high-redshifts may be observable by JWST or ALMA, although the dust temperature and SEDs can differ from our current works.


4. Discussion
4.1. Dust decoupling
In this work we have assumed that the motion of dust is completely coupled to the gas through collisions between gas and dust particles. Here we simply estimate the coupling time scale. At first, we consider the momentum equation for the relative velocity between dust and gas:
| (18) |
Therefore, the time scale for the dust coupling with gas is roughly
| (19) |
This coupling timescale is much shorter than dynamical timescale and the period between bursts in our current simulations. Thus the assumption of the complete coupling is reasonable.
4.2. Dust destruction
The dust formation/destruction processes have not been considered in our simulations. Even at innermost cell (), the dust temperature does not exceed the dust sublimation temperature. For the sublimation temperatures of graphite grains, , we estimate the destruction radius as follows:
| (20) |
Thus, the dust can survive sublimation by photoheating even inside the inner boundary of the calculation box.
On the other hand, the destruction by thermal sputtering process, i.e., collisions between dust and gas, is likely to be effective near the BH because of the high-density and temperature found at the innermost cells in our simulations. The destruction time scale by the thermal sputtering is estimated (Draine & Salpeter, 1979; Draine, 2011) as follows:
| (21) |
During the quiescent phase, the density, temperature and inflow velocity at the innermost cell are and , respectively. Therefore, during this phase in the duty cycle, the sputtering time scale is shorter than the inflow time scale, and the dust is likely to be destroyed inside the inner boundary of the calculation box. However, during the peaks of accretion, the temperature somewhat decreases and the velocity increases, resulting in the longer sputtering time scale. Therefore, during the accretion burst dust can survive even close to a BH, and can absorb UV radiation emitted during the burst. However, as shown in Figure 9, the contribution to the opacity by dust absorption at radii smaller than the inner boundary in our simulations is not significant. In addition, Compton heating increases the temperature of gas at such the scale (Park et al., 2014b), leading to enhancement of dust destruction. Yet, photo-ionization heating of metals is not included in this work. This heating can expand the destruction radius. These detailed heating processes will be considered in our future works.
In this work, we adopt a single-size dust model in the calculations. When considering a realistic dust size distribution, the destruction radius depends on the dust size. This is because small dust grains can have higher temperature, hence they reach the sublimation temperature at larger distance. In addition, the destruction time scale by thermal sputtering is proportional to the size. Thus, smaller dust grains are more easily destroyed near the BH compared to larger dust grains. This indicates that the dust size distribution changes with radial distance.
4.3. Revisited condition for hyper-Eddington accretion
In this work we have investigated the density dependence up to . This condition allows the ionizing front to propagate far from the Bondi radius in the case without dust. Recently, Inayoshi et al. (2016) suggested that BHs could grow at super-Eddington rate if they are embedded in very high-density gas clouds where the size of ionized bubble is smaller than the Bondi radius. This is because the ionized bubble is gradually shrunk as the gas density near the ionization front increases due to the gravitational force by the BH. Finally the ionized bubbles disappear, resulting in no radiation force on electrons. As a result the growth rate of BH becomes close to the Bondi rate which can be much higher than the Eddington limit, i.e., so-called the hyper-Eddington accretion. They estimated the critical gas density for the hyper-Eddington accretion by comparing the Strömgren radius to the Bondi radius. By calculating the Strömgren radius for the density inside the ionized region (which is smaller than by a factor ), we derive the critical density:
where we have assumed . On the other hand, in the case of dusty gas, the size of ionized region is regulated by the dust opacity if the metallicity is higher than a critical value ( i.e., if ). In this regime, the size of ionization region is close to the photon mean free path, i.e., . Thus, the critical density for super-Eddington accretion in a dusty gas is:
| (22) |
This critical density is much lower than that for the primordial gas case. However, the effect of dust in the regime of super-Eddington accretion, in addition to reducing the size of the ionized bubble, is to reduce the accretion rate due to the radiation pressure on dust. Radiation pressure is effective at radii larger than the size of the ionization region, as long as . Therefore, if the ram pressure force can overcome the radiation force on dust at the radius of , the dusty gas may be able to efficiently accrete onto the BH. The accretion dynamics of high-density dusty clouds will be investigated in future works with further improvements to the code.
5. Summary
In this paper we have studied the accretion of dusty gas onto an intermediate mass black hole (IMBH) by using one-dimensional radiation hydrodynamics simulations. Park & Ricotti (2011) showed that the growth of BH was significantly regulated due to the photo-ionization feedback in the case of primordial gas. As star formation proceeds, high-redshift galaxies are metal/dust enriched due to type-II supernovae. Recent observations have detected dust-rich galaxies even at (e.g., Riechers et al., 2013). This indicates some BHs grew in dusty gas with the feedback. In this paper, we investigate the effects of dust on the growth of BH and observable diagnostics due to the thermal emission from heated dust. Dust affects the accretion rate and period of the bursts of accretion mainly because of radiation pressure on dust but also because of the dust opacity that reduces the size of the ionization region.
By assuming as a fiducial model accretion onto a BHs of embedded in a uniform density medium, we investigate the dependence of the BH growth rate on the gas density (in the range to ), and on the metallicity (in the range to ). We find that the accretion of dusty gas onto IMBHs proceeds gently with small fluctuations of the accretion rate, whereas that of primordial gas causes periodic bursts. For dust-to-gas mass ratio similar to the solar neighborhood, the time averaged luminosity becomes smaller than that for primordial gas by one order of magnitude. The time averaged Eddington ratio is for the initial gas density . Our calculations show that the effect of dust opacity is secondary with respect to radiation pressure on dust. Neglecting radiation pressure on dust but including the effect of dust opacity, the growth rate of IMBHs and are smaller than that of primordial gas by a factor . For both primordial and dusty clouds, the Eddington ratio, , linearly increases with the initial gas density. In addition, assuming the constraint , we study the dependence of the growth rate on the BH mass. We show that is constant for the different BH masses in the both cases with and without dust.
Finally, we derive the SEDs at IR bands by calculating dust thermal emission. Our modeled SEDs show that the flux ratio at and depends sensitively on the Eddington ratio, but is nearly independent of the other parameters in the problem. This is because at high Eddington ratios the thermal emission from hot dust near the BH produces a higher flux density at . While the emission at , that is produced by warmer dust further out, near the ionization front, is nearly independent of . Therefore, we suggest that the combinations of MIR observations by JWST and FIR observation by Hershel or ALMA can be combined to provide a novel method to estimate the Eddington ratio of BHs throughout their duty cycle, including their short bursty phase and their longer quiescent phase.
Acknowledgments
The numerical simulations were performed on the computer cluster, Draco, at Frontier Research Institute for Interdisciplinary Sciences of Tohoku University. This work is supported in part by MEXT/JSPS KAKENHI Grant Number 15H06022 (HY) and 15J03873 (KS).
References
- Agarwal et al. (2012) Agarwal, B., Khochfar, S., Johnson, J. L., Neistein, E., Dalla Vecchia, C., & Livio, M. 2012, MNRAS, 425, 2854
- Alvarez et al. (2009) Alvarez, M. A., Wise, J. H., & Abel, T. 2009, ApJ, 701, L133
- Begelman et al. (2006) Begelman, M. C., Volonteri, M., & Rees, M. J. 2006, MNRAS, 370, 289
- Bertoldi et al. (2003) Bertoldi, F., Carilli, C. L., Cox, P., Fan, X., Strauss, M. A., Beelen, A., Omont, A., & Zylka, R. 2003, A&A, 406, L55
- Ciotti & Ostriker (2007) Ciotti, L., & Ostriker, J. P. 2007, ApJ, 665, 1038
- Devecchi et al. (2012) Devecchi, B., Volonteri, M., Rossi, E. M., Colpi, M., & Portegies Zwart, S. 2012, MNRAS, 421, 1465
- Di Matteo et al. (2008) Di Matteo, T., Colberg, J., Springel, V., Hernquist, L., & Sijacki, D. 2008, ApJ, 676, 33
- Di Matteo et al. (2012) Di Matteo, T., Khandai, N., DeGraf, C., Feng, Y., Croft, R. A. C., Lopez, J., & Springel, V. 2012, ApJ, 745, L29
- Draine (2011) Draine, B. T. 2011, Physics of the Interstellar and Intergalactic Medium
- Draine & Lee (1984) Draine, B. T., & Lee, H. M. 1984, ApJ, 285, 89
- Draine & Salpeter (1979) Draine, B. T., & Salpeter, E. E. 1979, ApJ, 231, 77
- Draine et al. (2007) Draine, B. T., et al. 2007, ApJ, 663, 866
- Hayes et al. (2006) Hayes, J. C., Norman, M. L., Fiedler, R. A., Bordner, J. O., Li, P. S., Clark, S. E., ud-Doula, A., & Mac Low, M.-M. 2006, ApJS, 165, 188
- Hensley et al. (2014) Hensley, B. S., Ostriker, J. P., & Ciotti, L. 2014, ApJ, 789, 78
- Inayoshi et al. (2016) Inayoshi, K., Haiman, Z., & Ostriker, J. P. 2016, MNRAS, 459, 3738
- Inayoshi et al. (2014) Inayoshi, K., Omukai, K., & Tasker, E. 2014, MNRAS, 445, L109
- Jeon et al. (2012) Jeon, M., Pawlik, A. H., Greif, T. H., Glover, S. C. O., Bromm, V., Milosavljević, M., & Klessen, R. S. 2012, ApJ, 754, 34
- Katz et al. (2015) Katz, H., Sijacki, D., & Haehnelt, M. G. 2015, MNRAS, 451, 2352
- Kormendy & Ho (2013) Kormendy, J., & Ho, L. C. 2013, ARA&A, 51, 511
- Laor & Draine (1993) Laor, A., & Draine, B. T. 1993, ApJ, 402, 441
- Latif et al. (2013) Latif, M. A., Schleicher, D. R. G., Schmidt, W., & Niemeyer, J. C. 2013, MNRAS, 436, 2989
- Li et al. (2007) Li, Y., Hernquist, L., Robertson, B., Cox, T. J., Hopkins, P. F., Springel, V., Gao, L., Di Matteo, T., Zentner, A. R., Jenkins, A., & Yoshida, N. 2007, ApJ, 665, 187
- Maiolino et al. (2004) Maiolino, R., Schneider, R., Oliva, E., Bianchi, S., Ferrara, A., Mannucci, F., Pedani, M., & Roca Sogorb, M. 2004, Nature, 431, 533
- Mathis et al. (1977) Mathis, J. S., Rumpl, W., & Nordsieck, K. H. 1977, ApJ, 217, 425
- Milosavljević et al. (2009) Milosavljević, M., Couch, S. M., & Bromm, V. 2009, ApJ, 696, L146
- Mortlock et al. (2011) Mortlock, D. J., Warren, S. J., Venemans, B. P., Patel, M., Hewett, P. C., McMahon, R. G., Simpson, C., Theuns, T., Gonzáles-Solares, E. A., Adamson, A., Dye, S., Hambly, N. C., Hirst, P., Irwin, M. J., Kuiper, E., Lawrence, A., & Röttgering, H. J. A. 2011, Nature, 474, 616
- Namekata et al. (2014) Namekata, D., Umemura, M., & Hasegawa, K. 2014, MNRAS, 443, 2018
- Omukai (2001) Omukai, K. 2001, ApJ, 546, 635
- Park & Ricotti (2011) Park, K., & Ricotti, M. 2011, ApJ, 739, 2
- Park & Ricotti (2012) —. 2012, ApJ, 747, 9
- Park & Ricotti (2013) —. 2013, ApJ, 767, 163
- Park et al. (2014a) Park, K., Ricotti, M., Di Matteo, T., & Reynolds, C. S. 2014a, MNRAS, 437, 2856
- Park et al. (2014b) —. 2014b, MNRAS, 445, 2325
- Park et al. (2016) Park, K., Ricotti, M., Natarajan, P., Bogdanović, T., & Wise, J. H. 2016, ApJ, 818, 184
- Portegies Zwart & McMillan (2002) Portegies Zwart, S. F., & McMillan, S. L. W. 2002, ApJ, 576, 899
- Priddey et al. (2003) Priddey, R. S., Isaak, K. G., McMahon, R. G., Robson, E. I., & Pearson, C. P. 2003, MNRAS, 344, L74
- Rees (1978) Rees, M. J. 1978, The Observatory, 98, 210
- Richards et al. (2006) Richards, G. T., Strauss, M. A., Fan, X., Hall, P. B., Jester, S., Schneider, D. P., Vanden Berk, D. E., Stoughton, C., Anderson, S. F., Brunner, R. J., Gray, J., Gunn, J. E., Ivezić, Ž., Kirkland, M. K., Knapp, G. R., Loveday, J., Meiksin, A., Pope, A., Szalay, A. S., Thakar, A. R., Yanny, B., York, D. G., Barentine, J. C., Brewington, H. J., Brinkmann, J., Fukugita, M., Harvanek, M., Kent, S. M., Kleinman, S. J., Krzesiński, J., Long, D. C., Lupton, R. H., Nash, T., Neilsen, Jr., E. H., Nitta, A., Schlegel, D. J., & Snedden, S. A. 2006, AJ, 131, 2766
- Ricotti & Gnedin (2005) Ricotti, M., & Gnedin, N. Y. 2005, ApJ, 629, 259
- Ricotti et al. (2016) Ricotti, M., Parry, O. H., & Gnedin, N. Y. 2016, ApJ, 831, 204
- Riechers et al. (2013) Riechers, D. A., Bradford, C. M., Clements, D. L., Dowell, C. D., Pérez-Fournon, I., Ivison, R. J., Bridge, C., Conley, A., Fu, H., Vieira, J. D., Wardlow, J., Calanog, J., Cooray, A., Hurley, P., Neri, R., Kamenetzky, J., Aguirre, J. E., Altieri, B., Arumugam, V., Benford, D. J., Béthermin, M., Bock, J., Burgarella, D., Cabrera-Lavers, A., Chapman, S. C., Cox, P., Dunlop, J. S., Earle, L., Farrah, D., Ferrero, P., Franceschini, A., Gavazzi, R., Glenn, J., Solares, E. A. G., Gurwell, M. A., Halpern, M., Hatziminaoglou, E., Hyde, A., Ibar, E., Kovács, A., Krips, M., Lupu, R. E., Maloney, P. R., Martinez-Navajas, P., Matsuhara, H., Murphy, E. J., Naylor, B. J., Nguyen, H. T., Oliver, S. J., Omont, A., Page, M. J., Petitpas, G., Rangwala, N., Roseboom, I. G., Scott, D., Smith, A. J., Staguhn, J. G., Streblyanska, A., Thomson, A. P., Valtchanov, I., Viero, M., Wang, L., Zemcov, M., & Zmuidzinas, J. 2013, Nature, 496, 329
- Sakurai et al. (2016) Sakurai, Y., Inayoshi, K., & Haiman, Z. 2016, MNRAS, 461, 4496
- Shimizu et al. (2017) Shimizu, T. T., Mushotzky, R. F., Meléndez, M., Koss, M. J., Barger, A. J., & Cowie, L. L. 2017, MNRAS, 466, 3161
- Sijacki et al. (2009) Sijacki, D., Springel, V., & Haehnelt, M. G. 2009, MNRAS, 400, 100
- Stone & Norman (1992) Stone, J. M., & Norman, M. L. 1992, ApJS, 80, 753
- Sugimura et al. (2016) Sugimura, K., Hosokawa, T., Yajima, H., & Omukai, K. 2016, ArXiv e-prints
- Sugimura et al. (2014) Sugimura, K., Omukai, K., & Inoue, A. K. 2014, MNRAS, 445, 544
- Volonteri & Begelman (2010) Volonteri, M., & Begelman, M. C. 2010, MNRAS, 409, 1022
- Wang et al. (2013) Wang, R., Wagg, J., Carilli, C. L., Walter, F., Lentati, L., Fan, X., Riechers, D. A., Bertoldi, F., Narayanan, D., Strauss, M. A., Cox, P., Omont, A., Menten, K. M., Knudsen, K. K., Neri, R., & Jiang, L. 2013, ApJ, 773, 44
- Watson et al. (2015) Watson, D., Christensen, L., Knudsen, K. K., Richard, J., Gallazzi, A., & Michałowski, M. J. 2015, Nature, 519, 327
- Wise et al. (2012) Wise, J. H., Turk, M. J., Norman, M. L., & Abel, T. 2012, ApJ, 745, 50
- Wu et al. (2015) Wu, X.-B., Wang, F., Fan, X., Yi, W., Zuo, W., Bian, F., Jiang, L., McGreer, I. D., Wang, R., Yang, J., Yang, Q., Thompson, D., & Beletsky, Y. 2015, Nature, 518, 512
- Yajima & Khochfar (2016) Yajima, H., & Khochfar, S. 2016, MNRAS, 457, 2423
- Yajima et al. (2015) Yajima, H., Shlosman, I., Romano-Díaz, E., & Nagamine, K. 2015, MNRAS, 451, 418