Evolution of coherent collective modes through consecutive CDW transitions in (PO2)4(WO3)12 mono-phosphate tungsten bronze
Abstract
All optical femtosecond relaxation dynamics in a single crystal of mono-phosphate tungsten bronze (PO2)4(WO3)2m with alternate stacking of WO3 layers was studied through the three consequent charge density wave (CDW) transitions. Several transient coherent collective modes associated to the different CDW transitions were observed and analyzed in the framework of the time dependent Ginzburg-Landau theory. Remarkably, the interference of the modes leads to an apparent rectification effect in the transient reflectivity response. A saturation of the coherent-mode amplitudes with increasing pump fluence well below the CDWs destruction threshold fluence indicates a decoupling of the electronic and lattice parts of the order parameter under strong optical drive.
I Introduction
Time-resolved spectroscopy can give unique insight in the dynamical behaviour of the elementary excitations in systems undergoing charge density wave (CDW) transitions. The appearance of new collective vibrational excitations in RamanTravaglini et al. (1983); Sugai (1985); Lavagnini et al. (2010) and coherent transient reflectivityDemsar et al. (1999); Shimatake et al. (2007); Yusupov et al. (2008) response upon charge density wave (CDW) formation is well documentedTravaglini et al. (1983); Sugai (1985); Demsar et al. (1999); Shimatake et al. (2007); Lavagnini et al. (2010); Schäfer et al. (2010); Yusupov et al. (2008) and theoretically quite well understood.Schäfer et al. (2010) In systems with more than one CDW transition new collective modes are expected to appear below each transition temperature, as observed experimentally in the Raman responseSugai (1985); Lavagnini et al. (2010). In the transient reflectivity responseYusupov et al. (2008); Borovšak et al. (2016), however, the additional coherent oscillation modes below the subsequent CDW transition temperatures have not been readily observed. Investigating the differences in the response associated with different transitions gives important information on the coupling and damping of collective modes, and behaviour of the order parameter in each case.
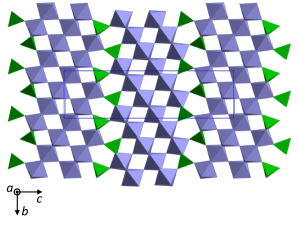
The mono-phosphate tungsten bronzes (PO2)4(WO3)2m are an example of low dimensional CDW materialsFoury et al. (1991) offering a possibility to further explore the effect of consecutive CDW transitions on the transient-reflectivity coherent oscillatory response. They are quasi two-dimensional (2D) conductors built from layers of WO6 octahedra parallel to the -plane and separated by PO4 tetrahedra Foury and Pouget (1993); Roussel et al. (2001); Foury and Pouget (2002); et al. (2004) as shown in Fig. 1. Their electronic properties arise from quasi-one-dimensional chain structures where - due to the strong Fermi surface nesting - charge-density-wave (CDW) instabilities develop below certain critical transition temperatures , as confirmed by various experimental techniquesFoury and Pouget (1993); Schlenker et al. (1996); Greenblatt (1996). For (PO2)4(WO3)2m with in particular three CDW transitions have been observed: K, K and KFoury and Pouget (1993); Wang et al. (1989); Foury et al. (1991).
Up to date, a substantial effort has been put into studying the electronic, magnetic and structural properties of (PO2)4(WO3)2m bronzes, Schlenker (1989); Greenblatt (1993); Schlenker (1996) however, to the best of our knowledge there is no Raman or time-resolved optical spectroscopy study of the sequence of CDW phases in (PO2)4(WO3)2m tungsten bronzes. In this paper we therefore report on temperature and fluence dependence of the transient reflectivity in a mono-phosphate tungsten bronze (PO2)4(WO3)2m single crystal with (P4W12O44) on a femtosecond time scale, focusing on the effect of the subsequent CDW transitions on the coherent oscillatory transient response.
II Experimental
Single crystals used in this study were grown at CRISMAT (Caen, France) according to a previously reported method.Ph. Labbé (1986) They have a shape of platelets with large surface of about (11.5) mm2, corresponding to the conducting plane, and a thickness of 1/10 mm along c. The index of the bronze was unambiguously determined by the measurement of the inter-slab periodicity Roussel et al. (2001) ( for ).
Optical experiments were performed with 50 fs laser pulses at 800 nm generated from an amplified Ti:Sapphire mode-locked laser at a 250 kHz repetition rate. The transient reflectivity , where and are the reflectivities in the absence and presence of the pump pulse, respectively, was monitored using a standard pump-probe technique where both pump and probe photons were at 1.55 eV photon energy. The beam diameters on the sample were determined by means of calibrated pinholes to be 108 m and 50 m for the pump and probe beam, respectively. Both beams were perpendicularly polarized to each other and oriented relatively to the crystal axes in a way to obtain maximum/minimum response amplitude at low temperatures. Before optical measurements the single crystals were cleaved by means of scotch tape and mounted on a cold finger of a liquid-He flow optical cryostat equipped with CaF2 windows.
III Results
III.1 Experimental data
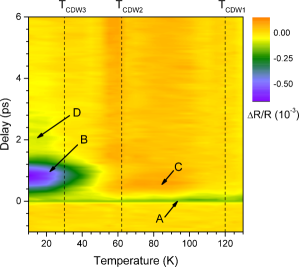
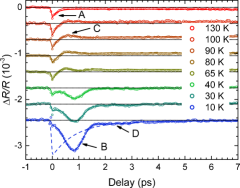
In Figs. 2, 3 and 4 we show the temperature dependence of the transient reflectivity () in (PO2)4(WO3)12 taken at a pump fluence of 8 J/cm2. The response is characterized by four main features.
The first is a sub-picosecond negative transient (feature A), which changes only little with decreasing .
The second and the most prominent is a larger picosecond negative transient (feature B) that appears on top of feature A below K. Remarkably, feature B (Fig. 3) displays a risetime that appears slightly longer than the decay time.
The third is a small positive feature C (see Fig. 3) peaked at ps that appears below K and develops into a weak oscillation when approaching .
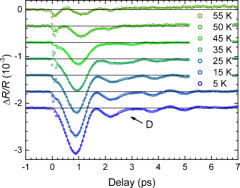
The fourth is a negative shoulder together with additional weak oscillations beyond ps delay (feature D in Figs. 3 and 4), that appear below the lowest transition at K.
The feature-D weak oscillations were not completely reproducible between different experimental runs. While the -dependence shown in Fig. 4 was measured in the first run immediately after cleaving the sample the data shown in Fig. 3 were measured in the second run after keeping the sample in vacuum for 12 days. Since it is not possible to measure exactly the same sample spot in different runs it is not clear whether the difference can be attributed to deterioration of the sample surface or surface inhomogeneity.
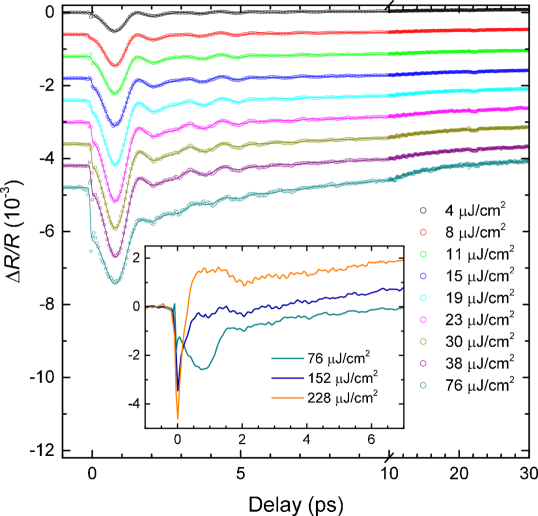
In Fig. 5 we plot the pump fluence dependence of the transient reflectivity measured at K during the first run. The magnitude of the transients shows saturation with increasing above J/cm2. With further fluence increase the response changes qualitatively above J/cm2 as shown in the inset of Fig. 5.
III.2 Analysis
An unusual feature of the data, which we need to understand, is that at the lowest temperatures the risetime of feature B apparently exceeds the decay time. Due to the ubiquitous appearance of a coherent collective oscillations in the transient reflectivity upon CDW formationDemsar et al. (1999); Shimatake et al. (2007); Yusupov et al. (2008) it is very likely that the unusual shape of feature B is due to an interference between coherent oscillations. To test this hypothesis and get better insight into the unusual shape of feature B we fit the data using the theory of displacive coherent excitation (DCE) of oscillatory modesZeiger et al. (1992):
| (1) |
with and . is the effective pump-probe pulse cross-correlation width, , , are oscillator amplitudes, frequencies and damping factors, respectively, while and are amplitudes and relaxation times of the overdamped exponentially relaxing modes.
We also assume that all oscillators are driven by a single exponential term with relaxation time , while the remaining exponential relaxations are kept independent from the oscillators. Note that the oscillator coordinates contain both the exponentially relaxing and oscillatory components.
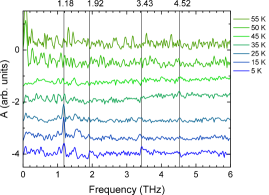
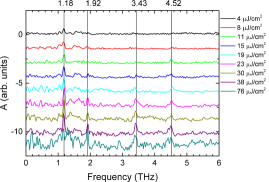
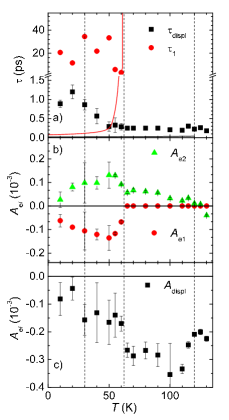
It turns out that it is possible to fit the main features of the data using four oscillators at , , and THz with two independent exponential relaxations ( ps and ns) in addition to the main relaxation component ( ps) that drives the oscillators. Fourier transforms of the fit residua shown in Figs. 6 and 7 reveal additional four clearly resolvable modes at the lowest .
IV Discussion
The presence of collective coherent oscillatory excitations in the photoinduced transient response of various CDWs is ubiquitous Demsar et al. (1999); Shimatake et al. (2007); Yusupov et al. (2008); Schmitt et al. (2008); Perfetti et al. (2008); Tomeljak et al. (2009) and comes from the coupling of phonons to the electronic order parameter which drives the transitionSchäfer et al. (2010). In most cases several weakly damped coherent oscillations are observed well below the CDW transition temperatures, with widely different degrees of softening when approaching the transition from below.Demsar et al. (1999, 2002); Tomeljak et al. (2009); Shimatake et al. (2007); Yusupov et al. (2008) The softening has been parametrized using the time dependent Ginzburg-Landau (TDGL) theorySchäfer et al. (2010); Schaefer et al. (2014) by the adiabaticity ratio:
| (2) |
where is the bare damping of the electronic mode, the bare phonon frequency and the coupling between the electronic order parameter and the bare phonon mode. corresponds to the adiabatic limit corresponding to the strongest degree of phonon softening. corresponds to the non-adiabatic case with no softening and increased damping of the oscillatory component when approaching the transition temperature from below. In this case the soft mode is the critically damped solution dominated by the electronic order parameter.Schaefer et al. (2014)
In the case of (PO2)4(WO3)12 the main coherent oscillations at THz and THz appear strongly damped down to the lowest with significantly weaker less-damped modes observed only below .
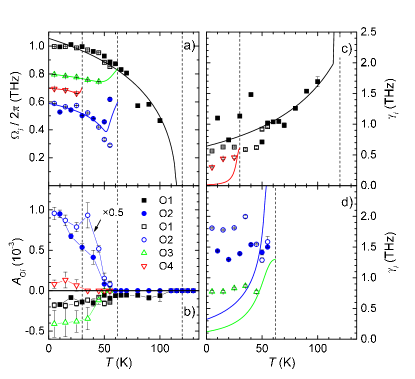
Despite being rather weak the -THz mode (O1) could be associated with the formation of CDW1 at . When approaching from below (see Fig. 8) it softens by % and with an increase of damping vanishes above K.
Below two additional modes appear. The strongest is the -THz mode (O2) which shows softening with increasing and vanishes above 55 K. Above 50 K the frequency shows large scatter between the two experimental runs, presumably due to a small amplitude and rather large damping that couples the fit parameters of modes O1 and O2. The second mode at Thz (O3) is weaker, but less damped with a softening of less than % disappearing above K.
Below another two modes appear. The strongest THz mode (O4) shows % softening with increasing , while the weaker one at Thz, that was not included in fits (see Figs. 6 and 7) shows virtually no softening.
The three higher frequency modes observed clearly at higher fluences (see Fig. 7) can not be clearly associated with any of the transitions due to the weak intensities at the pump fluence used for the scans.
| mode | (THz) | (THz) | (K) | |
|---|---|---|---|---|
| O1 | 1.0 | 1.6 | 2.8 | 120 |
| O2 | 0.53 | 0.75 | 1.2 | 62 |
| O3 | 0.79 | 0.79 | 0.3 | 62 |
| O4 | 0.69 | 0.71 | 0.3 | 30 |
The dependence of the mode frequencies is consistent with predictions of the TDGL modelSchäfer et al. (2010); Schaefer et al. (2014) as shown in Fig. 8 (a). However, except for mode O1 [see Fig. 8(c) and (d)] it is not possible to obtain simultaneous good fits for damping. The experimental dampings greatly exceed the model predictions for modes O2, O3 and O4, except near the CDW transitions, where the model dampings increase. We attribute excess damping at lower to the combination of extrinsic and intrinsic phonon damping that is not directly related to the CDWs and is not included in the TDGL modelSchäfer et al. (2010); Schaefer et al. (2014). The model also predicts a region of critical damping for mode O1 just below which is due to the vanishing amplitude experimentally inaccessible.
The main TDGL-theory parameters are shown in Table 1. The bare frequencies of modes O1 and O2 appear strongly renormalized by the coupling to the electronic order parameter, while the renormalization is small for the other modes.
The modelSchäfer et al. (2010) also predicts a second critically damped mode, that is weakly -dependent in the adiabatic case and softens at in the non-adiabatic case. For CDW1 the mode-O1 fit in Fig. 8 (a) and (c) implies a fast virtually -independent mode with fs, which is ten times faster that the fastest observed relaxation. If the excitation goes through a displacive mechanism involving electrons in the ungapped bands the fast mode would adiabatically follow the displacive drive resulting in the response consistent with the data.
In contrast, for CDW2 and CDW3 the fits to modes O2, O3 and O4 in Fig. 8 (a) imply overdamped soft modes with rather fast relaxation times diverging at the corresponding as shown for mode O2 by the red solid line in Fig 9 (a). None of the three observed exponential relaxation components (, , and ) show such a divergence and therefore cannot be directly associated with the overdamped part of the order parameter dynamics. This indicates that photons at the energy used in the present experiment (1.55 eV) are only weakly coupled to the electronic order parameters associated with CDW2 and CDW3.
The present behaviour is different from observationsBorovšak et al. (2016) in structurally similar111Both compounds contain similar octahedral layers separated by tetrahedral units, but with different stacking. -Mo4O11 where a diverging relaxation time of the overdamped soft mode is clearly observed while the phonon modes associated with the CDW formation show virtually no softening when approaching the CDW transition temperature. This is consistent with the the non-adiabatic limit of the TDGL theory. One of the reasons for a smaller adiabaticity ratio [see Eq. (2)] could be higer frequencies of the CDW related modes (1.93, 2.19 and 2.94 THz) in -Mo4O11 originating in the smaller Mo mass.
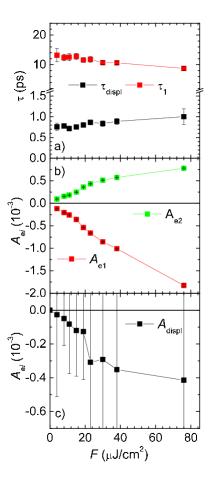
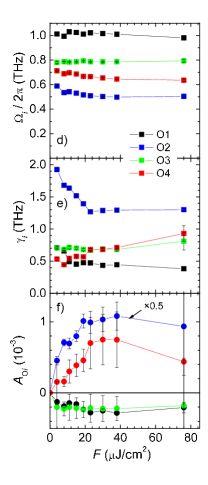
Looking at the pump fluence dependence of the DCE-model fit parameters in Fig. 10 we observe a clear saturation of the coherent-oscillatory-mode amplitudes above J/cm2 while the amplitudes of the exponential relaxation components show only a slightly sublinear behavior. Surprisingly, within error bars the amplitudes of all the oscillatory modes222The amplitude of mode O3 appears saturated below the lowest measured pump fluence. We believe that this is a fit artifact due to a strong correlation of the fit amplitude with mode O4, which has a very similar frequency, but the opposite phase. saturate at the same fluence. Except for the damping of the strongest mode O2 the other coherent-oscillatory-mode parameters also show no strong changes around and remain nearly constant up to J/cm2.
Previously it has been shown that increasing the pump fluence transiently suppresses and eventually destroys the CDW order.Perfetti et al. (2008); Schmitt et al. (2008); Tomeljak et al. (2009); Yusupov et al. (2010) Since in our experiment the CDW-induced modes remain clearly visible up to J/cm2 and are completely suppressed only at higher fluences the saturation at can not be attributed to the complete destruction of CDWs. It is however unusual, that even the amplitude of mode O4 associated with the weakest CDW3 shows only a moderate additional suppression with increasing above .
A similar behavior in 1T-TiSe2, where the periodic lattice distortion (PLD) persists upon destruction of the electronic ordering, has been attributedPorer et al. (2014) to sequential suppression of the electronic excitonic component of the CDW order at a lower and the Jahn-Teller component at a higher pump fluence. In the case of (PO2)4(WO3)12 it is believed that the CDWs are well described in the framework of the Pierls-like mechanism with "hidden" nesting vectors.Foury et al. (1991); Foury and Pouget (1993) In this picture the PLD and the electronic part of the order parameter work in conjunction to form CDWs. However, on a short timescale they can become decoupled due to their different intrinsic timescales. The saturation of the coherent-oscillatory-mode amplitudes can be therefore attributed to such decoupling. In the case when the electronic parts of CDWs are transiently completely suppressed and partially recover on a timescale the PLDs can not be completely suppressed. The rather short relaxation times, fs, of the overdamped modes suggested by the TDGL model fits are consistent with such scenario.
Independently of the above saturation scenario the decrease of the mode O2 damping with increasing fluence below could be attributed to the inhomogeneous excitation profile. Due to the finite light penetration depth the CDWs are more strongly suppressed near the surface. The relative contribution of the near-surface part of the excited volume to the response is therefore decreased leading to a decrease of damping in the case of an enhanced extrinsic damping of the mode due the surface effects.
V Summary and Conclusions
We investigated the effect of a sequence of three consecutive CDW transitions in a mono-phosphate tungsten bronze (PO2)4(WO3)2m () on the photoinduced ultrafast transient coherent oscillatory optical response. We clearly observe the appearance of new coherent oscillatory modes below each CDW transition. At low the interference of two rather strongly damped modes at and THz, which can be associated with CDW1 at 120 K and CDW2 at 62K, respectively, leads to an unusual rectified transient reflectivity with an inverted-Gaussian shape.
The -dependence of the coherent mode frequencies can be well described in the framework of the recently proposed TDGL modelSchäfer et al. (2010); Schaefer et al. (2014). The damping of the most strongly coupled mode at THz, which is coupled with CDW1 order parameter, is consistent with the TDGL model. On the other hand, the less strongly coupled modes associated with CDW2 and CDW3 show an additional intrinsic damping that does not originate from the coupling to the electronic order parameters.
Contrary to the oscillatory modes, no corresponding overdamped modes predicted by the TDGL model are observed using probe photons at 1.5 eV, which may be explained to be due to weak coupling between the 1.55-eV photons and the electronic parts of the respective order parameters. Further broad-band-probe transient reflectivity studies would be necessary to possibly reveal the overdamped modes.
With increasing the pump fluence we observe a saturation of the coherent mode amplitudes well below the complete destruction of the CDWs. This could be attributed to a decoupling of the electronic and lattice parts of the order parameter resulting in a complete ultrafast transient suppression and a partial recovery of the electronic part of the order parameter on a timescale much shorter than the coherent-mode periods.
VI Acknowledgments
The authors acknowledge Slovenian Ministry of education, science and sport (project ULTRA-MEM-DEVICE No. PR-05665), Slovenian Research Agency and European Research Council advanced grant TRAJECTORY for financial support. We acknowledge D. Groult and Ph. Labbé at CRISMAT (Caen, France) for providing the samples. We would like to thank also P. Gubeljak for helping with the optical measurements and V.V. Kabanov and J. Demsar for fruitful discussions.
References
- Travaglini et al. (1983) G. Travaglini, I. Mörke, and P. Wachter, Solid State Communications 45, 289 (1983).
- Sugai (1985) S. Sugai, physica status solidi (b) 129, 13 (1985).
- Lavagnini et al. (2010) M. Lavagnini, H.-M. Eiter, L. Tassini, B. Muschler, R. Hackl, R. Monnier, J.-H. Chu, I. Fisher, and L. Degiorgi, Physical Review B 81, 081101 (2010).
- Demsar et al. (1999) J. Demsar, K. Biljaković, and D. Mihailovic, Phys. Rev. Lett. 83, 800 (1999).
- Shimatake et al. (2007) K. Shimatake, Y. Toda, and S. Tanda, Phys. Rev. B 75, 115120 (2007).
- Yusupov et al. (2008) R. V. Yusupov, T. Mertelj, J. h. Chu, I. R. Fisher, and D. Mihailovic, Phys. Rev. Lett. 101, 246402 (2008).
- Schäfer et al. (2010) H. Schäfer, V. V. Kabanov, M. Beyer, K. Biljakovic, and J. Demsar, Phys. Rev. Lett. 105, 066402 (2010).
- Borovšak et al. (2016) M. Borovšak, L. Stojchevska, P. Sutar, T. Mertelj, and D. Mihailovic, Physical Review B 93, 125123 (2016).
- Foury et al. (1991) P. Foury, J. P. Pouget, E. Wang, and M. Greenblatt, Europhys. Lett. 16, 485 (1991).
- Foury and Pouget (1993) P. Foury and J. P. Pouget, International Journal of Modern Physics B 7, 3973 (1993).
- Roussel et al. (2001) P. Roussel, O. Perez, and P. Labbe, Acta Crys B 57, 603 (2001).
- Foury and Pouget (2002) P. Foury and J. P. Pouget, Solid State Sciences 4, 387 (2002).
- et al. (2004) V. V. S. et al., Russian Chemical Reviews 73, 753 (2004).
- Schlenker et al. (1996) C. Schlenker, C. Hess, C. Le Touze, and J. Dumas, Journal de Physique I 6, 2061 (1996).
- Greenblatt (1996) M. Greenblatt, “Physics and chemistry of low-dimensional inorganic conductors,” (Springer Science & Business Media, 1996) Chap. 2, p. 15.
- Wang et al. (1989) E. Wang, M. Greenblatt, I. E. Rachidi, E. Canadell, M. H. Whangbo, and S. Vadlamannti, Phys. Rev. B 39, 12969 (1989).
- Schlenker (1989) C. Schlenker, Low-Dimensional Electronic Properties of Molybdenum Bronzes and Oxides (Kluwer Academic Press, Dordrecht, 1989).
- Greenblatt (1993) M. Greenblatt, International Journal of Modern Physics B 7, 3937 (1993).
- Schlenker (1996) C. Schlenker, “Physics and chemistry of low dimensional inorganic conductors,,” (Plenum Press, New York, 1996) Chap. 8, p. 115.
- Ph. Labbé (1986) B. R. Ph. Labbé, M. Goreaud, J. Solid State Chem 62 (1986), 324.
- Zeiger et al. (1992) H. Zeiger, J. Vidal, T. Cheng, E. Ippen, G. Dresselhaus, and M. Dresselhaus, Physical Review B 45, 768 (1992).
- Schaefer et al. (2014) H. Schaefer, V. V. Kabanov, and J. Demsar, Physical Review B 89, 045106 (2014).
- Schmitt et al. (2008) F. Schmitt, P. S. Kirchmann, U. Bovensiepen, R. G. Moore, L. Rettig, M. Krenz, J.-H. Chu, N. Ru, L. Perfetti, D. H. Lu, M. Wolf, I. R. Fisher, and Z.-X. Shen, Science 321, 1649 (2008), http://science.sciencemag.org/content/321/5896/1649.full.pdf .
- Perfetti et al. (2008) L. Perfetti, P. A. Loukakos, M. Lisowski, U. Bovensiepen, M. Wolf, H. Berger, S. Biermann, and A. Georges, New Journal of Physics 10, 053019 (2008).
- Tomeljak et al. (2009) A. Tomeljak, H. Schäfer, D. Städter, M. Beyer, K. Biljakovic, and J. Demsar, Phys. Rev. Lett. 102, 066404 (2009).
- Demsar et al. (2002) J. Demsar, L. Forro, H. Berger, and D. Mihailovic, Phys. Rev. B 66, 041101 (2002).
- Note (1) Both compounds contain similar octahedral layers separated by tetrahedral units, but with different stacking.
- Note (2) The amplitude of mode O3 appears saturated below the lowest measured pump fluence. We believe that this is a fit artifact due to a strong correlation of the fit amplitude with mode O4, which has a very similar frequency, but the opposite phase.
- Yusupov et al. (2010) R. Yusupov, T. Mertelj, V. V. Kabanov, S. Brazovskii, P. Kusar, J.-H. C. Chu, I. R. Fisher, and D. Mihailovic, Nature Physics 6, 681 (2010).
- Porer et al. (2014) M. Porer, U. Leierseder, J.-M. Ménard, H. Dachraoui, L. Mouchliadis, I. Perakis, U. Heinzmann, J. Demsar, K. Rossnagel, and R. Huber, Nature materials 13, 857 (2014).