First-Principles Simulations of Warm Dense Lithium Fluoride
Abstract
We perform first-principles path integral Monte Carlo (PIMC) and density functional theory molecular dynamics (DFT-MD) calculations to explore warm dense matter states of LiF. Our simulations cover a wide density-temperature range of g cm-3 and K. Since PIMC and DFT-MD accurately treat effects of atomic shell structure, we find a pronounced compression maximum and a shoulder on the principal Hugoniot curve attributed to K-shell and L-shell ionization. The results provide a benchmark for widely-used EOS tables, such as SESAME, LEOS, and models. In addition, we compute pair-correlation functions that reveal an evolving plasma structure and ionization process that is driven by thermal and pressure ionization. Finally, we compute electronic density of states of liquid LiF from DFT-MD simulations and find that the electronic gap can remain open with increasing density and temperature to at least 15.7 g cm-3.
I INTRODUCTION
Progress in our understanding of warm dense matter (WDM) relevant to fusion energy and astrophysical phenomena relies on the development of accurate techniques to determine the equation of state (EOS) of materials across wide density-temperature regimes. The EOS provides well-defined thermodynamic states that can be measured experimentally in dynamic shock experiments and further used for hydrodynamic modeling of experiments. The state of a shock in dynamic compression experiments is often measured with impedance matching techniques via an optically transparent interferometer window. While there are several materials used for shock windows (quartz, diamond, MgO, etc), LiF is frequently used because it has several favorable optical and structural properties under compression Wise and Chhabildas (1986); Furnish et al. (1999); Huser et al. (2004).
Numerous shock experiments Kormer et al. (1965); Kormer (1968); Hauver and Melani (1970); Gupta et al. (1975); Gupta (1975); Vorthman and Duvall (1982); Tunison and Gupta (1986); Whitlock and Wark (1995); Rigg and Gupta (1998, 2001); Hicks et al. (2003); Jensen et al. (2007); LaLone et al. (2008); Turneaure et al. (2009); Ao et al. (2009); Fraizier et al. (2010); Fratanduono et al. (2011); Brown et al. (2013); Dong et al. (2014); Rigg et al. (2014); Liu et al. (2015); Zhang et al. (2015); Seagle et al. (2016) have been performed to characterize the EOS, optical, and mechanical properties of LiF in order to optimize its use as an interferometer window. The shock Hugoniot curve has been measured up to 14 Mbar Hicks et al. (2003). Experimental data has indicated that the large LiF optical gap (12 eV) decreases with compression to 800 GPa, and, upon extrapolation, closes above 4000 GPa Fratanduono et al. (2011). In contrast, recent first-principles simulations indicate that the optical gap should increase with density to at least 500 GPa Spataru et al. (2015); Sajid et al. (2013). Despite this discrepancy, there is agreement between experiment and theory that the refractive index increases linearly with density up to 800 GPa. In addition, the EOS of LiF has been measured in diamond anvil experiments Pagannone and Drickamer (1965); Yagi (1978); Kim et al. (1976); Boehler et al. (1997); Liu et al. (2007). From these investigations, it is known that LiF has a high melting temperature (3000 K at 1 Mbar) and remains in the B1 structural phase up to at least 1 Mbar, which makes LiF an excellent window material in shock wave experiments. Additionally, ultrasonic measurements Briscoe and Squire (1957); Jones (1976); Hart (1977) have been used to measure elastic moduli.
Many theoretical investigations have also aimed to understand the EOS Clérouin et al. (2005); Cherednikov et al. (2011); Smirnov (2011); Sun et al. (2011), electronic Norman et al. (2011); Sun et al. (2011) and elastic Zunger and Freeman (1977); Kunz (1982); Doll and Stoll (1997), thermodynamic Belonoshko et al. (2000); Stegailov (2010); Smirnov (2011); Jones and Ward (2016) transport Luo et al. (2016), and optical Clérouin et al. (2005, 2006); Sun et al. (2011); Sajid et al. (2013); Spataru et al. (2015) properties of LiF. Most of these simulations focus on relatively low-pressure and low-temperature regimes to help constrain the phase, melt, and optical properties that are important for shock window experiments. The highest temperature and pressure simulations at which LiF has been studied so far, using density functional theory molecular dynamics (DFT-MD) methods, were performed by Clérouin et al. Clérouin et al. (2005), which predicted the EOS and shock Hugoniot curve up to a density of 7 g cm-3 (14 Mbar) and a temperature of 47,000 K Clérouin et al. (2005).
Because of the relevance of LiF for shock physics, it is desirable to have a first-principles EOS derived for much higher temperature and density conditions that span the the condensed matter, warm dense matter, and plasma physics regimes as a reference for shock experiments and hydrodynamic simulations. In recent works, we have developed a first-principles framework to compute coherent EOSs across a wide range of density-temperature regimes relevant to WDM by combining results from state-of-the-art path integral Monte Carlo (PIMC) and DFT-MD methods for first Driver and Militzer (2012)- and second-row Militzer and Driver (2015) elements. In this paper, we apply our PIMC and DFT-MD methods to compute the EOS and plasma properties of LiF across a much larger density-temperature range than has been studied in previous first-principles studies. We also study the evolution of the plasma structure, ionization, and density of states over the WDM regime. And, finally, we compare our PIMC/DFT-MD shock Hugoniot curves with widely-used models and experiments.
The paper is organized as follows: Sec. II describes the simulation methods. Section III provides the internal energy and pressure EOS. Section IV discusses the shock Hugoniot curves. Section V characterizes the plasma structure evolution and ionization processes as a function of temperature and density via pair-correlation functions. Section VI analyzes the electronic density of states as a function of LiF density and pressure, and, finally, Sec. VII summarizes our work.
II SIMULATION METHODS
Rigorous discussions of the PIMC Ceperley (1991); D. M. Ceperley (1995); Ceperley (1996) and DFT molecular dynamics (DFT-MD) Car and Parrinello (1985); Payne et al. (1992); Marx and Hutter (2009) methods have been provided in previous works, and the details of our simulations have been presented in our previous publications Militzer and Ceperley (2001); Militzer (2009); Driver and Militzer (2012); Benedict et al. (2014); Driver and Militzer (2015); Militzer and Driver (2015); Driver et al. (2015); Driver and Militzer (2016); Hu et al. (2016); Zhang et al. (2016, 2017). Here, we summarize the methods and provide the simulation parameters specific to LiF.
The general idea of our approach is to perform simulations along isochores at high temperatures (T1106 K) using PIMC and at low temperatures (T1106 K) using DFT-MD. We show the two methods produce consistent results at overlapping temperature regimes. The PIMC method samples the space of all quantum particle paths to determine the thermal density matrix of the many-body system. PIMC increases in efficiency with temperature (scaling as 1/T) as quantum paths become shorter and more classical in nature. In contrast, DFT-MD becomes increasingly inefficient with increasing temperature, as the number of occupied bands increases unfavorably with temperature (scaling roughly as T3/2). The only uncontrolled approximation in PIMC is the use of the fixed-node approximation, which restricts paths to avoid the well-known fermion sign problem Pierleoni et al. (1994). We have shown the associated error is small for relevant systems at high enough temperatures Ceperley (1991, 1996); Driver and Militzer (2012). The main approximation in DFT-MD is the use of an approximate exchange-correlation (XC) functional, though at temperatures relevant to WDM, error in the XC is small relative to the total energy, which is the important quantity for EOS and Hugoniot simulations Karasiev et al. (2016).
PIMC uses a small number of controlled approximations, whose errors can be minimized by converging parameters, such as the time step and system size. In simulations using free-particle nodes, we typically use a time-step of 1/256 Ha-1 for temperatures below 4106 K, where the total energy per atom is converged within 1%. This results in using between 4 and 162 time slices for the temperature range studied with PIMC (0.5106 to 1.034109 K). Regarding finite size errors, we showed simulations of 8- and 24-atom cubic cells provide internal energies that agree within 1.0% and pressures that agree within 0.5% over the relevant temperature range for PIMC (T1106 K) Driver and Militzer (2015). Our results for the internal energy and pressure typically have statistical errors of 0.3% or less.
We employ standard Kohn-Sham DFT-MD simulation techniques for our low temperature (T 1106 K) calculations of warm dense LiF. Simulations are performed with the Vienna Ab initio Simulation Package (VASP) Kresse and Furthmüller (1996) using the projector augmented-wave (PAW) method Blöchl (1994); Kresse and Joubert (1999), and a NVT ensemble, regulated with a Nosé thermostat. Exchange-correlation effects are described using the Perdew-Burke-Ernzerhof Perdew et al. (1996) generalized gradient approximation. Electronic wave functions are expanded in a plane-wave basis with a energy cut-off as high as 4000 eV in order to converge total energy. Size convergence tests up to a 64-atom simulation cell at temperatures of 10,000 K and above indicate that internal energies are converged to better than 0.1% and pressures are converged to better than 0.6%. We find, at temperatures above 250,000 K, 8-atom supercell results are sufficient for both energy and pressure since the kinetic energy far outweighs the interaction energy at such high temperatures Driver and Militzer (2015). The number of bands in each calculation were selected such that orbitals with occupation as low as 10-4 were included, which requires up to 7,500 bands in a 24-atom cell at 1106 K. All simulations are performed at the -point of the Brillouin zone, which is sufficient for high temperature fluids, converging total energy to better than 0.01% compared to a grid of k-points.
III EQUATION OF STATE RESULTS
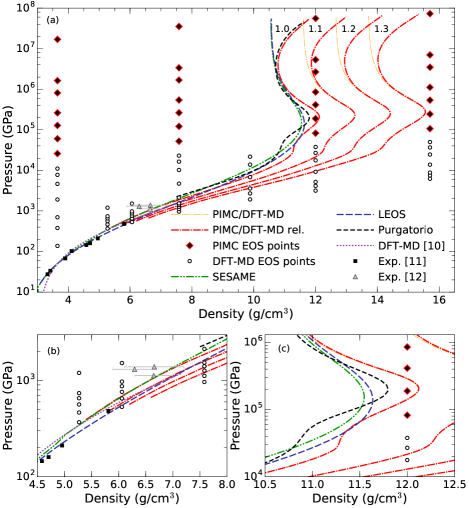
In this section, we report our combined PIMC and DFT-MD EOS results for the liquid, WDM, and plasma regimes at several densities in the range of 2.082–15.701 g cm-3 and temperatures ranging from 104–109 K. The full-range of our EOS data is shown in pressure-density space in Fig. 1 and in temperature-pressure space in Fig. 2. These two figures will be discussed more thoroughly in Section VI. The Supplemental Material Sup provides a table of our full EOS data set. In order to put the PAW-PBE pseudopotential energies on the same scale as all-electron calculations, we shifted all of our VASP DFT-MD energies by -107.061113 Ha/LiF. This shift was determined by performing isolated, all-electron atomic calculations with the OPIUM code OPI and corresponding isolated-atom calculations using the appropriate pseudopotential in VASP.
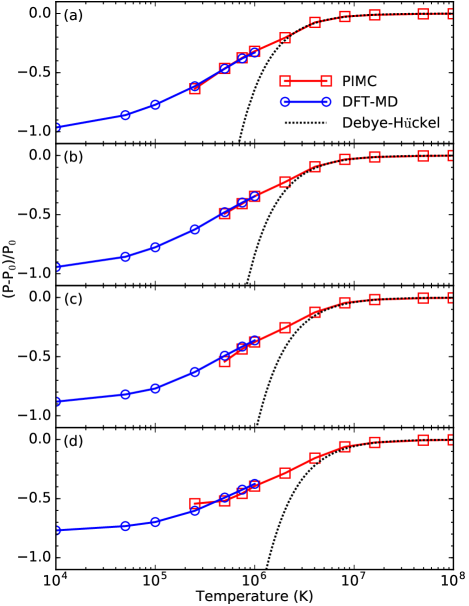
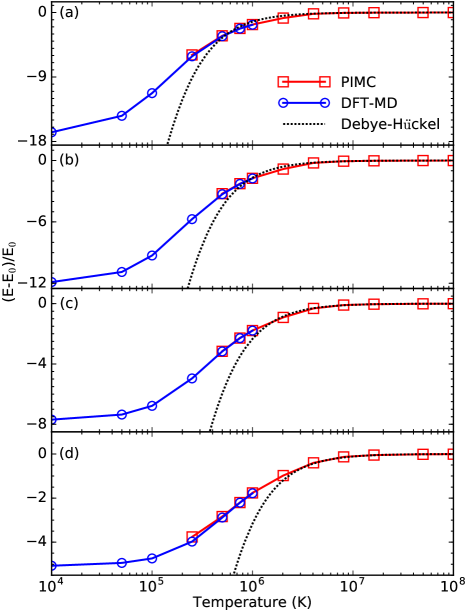
In order to analyze the behavior of our EOS data, Figs. 3 and 4 compare pressure and internal energy, respectively, along four isochores from PIMC, DFT-MD, and the classical Debye-Hückel plasma model Debye and Huckel (1923) as a function of temperature. The pressures, P, and internal energies, E, are plotted relative to a fully ionized Fermi gas of electrons and ions with pressure, P0, and internal energy, E0, in order to compare only the excess pressure and internal energy contributions that result from particle interactions. With increasing temperature, the pressure and internal contributions due to interactions gradually decrease from the strongly-interacting condensed matter regime, where bound states dominate, to the weakly-interacting, fully-ionized plasma regime, where agreement is found with the Debye-Hückel model. As one expects, the classical Debye-Hückel model becomes inadequate for lower temperatures (T5106 K) since it fails to treat bound electronic states. While the range of temperatures over which PIMC EOS data is needed to fill the temperature gap between DFT-MD and Debye-Hückel (roughly 25106 K) is relatively small compared to the entire temperature range of the high energy density physics regime, this temperature range encompasses the important process of K-shell ionization, which is precisely where the full rigor of PIMC is needed to acquire an accurate EOS table.
The two figures together provide a coherent EOS over wide density-temperature range for LiF due to the fact that PIMC and DFT-MD provide consistent, overlapping results, with a maximum difference of 3% in the pressure and 3.6% (1.7 Ha/LiF) in the internal energy at 1106 K. Furthermore, this agreement between PIMC and DFT-MD provides validation for the use of zero-temperature exchange correlation functionals in WDM applications and the use of free-particle nodes in PIMC. However, as noted by Karasiev et al. Karasiev et al. (2016), this may only be true when the total energy is large relative to the exchange-correlation energy. Finite-temperature exchange-correlation contributions were predicted to be significant for other properties, such as conductivity at low densities. At lower temperatures, PIMC results become inconsistent with DFT-MD results because the free-particle nodal approximation in PIMC simulations is no longer appropriate.
IV SHOCK COMPRESSION
Dynamic shock compression experiments allow one to directly measure the equation of state and other physical properties of hot, dense fluids. Such experiments are often used to determine the principal Hugoniot curve, which is the locus of final states that can be obtained from different shock velocities. Density functional theory has been validated by experiments as an accurate tool for predicting the shock compression of a variety of different materials Root et al. (2010); Wang et al. (2010); Mattsson et al. (2014).
During a shock wave experiment, a material whose initial state is characterized by an internal energy, pressure, and volume, (), will change to a final state denoted by while conserving mass, momentum, and energy. This leads to the Rankine-Hugoniot relation Zeldovich and Raizer (1968),
| (1) |
Here, we solve this equation for our computed first-principles EOS data set, which is reported in the Supplemental Material Sup . We obtain a continuous Hugoniot curve by interpolating the EOS data with a rectangular bivariate spline as a function of and . We have compared several different spline algorithms and find the differences are negligible given that reasonable choices are made for the isochore densities with respect to Hugoniot features. In order to obtain the principal Hugoniot curve, we used initial conditions based on the energy and pressure of ambient, solid LiF in the B1 phase computed with static DFT (P0 = 3.323 GPa, E0 = 107.417375 Ha/LiF, V16.346636 , 2.635 g cm-3). The resulting Hugoniot curve has been plotted in - space in Fig. 1, in - space in Fig. 2, and in - space in Fig. 5.
Samples in shock wave experiments may be precompressed inside of a diamond anvil cell before the shock wave is launched in order to reach much higher final densities than are possible with a sample at ambient conditions Militzer and Hubbard (2007); Jeanloz et al. (2007). This technique allows shock wave experiments to probe a density-temperature regimes consistent with planetary and stellar interiors. Therefore, we repeat our Hugoniot calculation starting with initial densities of 1.1- to 1.3-fold of the ambient density.
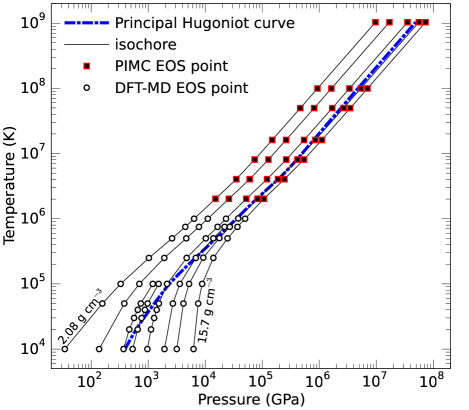
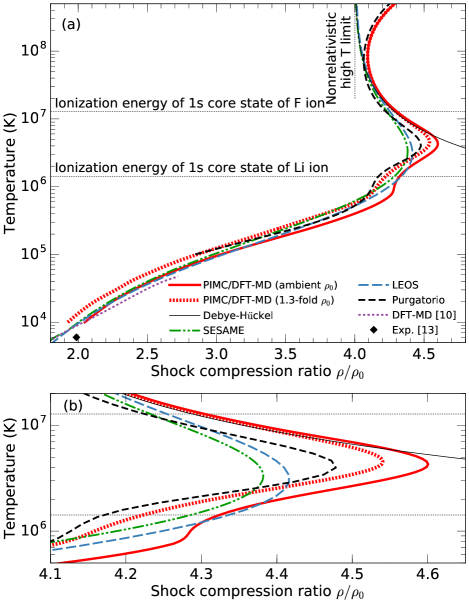
Fig. 5 shows the temperature along the Hugoniot curve as a function of the shock-compression ratio for the principal Hugoniot curve and a curve corresponding to 1.3-fold precompression. Consistent with our studies of other elements, we find that an increase in the initial density leads to a slight reduction in the shock compression ratio because particles interact more strongly at higher density. In the high-temperature limit, all curves converge to a compression ratio of 4, which is the value of a nonrelativistic, ideal gas. We also show the magnitude of the relativistic correction to the Hugoniot in the high-temperature limit. The shock compression and structure along the Hugoniot is determined by the excitation of internal degrees of freedom, such as dissociation and ionization processes, which increases the compression, and, in addition, the interaction effects, which decrease the compression Militzer (2006).
In the structure of the principal Hugoniot curve, we identify a pronounced compression maximum at high temperature and a shoulder at lower temperature, which correspond to the ionization of the K-shell and L-shell in LiF. The lower-temperature shoulder on the principal Hugoniot curve occurs near a compression ratio of = 4.28 and a temperature of 9.00105 K (77.56 eV), which corresponds to the K-shell ionization of lithium and the L-shell ionization of fluorine. The K-shell ionization energies of lithium are 75.64 eV (8.78105 K) and 122.45 eV (1.42106 K) NIS . The 2p state of lithium is already ionized by a temperature of 5.39 eV (6104 K). The L-shell ionization energies of fluorine range from 17.42–185.19 eV (0.2-2.1106 K). The higher-temperature compression maximum at = 4.54 on the principal Hugoniot curve occurs at temperature of 4.53106 K (365.29 eV), which corresponds to the K-shell ionization in fluorine. The K-shell ionization energies of fluorine are 953.89 and 1103.12 eV (11.1 and 12.8106 K). This is consistent with the ionization process we observe in Figs. 12 and 13, where charge density around the nuclei is reduced over the range of 1-8106 K. Propagating errors from our equation of state data into the Hugoniot curve shows that the statistical uncertainty in the density along the Hugoniot is at most 4% and, the statistical error in the pressure along the Hugoniot is at most 3%.
Figure 1 shows the principal and pre-compressed Hugoniot curves in space. Starting from ambient density (2.635 g cm-3), the compression maximum occurs at a density of 12.113 g cm-3 (4.596-fold compression) and a pressure of 1.988105 GPa. Starting with a precompressed density of 1.3-fold of ambient (3.426 g cm-3), the compression maximum occurs at a density of 15.537 g cm−3 (5.897-fold compression) and a pressure of 2.704105 GPa. Alternatively, higher densities can be reached with multi-shock experiments Smith et al. (2014).
In both Fig. 1 and Fig. 5, we compare our PIMC principal Hugoniot curve with several, widely-used EOS tables and models, such as SESAME (Table 7271) Lyon and Johnson (1992); SES , LEOS (Table 2240) More et al. (1988); Young and Corey (1995); Whitley and Wu (2016), Purgatorio (Lynx-2240) Wilson et al. (2006), and Debye-Hückel Debye and Huckel (1923). The SESAME and LEOS models are largely based on variations of the Thomas-Fermi model, which treats electrons in an ion-sphere as a non-uniform electron gas, neglecting quantum-mechanical shell structure of the Li and F nuclei. Therefore, we see that, while the SESAME and LEOS Hugoniot curves provide good overall agreement with PIMC in this case, they do not exhibit any compression maximum related to shell structure. On the other hand, the DFT-based, average-atom Purgatorio (Lynx) model does compute the shell structure for an average of multiple ionic states. Thus, Purgatorio predicts the correct ionization features, a shoulder and a well-defined compression maximum, along the principal Hugoniot curve in good agreement with PIMC. However, overall the Purgatorio Hugoniot curve is slightly less compressible than the PIMC prediction. Remarkably, Purgatorio achieves this level of accuracy while being 100-1000 more efficient than Kohn-Sham DFT-MD and PIMC. We note that the classical Debye-Hückel model is excellent agreement with PIMC for temperatures above 5106 K. This means that for LiF, PIMC is only needed to fill a relatively small gap in temperature (2106 K and 5106 K) between DFT-MD and Debye-Hückel EOS data, which encompasses the K-shell compression peak.
We also compare with experimental data in Fig. 1 and Fig. 5, which is available for low temperatures and pressures. At lowest temperatures in Fig. 5, the Hugoniot curves of all models lie slightly above the shock melting measurement by Kormer Kormer (1968). In Fig. 1, all models agree reasonably well with the experimental liquid shock data of Kormer et al. Kormer et al. (1965), given there may be slight differences in initial shock conditions. The lowest-pressure experimental data from Hicks et al. Hicks et al. (2003) lies about 250 GPa above previous DFT-MD Clérouin et al. (2005) and LEOS results, while SESAME and the DFT-MD calculations presented here pass through the lowest pressure data point.
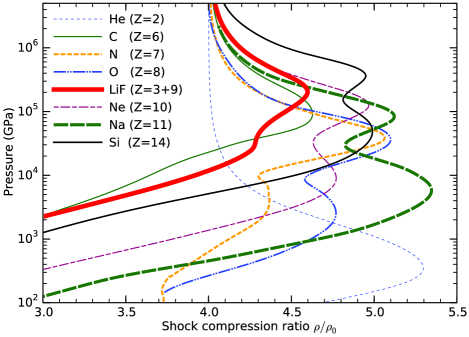
Finally, Fig. 6 compares our LiF Hugoniot curve in P- space with our previous first-principles Hugoniot curves for other first- and second-row materials Driver et al. (2016), He Militzer (2009), C Driver and Militzer (2012); Benedict et al. (2014), N Driver and Militzer (2016), O Driver et al. (2015), Ne Driver and Militzer (2015), Na Zhang et al. (2016, 2017), and Si Militzer and Driver (2015); Hu et al. (2016). For each Hugoniot curve, DFT-MD data is plotted for T1106 K, and PIMC results are plotted for higher temperatures. Each Hugoniot curve exhibits at least one distinct shock-compression maximum corresponding to K or L shell ionization. The maximum compression ratio reached in each case is largely determined be the initial density of the system due to interaction effects. Helium has the lowest initial density and highest maximum compression ratio, while LiF has the highest initial density and lowest maximum compression ratio. The pressure (and temperature) at the compression maximum scales with roughly with the binding energy, Z2, which means a higher pressure (or temperature) is needed to reach the regime of ionization. Therefore, as a general trend, as Z increases, the compression peak temperatures increase. In the high-temperature limit, all curves converge to a compression ratio of 4, which is the value of a nonrelativistic, ideal gas.
V PAIR-CORRELATION FUNCTIONS
In this section, we provide a discussion of the temperature and density dependence of pair-correlation, g(r), functions and ionization processes in warm dense LiF. The radial pair correlation function is defined as
| (2) |
where N is the total number of particles, V is the cell volume, and r is the distance from the ith reference particle.
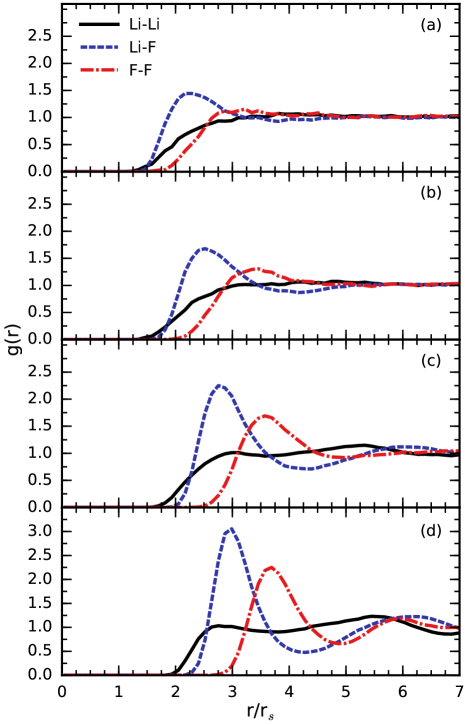
Fig. 7 shows Li-Li, Li-F, and F-F pair-correlation curves at a fixed, low temperature of 2104 K computed with DFT-MD simulations in 64-atom cells at four densities. We plot the g(r) functions as a function of r/rs, where rs= and ne is the electron number density of LiF, in order to clearly differentiate between correlation- and density-driven changes. The results we find are in a good agreement with trends found by Clérouin et al. Clérouin et al. (2005), but investigated for a larger density range. As in most fluids, LiF becomes more structured with increasing density. We also note that higher temperatures always result in less structured fluid at each density. Compared to the other g(r) functions, there is less structure in Li-Li curves, which implies those nuclei interact weakly. By examining the mean square displacements as a function of time, we also find the lithium atoms diffuse much faster due to their lighter mass. The fluorine atoms exhibit increasing strong correlations with density, preserving an ionic fluid structure, as seen in the F-F g(r) peak. Furthermore, the lithium atoms remain strongly correlated with ionic fluorine structure due to Coulomb interactions, as seen in the Li-F g(r) peak.
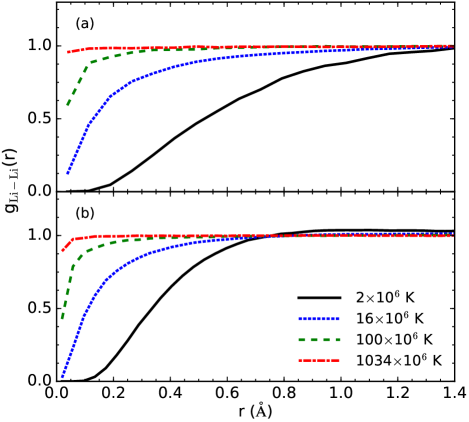
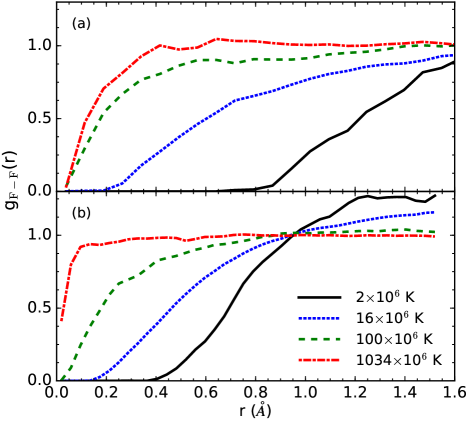
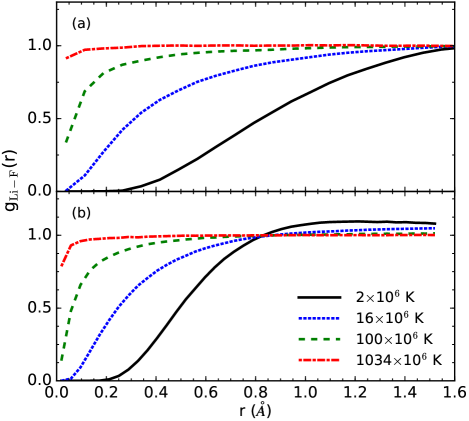
Figures 8, 9, and 10 show ion-ion curves for Li-Li, F-F, and Li-F pairs in LiF plasmas, respectively. The g(r) functions were computed with PIMC at temperatures relevant to WDM for four densities. We first note that g(r) curves corresponding to heavier ions are systematically found further apart than lighter ions due to stronger Coulomb repulsion and Pauli exclusion from bound electrons. In each case, the atoms are kept farthest apart at low temperatures. As temperature increases, kinetic energy of the nuclei increases, leading to stronger collisions and making it more likely to find them at close range. At the same time, the atoms become increasingly ionized, which gradually reduces the Pauli repulsion, while increasing the ionic Coulomb repulsion. At the highest temperatures, the system approaches the Debye-Hückel limit, behaving like a weakly correlated system of screened Coulomb charges. As density increases, the likelihood of finding two nuclei at close range rises only slightly.
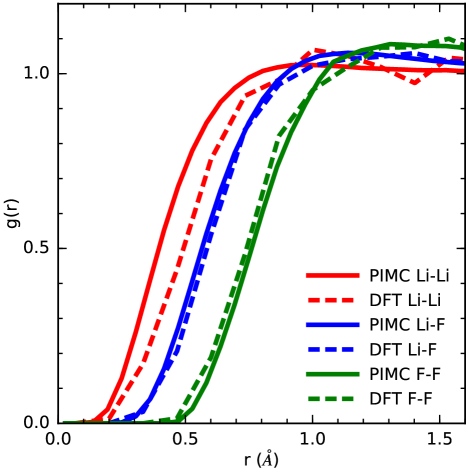
In order to show that PIMC and DFT-MD predict similar plasma structures, Fig. 11 compares Li-Li, Li-F, and F-F g(r) curves using both methods at 1106 K at our highest isochore density of 15.701 g cm-3 in 24-atom simulation cells. The fact that the PIMC and DFT-MD g(r) curves nearly overlap indicates that both methods predict a consistent ionic plasma structure in addition to a consistent EOS. There are some small differences in the Li-Li g(r) DFT-MD and PIMC curves likely due to frozen-core pseudopotentials and exchange correlation effects.
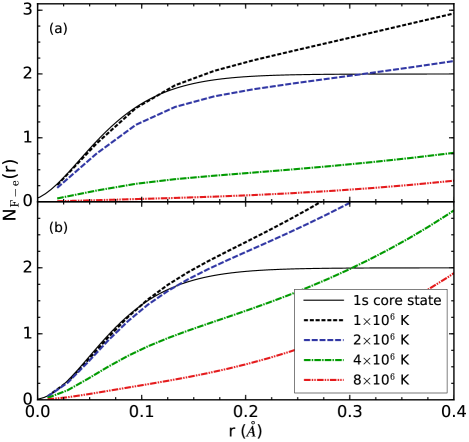
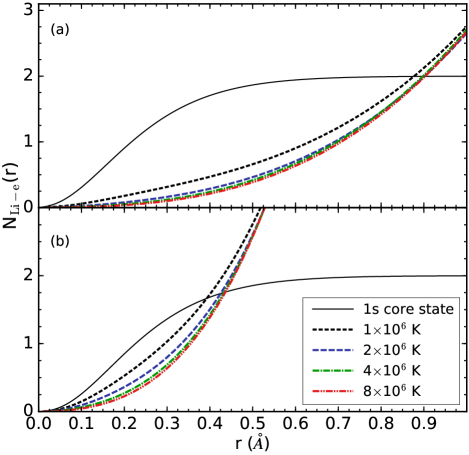
Figs. 12 and 13 show the integral of the nucleus-electron pair correlation function, , for Li-e and F-e in LiF plasma, respectively, as a function of temperature and density. N(r) represents the average number of electrons within a sphere of radius around a given nucleus. N(r) is given by the formula
| (3) |
where the sum includes all electron-ion pairs and represents the Heaviside function.
In each figure, we compare our PIMC N(r) curves with the 1s ground-state of a corresponding isolated Li or F atom to gauge the extent of ionization. It is clear from Fig. 12 that the lithium ion is almost fully ionized for all temperatures and densities considered. While there are some partially bound states remaining in the lithium ions at a temperature of 1106 K, by 8106 K the Li atoms have been fully ionized. In contrast, from Fig. 13 it is clear that the higher-Z, fluorine ion still has bound 1s electrons at 1106 K due to a higher binding energy. As temperature increases, the K-shell of the fluorine ions gradually becomes more ionized, causing N(r) to decrease. As density increases, it is apparent that higher temperatures are required to fully ionize the fluorine ion. Thus, we observe that the 1s ionization fraction decreases with density, which indicates that pressure ionization of the fluorine K-shell is absent, as we have observed for other first- and second-row elements in our previous work Driver et al. (2015, 2016).
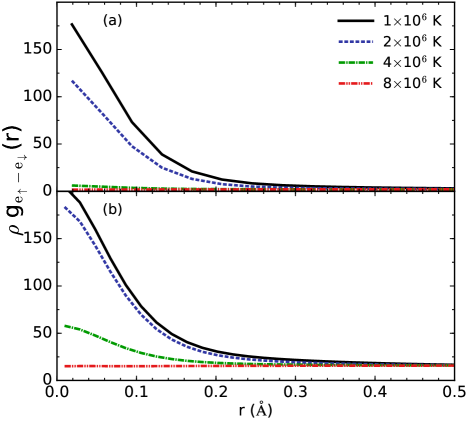
Fig. 14 shows electron-electron pair correlations in LiF plasma for electrons having opposite spins. The functions are multiplied by the mass number density , so that the integral under the curves is proportional to the number of electrons. The electrons are most highly correlated at low temperatures, which reflects that multiple electrons occupy bound states around a given nucleus. As temperature increases, electrons are thermally excited, decreasing the correlation among each other. The positive correlation at short distances increases with density, consistent with a lower ionization fraction seen in our N(r) plots.
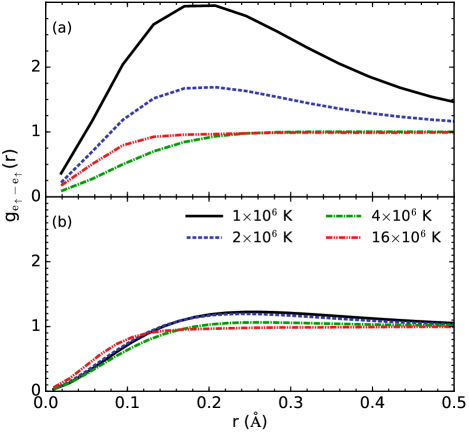
Fig. 15 shows electron-electron pair correlations in LiF plasma for electrons with parallel spins. The positive correlation at intermediate distances (r 0.2 ) reflects that different electrons with parallel spins are bound to a given nucleus. For short separations, electrons strongly repel due to Pauli exclusion and the functions decay to zero. As density increases, the peak at intermediate distances decreases and clearly shows the effect of pressure ionization of the L shell. Pressure ionization is expected for L-shell orbitals because they are much larger than the K-shell orbitals and are therefore subject to Pauli exchange with nearby nuclei. As temperature increases, electrons become less bound, which also causes the correlation to become more like an ideal fluid.
VI ELECTRONIC DENSITY OF STATES
In this section, we report DFT-MD results for the electronic density of states (DOS) as a function of temperature and density in the liquid and plasma states of LiF. This analysis provides further insight into the temperature-density evolution of ionization effects and the band gap. All DOS curves were computed with 64-atom simulation cells. At this cell size and temperature range (1104–5105 K), we found a single k-point provides sufficiently converged DOS results. Smooth curves were obtained by averaging over a MD simulation and applying a Gaussian smearing of 0.5 eV to the band energies. Furthermore, the eigenvalues of each snapshot were shifted so that the Fermi energies, EF, align at zero, and the integral of the occupied DOS is normalized to 1.
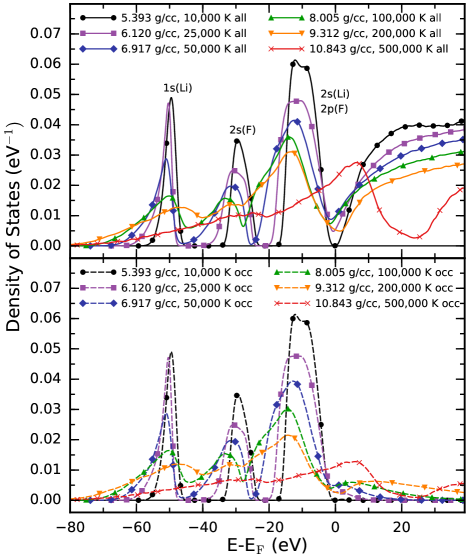
Fig. 16 shows the total and occupied DOS at six points along the liquid and plasma shock Hugoniot curve as predicted by DFT-MD (see Section VI). At low temperatures and densities, the general structure is composed of three peaks below the Fermi energy, representing the atomic 1s, 2s and 2p states. The 1s peak is due to lithium, which is treated with an all-electron pseudopotential, while the fluorine pseudopotential has a frozen 1s core. Depending on the temperature-density conditions, the DOS exhibits a gap or pseudogap followed by a continuous spectrum of conducting states. The lowest density-temperature condition exhibits a gap, which is consistent with the work of Clérouin et al. Clérouin et al. (2005), who showed a gap in the liquid persists along the Hugoniot curve to the melting point over density range of 4.5–6.5 g cm-3. The DOS at higher temperature-density conditions exhibits a pseudogap, whose depth generally decreases for increasing temperature-density conditions along the Hugoniot. The DOS peaks broaden and merge at higher temperatures and densities as LiF becomes further ionized. For the highest temperature and density, the total DOS begins to resemble that of an ideal fluid.
Regarding the occupied DOS, the fraction of occupied states lying above the Fermi energy drastically increases as temperature-density conditions increase along the Hugoniot curve. Consistent with our pair-correlation analyses, we attribute the increase in occupation above the Fermi energy to a combination of thermal and pressure ionization. For lithium ions, both L-shell and K-shell states undergo a significant thermal ionization, while for fluorine ions, only the L-shell states are subject to thermal ionization in the temperature range considered for the DOS. The L-shell states in both lithium and fluorine are partially pressure ionized at the highest densities considered here, but 1s states remain bound for the conditions considered in the DOS plot.
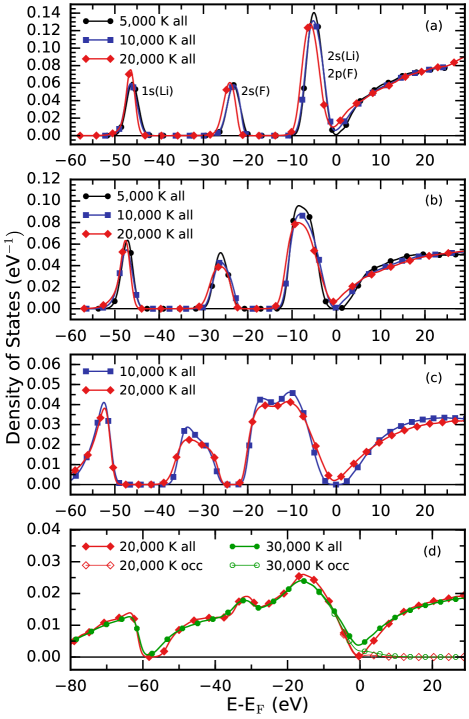
Fig. 17 shows a set of DOS curves for a fixed temperatures as a function of density for off-Hugoniot states lying in the low-temperature liquid regime. While all curves shown are found to be liquid in the DFT-MD simulations, we note that any lower temperatures than those shown resulted in a frozen structure using 64-atom simulation cells. In this temperature-density regime, we find that the band gap forms at increasingly higher temperatures with increasing density. Based on our ionic pair correlation analysis in Fig. 7, we find the reason for this trend in the band gap is due to ordering maintained within the fluid due ionic Coulomb interactions. While higher temperatures tend to disorder the fluid, closing the gap, higher densities stabilize an ionic structure that promotes a gap. We also note that, for the low temperatures and high densities, it is clear that the K-shell states are not pressure ionized even at the highest density studied here (15.7 g cm-3) and the majority of occupied states still lie below the Fermi energy.
VII CONCLUSIONS
In this paper, we have extended the first-principles EOS of LiF to a much wider temperature-density range than it has ever been studied previously. For the first time, we are able to predict the compression maximum on the principal Hugoniot from first principles. We used PIMC and DFT-MD to construct a coherent EOS that bridges the liquid, WDM, and plasma regimes. We showed that both PIMC and DFT-MD produce consistent EOS data in the range of 5105–1106 K, validating the use of free-particle nodes in PIMC and zero-temperature XC functionals in DFT-MD for warm dense LiF. We then studied pair-correlations of electron and nuclei in LiF liquid and plasmas, revealing an evolving plasma structure and ionization process that is driven by thermal and pressure ionization effects. In addition, we computed the density of states to show how LiF can maintain an open band gap to densities as high as 15 g cm-3 due to strong ionic correlations. Finally, we examined the shock compression behavior of LiF and computed a first-principles benchmark of the principal Hugoniot for several pre-compression conditions. We compare our PIMC Hugoniot results with widely used Thomas-Fermi-based models (SESAME and LEOS), which do not include shell effects, and a DFT-based average-atom Purgatorio model, which agrees well with PIMC, but is slightly stiffer. Overall, we demonstrate that PIMC is an important tool to benchmark the EOS in the WDM regime. Kohn-Sham based DFT simulations are too inefficient to access physics at temperatures corresponding to the core ionization, and more efficient, but approximate models do not necessarily capture all of the complex physics of the WDM regime.
Acknowledgements.
This research is supported by the U. S. Department of Energy, grants DE-SC0010517 and DE-SC0016248. This research used resources of the National Energy Research Scientific Computing Center, a DOE Office of Science User Facility supported by the Office of Science of the U.S. Department of Energy under Contract No. DE-AC02-05CH11231. This research also used the Janus supercomputer, which is supported by the National Science Foundation (Grant No. CNS-0821794) at the University of Colorado and the National Center for Atmospheric Research. This research is also part of the Blue Waters sustained-petascale computing project (NSF ACI 1640776), which is supported by the National Science Foundation (awards OCI-0725070 and ACI-1238993) and the state of Illinois. Blue Waters is a joint effort of the University of Illinois at Urbana-Champaign and its National Center for Supercomputing Applications. We would like to thank Heather Whitley and Christine Wu for help obtaining the LEOS and Purgatorio[Lynx] EOS models. We would like to thank Scott Crockett and Sven Rudin for obtaining the SESAME EOS.References
- Wise and Chhabildas (1986) J. Wise and L. Chhabildas, in Shock waves in condensed matter (Springer, 1986), pp. 441–454.
- Furnish et al. (1999) M. Furnish, L. Chhabildas, and W. Reinhart, International journal of impact engineering 23, 261 (1999).
- Huser et al. (2004) G. Huser, M. Koenig, A. Benuzzi-Mounaix, E. Henry, T. Vinci, B. Faral, M. Tomasini, B. Telaro, and D. Batani, Physics of Plasmas (1994-present) 11, L61 (2004).
- Lyon and Johnson (1992) S. P. Lyon and J. D. Johnson (1992), Los Alamos Report No. LA-UR-92-3407.
- (5) http://www.lanl.gov/org/padste/adtsc/theoretical/physics-chemistry-materials/sesame-database.php.
- More et al. (1988) R. More, K. Warren, D. Young, and G. Zimmerman, Physics of Fluids (1958-1988) 31, 3059 (1988).
- Young and Corey (1995) D. A. Young and E. M. Corey, Journal of applied physics 78, 3748 (1995).
- Whitley and Wu (2016) H. D. Whitley and C. J. Wu (2016), Lawrence Livermore National Laboratory Report No. LLNL-TR-705163.
- Wilson et al. (2006) B. Wilson, V. Sonnad, P. Sterne, and W. Isaacs, Journal of Quantitative Spectroscopy and Radiative Transfer 99, 658 (2006).
- Clérouin et al. (2005) J. Clérouin, Y. Laudernet, V. Recoules, and S. Mazevet, Physical Review B 72, 155122 (2005).
- Kormer et al. (1965) S. Kormer, M. Sinitsyn, A. Funtikov, V. Urlin, and A. Blinov, Soviet Physics JETP 20 (1965).
- Hicks et al. (2003) D. Hicks, P. Celliers, G. Collins, J. Eggert, and S. Moon, Physical review letters 91, 035502 (2003).
- Kormer (1968) S. Kormer, Sov. Phys. Uspekhi 11, 229 (1968).
- Hauver and Melani (1970) G. E. Hauver and A. Melani, Tech. Rep., DTIC Document (1970).
- Gupta et al. (1975) Y. Gupta, G. Duvall, and G. Fowles, Journal of Applied Physics 46, 532 (1975).
- Gupta (1975) Y. Gupta, Applied Physics Letters 26, 38 (1975).
- Vorthman and Duvall (1982) J. E. Vorthman and G. E. Duvall, Journal of Applied Physics 53, 3607 (1982).
- Tunison and Gupta (1986) K. Tunison and Y. Gupta, Applied Physics Letters 48, 1351 (1986).
- Whitlock and Wark (1995) R. R. Whitlock and J. S. Wark, Physical Review B 52, 8 (1995).
- Rigg and Gupta (1998) P. Rigg and Y. Gupta, Applied Physics Letters 73, 1655 (1998).
- Rigg and Gupta (2001) P. Rigg and Y. Gupta, Physical Review B 63, 094112 (2001).
- Jensen et al. (2007) B. Jensen, D. Holtkamp, P. Rigg, and D. Dolan, Journal of applied physics 101, 013523 (2007).
- LaLone et al. (2008) B. LaLone, O. Fat’yanov, J. Asay, and Y. Gupta, Journal of applied physics 103, 093505 (2008).
- Turneaure et al. (2009) S. J. Turneaure, Y. Gupta, K. Zimmerman, K. Perkins, C. Yoo, and G. Shen, Journal of Applied Physics 105, 053520 (2009).
- Ao et al. (2009) T. Ao, M. Knudson, J. Asay, and J.-P. Davis, Journal of Applied Physics 106, 103507 (2009).
- Fraizier et al. (2010) E. Fraizier, P. Antoine, J.-L. Godefroit, G. Lanier, G. Roy, and C. Voltz, in EPJ Web of Conferences (EDP Sciences, 2010), vol. 10, p. 00015.
- Fratanduono et al. (2011) D. Fratanduono, T. Boehly, M. Barrios, D. Meyerhofer, J. Eggert, R. Smith, D. Hicks, P. Celliers, D. Braun, and G. Collins, Journal of Applied Physics 109, 123521 (2011).
- Brown et al. (2013) J. Brown, C. Alexander, J. Asay, T. Vogler, and J. Ding, Journal of Applied Physics 114, 223518 (2013).
- Dong et al. (2014) H. Dong, S. M. Dorfman, C. M. Holl, Y. Meng, V. B. Prakapenka, D. He, and T. S. Duffy, High Pressure Research 34, 39 (2014).
- Rigg et al. (2014) P. Rigg, M. Knudson, R. Scharff, and R. Hixson, Journal of Applied Physics 116, 033515 (2014).
- Liu et al. (2015) Q. Liu, X. Zhou, X. Zeng, and S. Luo, Journal of Applied Physics 117, 045901 (2015).
- Zhang et al. (2015) Z.-Y. Zhang, Y. Zhao, Q.-X.Xue, F. Wang, and J.-M.Yang, Acta Physica Sinica 64, 205202 (pages 0) (2015).
- Seagle et al. (2016) C. T. Seagle, J.-P. Davis, and M. D. Knudson, Journal of Applied Physics 120, 165902 (2016).
- Spataru et al. (2015) C. D. Spataru, L. Shulenburger, and L. X. Benedict, Physical Review B 92, 245117 (2015).
- Sajid et al. (2013) A. Sajid, G. Murtaza, and A. Reshak, Modern Physics Letters B 27, 1350061 (2013).
- Pagannone and Drickamer (1965) M. Pagannone and H. Drickamer, The Journal of Chemical Physics 43, 2266 (1965).
- Yagi (1978) T. Yagi, Journal of Physics and Chemistry of Solids 39, 563 (1978).
- Kim et al. (1976) K. Kim, L. Chhabildas, and A. Ruoff, Journal of Applied Physics 47, 2862 (1976).
- Boehler et al. (1997) R. Boehler, M. Ross, and D. B. Boercker, Physical Review Letters 78, 4589 (1997).
- Liu et al. (2007) J. Liu, L. Dubrovinsky, T. Boffa Ballaran, and W. Crichton, High Pressure Research 27, 483 (2007).
- Briscoe and Squire (1957) C. Briscoe and C. Squire, Physical Review 106, 1175 (1957).
- Jones (1976) L. E. Jones, Physics of the Earth and Planetary Interiors 13, 105 (1976).
- Hart (1977) S. Hart, Journal of Physics D: Applied Physics 10, L261 (1977).
- Cherednikov et al. (2011) Y. Cherednikov, N. A. Inogamov, and H. M. Urbassek, JOSA B 28, 1817 (2011).
- Smirnov (2011) N. Smirnov, Physical Review B 83, 014109 (2011).
- Sun et al. (2011) Z.-H. Sun, J. Dong, and Y.-W. Xia, Physica B: Condensed Matter 406, 3660 (2011).
- Norman et al. (2011) G. Norman, I. Y. Skobelev, and V. Stegailov, Contributions to Plasma Physics 51, 411 (2011).
- Zunger and Freeman (1977) A. Zunger and A. J. Freeman, Physical Review B 16, 2901 (1977).
- Kunz (1982) A. B. Kunz, Physical Review B 26, 2056 (1982).
- Doll and Stoll (1997) K. Doll and H. Stoll, Physical Review B 56, 10121 (1997).
- Belonoshko et al. (2000) A. B. Belonoshko, R. Ahuja, and B. Johansson, Physical Review B 61, 11928 (2000).
- Stegailov (2010) V. V. Stegailov, Contributions to Plasma Physics 50, 31 (2010).
- Jones and Ward (2016) R. Jones and D. Ward, arXiv preprint arXiv:1604.02084 (2016).
- Luo et al. (2016) H. Luo, S. Xiao, S. Wang, P. Huai, H. Deng, and W. Hu, Computational Materials Science 111, 203 (2016).
- Clérouin et al. (2006) J. Clérouin, Y. Laudernet, V. Recoules, and S. Mazevet, Journal of Physics A: Mathematical and General 39, 4387 (2006).
- Driver and Militzer (2012) K. P. Driver and B. Militzer, Phys. Rev. Lett. 108, 115502 (2012).
- Militzer and Driver (2015) B. Militzer and K. P. Driver, Phys. Rev. Lett 115, 176403 (2015).
- Ceperley (1991) D. Ceperley, Journal of statistical physics 63, 1237 (1991).
- D. M. Ceperley (1995) D. M. Ceperley, Rev. Mod. Phys. 67, 279 (1995).
- Ceperley (1996) D. M. Ceperley, in Monte Carlo and Molecular Dynamics of Condensed Matter Systems, edited by K. Binder and G. Ciccotti (Editrice Compositori, Bologna, Italy, 1996), vol. 49, p. 443.
- Car and Parrinello (1985) R. Car and M. Parrinello, Physical review letters 55, 2471 (1985).
- Payne et al. (1992) M. C. Payne, M. P. Teter, D. C. Allan, T. Arias, and J. Joannopoulos, Reviews of Modern Physics 64, 1045 (1992).
- Marx and Hutter (2009) D. Marx and J. Hutter, Ab initio molecular dynamics: basic theory and advanced methods (Cambridge University Press, 2009).
- Militzer and Ceperley (2001) B. Militzer and D. M. Ceperley, Phys. Rev. E 63, 066404 (2001).
- Militzer (2009) B. Militzer, Phys. Rev. B 79, 155105 (2009).
- Benedict et al. (2014) L. X. Benedict, K. P. Driver, S. Hamel, B. Militzer, T. Qi, A. A. Correa, A. Saul, and E. Schwegler, Physical Review B 89, 224109 (2014).
- Driver and Militzer (2015) K. P. Driver and B. Militzer, Phys. Rev. B 91, 045103 (2015).
- Driver et al. (2015) K. Driver, F. Soubiran, S. Zhang, and B. Militzer, The Journal of chemical physics 143, 164507 (2015).
- Driver and Militzer (2016) K. P. Driver and B. Militzer, Phys. Rev. B 91, 064101 (2016).
- Hu et al. (2016) S. Hu, B. Militzer, L. Collins, K. Driver, J. Kress, et al., Physical Review B 94, 094109 (2016).
- Zhang et al. (2016) S. Zhang, K. P. Driver, F. Soubiran, and B. Militzer, High Energy Density Physics 21, 16 (2016).
- Zhang et al. (2017) S. Zhang, K. P. Driver, F. Soubiran, and B. Militzer, The Journal of Chemical Physics 146, 074505 (2017).
- Pierleoni et al. (1994) C. Pierleoni, D. Ceperley, B. Bernu, and W. Magro, Physical review letters 73, 2145 (1994).
- Karasiev et al. (2016) V. V. Karasiev, L. Calderín, and S. B. Trickey, Phys. Rev. E 93, 063207 (2016).
- Debye and Huckel (1923) P. Debye and E. Huckel, Phys. Z. 24, 185 (1923).
- Kresse and Furthmüller (1996) G. Kresse and J. Furthmüller, Phys. Rev. B 54, 11169 (1996).
- Blöchl (1994) P. E. Blöchl, Phys. Rev. B 50, 17953 (1994).
- Kresse and Joubert (1999) G. Kresse and D. Joubert, Physical Review B 59, 1758 (1999).
- Perdew et al. (1996) J. P. Perdew, K. Burke, and M. Ernzerhof, Phys. Rev. Lett. 77, 3865 (1996).
- (80) See Supplemental Material at [insert URL] for the EOS table.
- (81) http://opium.sourceforge.net.
- Root et al. (2010) S. Root, R. J. Magyar, J. H. Carpenter, D. L. Hanson, and T. R. Mattsson, Phys. Rev. Lett. 105, 085501 (2010).
- Wang et al. (2010) X. Wang, F. Tian, L. Wang, T. Cui, B. Liu, and G. Zou, J. Chem. Phys. 132, 024502 (2010).
- Mattsson et al. (2014) T. R. Mattsson, S. Root, A. E. Mattsson, L. Shulenburger, R. J. Magyar, and D. G. Flicker, Phys. Rev. B 90, 184105 (2014).
- Zeldovich and Raizer (1968) Y. B. Zeldovich and Y. P. Raizer, Elements of Gasdynamics and the Classical Theory of Shock Waves (Academic Press, New York, 1968).
- Militzer and Hubbard (2007) B. Militzer and W. B. Hubbard, in Shock Cimpression of Condensed Matter-2007: Proceedings of the Conference of the American Physical Society Topical Group on Shock Compression of Condensed Matter (AIP Publishing, 2007), vol. 955, pp. 1395–1398.
- Jeanloz et al. (2007) R. Jeanloz, P. M. Celliers, G. W. Collins, J. H. Eggert, K. K. Lee, R. S. McWilliams, S. Brygoo, and P. Loubeyre, Proceedings of the National Academy of Sciences 104, 9172 (2007).
- Militzer (2006) B. Militzer, Phys. Rev. Lett. 97, 175501 (2006).
- (89) https://www.nist.gov/pml/atomic-spectra-database.
- Smith et al. (2014) R. Smith, J. Eggert, R. Jeanloz, T. Duffy, D. Braun, J. Patterson, R. Rudd, J. Biener, A. Lazicki, A. Hamza, et al., Nature 511, 330 (2014).
- Driver et al. (2016) K. P. Driver, F. Soubiran, S. Zhang, and B. Militzer, High Energy Density Physics (2016), submitted to conference proceedings.