Hydrogen-poor Superluminous Supernovae With Late-time H Emission: Three Events From the Intermediate Palomar Transient Factory
Abstract
We present observations of two new hydrogen-poor superluminous supernovae (SLSN-I), iPTF15esb and iPTF16bad, showing late-time H emission with line luminosities of erg s-1 and velocity widths of (4000-6000) km s-1. Including the previously published iPTF13ehe, this makes up a total of three such events to date. iPTF13ehe is one of the most luminous and the slowest evolving SLSNe-I, whereas the other two are less luminous and fast decliners. We interpret this as a result of the ejecta running into a neutral H-shell located at a radius of cm. This implies that violent mass loss must have occurred several decades before the supernova explosion. Such a short time interval suggests that eruptive mass loss could be common shortly before core collapse, and more importantly helium is unlikely to be completely stripped off the progenitor and could be present in the ejecta. It is a mystery why helium features are not detected, even though non-thermal energy sources, capable of ionizing He, may exist as suggested by the O II absorption series in the early-time spectra. Our late-time spectra ( d) appear to have intrinsically lower [O I] 6300 Å luminosities than that of SN2015bn and SN2007bi, possibly an indication of less oxygen (). The blue-shifted H emission relative to the hosts for all three events may be in tension with the binary model proposed for iPTF13ehe. Finally, iPTF15esb has a peculiar light curve (LC) with three peaks separated from one another by days. The LC undulation is stronger in bluer bands. One possible explanation is ejecta-circumstellar medium (CSM) interaction.
Subject headings:
Stars: massive stars, supernovae1. Introduction
Superluminous supernovae (SLSNe; Gal-Yam, 2012) are rare stellar explosions, radiating times more energy than normal supernovae. Their extreme peak luminosities and slowly evolving light curves (LC) cannot be explained by standard models based on radioactive decay of 56Ni. Although the detailed physics of SLSNe is not understood, a general consensus from published studies is that their progenitors are massive stars, (Quimby et al., 2011; Gal-Yam et al., 2009; Smith et al., 2007; Ofek et al., 2007; Nicholl et al., 2014; Yan et al., 2015). Observations of SLSNe have highlighted our poor understanding of the late stages of massive star evolution, especially mass loss processes. According to standard stellar evolutionary models, massive stars () are thought to have very little hydrogen at the time of supernova explosion (Georgy et al., 2012; Smith, 2014; Langer, 2012). However, detections of two types of SLSNe – one with and one without H and He (SLSN-II and SLSN-I respectively, Gal-Yam et al. 2012) – illustrate a much more complex picture of massive star evolution, and indicate that their massive progenitors must have two distinctly different mass loss histories. Progenitors of SLSN-I lose their H-envelope long before core explosion. In contrast, for a progenitor of a SLSN-II, the stripping of its H-envelope must be incomplete, and the bulk of the H-rich medium is still either loosely bound to or very close to the progenitor at the time of the supernova explosion.
The observational appearance of a SLSN is largely affected by its progenitor mass loss history. Broadly speaking, at the time of explosion, the progenitor star of a SLSN-II still retains a substantial H-envelope, and its early-time spectra show the characteristic H emission with both narrow and broad components, indicating ejecta interaction with extended, dense H-rich circumstellar medium (CSM), like a SN IIn. In contrast, the progenitor star of a SLSN-I must have lost most of its H and helium material long before the supernova explosion, and its early-time spectra detect no H and helium features. However, there must be some SLSNe falling between these two simple categories. For example, a progenitor star could retain a small amount of H material and has no substantial CSM. When such a star explodes, its early-time spectrum would have H emission, but not like SN IIn with both narrow and broad components indicating ejecta-CSM interaction. This type of transient may have been detected already, for example, SN 2008es, SN 2013hx, PS15br and possibly CSS121015 (Miller et al., 2009; Gezari et al., 2009; Benetti et al., 2014; Inserra et al., 2016a), which show only broad H emission in the photospheric phase. Another example would be a SLSN-I progenitor which has lost all of the H-envelopes, but only shortly before the supernova explosion. In such a case, the H-rich material would not have enough time to be completely dispersed into the interstellar medium (ISM) and would be located close enough so that when the supernova explodes, the SN ejecta would be able to catch up with this H-shell, and the subsequent interaction would produce broad H emission in late-time spectra. Our observation of SLSN-I iPTF13ehe suggests that indeed such events exist (Yan et al., 2015).
Systematic follow-up observations have led to discoveries of new features from SLSNe-I, including double peak LCs at early times (Nicholl et al., 2015; Vreeswijk et al., 2017; Smith et al., 2016), and broad H and [O III] 4363 & 5007Å emission in late-time spectra of SLSNe-I (Yan et al., 2015; Lunnan et al., 2016). Well sampled light curves of SN 2015bn and iPTF13dcc have also resulted in discoveries of LC undulations of SLSNe-I, suggesting possible ejecta interaction with H-poor CSM (Nicholl et al., 2016; Vreeswijk et al., 2017).
In this paper, we report two new SLSNe-I events, iPTF15esb and iPTF16bad, showing late-time H emission, similar to iPTF13ehe. In addition, the LC of iPTF15esb shows strong light curve undulations. This paper reports the new observations and presents a coherent analysis of all three events. We also discuss the implication for various physical models and the whole SLSN-I population. Throughout the paper, we adopt a CDM cosmological model with = 0.286, = 0.714, and = 69.6 (Planck Collaboration et al., 2016).
2. Targets and Observations
We discuss a sample with three SLSNe-I discovered by the Intermediate Palomar Transient Factory (iPTF), including two new events (iPTF15esb and iPTF16bad) and one already published event (iPTF13ehe; Yan et al., 2015). The basic properties and the coordinates are summarized in Table Hydrogen-poor Superluminous Supernovae With Late-time H Emission: Three Events From the Intermediate Palomar Transient Factory. These three events are at a similar distance, ), the median redshift of PTF SLSNe, due to the survey sensitivity limit.
All three events have the identical Galactic extinction of E(0.04 magnitude (Schlafly & Finkbeiner 2011). All fluxes are corrected assuming the extinction law of Cardelli et al. (1989) with . The host galaxies have either pre-explosion photometry from SDSS or measurements after the supernova has faded in the case of iPTF13ehe. The host of iPTF15esb was detected by SDSS and has AB magnitudes of 23.65, 22.61, 21.90, 21.50 and 21.44 mag in respectively. The host of iPTF16bad was not detected by SDSS in any band, and is fainter than 50% completeness limits of 22.4, 22.6, 22.6, 21.7, 20.9 in respectively (Abazajian et al., 2003). The absolute magnitudes are and mag for iPTF16bad and iPTF15esb respectively. Compared with for a L∗ galaxy at (Blanton et al., 2003), these two host galaxies are low luminosity dwarfs, typical of SLSN-I host galaxies as found by Lunnan et al. (2014), Leloudas et al. (2015), and Perley et al. (2016).
Photometric observations of iPTF15esb and iPTF16bad were obtained with the Palomar 48 & 60 inch (P48 & P60), the 4.3 meter Discovery Channel Telescope (DCT) and the Las Cumbres Observatory Global Telescope Network (LCOGT). All reported photometry in Table Hydrogen-poor Superluminous Supernovae With Late-time H Emission: Three Events From the Intermediate Palomar Transient Factory and Hydrogen-poor Superluminous Supernovae With Late-time H Emission: Three Events From the Intermediate Palomar Transient Factory is in AB magnitudes and calibrated to the SDSS filters. The P60 and LCOGT photometry is measured using a custom image subtraction software (Fremling et al., 2016) and the P48 using the PTF Image Differencing Extraction (PTFIDE) software (Masci et al., 2016).
iPTF15esb and iPTF16bad have spectra at 12 and 4 epochs, covering the rest-frame phase (relative to the peak date) from +0 to +320 and +3 to +242 days respectively (Table Hydrogen-poor Superluminous Supernovae With Late-time H Emission: Three Events From the Intermediate Palomar Transient Factory). These data were taken with the Double Beam SPectrograph (DBSP; Oke & Gunn, 1982) on the 200 inch telescope at Palomar Observatory (P200), the Low-Resolution Imaging Spectrometer (LRIS; Oke et al., 1995) and the DEep Imaging Multi-Object Spectrograph (DEIMOS; Faber et al., 2003) on the Keck telescopes. The absolute flux calibration of these spectra is set by the broad band photometry at the corresponding phase.
3. Analysis and Results
3.1. Emergence of H emission from H-poor SLSNe
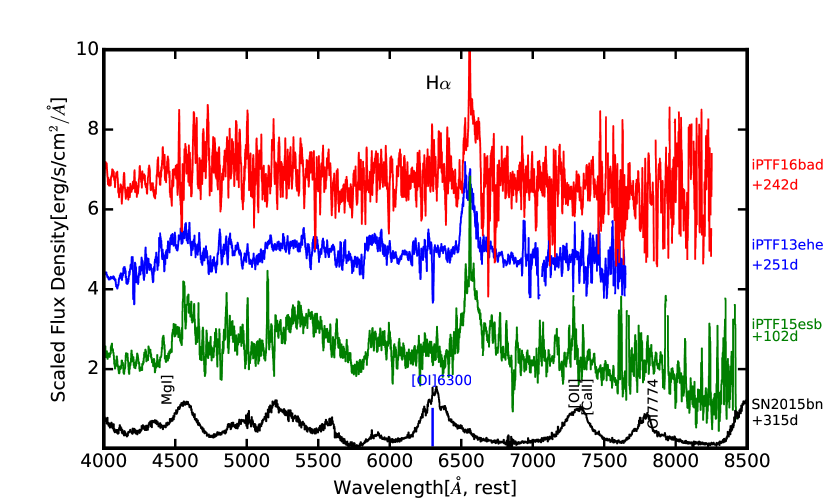
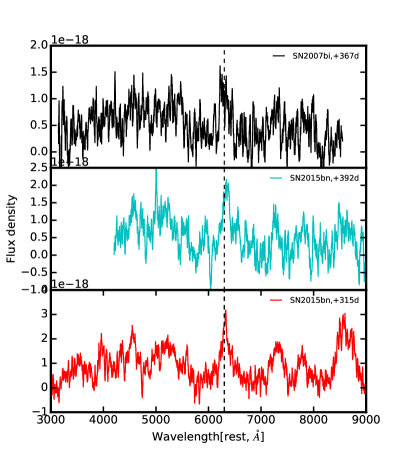
The main result of this paper is the detection of broad H emission in the late-time spectra of the three H-poor SLSNe. Figure 1 displays all of the available spectra for these three events, except two spectra of iPTF15esb at +270 and 320 days, which show only features from the host galaxy. In this figure, the spectra have not been host subtracted. It is apparent that broad H emission lines start to emerge at late-times between photospheric and nebular phases. And they persist until fairly late-times, , and days for iPTF15esb, iPTF16bad and iPTF13ehe respectively, as shown in Figure 2. It is worth noting here that the LCs of iPTF15esb and iPTF16bad decline times faster than that of iPTF13ehe (see §3.2 for details). Therefore, the last spectrum from iPTF15esb at d could be at a similar late phase as that of iPTF13ehe. In addition, Figure 2 compares our late-time spectra with the spectrum of SLSN-I SN2015bn (Nicholl et al., 2016b), showing prominent broad H emission and apparent weak [O I] 6300 Å lines from our three events. Quantitative discussion on [O I] 6300 Å is included in §4.
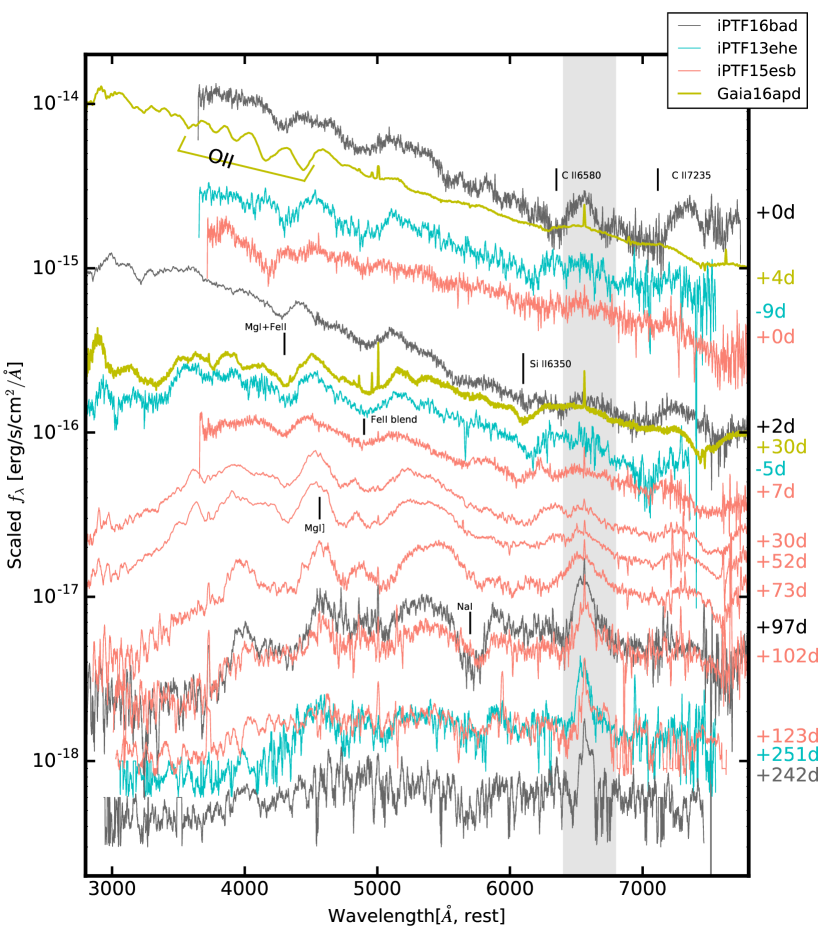
One important constraint is when H is first detected in the available spectra. The answer affects how we calculate the distance the ejecta have traveled since the explosion. We display all of the available spectra for these three events in Figure 1. All spectroscopic data are listed in Table Hydrogen-poor Superluminous Supernovae With Late-time H Emission: Three Events From the Intermediate Palomar Transient Factory, and will be made available via WISeREP (Yaron & Gal-Yam, 2012). For comparison, we also include the high SNR spectrum of Gaia16apd, which is the second closest SLSN-I ever discovered (Yan et al., 2016).
It is clear from Figure 1 that the answer to the above question is not obvious because before a spectrum becomes fully nebular, broad absorption features can make it difficult to determine where the true continuum is. For examples, does the d spectrum for iPTF15esb (Figure 1) have H emission? And is the broad bump near 6500Å in the day spectrum of iPTF16bad H, or continuum between two broad absorption features?
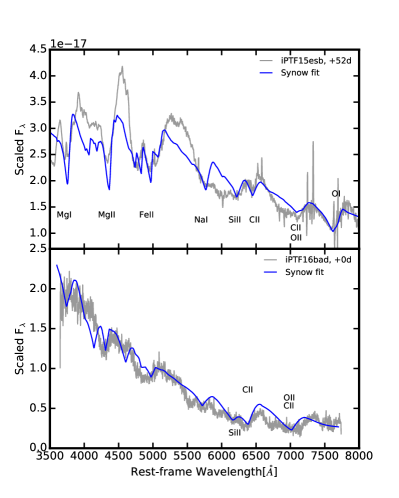
To identify possible absorption features near the 6563Å region, we run SYNOW, the spectral synthesis code (Thomas, 2013). This is a highly parametric code, including ion species, temperature, opacity, photospheric velocity, and the velocity distribution. However, it nevertheless provides a useful consistency check for line identifications. Figure 3 illustrates the two model fits to the day and day spectra for iPTF15esb and iPTF16bad. Clearly, the observed features near Å can be well fit by a combination of Na I, FeII 6299, 6248Å, Si II 6347, 6371Å and CII 6580, 7234Å absorption, without any H emission. This is confirmed by the actual detections of these lines at day in SLSN-I Gaia16apd (Yan et al., 2016). The broad bumps around 6500Å in post-peak and pre-nebular spectra are also seen in SN 2007bi and SN 2015bn (Gal-Yam et al., 2009; Nicholl et al., 2016), and are considered to be a result of multiple absorption features.
By visual inspection of the available spectra, we take , and day as the first dates when H emission lines are clearly detected. This method seems to be subjective, however, lack of full spectroscopic coverage gives much larger uncertainties in determining the true times when H first appears.
3.2. Light Curves: Are these three SLSNe-I special?
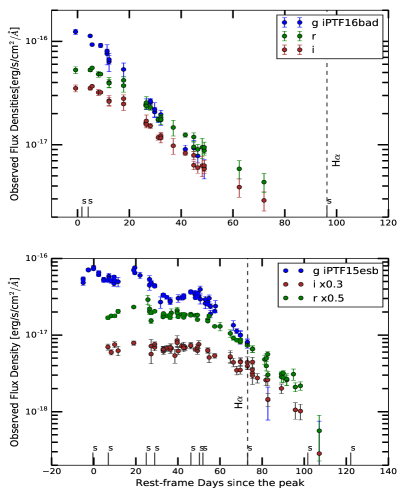
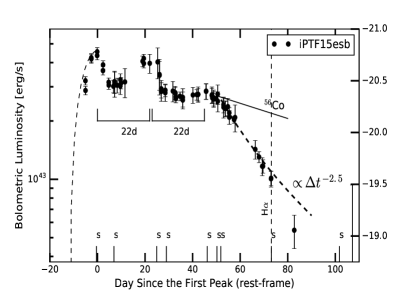
Figure 4 presents the observed light curves of iPTF15esb and iPTF16bad. The derived bolometric light curves are shown in Figure 5 and Figure 6. It is immediately clear that the LCs of iPTF15esb are different from a typical SLSN LC, showing prominent undulations, stronger in the bluer bands. The three peaks are roughly separated by days. Detailed discussion on the iPTF15esb LC morphology is presented in §4.3.
The peak date for iPTF15esb is chosen as the first peak at MJD = 57363.5 days. iPTF16bad has very limited photometric data. However, its and -band LCs in Figure 4 are initially flat, suggesting we discovered this event just before peak. Thus we set the peak date as MJD = 57540.4 days, the epoch of the first data. We construct the bolometric light curve for iPTF15esb using the following procedure. We start with a pseudo-bolometric light curve which is an integral of the broad band photometry. At each epoch with a spectrum, we calculate a bolometric luminosity using a blackbody fit. The ratio between the bolometric and pseudo-bolometric luminosity gives the bolometric correction. Without sufficient early-time photometry, we fit a power-law form to the pre-peak data points, and derived a minimum days. The late-time decay rate follows , much steeper than the 56Co decay rate (solid line in Figure 5). The bolometric LC for iPTF15esb is shown in Figure 5. The similar method was used for iPTF13ehe to get the bolometric light curve. iPTF16bad does not have many spectra. We derive its bolometric LC by assuming similar bolometric corrections to the pseudo-bolometric LC as that of iPTF15esb.
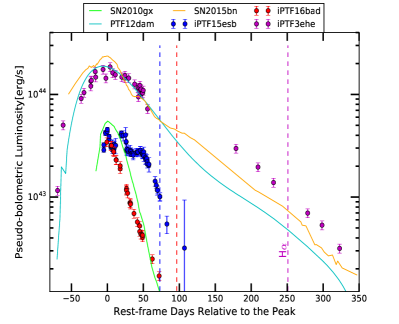
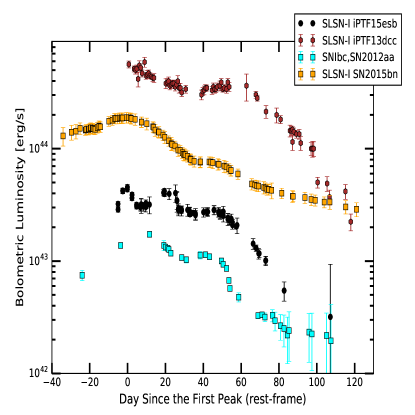
One important question is: are these three SLSNe-I with late-time H emission special and have distinctly different photometric properties compared to other SLSNe-I? The answer is relevant to understanding the nature of these events. Figure 6 makes comparison of these three LCs with other events, including two slow evolving SLSN-I PTF12dam, SN2015bn and one fast evolving SLSN-I SN2010gx (Vreeswijk et al., 2017; Nicholl et al., 2016; Pastorello et al., 2010).
iPTF15esb and iPTF16bad have peak bolometric luminosities of 4 erg s-1 ( mag), whereas iPTF13ehe is more energetic, with erg s-1 ( mag111Here we assume a solar bolometric magnitude of .). Although an unbiased SLSN-I sample does not yet exist, a simple compilation of 19 published SLSNe-I (Nicholl et al., 2015) has a median erg s-1 ( mag).
In addition, one striking feature in Figure 6 is the large difference in evolution rates between the three LCs. For iPTF15esb and iPTF16bad, their post-peak decay rates are fast, mag/day, 3 times faster than that of iPTF13ehe, which is mag/day. For comparison, 56Co decay rate is 0.0098 mag/day. The LC evolution of iPTF15esb and iPTF16bad is similar to the fast evolving SLSN-I SN2010gx (Pastorello et al., 2010), and iPTF13ehe is more like the extremely luminous, slowly evolving SLSN-I SN2007bi (Yan et al., 2015; Gal-Yam et al., 2009). For a naive comparison with the compiled SLSN-I sample by Nicholl et al. (2015), 67% have decay rates of mag/day, and 33% of mag/day. In addition, iPTF13ehe has a rise time scale of days, implying a large ejecta mass of . The other two events do not have sufficient pre-peak data, but in iPTF15esb is likely short, as suggested by the rising rate of the first two available observations before the peak.
We conclude that the photometric properties of these three events are clearly very different from each other. However, they are within the diverse ranges represented by the published SLSNe-I so far, with the possible exception of the unique LC morphology of iPTF15esb. Therefore, it is possible that whatever physical processes responsible for late-time H emission could also be relevant to the whole population.
3.3. Other Spectral Properties
In the following sections, we describe other properties measured from the full spectral dataset.
3.3.1 Rapid Spectral Evolution
As shown in Figure 1, the spectra of these three events are similar to each other at both early and late-time. However, they are very different from the spectra of Gaia16apd in two aspects. First, our spectra at maximum light do not have the full O II absorption series (5 features, as seen in Gaia16apd) at 4000Å, the hallmark of a typical SLSN-I at early phases (Quimby et al., 2011). Instead, their absorption features at 4200Å could be one or two features of the full O II absorption series. This is supported by the matching between the early-time spectrum of Gaia16apd and that of our events. However, we caution that in iPTF16bad, this identification of the partial O II absorption is uncertain. More detailed analyses and modelings are discussed in (Quimby et al., 2017) and (Gal-Yam, 2017).
As pointed out by Mazzali et al. (2016), O II absorptions arise from highly excited O+ with an excitation potential of eV. Such a high energy level implies that the excitation of O II levels is not in thermal equilibrium with the local radiation field. For example, -ray photons from radioactive decays could be a source of excitation energy. This effect is generally represented by a tunable parameter in models, for more details see Mazzali et al. (2016).
The second prominent difference is that spectroscopically, iPTF13ehe and iPTF15esb seem to evolve faster than Gaia16apd, developing strong Mg I and Fe II blends at and days, characteristics of a SLSN-I at later times, such as the Gaia16apd spectrum at day. Naively, this may seem to suggest a lower ejecta mass because less material could cool down faster. This may be the case for iPTF15esb, but is not correct for iPTF13ehe at all because the slow rise time of its LC requires a very high ejecta mass (Yan et al., 2015). This suggests that spectral evolution is affected by many other factors. The situation for iPTF16bad is not clear due to lack of sufficient spectroscopic data.
3.3.2 Higher Ejecta Velocities
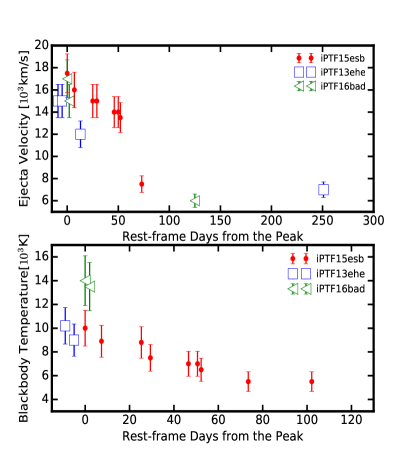
Figure 8 shows the ejecta velocity and the blackbody temperature as a function of time. When possible, we use FeII 5169Å, a commonly used feature, to measure the velocity evolution with time. Other Fe II lines, such as FeII 4924, 5018, 5276Å are also used to cross check the results, as what is done in (Liu et al., 2016). The exception is iPTF15esb at +0 day, whose spectrum does not have a strong FeII absorption, and the ejecta velocity is estimated using O II. The O II feature in iPTF15esb is blue-shifted by Å relative to that of PTF09cnd at day with a velocity of 15000 km s-1 (Quimby et al., 2011). This implies the velocity of iPTF15esb at day is roughly 17,800 km s-1. The same method is applied to iPTF13ehe and iPTF16bad. We find that at maximum light, our three SLSNe-I have higher ejecta velocities than those of other published SLSNe-I, ranging between km s-1 (Nicholl et al., 2015).
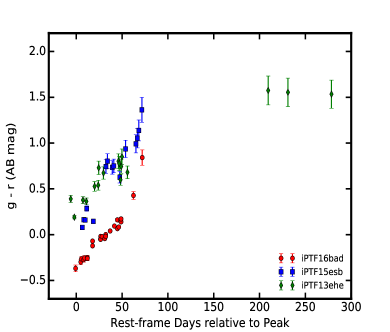
The blackbody temperatures () are estimated by fitting a blackbody function to the spectral continua. At maximum light, the blackbody temperatures of these three SLSNe-I range from K, with iPTF13ehe being the coolest whereas iPTF16bad the hottest. Compared with other SLSNe-I with strong O II absorption series such as PTF09cnd, SN2015bn, PTF11rks and Gaia16apd with maximum light K (Inserra et al., 2013; Quimby et al., 2011; Nicholl et al., 2016; Yan et al., 2015), iPTF15esb and iPTF13ehe are indeed cooler at peak phase. At the peak phase, iPTF16bad has a hotter temperature, which is shown by its steeper and bluer spectra in the early-times (Figure 1). This difference is confirmed by their broad band color versus time shown by Figure 7. The lack of the full O II absorption series should not be associated with blackbody temperatures at the peak phase. This is because the excitation of O II levels are certainly non-thermal.
3.3.3 Broad H Line Luminosities and Velocity Offsets
We perform simultaneous spectral fitting to the spectral continuum plus both narrow and broad H components assuming a Gaussian profile. The narrow line fluxes are iteratively measured from the unsmoothed data. Table Hydrogen-poor Superluminous Supernovae With Late-time H Emission: Three Events From the Intermediate Palomar Transient Factory lists the measured line luminosities and velocity widths.
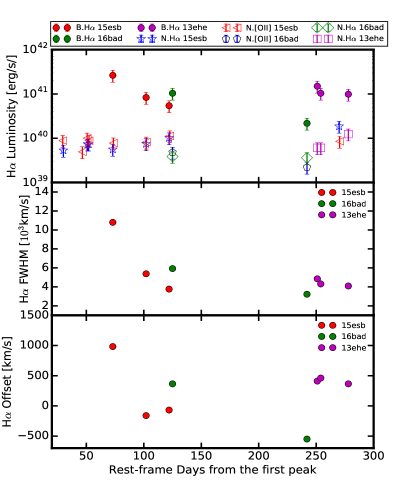
One important question is whether the narrow H line comes from the host or from the supernova. The top panel in Figure 9 shows the integrated line luminosities as a function of time. The narrow H and [O II] lines show slight variations with time, and the changes are less than a factor of 2. In contrast, the broad H line luminosities vary by a factor of 10 with time. Furthermore, the centroids of the narrow H emission are always at 6563Å, whereas the centroids of the broad components change with time (see below). In the case of iPTF13ehe, the spatially resolved 2-D spectrum shows that the narrow emission appears to be at the center of the host galaxy (Yan et al., 2015). We conclude that the narrow H and [O II] emission lines are likely dominated by the host galaxies. Narrow H emission from the supernovae may exist, but is too low luminosity to be detected by our data. The observed small variations are due to the combined effects of variable seeing and slit losses.
The middle panel in Figure 9 shows the broad H line width (FWHM) as a function of time. The FWHM of km s-1 should not be interpreted as the shell expanding velocity. Similar to well studied SNe II powered by ejecta interaction with Circumstellar Medium (CSM), the broad line widths likely indicate the velocities of the shocked material. The H-rich CSM expansion velocity is probably much smaller, of an order of a few 100 km s-1.
These three events show an interesting trend in their velocity offsets between the broad and narrow H components, as shown in the bottom panel in Figure 9. We find that initially the broad components appear to be blue-shifted relative to the narrow components (assuming host emission), and at later-times, become red-shifted. The velocity offset for iPTF15esb at days is as high as +1000 km s-1, and decreases to km s-1 at later epochs. Similarly in iPTF16bad, the offset varies from to km s-1 at +125 and days. iPTF13ehe shows only positive velocity offsets (blue-shifted).
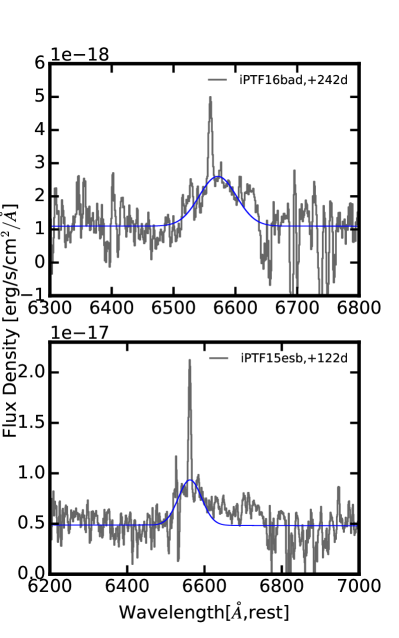
Figure 10 shows the +122 d and +242 d spectra for iPTF15esb and iPTF16bad. Although noisy, the spectra show the excess emission at the red side of H 6563 Å. One possible explanation is that initially the expanding H-shell could obscure the H photons from the back side which is moving away from us. So we initially see more H emission from the material moving toward us (blue-shifts). In this model, at later-times when ejecta become more transparent, we should see more symmetric line profiles with no velocity offsets. This is clearly not what we see at very late-times in our data. So the red excess emission can not be explained by obscuration. We also note that the observed positive velocity offsets in all three events could be in tension with the binary model proposed by Moriya et al. (2015) for iPTF13ehe, which predicts the equal probability of observing both positive and negative velocity offsets relative to the host galaxies.
4. Implications and Discussions
4.1. Nature of the H emission and implication for helium in the ejecta
One important question is where this hydrogen material producing the late-time H emission is located. One possibility is a residual hydrogen layer left over from incomplete stripping of the H-envelope. This scenario can be ruled out because if there is any hydrogen in the ejecta, it is very difficult not to have any H absorption at all near maximum light, as shown in the detailed modelings carried out by Hachinger et al. (2012). This is because ejecta density is usually much higher than cm-3, and the H recombination time scale is seconds days, quite short. An actual example is SN 1993J, which is a type IIb SN with a very low mass of H (). Although its pre-peak spectra have high blackbody temperatures, a weak H emission is present at early phases (Filippenko et al., 1993). For our three events, at post-peak before days, the photosphere temperatures are already low and there are no detectable H features in all three events, even with ample spectral coverage between days and days for iPTF15esb.
The second possibility is a neutral, detached H-rich shell located at a distance from the progenitor star, possibly produced by a violent mass loss episode some time prior to the supernova explosion. When the ejecta eventually run into this shell, the shock interaction ionizes H atoms, and subsequent recombination produces H emission. This idea was initially proposed for iPTF13ehe in Yan et al. (2015).
The third possibility is proposed by Moriya et al. (2015), where the progenitor is in a binary system with a massive, H-rich companion star (). The explosive ejecta strip off a small amount of H from the companion star, which is then mixed in the inner regions of the ejecta. This H-rich material becomes visible only when the inner layers of ejecta are transparent in the nebular phases. This model predicts that depending on the orientation of the binary, there should be equal probability of seeing H-emitting material moving toward or away from us. The fact that we see blueshifts in all three events could be in tension with this prediction and disfavors this model.
Some quantitative parameters for the H-shell model can be derived from our observations. In this scenario, the progenitor is a massive star, prone to violent mass losses. Several decades before the explosion, it undergoes an eruptive episode, ejecting all of the remaining H envelope. Let us assume that the ejecta average speed is and the time between the explosion and the time H is first detected is . The distance traveled by the ejecta, i.e. the radius of this shell, is thus cm. Our measured ejecta velocities range from km s-1 at maximum light to km s-1 at to days. So the baseline assumption of km s-1 is not too far off.
The values of are not well measured for both iPTF15esb and iPTF16bad due to poorly constrained explosion dates. For iPTF15esb, a rough estimate of (Figure 4) is days. iPTF13ehe is a slowly evolving SLSN-I (Yan et al., 2015), with days. Therefore, for these three events, the sizes of the H-rich shells range between cm. If the shell expansion speed is 100 km s-1, the time since the last episode of mass loss before explosion is km s yrs. So approximately, the last episode of mass loss is only 30 years before the supernova explosion. This time could be as short as 10 years if the expansion speed is faster. Such violent instabilities shortly before the supernova explosion could be a very common phenomenon for massive stars in general, as demonstrated for example by flash-spectroscopy of SN IIP iPTF13dqy and precursor outbursts in SNe IIn such as SN2009ip (Yaron et al., 2017; Ofek et al., 2014; Margutti et al., 2014; Martin, 2013). At lower luminosities, a similar and well studied example as our three events is SN2014C, which was initially discovered as an ordinary SN Ib, then evolved into a strongly interacting SN IIn over year time scale (Milisavljevic et al., 2015; Margutti et al., 2017).
Two commonly asked questions are: (1) if this H-shell is present, why don’t we see any H emission in the early-time spectra? (2) why are our spectra not being obscured or absorbed by this shell? This H-shell is likely to be neutral but optically thin during early-times. However, if spectra were taken just hours after explosion, neutral H should have been ionized and we would have detected flash spectral features (Gal-Yam et al., 2014; Yaron et al., 2017), including H emission . For these three events, we don’t detect any early-time H emission because by the time that our first optical spectrum is taken, the H-shell has already recombined. At a density of cm-3, the H recombination time sec days. For a H-shell with cm and a width of 10% R, this density limit corresponds to a mass limit of .
If the H-shell is neutral at pre-peak, why don’t we observe any H absorption? H absorption is produced when an excited H atom at absorbs a photon with Å, and moves up to level. At temperatures of several thousands degree, most H atoms are in the ground state () because the excitation energy from to requires 10 eV, implying a much higher temperature (100,000 K). Without excited H atoms, there is no H absorption. However, we predict that Ly absorption ( - transition) should be strong. Future late-time UV spectroscopy may confirm this for events such as ours.
The mass of this H-shell can be constrained by two other factors. When the ejecta run into the shell, H atoms are ionized again by the thermalized kinetic energy. One constraint is that this ionized H-rich CSM can not have very high electron scattering opacity, i.e. Thomson scattering opacity, with being the width of the shell. Otherwise, photons from the central supernova would have been absorbed. This condition implies , and is the filling factor, is the radius of this shell. Here is cancelled out when computing the total mass. With the Thomson cross section cm2, we have . Assuming the width of this shell is only 10% of the radius , the implied electron volume density cm-3. The H-shell upper mass limits range from for the three events discussed in this paper. In the case of a small filling factor , the shell mass would be less than . One scenario which could naturally explain such a powerful mass loss is the Pulsational Pair-Instability model (PPISN; Woosley et al., 2007; Woosley, 2017). Further support of this model is from the weak [O I]6300Å emission in the nebular phase spectra, as discussed below.
In the H-shell scenario, the time interval between the supernova explosion and the mass loss episode which ejected all of the H-envelope is not very long, only several decades. During this period of time, additional mass loss episodes could remove some helium layers from the progenitor star, but it is very unlikely that all of the helium can be completely removed. For example, Woosley et al. (2002) presented a model for a star with . Their Figure 9 shows before the supernova explosion, the most outer layer has roughly of mixture of H and He, and just underneath that, there is a pure He layer with a mass of . If we assume the mass loss rate of to /yr, similar to nominal wind mass loss rates, the time required to completely remove the pure He layer is yrs, much longer than several decades set by our observational constraint.
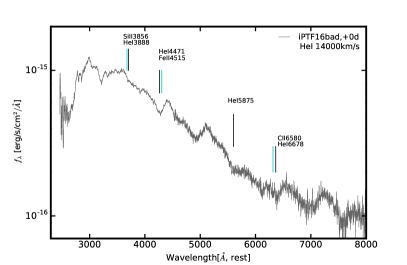
This implies that the ejecta of our three events may contain helium. Observationally, our early-time spectra do not detect significant helium features. However, we caution that presence of weak helium absorption features is very difficult to confidently rule out because He I3888, 4417 and 6678Å lines tend to be blended with other features such as strong Fe II4515Å Si II3856, and C II6580Å, as shown in Figure 11. On another hand, the non-detection of helium features might not be very surprising because helium ionization potential is high, 24.58 eV. This would require much higher temperatures than what our spectra show, or more likely, non-thermal ionization conditions, for example, mixing with radioactive material such as 56Ni.
Indeed, this condition for non-thermal ionization of He probably exist for SLSNe-I, as suggested by commonly detected five O II absorption series around 4000 Å. As argued in Mazzali et al. (2016), the excitation of O II levels is from non-thermal process, such as energetic particles from radioactive decays. What is relevant here is that these particles can also ionized He I (ionization potential of 24.6 eV). So if helium is present in the ejecta, it is a puzzle why we do not detect any spectral signatures in the early-time data.
Another possible explanation for weak or absence of He features is that all helium is mixed into the outer H-envelope and the H+He outer layers were completely stripped off the progenitor stars before the supernova explosions. The ejecta contain no helium material.
4.2. Weak [O I] 6300 doublet emission
The [O I] 6300 doublet emission is usually very strong for SLSNe-I and SNe Ic because of the following two reasons. First, these supernovae are thought to result from the explosions of massive C+O cores. The ejecta should naturally contain a lot of oxygen. Second, the [O I] 6300 line is a very efficient coolant in the nebular phase (Jerkstrand et al., 2017). Therefore, it is common to see very strong [O I] 6300 Å emission in core collapse SNe. Figure 2 visually illustrates an apparent lack of [O I] 6300 Å emission in the late time spectra of our three events. Given the noise level in our spectra, it is not immediately clear whether this apparent discrepancy is significant, however.
To address this question, we take three late-time spectra from SLSN-I SN2015bn at and day (Nicholl et al., 2016b), SN2007bi at day (Gal-Yam et al., 2009), which all have prominent [O I] 6300 Å emission. We scale these three spectra to the distance of iPTF16bad, i.e. multiply by the square of the luminosity distance ratios, and then add the noise measured from the day spectrum for iPTF16bad. The simulated spectra from this procedure are shown in Figure 12. Here the noise added to the input spectra is erg s sec-2 Å-1, measured from the 240 Å region centered at 6300 Å (excluding H) in the day spectrum of iPTF16bad. This noise is then added as a Gaussian random noise to the input spectra. We note that because the input spectra do have their own noises, the output simulated spectra may have slightly higher RMS than the true value.
From this simple simulation, we conclude that if the day spectrum from iPTF16bad were to have the same [O I] luminosity as that of the three input spectra, we would have detected this feature in our data. This implies that our spectra at days likely have intrinsically weaker [O I] 6300 Å emission than the late-time spectra of the three comparison SLSNe-I. Unfortunately, at , the Ca II triplet at 8498Å is redshifted out of the optical range, so we do not know if the Ca II triplet is strong, and serves as an alternative cooling line for these three events. In the simulated spectra, the Ca II triplet is quite strong in SN2015bn, and absent in SN2007bi (see Gal-Yam et al. 2009).
The [O I] 6300, 6364 lines at nebular phase are very useful diagnostics of supernova ejecta. This is because these lines are efficient coolant and typically re-emit a large fraction of heating energy of the O-material. More importantly, these lines become optically thin, and line luminosity in the Non-local thermal equilibrium (NLTE) phase, as discussed in details in (Jerkstrand, 2017).
The apparent weakness of the [O I] 6300 doublet and other ionized O emissions in our three events seem to suggest that there is less oxygen emitting at late-times. This is puzzling because SLSNe-I are thought to be explosive events of C+O cores with masses several tens of solar masses. There could be several explanations. First, the ejecta of our three events may have lower oxygen masses, and perhaps also lower progenitor masses than that of SN2015bn and SN2007bi. The recent modeling of the nebular spectra of SN2015bn and SN2007bi by Jerkstrand et al. (2016) has derived . The second possible explanation is that these three events could be pulsational pair-instability supernova (PPISN). Calculated optical spectra at nebular phase based on pair-instability supernova (PISN) models seem to show a relatively weak [O I] 6300 doublet (Jerkstrand et al., 2016). At face value, this could be considered as supporting evidence for a PISN or PPISN model for these events. However, as shown by Jerkstrand et al. (2016), the calculated nebular spectra show very strong [Ca II] 7300Å emission lines, which are also not detected in our late-time spectra, but are present in the simulated spectra (Figure12). The probability of these three events being PPISN or PISN is small. First is because the required progenitor mass is very high, and secondly, as pointed by Woosley (2017), PPISN still has difficulties producing very energetic SLSNe-I, and iPTF13ehe is such an example.
The third possible explanation is that Oxygen in these three events is detached from 56Ni, and with very little mixing. If the O-zone is above 56Ni, -ray photons from 56Ni decay will be effectively absorbed by Fe group elements before reaching O. In this case, there is not sufficient photon heating to produce [O I] emission. If ejecta density is very high, it would result in high opacity, and the [O I] line may cool inefficiently. Future better modeling of nebular spectra of SLSNe-I would narrow down these possible explanations.
4.3. Nature of the LC undulations in iPTF15esb
What makes iPTF15esb stand out is its peculiar LC with strong undulations, particularly in bluer bands. We note that the three peaks are separated from each other equally by days. After the first peak, its -band and also bolometric LC have two additional small bumps (Figure 4 & 5).
LC undulations are also seen in other SN types, such as SN2012aa (between SN Ibc and SLSN-I), other SLSNe-I (SN2015bn), SN IIn (PTF13z and SN2009ip) (Roy et al., 2016; Nicholl et al., 2016; Pastorello et al., 2013; Nyholm et al., 2017; Inserra et al., 2017). They are probably even present in SN 2007bi and PS1-14bj (Gal-Yam et al., 2009; Lunnan et al., 2016). SN2009ip is either a SN IIn or a SN imposter (Fraser et al., 2013; Graham et al., 2014; Margutti et al., 2014; Martin, 2013). Figure 13 makes a LC comparison between iPTF15esb, SN2012aa and SN2015bn. The LC undulation in iPTF15esb is quite strong, with some similarity to that of SN2012aa. These LC undulations are clearly very different from the double-peak LCs with initial weak bumps followed by prominent main peaks seen in LSQ14bdq, SN2006oz, PTF12dam and iPTF13dcc (Leloudas et al., 2012; Nicholl et al., 2015; Smith et al., 2016; Vreeswijk et al., 2017). Their physical nature may also be different.
Several ideas were proposed by previous studies to explain the light curves. This includes (1) successive collisions between ejecta and mass shells expelled by previous episodic mass losses; (2) magnetar UV-breakout predicted by Metzger et al. (2014); (3) recombination of certain ionized elements; (4) variable continuum optical/UV opacities which could modulate the photon diffusion, thus affecting LC morphology, as proposed for ASASSN-15lh (Godoy-Rivera et al., 2017; Margutti et al., 2017).
In the case of iPTF15esb, interaction based models may explain the data. The second peak has a duration of 20 days and with a net luminosity of erg s-1. The total extra energy in this peak is erg. This implies an excess luminosity of erg s-1 over 10 days. Using a simple scaling relation and taking the ejecta velocity km s-1, we estimate . Eruptive mass losses could produce such mass shells. PPISN models (Woosley, 2017) could produce various successive H-poor shells, and the subsequent collisions between shells and/or ejecta-shell would generate additional energy producing the observed LC undulations.
The second possible explanation is due to the change in recombination of elements such as C and O, as shown in Piro & Morozova (2014), CSM with pure CO can undergo recombination at temperatures of roughly 8000 K. Another similar idea is the change of continuum opacity, which can naturally explain the stronger undulation in bluer bands (Godoy-Rivera et al., 2017; Margutti et al., 2017). Finally, models with central power sources, such as magnetars or fall-back accretion onto a neutron star or black hole, have an energy input function, such as , with and as the magnetic dipole spin-down energy and the spin-down time scale respectively (Dexter & Kasen, 2013; Kasen & Bildsten, 2010). At late-times, the luminosity should scale like t-2, close to , measured from the data (Figure 5). These models seem to be able to explain some data. However, the real test requires detailed calculations which can meet the challenges of all observed features.
5. Summary and conclusions
We report two new SLSNe-I with broad H emission in their late-time spectra discovered by iPTF. Together with iPTF13ehe (Yan et al., 2015), we now have three such events at . The H line luminosities reach as high as erg s-1 and the line widths range from km s-1. We highlight four key observational results from our data.
First, we interpret the late-time H emission as a result of ejecta interaction with a neutral H-shell. The shock heating ionizes the neutral H atoms, which subsequently recombine and produce H emission. The detection of H lines around days since explosion imply that the H-shell must be at a distance not much farther than cm from the progenitor star. This shell with mass and an expansion speed of several 100 km s-1 indicates a very energetic mass loss, which must have happened not much longer than years prior to the supernova explosion. Such a tight timing provides a strong constraint on evolutionary models of massive stars.
The short time interval inferred from our H-shell model also implies that progenitor stars can not have had time to also lose all of the helium envelope. Therefore, it is likely that the ejecta of these three SLSNe-I may have some helium. The real mystery is why we do not detect any He features in the early-time spectra, even though at early times, our three events may have sufficient non-thermal energy sources to ionize He in the ejecta, as suggested by the detections of a partial O II absorption series.
Second, the day spectra of two of our events show no detectable [O I] 6300 Å emission. Using simulations, we demonstrate that at these late phases, our events have intrinsically lower [O I] 6300 Å luminosities in comparison with day spectra of SLSN-I SN2007bi and SN2015bn. Several different scenarios could explain this observation. The simplest one is that the ejecta of our three events may have oxygen masses less than , which was estimated for SN2015bn and SN2007bi (Jerkstrand et al., 2017).
The third result is that for all three events, we initially see that the broad H lines are blue-shifted relative to the hosts. This may be in tension with the massive binary model because it predicted that we should see both red-shifted and blue-shifted H emission lines relative to the host galaxies (Moriya et al., 2015). Interestingly, the velocity offsets between the broad H and the host galaxies change from positive to negative with time for two of the events. The very late-time spectra ( and days) of iPTF15esb and iPTF16bad show a weak signal of excess emission red-ward of 6563 Å. We propose that a decrease of obscuration with time could be a possible explanation for seeing through more H emission from the back side of the H-shells.
Finally, the LC of iPTF15esb has a distinct morphology with significant undulations and three peaks are separated equally by days. Together with the evidence of H-shells, these observations paint a picture of extended and multiple CSM shells, or CSM clumps, at different radii. The LC undulation could be explained by H-poor-ejecta CSM interaction. This would require some mechanisms which can eject multiple layers of material from massive progenitor stars within a time interval of several decades before supernova explosion. One possibility is Pulsational Pair-instability supernova (Woosley, 2017). Quantitative modelings of our data are needed.
With these intriguing results, one important question is how representative these three objects are among other SLSNe-I. Are they unique compared to other SLSNe-I? Photometrically, these three events are very different from each other, in their peak luminosities, and post-peak decay rates and LC morphology. However, their LC properties fall within the diverse range shown by published SLSNe-I, and are not much different from the general population of SLSN-I. Spectroscopically, these three events are very similar to each other at both early and late-times. However, they show some marked differences from other SLSNe-I, with their lack of full O II absorption series in the early-time spectra, and their higher ejecta velocities. In conclusion, our three events are not completely peculiar, but probably represent a subset of the general SLSN-I population. At face value, these three events represent (10-15)% of the PTF SLSN-I sample, although the number of events with good late-time follow-up is not large. The situation is definitely improving.
References
- Abazajian et al. (2003) Abazajian, K., Adelman-McCarthy, J. K., Agüeros, M. A., et al. 2003, AJ, 126, 2081
- Arnett (1996) Arnett, D. 1996, Supernovae and Nucleosynthesis: An Investigation of the History of Matter, from the Big Bang to the Present, by D. Arnett. Princeton: Princeton University Press, 1996.,
- Benetti et al. (2014) Benetti, S., Nicholl, M., Cappellaro, E., et al. 2014, MNRAS, 441, 289
- Blanton et al. (2003) Blanton, M. R., Hogg, D. W., Bahcall, N. A., et al. 2003, ApJ, 592, 819
- Cardelli et al. (1989) Cardelli, J. A., Clayton, G. C., & Mathis, J. S. 1989, ApJ, 345, 245
- Chugai (1991) Chugai, N. N. 1991, MNRAS, 250, 513
- Dilday et al. (2012) Dilday, B., Howell, D. A., Cenko, S. B., et al. 2012, Science, 337, 942
- Dexter & Kasen (2013) Dexter, J., & Kasen, D. 2013, ApJ, 772, 30
- Faber et al. (2003) Faber, S. M., Phillips, A. C., Kibrick, R. I., et al. 2003, Proc. SPIE, 4841, 1657
- Filippenko et al. (1993) Filippenko, A. V., Matheson, T., & Ho, L. C. 1993, ApJ, 415, L103
- Fox et al. (2015) Fox, O. D., Silverman, J. M., Filippenko, A. V., et al. 2015, MNRAS, 447, 772
- Fransson et al. (2002) Fransson, C., Chevalier, R. A., Filippenko, A. V., et al. 2002, ApJ, 572, 350
- Fraser et al. (2013) Fraser, M., Inserra, C., Jerkstrand, A., et al. 2013, MNRAS, 433, 1312
- Fremling et al. (2016) Fremling, C., Sollerman, J., Taddia, F., et al. 2016, A&A, 593, A68
- Gal-Yam (2017) Gal-Yam, A. 2017, ApJ, in prep.
- Gal-Yam et al. (2009) Gal-Yam, A., Mazzali, P., Ofek, E. O., et al. 2009, Nature, 462, 624
- Gal-Yam (2012) Gal-Yam, A. 2012, Science, 337, 927
- Gal-Yam et al. (2014) Gal-Yam, A., Arcavi, I., Ofek, E. O., et al. 2014, Nature, 509, 471
- Gezari et al. (2009) Gezari, S., Halpern, J. P., Grupe, D., et al. 2009, ApJ, 690, 1313
- Graham et al. (2014) Graham, M. L., Sand, D. J., Valenti, S., et al. 2014, ApJ, 787, 163
- Georgy et al. (2012) Georgy, C., Ekström, S., Meynet, G., et al. 2012, A&A, 542, A29
- Godoy-Rivera et al. (2017) Godoy-Rivera, D., Stanek, K. Z., Kochanek, C. S., et al. 2017, MNRAS, 466, 1428
- Hachinger et al. (2012) Hachinger, S., Mazzali, P. A., Taubenberger, S., et al. 2012, MNRAS, 422, 70
- Jerkstrand et al. (2016) Jerkstrand, A., Smartt, S. J., & Heger, A. 2016, MNRAS, 455, 3207
- Jerkstrand et al. (2017) Jerkstrand, A., Smartt, S. J., Inserra, C., et al. 2017, ApJ, 835, 13
- Jerkstrand (2017) Jerkstrand, A. 2017, arXiv:1702.06702
- Kasen & Bildsten (2010) Kasen, D., & Bildsten, L. 2010, ApJ, 717, 245
- Inserra et al. (2016a) Inserra, C., Smartt, S. J., Gall, E. E. E., et al. 2016, arXiv:1604.01226
- Inserra et al. (2016) Inserra, C., Fraser, M., Smartt, S. J., et al. 2016, MNRAS, 459, 2721
- Inserra et al. (2014) Inserra, C., Smartt, S. J., Scalzo, R., et al. 2014, MNRAS, 437, L51
- Inserra et al. (2013) Inserra, C., Smartt, S. J., Jerkstrand, A., et al. 2013, ApJ, 770, 128
- Inserra et al. (2017) Inserra, C., Nicholl, M., Chen, T.-W., et al. 2017, arXiv:1701.00941
- Liu et al. (2016) Liu, Y.-Q., Modjaz, M., & Bianco, F. B. 2016, arXiv:1612.07321
- Langer (2012) Langer, N. 2012, ARA&A, 50, 107
- Leloudas et al. (2012) Leloudas, G., Chatzopoulos, E., Dilday, B., et al. 2012, A&A, 541, A129
- Leloudas et al. (2015) Leloudas, G., Schulze, S., Krühler, T., et al. 2015, MNRAS, 449, 917
- Lunnan et al. (2016) Lunnan, R., Chornock, R., Berger, E., et al. 2016, ApJ, 831, 144
- Lunnan et al. (2014) Lunnan, R., Chornock, R., Berger, E., et al. 2014, ApJ, 787, 138
- Nicholl et al. (2016) Nicholl, M., Berger, E., Smartt, S. J., et al. 2016, ApJ, 826, 39
- Nicholl et al. (2016b) Nicholl, M., Berger, E., Margutti, R., et al. 2016, ApJ, 828, L18
- Nicholl et al. (2015) Nicholl, M., Smartt, S. J., Jerkstrand, A., et al. 2015, ApJ, 807, L18
- Nicholl et al. (2014) Nicholl, M., Smartt, S. J., Jerkstrand, A., et al. 2014, MNRAS, 444, 2096
- Moriya et al. (2015) Moriya, T. J., Liu, Z.-W., Mackey, J., Chen, T.-W., & Langer, N. 2015, A&A, 584, L5
- Masci et al. (2016) Masci, F., Laher, R., Rebbapragada, U., et al. 2016, arXiv:1608.01733
- Margutti et al. (2014) Margutti, R., Milisavljevic, D., Soderberg, A. M., et al. 2014, ApJ, 780, 21
- Margutti et al. (2017) Margutti, R., Kamble, A., Milisavljevic, D., et al. 2017, ApJ, 835, 140
- Margutti et al. (2017) Margutti, R., Metzger, B. D., Chornock, R., et al. 2017, ApJ, 836, 25
- Martin (2013) Martin, J. 2013, Journal of the American Association of Variable Star Observers (JAAVSO), 41, 391
- Matheson et al. (2000) Matheson, T., Filippenko, A. V., Ho, L. C., Barth, A. J., & Leonard, D. C. 2000, AJ, 120, 1499
- Mazzali et al. (2016) Mazzali, P. A., Sullivan, M., Pian, E., Greiner, J., & Kann, D. A. 2016, MNRAS, 458, 3455
- Metzger et al. (2014) Metzger, B. D., Vurm, I., Hascoët, R., & Beloborodov, A. M. 2014, MNRAS, 437, 703
- Milisavljevic et al. (2015) Milisavljevic, D., Margutti, R., Kamble, A., et al. 2015, ApJ, 815, 120
- Miller et al. (2009) Miller, A. A., Chornock, R., Perley, D. A., et al. 2009, ApJ, 690, 1303
- Nyholm et al. (2017) Nyholm, A., Sollerman, J., Taddia, F., et al. 2017, arXiv:1703.09679
- Ofek et al. (2007) Ofek, E. O., Cameron, P. B., Kasliwal, M. M., et al. 2007, ApJ, 659, L13
- Ofek et al. (2014) Ofek, E. O., Sullivan, M., Shaviv, N. J., et al. 2014, ApJ, 789, 104
- Oke & Gunn (1982) Oke, J. B., & Gunn, J. E. 1982, PASP, 94, 586
- Oke et al. (1995) Oke, J. B., Cohen, J. G., Carr, M., et al. 1995, PASP, 107, 375
- Piro & Morozova (2014) Piro, A. L., & Morozova, V. S. 2014, ApJ, 792, L11
- Padmanabhan (2000) Padmanabhan, T. 2000, Theoretical Astrophysics - Volume 1, Astrophysical Processes, by T. Padmanabhan, pp. 622. Cambridge University Press, December 2000. ISBN-10: 0521562406. ISBN-13: 9780521562409. LCCN: QB461 .P33 2000,
- Pastorello et al. (2013) Pastorello, A., Cappellaro, E., Inserra, C., et al. 2013, ApJ, 767, 1
- Pastorello et al. (2010) Pastorello, A., Smartt, S. J., Botticella, M. T., et al. 2010, ApJ, 724, L16
- Perley et al. (2016) Perley, D. A., Quimby, R. M., Yan, L., et al. 2016, ApJ, 830, 13
- Phinney (1989) Phinney, E. S. 1989, The Center of the Galaxy, 136, 543
- Planck Collaboration et al. (2016) Planck Collaboration, Ade, P. A. R., Aghanim, N., et al. 2016, A&A, 594, A13
- Quimby et al. (2011) Quimby, R. M., Kulkarni, S. R., Kasliwal, M. M., et al. 2011, Nature, 474, 487
- Quimby et al. (2017) Quimby, R. M., et al. 2017, ApJ, in prep.
- Roy et al. (2016) Roy, R., Sollerman, J., Silverman, J. M., et al. 2016, A&A, 596, A67
- Schlafly & Finkbeiner (2011) Schlafly, E. F., & Finkbeiner, D. P. 2011, ApJ, 737, 103
- Silverman et al. (2013) Silverman, J. M., Nugent, P. E., Gal-Yam, A., et al. 2013, ApJ, 772, 125
- Smith et al. (2016) Smith, M., Sullivan, M., D’Andrea, C. B., et al. 2016, ApJ, 818, L8
- Smith et al. (2009) Smith, N., Silverman, J. M., Chornock, R., et al. 2009, ApJ, 695, 1334
- Smith et al. (2007) Smith, N., Li, W., Foley, R. J., et al. 2007, ApJ, 666, 1116
- Smith (2014) Smith, N. 2014, ARA&A, 52, 487
- Taddia et al. (2016) Taddia, F., Fremling, C., Sollerman, J., et al. 2016, A&A, 592, A89
- Thomas (2013) Thomas, R. C. 2013, Astrophysics Source Code Library, ascl:1308.008
- Turatto et al. (1993) Turatto, M., Cappellaro, E., Danziger, I. J., et al. 1993, MNRAS, 262, 128
- Vreeswijk et al. (2017) Vreeswijk, P. M., Leloudas, G., Gal-Yam, A., et al. 2017, ApJ, 835, 58
- Woosley (2017) Woosley, S. E. 2017, ApJ, 836, 244
- Woosley et al. (2007) Woosley, S. E., Blinnikov, S., & Heger, A. 2007, Nature, 450, 390
- Woosley et al. (2002) Woosley, S. E., Heger, A., & Weaver, T. A. 2002, Reviews of Modern Physics, 74, 1015
- Yan et al. (2015) Yan, L., Quimby, R., Ofek, E., et al. 2015, ApJ, 814, 108
- Yan et al. (2016) Yan, L., Quimby, R., Gal-Yam, A., et al. 2016, arXiv:1611.02782
- Yaron et al. (2017) Yaron, O., Perley, D. A., Gal-Yam, A., et al. 2017, arXiv:1701.02596
- Yaron & Gal-Yam (2012) Yaron, O., & Gal-Yam, A. 2012, PASP, 124, 668
| Name | RA | DEC | Redshift | ||||||
|---|---|---|---|---|---|---|---|---|---|
| J2000 | J2000 | mag | mag | mag | mag | mag | mag | ||
| iPTF13ehe | 06:53:21.50 | +67:07:56.0 | 0.3434 | 0.04 | a | 24.9 | 24.24 | ||
| iPTF15esb | 07:58:50.67 | +66:07:39.1 | 0.224 | 0.04 | 23.65 | 22.61 | 21.90 | 21.50 | 21.44 |
| iPTF16bad | 17:16:39.73 | +28:22:12.6 | 0.2467 | 0.04 |