Growth of groups of wind generated waves
Abstract
In this paper we demonstrate numerical computations of turbulent wind blowing over group of waves that are growing in time. The numerical model adopted for the turbulence model is based on differential second-moment model that was adopted for growing idealized waves by Drullion & Sajjadi (2014). The results obtained here demonstrate the formation of cat’s-eye which appear asymmetrically over the waves within a group.
1 Introduction
The question of growth and decay of wind generated waves in the ocean has been studied extensively but the interactions and energy transfer between the water wave and the ambient wind is still not fully understood. Most of the studies (experimental, numerical or analytical) consider monochromatic or idealized waves profile. As it has been observed extensively that waves actually travel in groups for which the profile changes as the wave is traveling. In this study we are considering the influence of grouping on the growth of ocean waves induced by wind. We are concentrating our efforts on the region around the height were the real part of the complex wave speed is equal to the mean flow velocity. This region called “critical layer” is at the center of Miles’ (1957) theory and Lighthill’s (1962) interpretation of growth waves. In this region closed streamlines structures called “cat’s-eye” are developed. The larger these structures are, the more disturbance of the wind flow above the wave occurs. In some previous work, e.g. Drullion & Sajjadi (2014), a high-Reynolds number stress closure model over a moving idealized wavy surface was used to show that their size and position are dependent on the wave age and wave steepness, which is in accordance with direct numerical simulations of Sullivan et al.(2000). In this study we use the same Reynolds stress model over different groups of waves to determine the height of the critical layer and the overall shape and size.
2 Growth of waves within a group
In this paper we report computations of turbulent flow over two groups, in a frame of reference moving with the wave, namely group1 and group2, for three different wave ages: , , and . In the case of group1 the group amplitude is kept fixed, i.e. non-growing waves. In contrast, we consider a case where the wave grows.
For group1 we adopt the following profile:
where is the wave amplitude which we have chosen to be 0.0015 m, is the wave number, and . In both wave groups the wavelength is m.
The profile for group2 is taken to be:
where am, the amplitude is set at 0.00165, and are the same as for group1.
In our computations, the domain is taken to six wavelengths horizontally and two wavelengths vertically. The groups only extend over four wavelengths (from to ) and are surrounded by a flat surface. The latter ensures the periodicity in boundary conditions in the -direction. The condition is imposed for the top boundary condition, and for the south boundary condition we prescribe the orbital velocity of the wave groups.
The orbital velocities for the group1 (for ) is given by
where is the group velocity. Similarly for the group2 the imposed orbital velocities is taken to be
Note that, for the flat surfaces surrounding the group portion on the south boundary, namely when and , we impose the conditions and .
For the growing wave groups, the computational mesh is regenerated every 50 time steps, where each time step consists of 500 iterations and is increased as the waves become steeper. The growth factor for each wave within the group is , where can be taken to be , or and .
3 Results and conclusions
A computational turbulence model is used to compute the disturbed turbulent air flow over two different kind of wave group which we have referred to as group1 and group2.
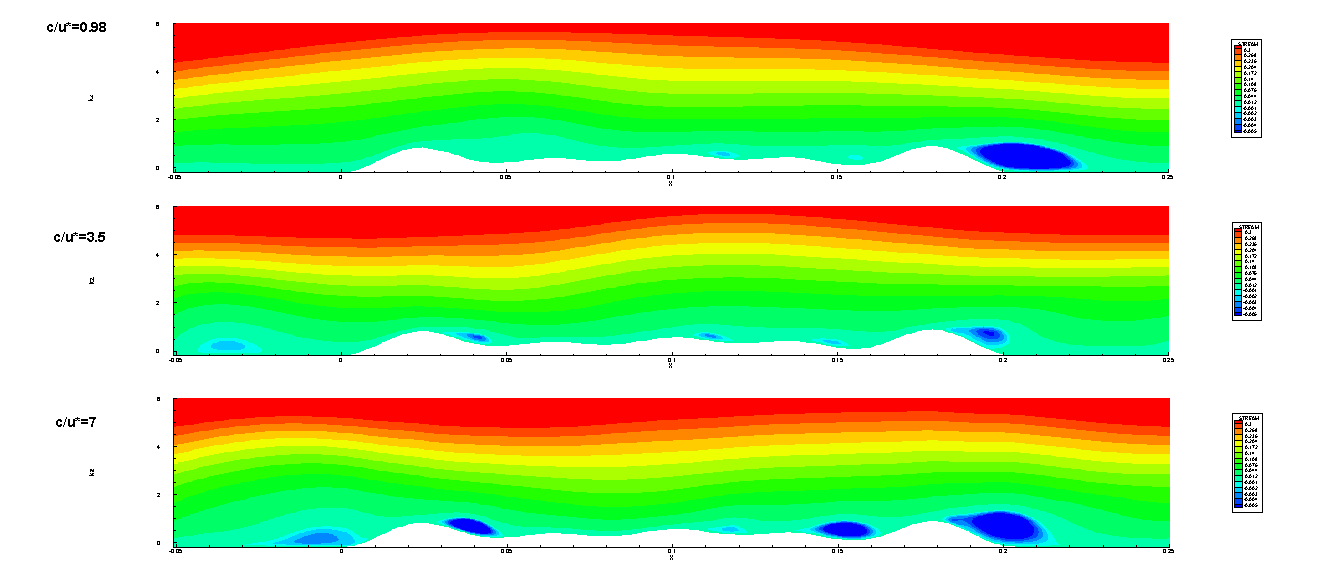
Figure 1 shows the contour plot of the stream function for group1 as a function for three wave ages and 7. As can be seen from this set of figures, at lowest value of a cat’s-eye is formed downstream of the last wave in a group. As the wave age increases the same cat’s eye become smaller but lifts up and moves toward the peak of the last wave, also formation of weaker cat’s eye over other waves, within the group, become visible. At the cat’s-eye become stronger and move further over the peak of the waves in the group.
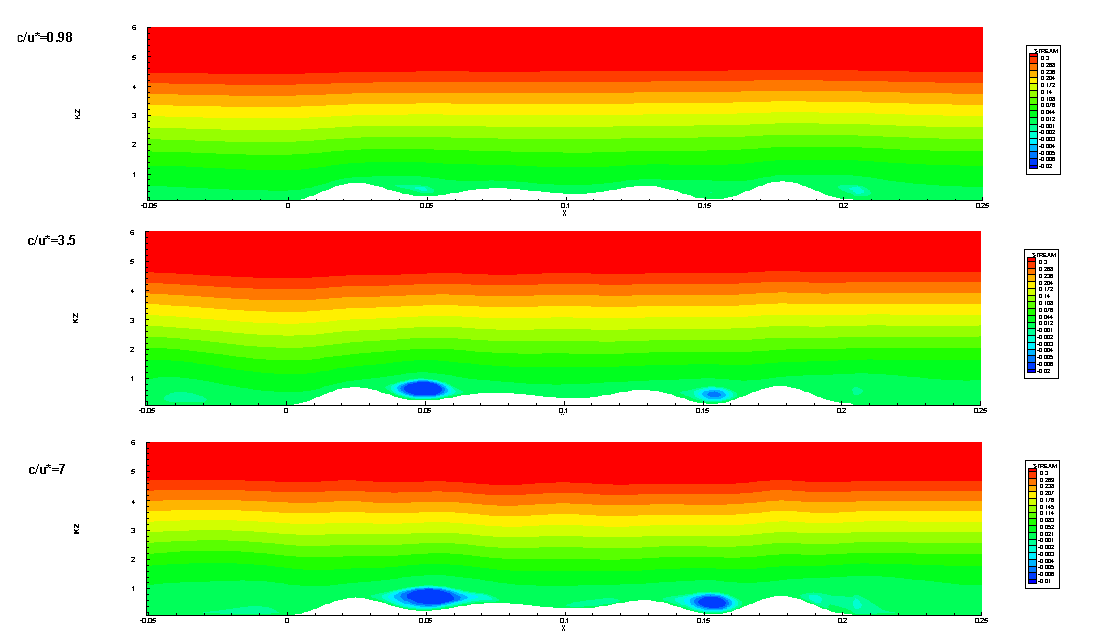
In figure 2 we perform the same computation for the group2 for the same wave ages. In this case no cat’s eye appear at . However, at two cat’s eye is formed; a stronger one in the lee of the the first wave in the group, and a weaker one in the lee of the third wave in a group, but unlike group1 no cat’s-eye is formed in the lee of the last wave in the group.
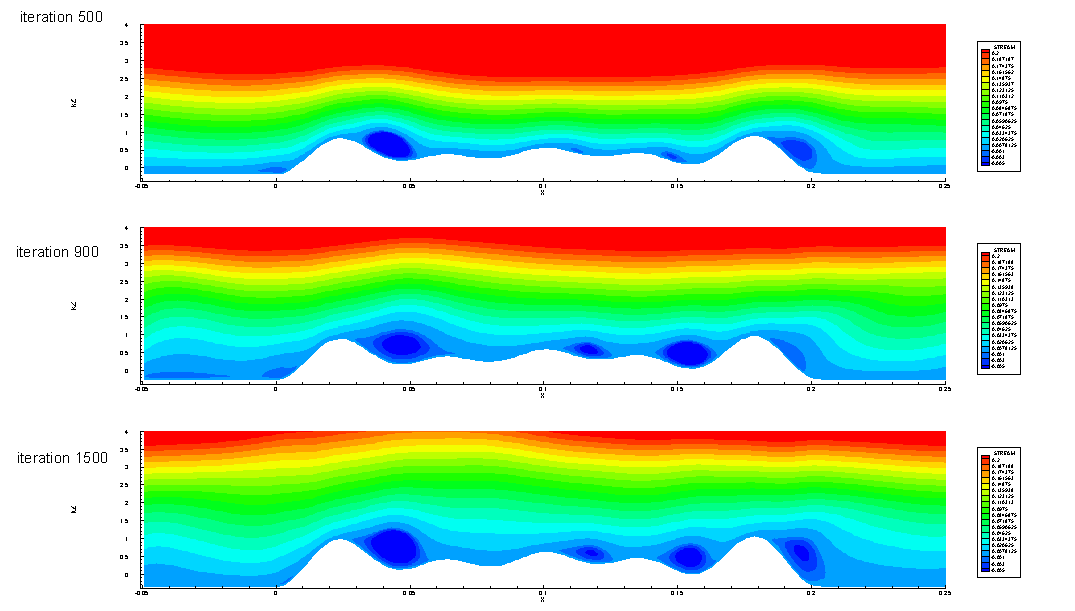
In figure 3 we show the the result of computations for a growing wave group group1 for one fixed value of . As can bee seen from these figures, as the wave steepens cat’s-eye are formed in each lee of the wave in the group. As the wave grows so do the cat’s-eyes, and similar to our other computations for monochromatic waves and bimodal Stokes waves (see also Sullivan et al. (2000)) the critical height rises further up from the surface of the waves. It is also evident that the flow become more asymmetrical which shows how the air flow over the downwind part of the group is lower than over the upwind part. We remark that as the wave steepens the number of iteration must be increased in order to obtain a converged results. In what we have reported there is some doubt as the steepness is increased whether the solution for the steeper waves have completely converged. This is part of our on going investigation.
We thus conclude that this asymmetry causes the critical layer height to be lower over the downwind part. This is in line with the conclusion of our earlier paper, (Sajjadi, Hunt and Drullion (2016)) that the positive growth of the individual waves on the upwind part of the wave group exceeds the negative growth on the downwind part. Hence, this leads to the critical layer group effect producing a net horizontal force on the waves, in addition to the sheltering effect.
References
- [Drullion & Sajjadi (2014)] Drullion, F. & Sajjadi, S.G. 2014 Interaction of wind with surface water waves. Neural, Parallel, and Sci. Comp. 22, 303–314.
- [Lighthill (1962)] Lighthill, M.J. 1962 Physical interpretation of the theory of wind generated waves. J. Fluid Mech. 14, 385–398.
- [Miles (1957)] Miles, J.W. 1957 On the generation of surface waves by shear flows. J. Fluid Mech. 3, 185–204.
- [Sajjadi, Hunt & Drullion (2016)] Sajjadi, S. G., Hunt, J. C. R., Drullion, F. 2016 Growth of unsteady wave groups by shear flows. Proc. of IMA Conference on Turbulence, Waves and Mixing, Kings College Cambridge, U.K., July 2016, 79–84.
- [sulmac (2000)] Sullivan, P.P., McWilliams, J.C. & Moeng, C.H. 2000 Simulation of turbulent flow over idealized water waves J. Fluid Mech., 404, 47–85.