New Compact Star Cluster Candidates in the Galactic Plane
Abstract
The sample of known star clusters, the fundamental building blocks of galaxies, in the Milky Way is still extremely incomplete for objects beyond a distance of 1 – 2 kpc. Many of the more distant and young clusters are compact and hidden behind large amounts of extinction. We thus utilised the deep high resolution near infrared surveys UGPS and VVV to uncover so far unknown compact clusters and to analyse their properties.
Images of all objects in the area covered by these two surveys, and which are listed as Galaxy in SIMBAD have been inspected and 125 so far unknown stellar clusters and candidate clusters have been identified. Based on the frequent associations with star formation indicators (nebulosities, IRAS sources, Hii regions, masers) we find that the typical cluster in our sample is young, at distances between 1 – 10 kpc and has a typical apparent radius of 25″. We suggest more systematic searches e.g. at all positions of 2MASS extended sources to increase the completeness of the known cluster sample beyond distances of 2 kpc.
keywords:
Galaxy: open clusters and associations: general; galaxies: star clusters: general; Galaxy: evolution; Galaxy: general; Galaxy: structure1 Introduction
The vast majority of stars form in clusters (Lada & Lada, 2003), and most of these clusters dissolve on timescales of 10s of Myrs (Goodwin & Bastian, 2006) to form the field star population. Thus, star clusters are the building blocks of galaxies and their study is intimately linked to understanding star formation and in particular the formation of more massive stars which are almost exclusively formed in clusters (Gvaramadze et al., 2012), with potential exceptions such as discussed e.g. in Oey et al. (2013).
Establishing large and complete cluster samples is vital if we for example want to understand the details of the cluster destruction/dissolution processes. In particular the study of the impact of tidal forces from the galactic potential, requires well characterised and bias free samples of clusters at a range of galactocentric radii. The current most complete lists of clusters and their properties contain a few thousand objects (e.g. about 2200 in the up to date online version111http://www.wilton.unifei.edu.br/ocdb/ of Dias et al. (2002) and about 3000 in Kharchenko et al. (2013), plus a few hundred more in the additions by Schmeja et al. (2014) and Scholz et al. (2015). The latter paper also finds that our sample of known clusters is only complete to a distance of 1.8 kpc from the Sun, with still many old clusters missing at even shorter distances (Schmeja et al., 2014) and basically no clusters are known at distances further away than 5 kpc - see Fig. 7 in Schmeja et al. (2014). Kharchenko et al. (2013) also show that the projected surface number density of clusters at the position of the Sun is about 130 clusters per square kiloparsec in the disk. This implies that there should be of the order of 2 – 3 clusters in the Milky Way. Hence, only about 10 % of all clusters are currently catalogued and an even smaller fraction has its parameters determined accurately.
Many of the more distant undiscovered clusters are young and thus potentially associated with large amounts of extinction and projected against the Galactic plane. Furthermore, with typical sizes of about one parsec, these clusters will be of an apparent angular size of less than one arcminute for distances of about 3 kpc or higher. Hence, to discover and potentially analyse clusters missing in our current sample, deep high resolution infrared surveys are going to be of importance. Extensive searches in 2MASS (Skrutskie et al., 2006) have already uncovered a huge new population of new clusters and candidates (e.g. Dutra et al. (2003), Bica et al. (2003), Froebrich et al. (2007), Glushkova et al. (2010)). But the new deeper and higher resolution surveys such as UGPS (Lucas et al., 2008) and VISTA VVV (Minniti et al., 2010) will be able to uncover so far unrecognised objects which are more compact and fainter. Some searches for new clusters in these surveys have already been done (e.g. Solin et al. (2012), Borissova et al. (2011), Lucas et al. (2017) in prep.). However, many compact objects might have been overlooked. We thus aim to search these surveys at the positions of known extended, but potentially miss-classified objects and characterise them.
2 Data analysis
2.1 Target Selection
The fact that a large fraction clusters at distances above about 2 kpc has not yet been discovered, is to some extent, but not entirely due to extinction in the Galactic plane and the large number of foreground and background stars in low latitude fields. One additional problem is spatial resolution. Assuming a typical cluster size of 0.5 pc, then at 5 kpc the cluster would appear only to have an extend of 20″. Thus, even if there are many bright, detectable members, typical surveys such as 2MASS are not able to resolve all of the stars into individual point sources and the cluster will only be detected as an extended object instead. This is in particular true for young, embedded clusters which are typically also surrounded by reflection/emission nebulae. As young clusters constitute the majority of all clusters in the Galaxy (e.g. Lada & Lada (2003), Buckner & Froebrich (2014)), a large fraction of them might be detectable even in 2MASS but only as extended sources, which in many cases might have been classified (wrongly) as potential galaxies.
Hence, in order to identify potentially miss-classified star clusters, we used the SIMBAD222http://simbad.u-strasbg.fr/simbad/ database. We extracted all objects from SIMBAD that were listed as Galaxy (otype = ’G’). We planed to analyse the NIR data from the deep high resolution UGPS and VISTA VVV surveys for these objects to establish their true nature. Thus, we limited the selection to objects with a -band detection (i.e. mag < 20.0) in SIMBAD. This ensures we do not select extended objects only detected at mid or far-infrared wavelengths, but most likely sources with even an extended 2MASS source counterpart. Note that the limiting magnitude for extended sources in 2MASS is about = 14 mag (Jarrett et al., 2000).
We also limited the search in SIMBAD to regions overlapping the UGPS and VVV survey fields. The borders of the surveys where chosen as listed below. Please note that the UGPS has its images orientated along the RA/DEC coordinates, while the VVV data has an image orientation along the Galactic coordinate system. Thus, the applied restrictions for UGPS (especially in latitude) are not the exact survey limits.
-
•
For UGPS: and
-
•
For UGPS: and
-
•
For UGPS: and
-
•
For VVV: and (disk)
-
•
For VVV: and (bulge)
Thus, our selection covers a total area that we searched for potential miss-identified star clusters of about 1874 square degrees in UGPS and 520 square degrees in VVV. There is some overlap of 44 square degrees between UGPS and VVV near the Galactic Centre, where both surveys have available data. Thus, the total area surveyed is 2350 square degrees.
In total we find 4387 objects which pass our selection criteria, i.e. are listed as Galaxy in SIMBAD, have a detected -band counterpart of at least 20th magnitude and are within the UGPS or VVV footprint.
2.2 NIR data
To investigate the high resolution UGPS and VVV images of the above selected 4387 objects in detail we have used the WSA333http://wsa.roe.ac.uk//index.html and VSA444http://horus.roe.ac.uk/vsa/index.html databases to extract images for each target. We extracted image cutouts with a size of 3′3′ around each object. For some targets no images or not all three images were available. This can be caused by the object either being close to the survey boundary (which is not straight) or some images are not (yet) included in the latest available data release due to not passing quality thresholds. Note that we used DR10 of the UGPS and DR4 for the VVV data.
In total 3409 (77.7 %) of our targets have all three NIR images available in either UGPS or VVV. We have combined these images into colour composites and visually inspected all of them to select all objects that could be real star clusters. For each target the colour composite images have been looked at in various zoom levels as well as different contrast settings to ensure all potential star clusters can be identified.
2.3 Star Cluster Identification
From all the images we selected every object that visually could either be identified as a group or cluster of stars or a nebulous young stellar object. In other words we removed all the obvious galaxies from the target list. An investigation of the properties of all these galaxies as well as potential new galaxy clusters is planned, but outside the scope of this paper. Other objects we removed were clearly associated with extended emission from edges of Hii regions and not stellar clusters. We also removed double entries, i.e. objects that had two entries as Galaxy in SIMBAD very close to each other, in the same cluster. Finally, all remaining objects where checked if they have an entry as a known star cluster in SIMBAD.
The above process resulted in the following:
-
•
There are 125 candidates for so far unknown/unpublished groups or clusters of (mostly) young stars;
-
•
There are 19 objects that are known cluster candidates; There are 84 known star clusters which are not analysed any further in this paper;
-
•
There is one object that cannot be reliably identified as either a star cluster candidate or background galaxy (see discussion below).
Images of all the new star cluster candidate objects have been inspected a second time in detail to determine some of the cluster properties. We manually estimated the central position of the cluster, as well as its apparent radius () and also approximately counted manually the apparent number of stars visible in the NIR images that seem to belong to the cluster.
Based on this inspection, we further divided the sample of 125 objects into clear cluster candidates (star clusters, hereafter), with an obvious overdensity of NIR detectable stars and less clear cluster candidate objects (candidate clusters hereafter). The latter mostly encompasses very nebulous objects and small/less populous groups of young stars. This split has resulted in 77 new clusters and 48 cluster candidates. Similarly to the new clusters, we also classified the 19 known cluster candidates. In total 16 of these we judge to be clusters, the remaining 3 fall into the candidate cluster category.
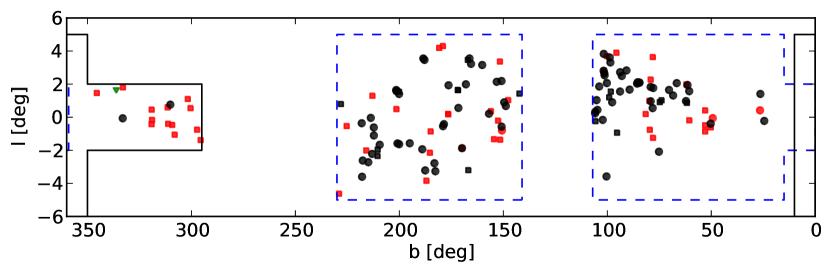
Finally, all the 125 candidate objects, as well as the 19 known cluster candidates have been checked if they are associated with an Hii region or a maser, and if the NIR images show a detectable nebulosity. We also cross-matched all objects with IRAS and MSX sources and in particular objects in the Red MSX Source (RMS) survey (Lumsden et al., 2013) database555http://rms.leeds.ac.uk/cgi-bin/public/RMSDATABASE.cgi. The latter objects have in most cases a known distance determined from radial velocities (Urquhart et al., 2014), which we have extracted. We list all the properties of the objects in Table LABEL:new_clusters_data in the Appendix. Note that of the 125 candidate objects 26 have been previously discovered in UGPS data by an alternative search method, and will be published in Lucas et al. (2017, in prep.). These are 24 of our 77 new clusters and 2 of our 48 new cluster candidates. We refrain from listing the properties of these objects in Table LABEL:new_clusters_data and also do not show their images in Tables LABEL:new_clusters_images and LABEL:new_cluster_candidates_images as they will be presented in Lucas et al. (2017, in prep.). They are, however, included in our general analysis of their properties in Sect. 3 and are shown in Fig. 1.
2.4 Photometry and Cluster Membership
To investigate the cluster candidates and their members in more detail, we have downloaded the full point source catalogues within 5’ of each object from the WSA and VSA databases. We extract the magnitudes (using AperMag3) as well as the pstar parameter for each star and only include stars with pstar and detections in all three filters in our subsequent analysis. See Lucas et al. (2008) and Minniti et al. (2010) for a detailed descriptions of how the magnitudes are measured and the pstar value for each star is determined.
For each cluster candidate we calculate the number of additional stars () within compared to the surrounding area (outside , within 5’). This number gives a measure of how significant an overdensity of stars the cluster represents compared to the surrounding field i.e. estimates the number of NIR detectable cluster members with reliable photometry. In regions of extended large dark clouds and increased extinction these estimates can of course be erroneous. Furthermore, even in these high resolution surveys, many stars are not resolved and thus will not have a sufficiently accurate brightness measurement to be included in the analysis. Especially in young and very embedded clusters, which make up a large fraction of our objects (see below), many stars are not detected at the shorter (-band) wavelengths. Thus, some clusters even show a negative number of members compared to the background population despite a clear cluster being visible in the -band images (e.g. Cl 019, Cl 043 and in particular Cl 062).
We also investigated NIR colour-magnitude (- vs. ) diagrams (CMDs) and colour-colour (- vs -) diagrams (CCDs) of stars in the cluster area compared to the control field around them. However, due to the limited photometry available, and the generally small number of stars, it has been proven impossible to use well established photometric decontamination techniques (e.g. following Bonatto & Bica (2007), Froebrich et al. (2010) or Buckner & Froebrich (2014)) to reliably identify the most likely cluster members in order to fit isochrones to these diagrams. As there is basically nothing to be gained from these diagrams we refrain from showing them. It might be possible with careful psf-photometry of the UGPS/VVV images to improve the photometry, but this is beyond the scope of this paper.
3 Results and Discussion
3.1 Distribution of New Clusters and Candidates
In total we have identified 77 new clusters, 53 of which are not included in the list of Lucas et al. (2017, in prep.). The images of these clusters are shown in Table LABEL:new_clusters_images in Appendix B and all the determined properties are listed in Table LABEL:new_clusters_data. We also identify 48 objects as candidate clusters or groups of stars, 46 of which are not included in the list of Lucas et al. (2017, in prep.). The images of these candidates are also shown in Table LABEL:new_cluster_candidates_images in Appendix B and all the properties are listed in Table LABEL:new_clusters_data.
We show the general distribution along the Galactic plane of all the newly discovered objects in Fig. 1. The figure shows that most of the newly discovered clusters are away from the Galactic Centre. Only two of the new clusters are in the area covered by VVV, the remainder are in the UGPS area. This can to some extend be attributed to the density of SIMBAD objects classified as Galaxy in the different fields. While the disk part of VVV has 0.6 ’G’ type objects per square degree, the equivalent UGPS field has 1.0 such objects per square degree and the UGPS field in the outer Galaxy has 3.4 objects per square degree. The latter is certainly caused by the lower extinction and thus many more real galaxies in the sample. The differences between the two UGPS and VVV inner disk fields are very minor when considering the actual extend. The number of new clusters and candidates found in the equivalent area of the inner disk in UGPS is almost identical to the number found in the VVV area. Hence, most of the new clusters are found more than 60 degrees away from the Galactic Centre.
Amongst the known cluster candidates in our list (most are from Solin et al. (2012), one from Ivanov et al. (2005) and one from Camargo et al. (2015)), we identify 16 as real clusters. In case of the remaining 3 objects no clear verdict can be reached from our data. Thus, these objects remain cluster candidates. All their images are shown in Table LABEL:known_cluster_candidates_images in Appendix B and all the properties are listed in Table LABEL:new_clusters_data. In particular object Cl 142, known as Camargo 442 (Camargo et al., 2015), seems not to be a real cluster. Instead the images suggest that this is just extended nebulosity surrounding a single star and not a cluster.
One of our objects (Cl 145) is of an unclear nature (see Fig. LABEL:unknown_object_images in Appendix B). It is situated in a very crowded field near the Galactic Centre. A detailed inspection of the image seems to suggest an increased number of fainter stars towards the centre as well as nebulosity. On the other hand, it is not clearly identifiable as a background galaxy. The 2MASS images of the globular cluster FSR 1735 (Froebrich et al., 2007) appear somehow similar to this object, hence there is still a possibility that this is a compact, distance rich cluster and not a background galaxy.
3.2 Properties of New Clusters and Candidates
The properties of all new clusters, new cluster candidates and known candidates in our sample are summarised in Table LABEL:new_clusters_data. The table is organised by object group (new clusters, new candidates, etc.) and lists the object identifier, the coordinates (J2000 and galactic), the cross identification IDs from IRAS and MSX, associations with known Hii regions, masers and nebulosities (identified in the images), the distances obtained from associated RMS sources, the apparent radii as well as the number of potential members determined manually from the images and automatically from the photometric catalogues.
Of all our objects, 88.3 % have an association with an IRAS source. This percentage is basically identical for the new clusters and the new cluster candidates. Similarly, 25.5 % of all objects are associated with an MSX source with identical percentages for the different groups.
The fraction of objects that are associated with star formation indicators such as Hii regions and masers are also investigated. In total 27.6 % of objects are associated with Hii regions and 10.3 % with masers. There are slight differences in the percentages between the new clusters and the new candidates. While about 1/3 of the new clusters are associated with Hii regions, only 1/5 of the new cluster candidates have such an association. This could be due to the fact the Hii regions are indicators of slightly more massive and evolved stars, thus increasing the likelihood of detecting more stars in the images and thus their classification as a new cluster. We find that 1/10 of the new clusters and 1/6 of the new cluster candidates have associations with known masers. As masers are indicators of more embedded younger massive protostars, it is understandable that due to the increased extinction and younger age of these objects it is more difficult to identify a sufficient number of members in the images to classify the objects as new clusters.
In total 77.9 % of all objects are associated with detectable nebulous NIR emission. Again, there is some variation of this fraction between the new clusters (74.0 %) and the new cluster candidates (87.5 %). Similarly to the association with Hii regions and masers, this difference can be explained by extinction. Increased amounts of dust tend to lead to more detectable nebulosity and at the same time decreased detectability of cluster members and thus, more likely a classification of an object as cluster candidate.
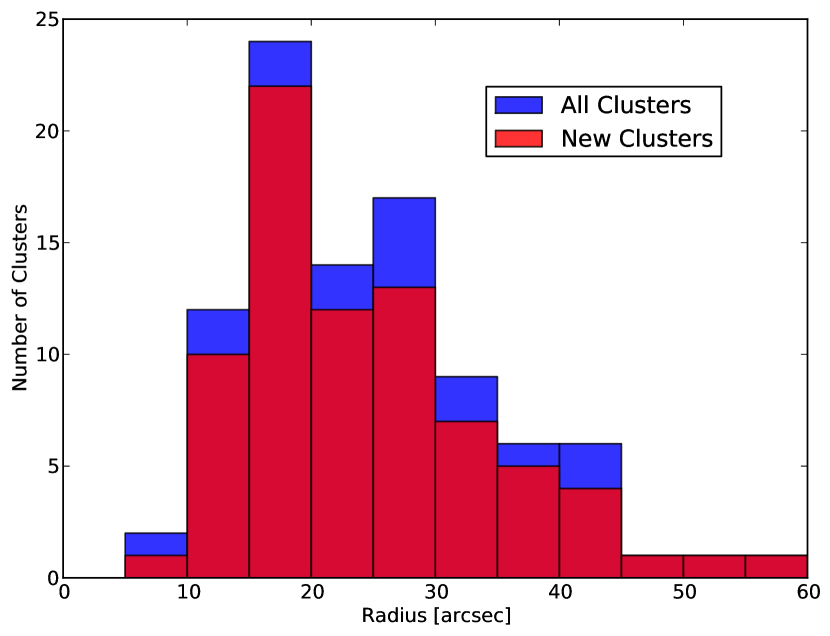
We show the distribution of apparent radii measured for all clusters (known candidates and new clusters) in the left panel of Fig. 2. Most clusters have apparent radii between 10″ and 45″ with a wide distribution. The median radius of the distribution is 23″. Thus, all the clusters are quite compact, caused by the selection of the objects as miss-classified galaxies. Objects much more extended than this would most likely have been classified correctly as clusters even with lower resolution 2MASS data. For comparison, the MWSC list by Kharchenko et al. (2013), including the additions by Schmeja et al. (2014) and Scholz et al. (2015), does only contain very few objects with a core radius of less than 36″, and no objects at all with an apparent radius smaller than 60″. Given the large number of compact clusters identified in this work, compared to the small number of known objects in the current up to date literature shows the potential for future discoveries in these high resolution infrared surveys.
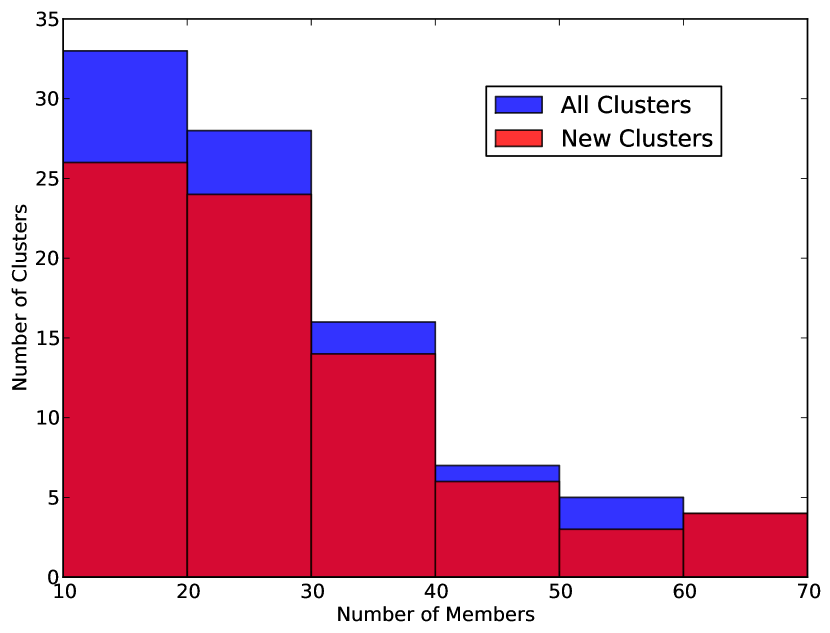
We display the distribution of the manually estimated cluster members for all clusters (known candidates and new clusters) in the right panel of Fig. 2. As to be expected there are significantly more clusters with a smaller number of members. The median number of manually detected members is 23 stars. The distribution of automatically detected members in the clusters looks similar, just with a smaller number of clusters in each bin. This is caused, as explained in Sect. 2.4, by the fact that in regions with increased extinction the automatic determination of the number of members fails, as background stars to the cluster are not detected in the cluster field.
As can be seen in Table LABEL:new_clusters_data, the range of distances for the clusters with associations to RMS objects is very large. The distances range from just above 1 kpc to slightly more than 10 kpc, with a median value of about 6 kpc. These clusters are hence typically much further away than the objects listed in the MWSC list, which have typical distances of 1.5 – 2.5 kpc. The typical distances combined with the median apparent radius of the clusters, lead to a typical radius of 0.7 pc for the clusters in our sample. However, only a fraction of 18 % of the new clusters have a distance estimate. One could try to fit isochrones to potential cluster members in order to obtain further distance estimates for the remainder of the sample. However, as discussed in Sect. 2.4, it has proven not possible to do with the currently available pipeline aperture photometry from UGPS/VVV. This is mostly caused by the compactness of the new clusters and the in part high extinction, which prevents detection and/or reliable photometry in the -band.
4 Conclusions
In order to identify potentially undetected star cluster (candidates) in the Galactic plane, we manually inspected images from the UGPS and VVV surveys for all objects classified as ’Galaxy’ in SIMBAD to identify miss-classified star clusters. A total of 4387 objects where initially selected and images for 3409 of those where available and investigated in detail in an area of 2350 square degrees over both surveys.
Amongst the investigated objects we identified 125 so far unknown cluster candidates, 19 known cluster candidates and 1 object of unclear nature. We performed a detailed inspection of the so far unknown objects and identified 77 new clusters and 48 cluster candidates. All but three of the already known cluster candidates can be confirmed as clusters with the utilised higher resolution UGPS and VVV data.
A large fraction of the newly identified clusters and candidates are associated with star formation indicators. Overall, about 80 % have detectable NIR nebulosities, about 90 % are associated with IRAS sources, 25 % with MSX sources and Hii regions and 10 % with masers. We extracted the distances of the associated MSX sources and find that they range from 1 to 10 kpc, with a median of about 6 kpc. The typical apparent radius of the new clusters is about 25″ corresponding to about 0.7 pc at the typical distance. Thus, our newly identified clusters are young, apparently compact clusters at distances of several kiloparsec. Detailed cluster member identification and isochrone fitting for the new objects cannot be performed as the currently available photometry is not of sufficient quality due to the compactness of the detected clusters. PSF photometry of the original survey data might in future allow such investigations.
The large number of new clusters detected by our search is promising for future work. While the discovered objects are in no way numerous enough to account for the incompleteness in our cluster samples beyond about 1 – 2 kpc, they show that many of these missing clusters can be discovered in the available datasets. A more systematic search in UGPS/VVV, e.g. at all positions of extended 2MASS sources or near groups of UGPS/VVV objects with low pstar values, should reveal a substantial number of so far uncatalogued clusters.
acknowledgements
The author would like to thank J. Urquhart for providing the RMS based distances reported in the paper. He also acknowledges the comments on some of the sources provided by D. Minniti, P.W. Lucas and T. Gledhill.
References
- Bica et al. (2003) Bica E., Dutra C. M., Soares J., Barbuy B., 2003, A&A, 404, 223
- Bonatto & Bica (2007) Bonatto C., Bica E., 2007, MNRAS, 377, 1301
- Borissova et al. (2011) Borissova J., Bonatto C., Kurtev R., Clarke J. R. A., Peñaloza F., Sale S. E., Minniti D., et a., 2011, A&A, 532, A131
- Buckner & Froebrich (2014) Buckner A. S. M., Froebrich D., 2014, MNRAS, 444, 290
- Camargo et al. (2015) Camargo D., Bonatto C., Bica E., 2015, MNRAS, 450, 4150
- Dias et al. (2002) Dias W. S., Alessi B. S., Moitinho A., Lépine J. R. D., 2002, A&A, 389, 871
- Dutra et al. (2003) Dutra C. M., Bica E., Soares J., Barbuy B., 2003, A&A, 400, 533
- Froebrich et al. (2010) Froebrich D., Schmeja S., Samuel D., Lucas P. W., 2010, MNRAS, 409, 1281
- Froebrich et al. (2007) Froebrich D., Scholz A., Raftery C. L., 2007, MNRAS, 374, 399
- Glushkova et al. (2010) Glushkova E. V., Koposov S. E., Zolotukhin I. Y., Beletsky Y. V., Vlasov A. D., Leonova S. I., 2010, Astronomy Letters, 36, 75
- Goodwin & Bastian (2006) Goodwin S. P., Bastian N., 2006, MNRAS, 373, 752
- Gvaramadze et al. (2012) Gvaramadze V. V., Weidner C., Kroupa P., Pflamm-Altenburg J., 2012, MNRAS, 424, 3037
- Ivanov et al. (2005) Ivanov V. D., Borissova J., Bresolin F., Pessev P., 2005, A&A, 435, 107
- Jarrett et al. (2000) Jarrett T. H., Chester T., Cutri R., Schneider S., Skrutskie M., Huchra J. P., 2000, AJ, 119, 2498
- Kharchenko et al. (2013) Kharchenko N. V., Piskunov A. E., Schilbach E., Röser S., Scholz R.-D., 2013, A&A, 558, A53
- Lada & Lada (2003) Lada C. J., Lada E. A., 2003, ARA&A, 41, 57
- Lucas et al. (2008) Lucas P. W., Hoare M. G., Longmore A., Schröder A. C., Davis C. J., Adamson A., Bandyopadhyay R. M., et al. 2008, MNRAS, 391, 136
- Lumsden et al. (2013) Lumsden S. L., Hoare M. G., Urquhart J. S., Oudmaijer R. D., Davies B., Mottram J. C., Cooper H. D. B., Moore T. J. T., 2013, ApJS, 208, 11
- Minniti et al. (2010) Minniti D., Lucas P. W., Emerson J. P., Saito R. K., Hempel M., Pietrukowicz P., Ahumada A. V., Alonso M. V., Alonso-Garcia J., Arias J. I., Bandyopadhyay R. M., 2010, New Astronomy, 15, 433
- Oey et al. (2013) Oey M. S., Lamb J. B., Kushner C. T., Pellegrini E. W., Graus A. S., 2013, ApJ, 768, 66
- Schmeja et al. (2014) Schmeja S., Kharchenko N. V., Piskunov A. E., Röser S., Schilbach E., Froebrich D., Scholz R.-D., 2014, A&A, 568, A51
- Scholz et al. (2015) Scholz R.-D., Kharchenko N. V., Piskunov A. E., Röser S., Schilbach E., 2015, A&A, 581, A39
- Skrutskie et al. (2006) Skrutskie M. F., Cutri R. M., Stiening R., Weinberg M. D., Schneider S., Carpenter J. M., Beichman C., Capps R., 2006, AJ, 131, 1163
- Solin et al. (2012) Solin O., Ukkonen E., Haikala L., 2012, A&A, 542, A3
- Urquhart et al. (2014) Urquhart J. S., Figura C. C., Moore T. J. T., Hoare M. G., Lumsden S. L., Mottram J. C., Thompson M. A., Oudmaijer R. D., 2014, MNRAS, 437, 1791
Appendix A Cluster Data Table
| Name | Coordinates | Cross-ID | Association | Distance | Radius | Number | |||||||
|---|---|---|---|---|---|---|---|---|---|---|---|---|---|
| RA/DEC (J2000) | Galactic (l,b) | with | of Stars | ||||||||||
| [h:m:s] | [∘:′:′′] | [deg] | IRAS | MSX | Hii | Maser | Nebula | [kpc] | [arcsec] | Man. | Aut. | ||
| New Clusters | |||||||||||||
| Cl 001 | 04:01:26.4 | 53:43:17 | 148.799412 | 0.677165 | IRAS 035755334 | – | N | N | N | – | 18 | 30 | 11 |
| Cl 002 | 04:05:56.6 | 51:27:05 | 150.814877 | 0.571217 | – | – | N | N | Y | – | 15 | 10 | – |
| Cl 003 | 04:06:25.5 | 53:21:49 | 149.591151 | 0.900032 | IRAS 040255313 | – | N | N | Y | – | 26 | 40 | 4 |
| Cl 004 | 04:18:32.6 | 53:26:03 | 150.859922 | 2.188007 | IRAS 041465318 | G150.860202.1879 | Y/N | Y | N | – | 32 | 50 | 24 |
| Cl 005 | 04:29:00.1 | 51:45:23 | 153.171059 | 2.140904 | IRAS 042515138 | – | Y | N | Y | – | 28 | 15 | 21 |
| Cl 006 | 04:35:58.9 | 47:43:03 | 156.895187 | 0.212232 | IRAS 043224736 | – | N | N | N | – | 20 | 30 | 5 |
| Cl 007 | 05:01:39.7 | 47:07:22 | 160.144438 | 3.155929 | IRAS 045794703 | G160.145203.1559 | Y | N | Y | 1.94 | 27 | 40 | – |
| Cl 013 | 05:39:28.4 | 24:56:30 | 182.678494 | 3.265738 | IRAS 053632454 | – | Y | Y | N | – | 10 | 15 | 4 |
| Cl 014 | 05:40:29.6 | 29:56:48 | 178.553723 | 0.418188 | IRAS 053722955 | – | N | N | N | – | 16 | 10 | 3 |
| Cl 015 | 05:41:05.2 | 29:30:26 | 178.994673 | 0.541804 | IRAS 053782928 | – | N | N | Y | – | 25 | 25 | 12 |
| Cl 016 | 05:42:20.6 | 24:48:36 | 183.134536 | 2.782362 | IRAS 053932447 | – | N | N | N | – | 29 | 35 | 17 |
| Cl 017 | 05:44:23.9 | 33:03:51 | 176.341522 | 1.931052 | IRAS 054113302 | – | N | N | Y | – | 56 | 30 | 25 |
| Cl 018 | 05:50:40.1 | 20:48:10 | 187.562049 | 3.214981 | IRAS 054762047 | – | N | N | N | – | 26 | 15 | 14 |
| Cl 019 | 05:58:24.5 | 20:13:57 | 188.969785 | 1.937577 | IRAS 055542013 | G188.969601.9380 | N | N | Y | 2.0 | 30 | 25 | – |
| Cl 020 | 06:12:06.9 | 15:09:04 | 195.000702 | 1.575500 | – | – | N | N | Y | – | 19 | 15 | – |
| Cl 021 | 06:16:31.8 | 23:47:23 | 187.902651 | 3.461314 | IRAS 061342348 | – | N | N | Y | – | 15 | 30 | 6 |
| Cl 022 | 06:18:04.2 | 23:19:14 | 188.483899 | 3.551225 | IRAS 061502320 | – | N | N | Y | – | 20 | 50 | 11 |
| Cl 023 | 06:21:47.7 | 10:39:23 | 200.078150 | 1.632706 | IRAS 061901040 | G200.078901.6323 | Y | N | N | 5.78 | 40 | 70 | 20 |
| Cl 024 | 06:23:34.3 | 09:56:19 | 200.917363 | 1.583128 | IRAS 062080957 | G200.916601.5827 | Y/N | N | Y | 5.54 | 34 | 40 | 10 |
| Cl 025 | 06:32:51.3 | 12:01:34 | 200.127573 | 1.404202 | IRAS 063001203 | – | N | N | N | – | 19 | 30 | 6 |
| Cl 026 | 06:35:50.0 | 10:59:49 | 201.377469 | 1.578306 | – | – | N | N | N | – | 16 | 15 | 6 |
| Cl 027 | 06:35:56.1 | 11:00:19 | 201.381527 | 1.604296 | IRAS 063311102 | – | N | N | Y | – | 27 | 20 | 6 |
| Cl 028 | 06:36:19.3 | 10:54:26 | 201.512264 | 1.643583 | IRAS 063351057 | – | N | N | N | – | 17 | 30 | 15 |
| Cl 038 | 13:51:59.6 | 61:15:39 | 310.146375 | 0.759752 | IRAS 134846100 | – | N | Y | Y | – | 30 | 20 | – |
| Cl 039 | 16:18:57.4 | 50:23:59 | 333.029624 | 0.065123 | – | – | N | Y | Y | – | 26 | 20 | – |
| Cl 041 | 18:36:47.1 | 07:35:41 | 24.507573 | 0.223496 | IRAS 183400738 | – | Y | N | Y | – | 13 | 20 | – |
| Cl 044 | 19:39:32.7 | 26:05:25 | 61.422407 | 1.947718 | IRAS 193742558 | – | N | N | Y | – | 17 | 20 | – |
| Cl 046 | 19:50:53.0 | 30:38:10 | 66.608918 | 2.060751 | IRAS 194893030 | – | N | N | Y | – | 13 | 10 | – |
| Cl 047 | 19:58:03.1 | 31:44:07 | 68.341812 | 1.313669 | IRAS 195603135 | G068.341801.3138 | Y | N | Y | 11.66 | 12 | 10 | – |
| Cl 048 | 20:01:37.4 | 33:35:28 | 70.316479 | 1.648899 | IRAS 195973327 | G070.316401.6493 | Y/N | N | Y | 7.42 | 17 | 20 | – |
| Cl 049 | 20:21:55.1 | 39:59:46 | 77.900648 | 1.767362 | – | G077.899901.7678 | Y | N | Y | 1.4 | 23 | 10 | – |
| Cl 050 | 20:25:25.3 | 41:03:19 | 79.150728 | 1.829256 | IRAS 202364053 | – | N | N | Y | – | 15 | 20 | – |
| Cl 051 | 20:27:58.8 | 39:32:09 | 78.196161 | 0.550244 | IRAS 202613922 | G078.195200.5497 | Y/N | N | Y | 8.51 | 9 | 10 | 1 |
| Cl 053 | 20:29:46.8 | 35:31:42 | 75.154768 | 2.084232 | IRAS 202783521 | – | N | Y | Y | – | 24 | 30 | – |
| Cl 054 | 20:41:53.5 | 45:32:00 | 84.534232 | 2.089183 | IRAS 204024521 | – | N | N | Y | – | 14 | 25 | – |
| Cl 055 | 20:41:55.2 | 45:32:39 | 84.545836 | 2.091922 | – | – | N | N | Y | – | 12 | 15 | – |
| Cl 056 | 20:44:53.1 | 46:14:15 | 85.410346 | 2.114474 | IRAS 204314603 | – | N | N | Y | – | 13 | 15 | – |
| Cl 057 | 20:46:17.2 | 46:24:35 | 85.695990 | 2.032407 | IRAS 204464613 | – | Y | N | Y | – | 38 | 20 | – |
| Cl 058 | 21:01:34.9 | 48:55:01 | 89.272880 | 1.670386 | IRAS 205994843 | G089.272701.6703 | Y | N | Y | 8.06 | 23 | 30 | – |
| Cl 059 | 21:02:21.8 | 50:48:35 | 90.777103 | 2.827686 | IRAS 210075036 | G090.776402.8281 | Y | N | Y | 1.74 | 15 | 10 | – |
| Cl 060 | 21:13:38.9 | 52:14:01 | 93.014939 | 2.495089 | IRAS 211205201 | G093.016602.4953 | Y | N | N | – | 19 | 10 | – |
| Cl 061 | 21:16:19.3 | 52:58:57 | 93.837221 | 2.720457 | IRAS 211475246 | – | N | N | N | – | 16 | 20 | 2 |
| Cl 062 | 21:21:53.6 | 52:10:47 | 93.859904 | 1.554173 | IRAS 212025157 | G093.858801.5551 | Y | N | Y | 6.36 | 33 | 70 | – |
| Cl 063 | 21:36:46.0 | 56:38:56 | 98.506636 | 3.311011 | IRAS 213515625 | – | N | N | Y | – | 17 | 20 | 13 |
| Cl 064 | 21:37:04.4 | 57:05:16 | 98.832037 | 3.609138 | – | – | N | N | N | – | 19 | 20 | – |
| Cl 066 | 21:52:02.2 | 56:47:49 | 100.197892 | 2.064316 | IRAS 215035633 | G100.197402.0643 | Y/N | N | Y | 5.85 | 29 | 40 | – |
| Cl 067 | 21:52:30.6 | 59:06:52 | 101.703900 | 3.828645 | IRAS 215095852 | – | N | N | N | – | 16 | 20 | 2 |
| Cl 068 | 21:56:15.1 | 57:50:42 | 101.296341 | 2.530582 | IRAS 215455736 | – | N | N | Y | – | 23 | 15 | – |
| Cl 069 | 21:56:27.3 | 58:01:50 | 101.432089 | 2.660077 | IRAS 215485747 | – | Y | N | Y | – | 39 | 70 | 27 |
| Cl 070 | 21:57:44.6 | 58:21:06 | 101.763679 | 2.809178 | IRAS 215615806 | G101.763902.8100 | Y/N | Y | Y | 7.81 | 32 | 25 | – |
| Cl 071 | 22:13:16.6 | 56:12:14 | 102.192782 | 0.162377 | IRAS 221145557 | – | N | N | Y | – | 13 | 15 | – |
| Cl 072 | 22:15:08.7 | 58:49:16 | 103.875995 | 1.857624 | IRAS 221345834 | G103.874401.8558 | Y | N | Y | 1.59 | 49 | 20 | 17 |
| Cl 075 | 22:26:57.4 | 58:49:41 | 105.163562 | 1.033268 | IRAS 222515834 | – | N | N | Y | – | 14 | 10 | – |
| New Cluster Candidates | |||||||||||||
| Cl 078 | 03:56:57.8 | 54:45:02 | 147.633127 | 1.033568 | IRAS 035305436 | – | N | N | N | – | – | – | – |
| Cl 079 | 04:05:47.0 | 50:25:04 | 151.486411 | 1.357451 | IRAS 040205017 | – | N | N | N | – | – | – | – |
| Cl 080 | 04:19:10.7 | 48:24:57 | 154.445183 | 1.325439 | IRAS 041544817 | – | N | N | Y | – | – | – | – |
| Cl 081 | 04:27:49.6 | 53:43:08 | 151.627347 | 3.367920 | IRAS 042385336 | – | N | N | Y | – | – | – | – |
| Cl 082 | 04:32:44.6 | 48:31:49 | 155.931246 | 0.365437 | IRAS 042904825 | – | N | N | Y | – | – | – | – |
| Cl 083 | 04:15:22.0 | 50:34:36 | 152.496404 | 0.205135 | IRAS 041155027 | – | N | N | Y | – | – | – | – |
| Cl 084 | 05:11:22.8 | 36:21:20 | 169.835550 | 1.878073 | IRAS 050813616 | – | N | N | N | – | – | – | – |
| Cl 085 | 05:37:42.0 | 32:00:48 | 176.486090 | 0.177157 | – | – | N | N | N | – | – | – | – |
| Cl 086 | 05:37:50.8 | 32:00:40 | 176.504622 | 0.202220 | – | – | N | N | N | – | – | – | – |
| Cl 087 | 05:47:04.3 | 20:59:41 | 186.965545 | 3.837873 | – | – | N | N | Y | – | – | – | – |
| Cl 088 | 05:49:39.7 | 23:16:59 | 185.308898 | 2.146923 | IRAS 054662316 | – | N | Y | Y | – | – | – | – |
| Cl 089 | 05:53:43.6 | 24:14:45 | 184.954832 | 0.855921 | IRAS 055062414 | G184.955100.8559 | N | N | Y | 3.66 | – | – | – |
| Cl 090 | 06:00:33.4 | 31:56:44 | 179.037040 | 4.299981 | IRAS 055733156 | G179.038004.3003 | N | N | Y | 1.1 | – | – | – |
| Cl 091 | 06:04:10.1 | 30:20:24 | 180.820245 | 4.188061 | IRAS 060093020 | – | N | N | Y | – | – | – | – |
| Cl 092 | 06:31:58.7 | 10:27:48 | 201.414795 | 0.492048 | IRAS 062921029 | – | N | N | Y | – | – | – | – |
| Cl 093 | 06:49:40.2 | 03:32:52 | 215.889431 | 2.009736 | IRAS 064710329 | – | N | N | Y | – | – | – | – |
| Cl 095 | 07:04:21.6 | 16:23:20 | 228.993299 | 4.619786 | IRAS 070201618 | – | N | N | Y | – | – | – | – |
| Cl 096 | 07:12:24.5 | 11:15:34 | 225.326623 | 0.531525 | IRAS 071001110 | – | Y | N | Y | – | – | – | – |
| Cl 097 | 11:45:04.7 | 63:17:46 | 295.558094 | 1.378464 | IRAS 114266301 | – | N | N | Y | – | – | – | – |
| Cl 098 | 12:00:57.0 | 63:04:10 | 297.251695 | 0.755942 | IRAS 115836247 | – | N | N | Y | – | – | – | – |
| Cl 099 | 12:29:41.7 | 62:13:09 | 300.401305 | 0.545612 | IRAS 122686156 | – | N | N | Y | – | – | – | – |
| Cl 100 | 12:41:17.6 | 61:44:42 | 301.731465 | 1.103014 | IRAS 123836128 | – | N | N | Y | – | – | – | – |
| Cl 101 | 13:37:20.7 | 63:28:12 | 308.031655 | 1.053791 | IRAS 133386312 | – | N | N | Y | – | – | – | – |
| Cl 102 | 13:46:37.0 | 62:39:30 | 309.219610 | 0.462208 | IRAS 134316224 | – | N | N | Y | – | – | – | – |
| Cl 103 | 14:02:36.2 | 61:05:45 | 311.425369 | 0.596829 | IRAS 135906051 | – | Y | N | Y | – | – | – | – |
| Cl 104 | 14:02:52.8 | 62:07:23 | 311.177140 | 0.400493 | IRAS 135926153 | – | N | N | Y | – | – | – | – |
| Cl 105 | 14:59:29.2 | 58:20:10 | 319.089385 | 0.460397 | IRAS 145565808 | – | N | N | Y | – | – | – | – |
| Cl 106 | 15:00:35.0 | 58:58:10 | 318.915062 | 0.164954 | – | – | Y | Y | Y | – | – | – | – |
| Cl 107 | 15:03:13.7 | 59:04:29 | 319.163190 | 0.420600 | IRAS 145935852 | – | Y | N | Y | – | – | – | – |
| Cl 108 | 16:10:38.7 | 49:05:59 | 332.955261 | 1.802102 | IRAS 160694858 | – | Y | N | Y | – | – | – | – |
| Cl 109 | 16:59:42.3 | 40:03:45 | 345.494751 | 1.466657 | IRAS 165623959 | – | N | Y | Y | – | – | – | – |
| Cl 110 | 19:25:57.9 | 15:03:02 | 50.222047 | 0.606428 | IRAS 192361456 | G050.221300.6063 | Y | N | Y | 3.34 | – | – | – |
| Cl 111 | 19:27:34.8 | 17:54:37 | 52.921318 | 0.414364 | IRAS 192531748 | G052.921700.4142 | N | Y | Y | 5.06 | – | – | – |
| Cl 112 | 19:30:54.7 | 17:28:44 | 52.922557 | 0.488824 | IRAS 192861722 | G052.922100.4892 | Y/N | N | Y | 5.06 | – | – | – |
| Cl 113 | 19:32:16.1 | 17:17:54 | 52.920171 | 0.859438 | IRAS 193001711 | AGAL052.91900.861 | N | N | Y | – | – | – | – |
| Cl 114 | 19:40:34.6 | 26:34:15 | 61.954815 | 1.982962 | IRAS 193852627 | – | N | N | Y | – | – | – | – |
| Cl 115 | 19:45:52.5 | 24:17:42 | 60.575275 | 0.186735 | IRAS 194372410 | G060.575000.1861 | Y | N | Y | 7.48 | – | – | – |
| Cl 116 | 20:14:25.9 | 41:13:37 | 78.123116 | 3.633933 | IRAS 201264104 | G078.122403.6320 | N | Y | Y | 1.4 | – | – | – |
| Cl 117 | 20:23:23.9 | 41:17:40 | 79.127561 | 2.278287 | IRAS 202164107 | G079.127202.2782 | Y | N | Y | 1.4 | – | – | – |
| Cl 118 | 20:30:50.9 | 41:02:30 | 79.736752 | 0.990351 | IRAS 202904052 | – | N | Y | Y | – | – | – | – |
| Cl 119 | 20:34:49.9 | 38:19:07 | 78.001769 | 1.243995 | IRAS 203293808 | – | N | N | Y | – | – | – | – |
| Cl 121 | 20:39:58.0 | 41:59:15 | 81.517594 | 0.192362 | – | G081.516800.1926 | Y | N | Y | 1.4 | – | – | – |
| Cl 122 | 21:18:52.8 | 55:03:23 | 95.587783 | 3.898574 | IRAS 11735450 | – | N | Y | Y | – | – | – | – |
| Cl 123 | 21:44:04.8 | 58:01:46 | 100.162064 | 3.696814 | IRAS 14255747 | – | N | N | Y | – | – | – | – |
| Cl 124 | 21:55:41.8 | 57:58:31 | 101.318808 | 2.678575 | IRAS 15405744 | G101.319302.6785 | N | N | Y | 6.24 | – | – | – |
| Cl 125 | 21:57:05.5 | 58:17:54 | 101.663280 | 2.819535 | IRAS 15545803 | – | N | N | N | – | – | – | – |
| Confirmed Cluster Candidates | |||||||||||||
| Cl 126 | 03:27:31.4 | 58:19:22 | 142.245218 | 1.429872 | IRAS 032355808 | G142.244601.4299 | Y/N | N | Y | 4.15 | 31 | 50 | 9 |
| Cl 127 | 04:56:55.2 | 37:57:17 | 166.813749 | 3.198304 | IRAS 045353752 | G166.814103.1986 | Y/N | N | Y | 2.0 | 41 | 50 | 54 |
| Cl 128 | 05:25:40.6 | 41:41:53 | 167.059948 | 3.463957 | IRAS 052214139 | – | N | N | Y | – | 42 | 40 | 13 |
| Cl 129 | 05:31:28.0 | 36:43:01 | 171.835302 | 1.644529 | – | – | N | N | N | – | 23 | 30 | 9 |
| Cl 130 | 05:31:28.7 | 36:41:54 | 171.852162 | 1.636293 | – | – | N | N | N | – | 19 | 20 | 5 |
| Cl 131 | 06:33:27.2 | 12:03:31 | 200.166170 | 1.549008 | IRAS 063061205 | – | N | N | Y | – | 39 | 20 | 37 |
| Cl 132 | 06:38:36.6 | 01:07:20 | 210.469190 | 2.341123 | IRAS 063600109 | – | N | N | N | – | 16 | 15 | – |
| Cl 133 | 06:39:52.2 | 01:20:52 | 210.412543 | 1.957914 | IRAS 063720123 | – | N | N | N | – | 25 | 15 | 3 |
| Cl 134 | 07:22:30.8 | 13:05:26 | 228.099152 | 0.796587 | IRAS 072011259 | – | N | N | Y | – | 27 | 30 | 9 |
| Cl 135 | 19:44:23.5 | 25:48:42 | 61.720129 | 0.863272 | IRAS 194232541 | G061.720100.8630 | Y/N | N | Y | 13.99 | 14 | 20 | – |
| Cl 136 | 20:13:34.2 | 36:15:00 | 73.877590 | 1.024991 | IRAS 201163605 | G073.877501.0245 | Y/N | N | Y | 9.28 | 26 | 25 | – |
| Cl 137 | 20:16:27.4 | 36:54:54 | 74.752565 | 0.912439 | IRAS 201453645 | G074.754100.9132 | Y/N | N | Y | 9.29 | 14 | 15 | – |
| Cl 138 | 21:39:41.1 | 51:20:36 | 95.298227 | 0.937191 | IRAS 213795106 | – | N | Y | Y | – | 21 | 15 | 9 |
| Cl 139 | 21:44:03.1 | 55:12:11 | 98.320050 | 1.551357 | IRAS 214235458 | – | N | N | Y | – | 9 | 10 | – |
| Cl 140 | 21:49:40.5 | 55:24:50 | 99.069107 | 1.199380 | IRAS 214795510 | – | N | N | N | – | 30 | 15 | – |
| Cl 141 | 22:35:17.6 | 57:59:53 | 105.677118 | 0.238204 | IRAS 223335744 | – | N | N | Y | – | 29 | 15 | – |
| Unconfirmed Cluster Candidates | |||||||||||||
| Cl 142 | 04:04:13.4 | 51:22:59 | 150.660242 | 0.800726 | IRAS 040045114 | – | N | N | Y | – | – | – | – |
| Cl 143 | 18:38:16.1 | 05:29:33 | 27.419567 | 0.866342 | IRAS 183550532 | – | N | N | Y | – | – | – | – |
| Cl 144 | 19:22:07.8 | 14:29:20 | 49.288593 | 0.055411 | IRAS 191981423 | G049.298200.0582 | N | N | Y | 5.4 | – | – | – |
| Unclassified Candidate Object | |||||||||||||
| Cl 145 | 16:24:49.9 | 46:58:52 | 337.536565 | 3.038578 | – | – | N | N | N | – | – | – | – |
Appendix B Cluster Images
B.1 New Clusters
| MHO | Images | Comments |
|---|
B.2 New Cluster Candidates
| MHO | Images | Comments |
|---|
B.3 Known Cluster Candidates
| MHO | Images | Comments |
|---|
B.4 Unknown Object
| MHO | Images | Comments |
|---|