AstroSat/LAXPC detection of milli-second phenomena in 4U 1728-34
Abstract
The low mass X-ray binary 4U 1728-24 was observed with AstroSat/LAXPC on 8th March 2016. Data from a randomly chosen one orbit of over 3 ks was analyzed for detection of rapid intensity variations. We found that the source intensity was nearly steady but towards the end of the observation a typical Type-1 burst was detected. Dynamical power spectrum of the data in the 3-20 keV band, reveals presence of a kHz Quasi-Periodic Oscillation (QPO) whose frequency drifted from Hz at the beginning of the observation to about 850 Hz just before the burst. The QPO is also detected in the 10-20 keV band, which was not obtainable by earlier RXTE observations of this source. Even for such a short observation with a drifting QPO frequency, the time-lag between the 5–10 and 10–20 keV bands can be constrained to be less than 100 microseconds. The Type-1 burst that lasted for about 20 secs had a typical profile. blueDuring the first four seconds dynamic power spectra reveal a burst oscillation whose frequency increased from to Hz. This is consistent with the earlier results obtained with RXTE/PCA, showing the same spin frequency of the neutron star. The present results demonstrate the capability of LAXPC instrument for detecting millisecond variability even from short observations. After RXTE ceased operation, LAXPC on AstroSat is the only instrument at present with capability of detecting kHz QPOs and other kind of rapid variations from 3 keV to 20 keV and possibly at higher energies also.
Subject headings:
accretion, accretion discs — neutron star physics — X-rays: binaries — X-rays: individual: 4U 1728-341. Introduction
One of the most important and lasting legacy of the Rossi X-ray Timing Experiment (RXTE) has been the discovery and characterization of milli-second phenomena in X-ray binaries (e.g. van der Klis, 2000, 2006; Remillard & McClintock, 2006). These include the detection of kilo-Hertz Quasi-periodic Oscillations (QPO) and the coherent Burst Oscillation (BO) in the initial phase of Type-1 (or thermo-nuclear) bursts.
Since their discovery which occurred soon after the launch of RXTE, kHz QPOs have been the subject of extensive research and discussion. The high frequency of the variability, implies that the phenomena is linked to the behaviour of matter in the inner edge of the accretion disk close to the neutron star surface, and hence has the promise of revealing the behaviour of matter in the strong gravitational field limit. In several low mass X-ray binaries these QPOs have been observed in pairs and there have been several detailed studies of their occurrence and the relationship between the pairs of frequencies as well as with that of other low frequency QPOs (e.g. van Straaten et al., 2003; Altamirano et al., 2008; Méndez et al., 1998; Belloni et al., 2007). Attempts have been made to explain these relations with theoretically motivated models where one of the frequencies is identified as a Keplerian one and the other a result of complex interactions that may occur in such regions, such as beating of frequencies or resonances (e.g. Lamb, Miller & Psaltis, 1998; Stella & Vietri, 1999; Osherovich & Titarchuk, 1999). Despite these endeavours, it is perhaps fair to say that there is no consensus on which of these dynamical models represents the correct physical picture, and the underlying physical phenomena of kHz QPO remains an open question. While these studies have focused on understanding the dynamical origin of the kHz QPOs, there have been relatively less attempts on identifying the radiative processes by which the phenomena is manifested. The QPOs are known to occur at particular spectral states of the system and understanding the radiative components and specifically the spectral parameters that vary to produce the QPO, would enhance our understanding of their origin. This can be done by studying the fractional r.m.s and time lag as a function of photon energy (e.g. Berger et al., 1996; Méndez et al., 2001; Vaughan et al., 1997; Kaaret et al., 1999; Barret, 2013; de Avellar et al., 2013; Peille et al., 2015). The increase of r.m.s with energy and soft lags can be explained in the framework of a Comptonization model and such analysis can not only constrain the responsible radiative process but also provide estimates of the size and geometry of the region (Lee et al., 2001; Kumar & Misra, 2016).
It should be emphasized that a large fraction of the X-ray binaries are transient and the kHz QPOs are known to occur only during certain spectral states. Hence it is important to continuously monitor the X-ray sky for new X-ray binaries and to study the known ones to get new insights in to the phenomena. For example, oscillations observed on time-scales significantly smaller than mill-seconds, will revolutionize our understanding of the kHz QPOs. Thus, there is a critical need for instruments that have the capability of observing the high frequency variations in the post-RXTE era.
Unlike kHz QPOs, the frequency of the coherent oscillation observed during the initial burst decay phase of a Type-1 burst, is unambiguously related to the spin of the neutron star (e.g. Strohmayer et al., 1997; Chakrabarty et al., 2003). During the initial period of a Type I burst, it is believed that uneven nuclear burning of material accreted on the surface of the neutron star, is the cause of the observed coherent burst oscillations, although the exact mechanism is not clear (e.g. Strohmayer & Markwardt, 1999; Muno et al., 2004; Chakraborty & Bhattacharyya, 2014). Indeed, for low mass X-ray binaries, our knowledge of the spin period of the neutron star is solely derived from the burst oscillations. Thus, for new X-ray transients, it is important to have the capability to measure the BO and hence infer the spin period of the neutron star. The Type I bursts and the rapid oscillations are by themselves an interesting phenomenon, providing rich information about the nuclear burning process and other several not well understood features like why the oscillations persists for as long as 5-10 s. Broad band observations of these bursts and energy dependent time-lags will provide crucial information to probe these processes deeper.
With an effective area similar to that of RXTE at low keV and significantly larger at higher energies ( keV), the Large Area X-ray Proportional Counter (LAXPC) (Yadav et al., 2016a; Antia et al., 2017) on board the Indian X-ray mission, AstroSat (Agrawal, 2006; Singh et al., 2014), is expected to detect and discover milli-second variability in X-ray binaries, leading to significant enhancement of our understanding of the phenomena. Moreover, the other instruments on board AstroSat will provide wide band coverage from UV to hard X-rays. LAXPC data of black hole systems GRS1915+105 and Cygnus X-1 have already demonstrated the capability of LAXPC to study variability of high energy photons (Yadav et al., 2016; Misra et al., 2017).
4U 1728-34 (GX 354-0) is a well studied atoll type low mass X-ray binary for which RXTE has detected kHz QPOs during several occasions (e.g. Migliari et al., 2003; Strohmayer et al., 1996; Mukherjee & Bhattacharyya, 2012). The frequency of the lower kHz QPO covers a wide range from 300 to 1100 Hz. The source exhibits frequent Type-1 bursts for which burst oscillations have been detected at Hz (Strohmayer et al., 1997) and extensively studied (van Straaten et al., 2001; Muno et al., 2001, 2004; Zhang et al., 2016). Here we report the first detection of both kHz QPO and the burst oscillation for a short ksec observation of 4U 1728-34 by AstroSat/LAXPC. The kHz QPO is detected in energies keV which RXTE was not able to do (Mukherjee & Bhattacharyya, 2012), thereby convincingly demonstrating its superior capability to detect milli-second variability.
2. Detection of kHz QPO
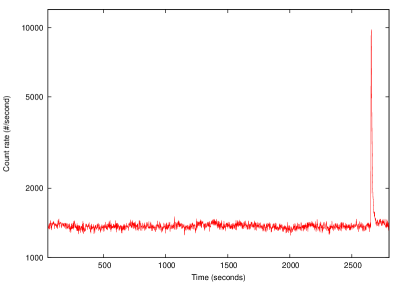

The 1 second binned light curve generated using data from AstroSat orbit number 2398 during March 8th 2016 is shown in Figure 1. 4U 1728-34 was detected at a level of c/s and near the end of the observation there was a Type 1 burst where the flux reached c/s at the peak.
Figure 2 shows the photon spectrum from one of the LAXPC units (namely LAXPC 10) for the first secs of data. The response matrix and the background were obtained using software which would be part of the standard LAXPC pipeline and as described in Yadav et al. (2016a); Antia et al. (2017) and a systematic uncertainty of 1% was included in the spectral fitting. The data can be reasonably modelled (/dof = 92.3/104) by an absorbed thermal Comptonization component (“Tbabs*nthcomp” in Xspec) with photon index and temperature keV and a column density of cm-2. A weak but broad Iron line is required for the fit. Figure 2 also shows the expected background spectrum and we note that it does not dominate till keV. Given the spectral resolution and uncertainty in the response, the spectral shape of the source is as expected and we concentrate now on the rapid timing behaviour which is the focus of the present work.
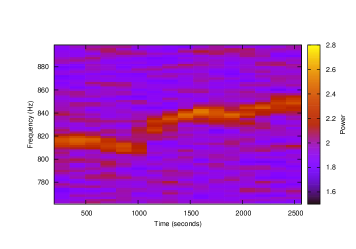
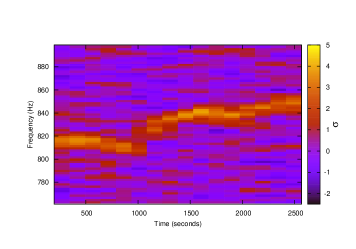
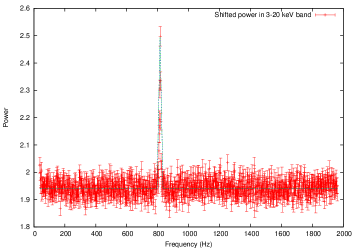
The power spectrum for the first 2500 secs showed evidence for features around Hz which suggested the presence of a drifting kHz QPO. This was confirmed using dynamic power spectra analysis; the results of which are shown in top panel of Figure 3. The dynamic power spectra were created by splitting the 3-20 keV light curve into 16 parts of 147.97 seconds each. Each part was then divided into 289 segments of 0.512 seconds. The power spectra have been normalized such that the Poisson level, is at 2 i.e. they are “Leahy” normalized (Leahy et al., 1983). The 40 microsecond dead-time of the instrument reduces the noise level slightly to . Power spectra were created for each of the 289 segments and averaged. Hence, the error on the power at each frequency, is or 5.9 %. The middle panel of Figure 3 shows the significance for the detections. The Figures clearly reveal a significant QPO whose frequency drifts from from Hz at the beginning of the observation to towards the end. To explore the possibility of any other QPO in the data, we used the standard shift and add technique where the power spectrum for each part is shifted such that the QPO frequencies becomes aligned and then averaged (Méndez et al., 1998; Mukherjee & Bhattacharyya, 2012). The resultant power spectrum is shown in the bottom panel of Figure 3 which shows no other QPO like features.
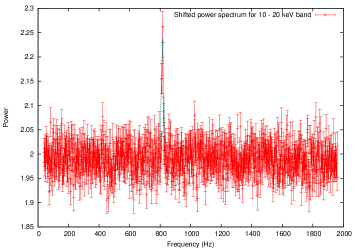
We test whether the kHz QPO is also detected at high energies (), especially since earlier RXTE analysis of the source was unable to do so (Mukherjee & Bhattacharyya, 2012). Power spectra were computed in the 10-20 keV band and following Mukherjee & Bhattacharyya (2012), the spectra for each part were shifted in frequency using the QPO detected in the 3-20 keV spectra as the reference. The avareged spectrum is shown in the top panel of Figure 4 and the khz QPO is clearly detected in the high energy band. Fitting the power spectrum with a Gaussian and a constant component gives /dof while only a constant component gives or a for 2 additional degrees of freedom.
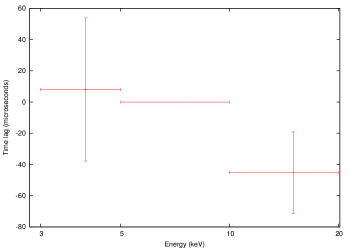
One does not expect to obtain tight constrains on energy dependent time-lag from such a short duration data, especially when the frequency of the QPO is drifting. Nevertheless, the detection of the QPO in high energy bands allows the computation of energy dependent time-lags as shown in Figure 4. The time-lag was computed from the shift and added averged cross-spectra as described for the power spectra above and its error was estimated using the method described in Nowak et al. (1999). Since the length of each segment is 0.512 secs, the frequency resultion of the cross-spectra is Hz. We have verified that changing this resolution to or Hz does not change the results obtained. The time-lag is constrained to be less than 100 microseconds which indicates the capabilities of the LAXPC to undertake such analysis with larger or better quality observations.
3. Detection of Burst Oscillations
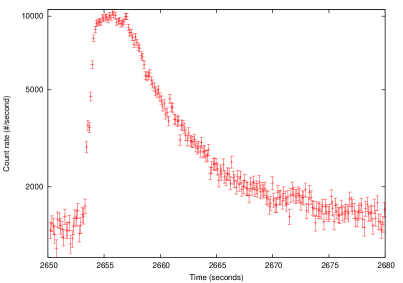
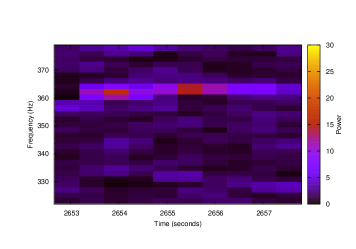
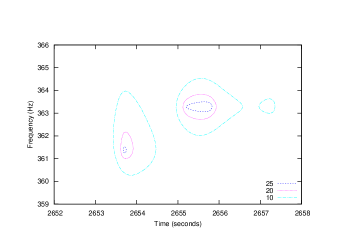
Figure 5 shows the lightcurve of the Type-1 burst at a finer time resolution of 0.128 seconds. The burst profile is typical with a fast rise and slower decay lasting for about 20 seconds. Since burst oscillations are often detected in the early phase of the burst, we looked for high frequency signatures in the first 5 seconds of the burst by computing the dynamic power spectra. The first 5.12 seconds of the burst was divided into 10 parts and the power spectra were computed for each of them to get the dynamic power spectra as shown in the top panel of Figure 6. A coherent feature is observed at 362 Hz which is referred to as the Burst Oscillation. The power spectra are “Leahy” normalized and each one is computed from one segment. Thus the null hypothesis probability that a power as high as observed is obtained by chance is (e.g. Vaughan et al., 1994), where is the number of independent frequencies being considered. Since we were searching for oscillations Hz at a frequency resolution of Hz, we chose . The maximum value of is , which implies a null hypothesis probability of . Thus the oscillation is detected at a high level of significance. The bottom panel of Figure 6 shows a more close up view of the Dynamic power spectra represented by a contour map. The Burst Oscillation frequencies increases from to Hz which has been reported earlier using RXTE for this and other sources (e.g. Watts, 2012, and references therein).
4. Discussion
We have presented here the first detection of both kinds of milli-second variability i.e kHz QPOs and Burst Oscillation in the LMXB 4U 1728-34 with AstroSat/LAXPC from a single ksec observation. This result demonstrates that the LAXPC instrument has the necessary sensitivity and time resolution to detect and study millisecond timing phenomenon in 3–20 keV and possibly at higher energy also.
With RXTE, there have been relatively few studies of the high frequency QPOs at energy 20 keV mainly due to rapid decline in the effective of PCA at higher energies. In fact, detailed energy dependence of both the fractional r.m.s and time lag for kHz QPO have been possible for only one or two orbits of RXTE observations i.e. the March 3rd 1996 observation of 4U 1608-52 (Berger et al., 1996; Vaughan et al., 1997) and February 24 1998 and April 27 1996 observations of 4U 1636-53 (Zhang et al., 1996; Kaaret et al., 1999). Barret (2013), de Avellar et al. (2013) and Peille et al. (2015) had to combine a large number of RXTE observations to obtain average energy dependent r.m.s and time-lag for different QPO frequency ranges. During its latter stage, RXTE observations were undertaken with only one or two of its five PCUs, hence making significant detections in short observations harder. For example, for the source analyzed in this work, 4U 1728-34, the QPO was not detected in the 10-20 keV band even when 85 ksec were analyzed (Mukherjee & Bhattacharyya, 2012). In contrast, the 3 ksec LAXPC data detected the QPO in the band as shown in the dynamic power spectrum (Figure 3). Thus AstroSat/LAXPC has now proven potential to study the energy dependence of kHz QPO. A critical advantage will be obtained by the simultaneous observations from other instruments on board AstroSat, especially the Soft X-ray Telescope (SXT). The broad band coverage will measure more accurately the time-averaged radiative components of the system thereby having significantly more constrains. For example, using RXTE observations the spectral modelling was degenerate leading to ambiguities regarding the size and geometry of the source as inferred from the energy dependent properties of the kHz QPO (Kumar & Misra, 2016). The SXT spectra in the 0.3–8 keV band will lift this degeneracy allowing one to test different models and to obtain interesting physical constraints such as size and geometry of the source.
Confirmation of the 363 Hz burst oscillation of the source brings out the potential of LAXPC to detect the phenomena and in general to enhance our understanding of Type-1 bursts. AstroSat will also enable the broad band study of the spectral evolution of the burst using LAXPC and SXT. Of particular interest could be the measurement of time delays between the X-rays and the UV emission as detected by the Ultra-Violet Imaging Telescope (UVIT). These delays correspond to the light crossing time to the outer disk and provide constrains on the disk geometry (e.g. Hynes et al., 2006).
We defer detailed analysis and interpretation of the data to later works where the properties of the kHz QPO and Burst Oscillations will be studied separately. Our first look results show with confidence that the RXTE legacy of studying milli-second variability of X-ray binaries will be effectively carried forward by AstroSat and one can look forward to new exciting discoveries in the near future.
5. Acknowledgments
We acknowledge the strong support from Indian Space Research Organization (ISRO) in various aspect of instrument building, testing, software development and mission operation during payload verification phase. We acknowledge support of the scientific and technical staff of the LAXPC team as well as staff of the TIFR Workshop in the development and testing of the LAXPC instrument.
References
- Agrawal (2006) Agrawal, P. C., 2006, AdSpR, 38, 2989
- Antia et al. (2017) Antia, H. M., Yadav, J. S., Agrawal, P. C., et al. 2017, arXiv:1702.08624
- Altamirano et al. (2008) Altamirano, D., van der Klis, M., Méndez, M., et al. 2008, ApJ, 685, 436-450
- Belloni et al. (2007) Belloni, T., Méndez, M., & Homan, J. 2007, MNRAS, 376, 1133
- Berger et al. (1996) Berger, M., van der Klis, M., van Paradijs, J., et al. 1996, ApJ, 469, L13
- Barret (2013) Barret, D. 2013, ApJ, 770, 9
- Chakrabarty et al. (2003) Chakrabarty, D., Morgan, E. H., Muno, M. P., et al. 2003, Nature, 424, 42
- Chakraborty & Bhattacharyya (2014) Chakraborty, M., & Bhattacharyya, S. 2014, ApJ, 792, 4
- de Avellar et al. (2013) de Avellar, M. G. B., Méndez, M., Sanna, A., & Horvath, J. E. 2013, MNRAS, 433, 3453
- Hynes et al. (2006) Hynes, R. I., Horne, K., O’Brien, K., et al. 2006, ApJ, 648, 1156
- Kaaret et al. (1999) Kaaret, P., Piraino, S., Ford, E. C., & Santangelo, A. 1999, ApJ, 514, L31
- Kumar & Misra (2016) Kumar, N., & Misra, R. 2016, MNRAS, 461, 2580
- Lamb, Miller & Psaltis (1998) Lamb, F.K., Miller, M.C., Psaltis, D., 1998, Nuclear Physics B, 69/1-3, 113
- Leahy et al. (1983) Leahy, D. A., Elsner, R. F., & Weisskopf, M. C. 1983, ApJ, 272, 256
- Lee et al. (2001) Lee, H. C., Misra, R., & Taam, R. E. 2001, ApJ, 549, L229
- Méndez et al. (1998) Méndez, M., van der Klis, M., van Paradijs, J., et al. 1998, ApJ, 494, L65
- Méndez et al. (1998) Méndez, M., van der Klis, M., Wijnands, R., et al. 1998, ApJ, 505, L23
- Méndez et al. (2001) Méndez, M., van der Klis, M., & Ford, E. C. 2001, ApJ, 561, 1016
- Migliari et al. (2003) Migliari, S., van der Klis, M., & Fender, R. P. 2003, MNRAS, 345, L35
- Misra et al. (2017) Misra, R., Yadav, J. S., Verdhan Chauhan, J., et al. 2017, ApJ, 835, 195
- Mukherjee & Bhattacharyya (2012) Mukherjee, A., & Bhattacharyya, S. 2012, ApJ, 756, 55
- Muno et al. (2001) Muno, M. P., Chakrabarty, D., Galloway, D. K., & Savov, P. 2001, ApJ, 553, L157
- Muno et al. (2004) Muno, M. P., Galloway, D. K., & Chakrabarty, D. 2004, ApJ, 608, 930
- Nowak et al. (1999) Nowak, M. A., Vaughan, B. A., Wilms, J., Dove, J. B., & Begelman, M. C. 1999, ApJ, 510, 874
- Osherovich & Titarchuk (1999) Osherovich, V., & Titarchuk, L. 1999, ApJ, 522, L113
- Peille et al. (2015) Peille, P., Barret, D., & Uttley, P. 2015, ApJ, 811, 109
- Remillard & McClintock (2006) Remillard, R. A., & McClintock, J. E. 2006, ARA&A, 44, 49
- Singh et al. (2014) Singh, Kulinder Pal, Tandon, S. N., Agrawal, P. C., Antia, H. M., Manchanda, R. K., Yadav, J. S. et al. 2014, SPIE, 9144, 1
- Stella & Vietri (1999) Stella, L., & Vietri, M. 1999, Physical Review Letters, 82, 17
- Strohmayer et al. (1996) Strohmayer, T. E., Zhang, W., Swank, J. H., et al. 1996, ApJ, 469, L9
- Strohmayer et al. (1997) Strohmayer, T. E., Zhang, W., & Swank, J. H. 1997, ApJ, 487, L77
- Strohmayer & Markwardt (1999) Strohmayer, T. E., & Markwardt, C. B. 1999, ApJ, 516, L81
- van der Klis (2000) van der Klis, M. 2000, ARA&A, 38, 717
- van der Klis (2006) van der Klis, M. 2006, Advances in Space Research, 38, 2675
- van Straaten et al. (2003) van Straaten, S., van der Klis, M., & Méndez, M. 2003, ApJ, 596, 1155
- van Straaten et al. (2001) van Straaten, S., van der Klis, M., Kuulkers, E., & Méndez, M. 2001, ApJ, 551, 907
- Vaughan et al. (1994) Vaughan, B. A., van der Klis, M., Wood, K. S., et al. 1994, ApJ, 435, 362
- Vaughan et al. (1997) Vaughan, B. A., van der Klis, M., Méndez, M., et al. 1997, ApJ, 483, L115
- Watts (2012) Watts, A. L. 2012, ARA&A, 50, 609
- Yadav et al. (2016a) Yadav, J. S., Agrawal, P. C., Antia, H. M., Jai Verdhan Chauhan, Dhiraj Dedhia, Tilak Katoch, P. Madhwani, Manchanda, R. K., Ranjeev Misra, Mayukh Pahari, Paul, B., Shah, P., 2016a, SPIE, 9905, 1
- Yadav et al. (2016) Yadav, J. S., Misra, R., Verdhan Chauhan, J., et al. 2016, ApJ, 833, 27
- Zhang et al. (1996) Zhang, W., Lapidus, I., White, N. E., & Titarchuk, L. 1996, ApJ, 469, L17
- Zhang et al. (2016) Zhang, G., Méndez, M., Zamfir, M., & Cumming, A. 2016, MNRAS, 455, 2004