Ab initio molecular dynamics study of the structural and electronic transition in VO2
Dušan Plašienka⋆ and Roman Martoňák
⋆ plasienka@fmph.uniba.sk
Department of Experimental Physics, Comenius University in Bratislava, Bratislava, Slovakia
Marcus C. Newton
Department of Physics & Astronomy, University of Southampton, Southampton, UK
Abstract: The temperature-induced structural and electronic transformation in VO2 between the monoclinic M1 and tetragonal rutile phases was studied by means of ab initio molecular dynamics (MD), based on density functional theory with Hubbard correction (DFT+U). Analysis of the dynamical processes associated with the structural transformation was carried out on the atomic scale by following the time evolution of dimerization amplitudes of vanadium atom chains and the twisting angle of vanadium dimers. The electronic transition was studied by tracing the changes in projected densities of states and their correlation with the evolution of the structural transformation. Our results reveal a strong interconnection between the structural and electronic transformations and show that they take place on the same time scale.
I Introduction
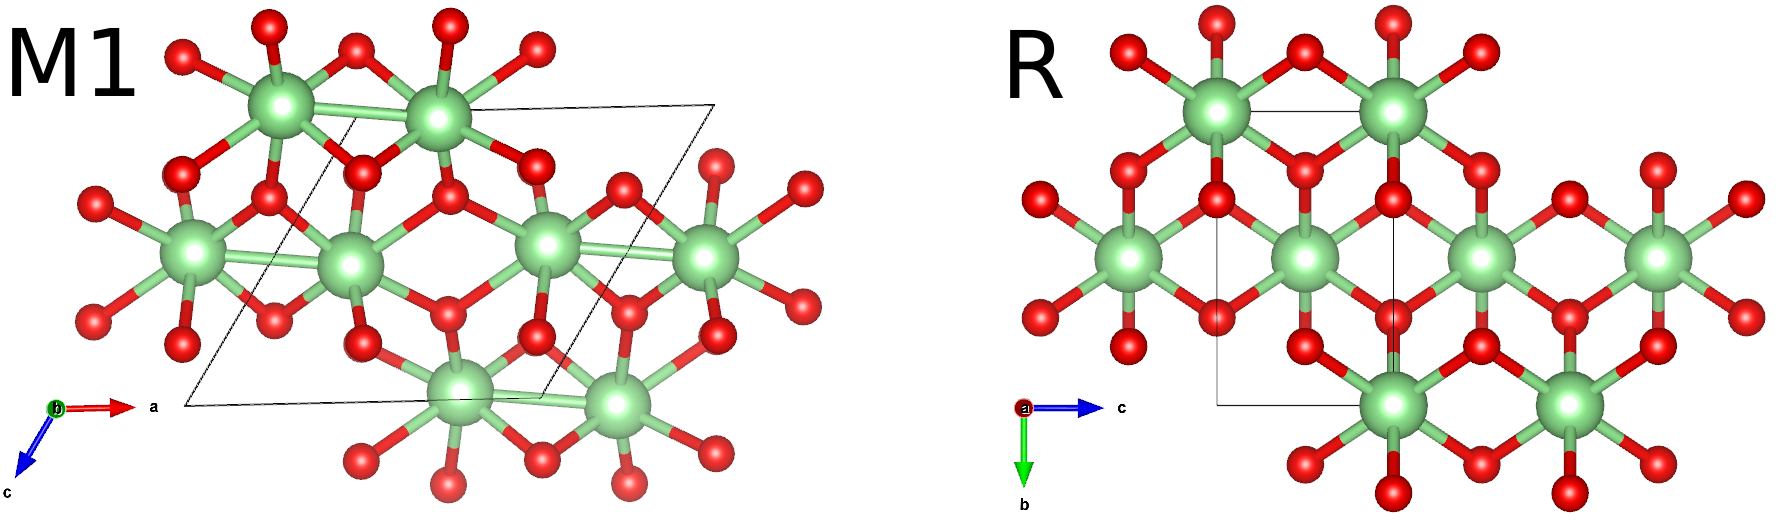
Vanadium dioxide VO2 is a material of long standing interest and is one of the most studied transition metal oxides Morin (1959); Eyert (2002); Imada et al. (1998); Wegkamp and Stähler (2015). At temperature of 340 K it exhibits a temperature-driven structural transition between low-temperature semiconducting non-magnetic monoclinic phase (M1) and high-temperature metallic paramagnetic tetragonal rutile phase (R). The M1 phase has an optical gap of 0.6 eV. The insulator-metal transition is accompanied by dramatic change of resistivity spanning over four orders of magnitude. The transition is first order and structurally represents a displacive transition. In both M1 and R phases the V atoms are arranged in 1D chains. While in the R phase all V atoms are equidistant, in the M1 phase they dimerize creating long bonds of length 3.18 Å and short bonds of length 2.54 Å- Fig. 1. The dimerization is accompanied also by zig-zag deformation of chains and doubling of the unit cell in the chain direction. Other phases are also known, most notably another monoclinic phase M2 Park et al. (2013); Eyert (2011) where only half of the chain is dimerized. This phase can be stabilized by doping or uniaxial stress but will not be addressed in the present study.
While the transition in VO2 is obviously of high interest for fundamental reasons, recently it has been speculated that it might potentially also be of practical use in electronic switching and memristive devices Kim et al. (2010); Yang et al. (2011); Driscoll et al. (2009); Kats et al. (2013). The theoretical understanding of the transition, however, is still incomplete and represents a puzzle despite a large number of works. The main problem that was extensively studied is the very origin of the insulating properties of the M1 phase. In this respect there are mainly two approaches. The first one interprets the transition within the standard band structure picture as being related to Peierls-type instability of the parent rutile phase. The work by Goodenough Goodenough (1971); Eyert (2002) suggested that the dimerization causes a splitting of the band while the zig-zag transversal displacements of V atoms cause a shift of the and bands. Both processes eventually result in creation of the band gap. The other direction attributes the metal-insulator transition upon cooling to strong correlations of d-electrons in V atoms resulting in the Mott insulator Zylbersztejn and Mott (1975). Since the structural and electronic transitions appear to occur at the same time, it raises the ”chicken and egg” question which of the two transitions is the primary one. Both these questions and the role of the electronic correlations are still open and actively discussed in the literature Wegkamp and Stähler (2015); Cavalleri et al. (2005); Biermann et al. (2005); Baum et al. (2007); Cocker et al. (2012); Gray et al. (2016); Pashkin et al. (2011); Morrison et al. (2014); Wegkamp et al. (2014); Cocker et al. (2012); Laad et al. (2006); Koethe et al. (2006); Zhu and Schwingenschlögl (2012); Gatti et al. (2007); Tomczak et al. (2008); Sakuma et al. (2008); Lazarovits et al. (2010); Wentzcovitch et al. (1994); Yao et al. (2010); Eyert (2011); Brito et al. (2016); Zheng and Wagner (2015); Newton et al. (2014); Belozerov et al. (2012); Weber et al. (2012); Kim et al. (2013); Wall et al. (2012, 2013).
Many studies were devoted to the possibilities of the description of the M1 and R phases by density functional theory (DFT), employing various kinds of approximate functionals. The study in Ref. Wentzcovitch et al. (1994) showed that within the LDA approximation both phases are correctly obtained as local minima of the Kohn-Sham energy. The M1 phase, however, resulted to be semi-metallic rather than insulating. Since both LDA and GGA approximations are known to underestimate the band gap, in Refs. Budai et al. (2014); Kim et al. (2013) the DFT+U approach Anisimov et al. (1991); Liechtenstein et al. (1995) was employed with parameters U=4.2 eV and J=0.8 eV. For static calculations, it was found that this choice provides a satisfactory description of both M1 and R structures as well as a reasonable value of 0.6 eV for the band gap.
Considerably less attention was devoted to thermodynamical and dynamical aspects of the transition. Most studies focus on the ideal M1 and R phases at zero temperature and disregard the thermal fluctuations. It is known, however, since long time that the R phase has large value of the Debye-Waller factor which points to strong fluctuations of atomic positions Gervais and Kress (1985); Budai et al. (2014); McWhan et al. (1974). A recent study Budai et al. (2014) analyzed the phonon density of states in both phases, both experimentally and theoretically and concluded that the rutile phase is stabilized by entropy gain due to phonon softening in the metallic phase.
To our knowledge, so far there was no attempt to directly simulate the phase transition by means of ab initio molecular dynamics. Our work attempts to fill this gap in the literature by providing a detailed picture of the evolution of atomic and electronic structure across the thermally induced transition.
II Methods
We simulated a fairly large system composed of 768 atoms by ab initio MD in the NPT ensemble using the VASP code Kresse and Furthmüller (1996a, b); Kresse and Hafner (1993); Kresse and Joubert (1999). In order to describe the system we chose to work within the PBE+U functional. This approximate functional appears as reasonable compromise between accuracy and computational cost. We found, however, that in order to get as close as possible to experimental conditions it is useful to modify the values of U and J. As noted in Ref. Budai et al. (2014) these values aside from the band gap affect also the energy difference between the M1 and R phases and therefore can be expected to directly influence also the transition temperature. For our purpose the most suitable values were found to be U=3.15 eV and J=0.6 eV. Further details about the simulation procedure and choice of U, J can be found in Suppl. Mat.
III Results
III.1 M1-R transition - atomic structure
In order to monitor the evolution of the system across the transition we focus on two structural quantities - dimerization amplitudes (DA) and the zig-zag displacement (tilting of V-V dimers). Definitions of these two structural parameters are provided in Suppl. Mat. We start with the transition induced by heating the M1 phase. At K we observed that the system attempts transitions from M1 to R phase but within 18 ps of the simulation time the monoclinic phase persisted. The evolution of dimerization amplitudes at this temperature is provided in Fig. S3. It is quite possible that if we could wait a longer time the system could eventually transform from M1 to R. However, such a test would be prohibitively CPU time expensive. Increasing temperature to 450 K allowed the structural transition from M1 to R to complete within the reasonable CPU time of a few ps.
|
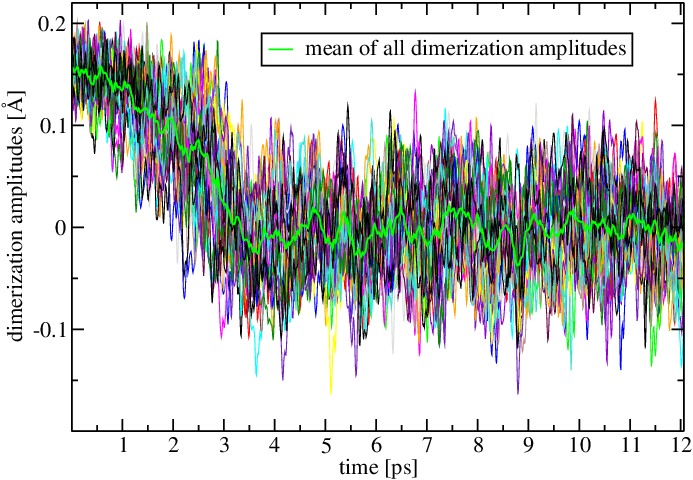
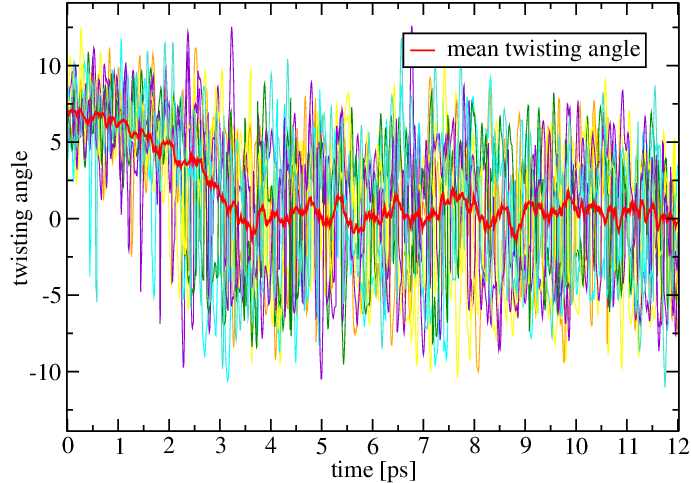
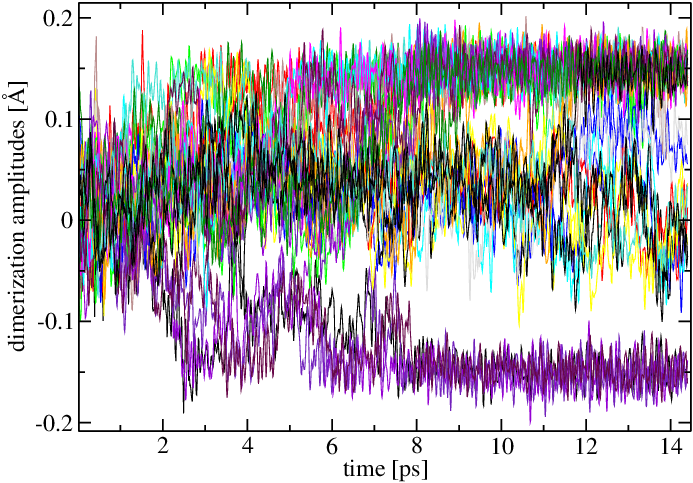
Fig. 2 shows the evolution of DA and twisting angle across the transition. The decrease of DA from 0.15 Å to 0 proceeds simultaneously with the adaptation of the twisting angle from 7 to 0 Yao et al. (2010). This indicates no separation between dimerization and tilting processes during the transition. After the transition to R, fluctuations of individual DA are considerably larger than in M1, which is directly related to the large fluctuations of V atoms (see Suppl. Mat. for more details).
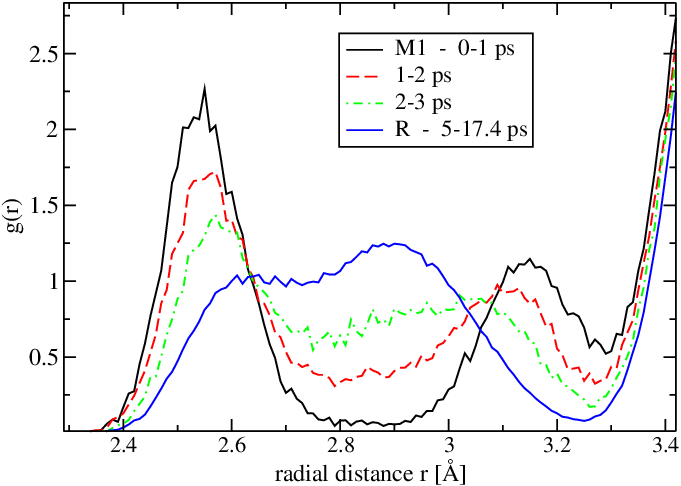
Alongside with the evolution of DA and twisting angle, the evolution of the M1-R transformation can be represented by plotting V-V radial distribution functions (RDFs) from several short time intervals during the transformation. In Fig. 3, there are four curves showing V-V RDFs calculated from different time intervals - before the onset of the transition in the M1 phase, during the transition and after it in the R phase. The M1 V-V RDF is characterized by relatively sharp two first peaks that upon transition merge into a broad peak where the presence of two peaks is still visible. This shows that the fluctuations of V atoms in the R phase above the transition are substantial.
III.2 M1-R transition - electronic structure
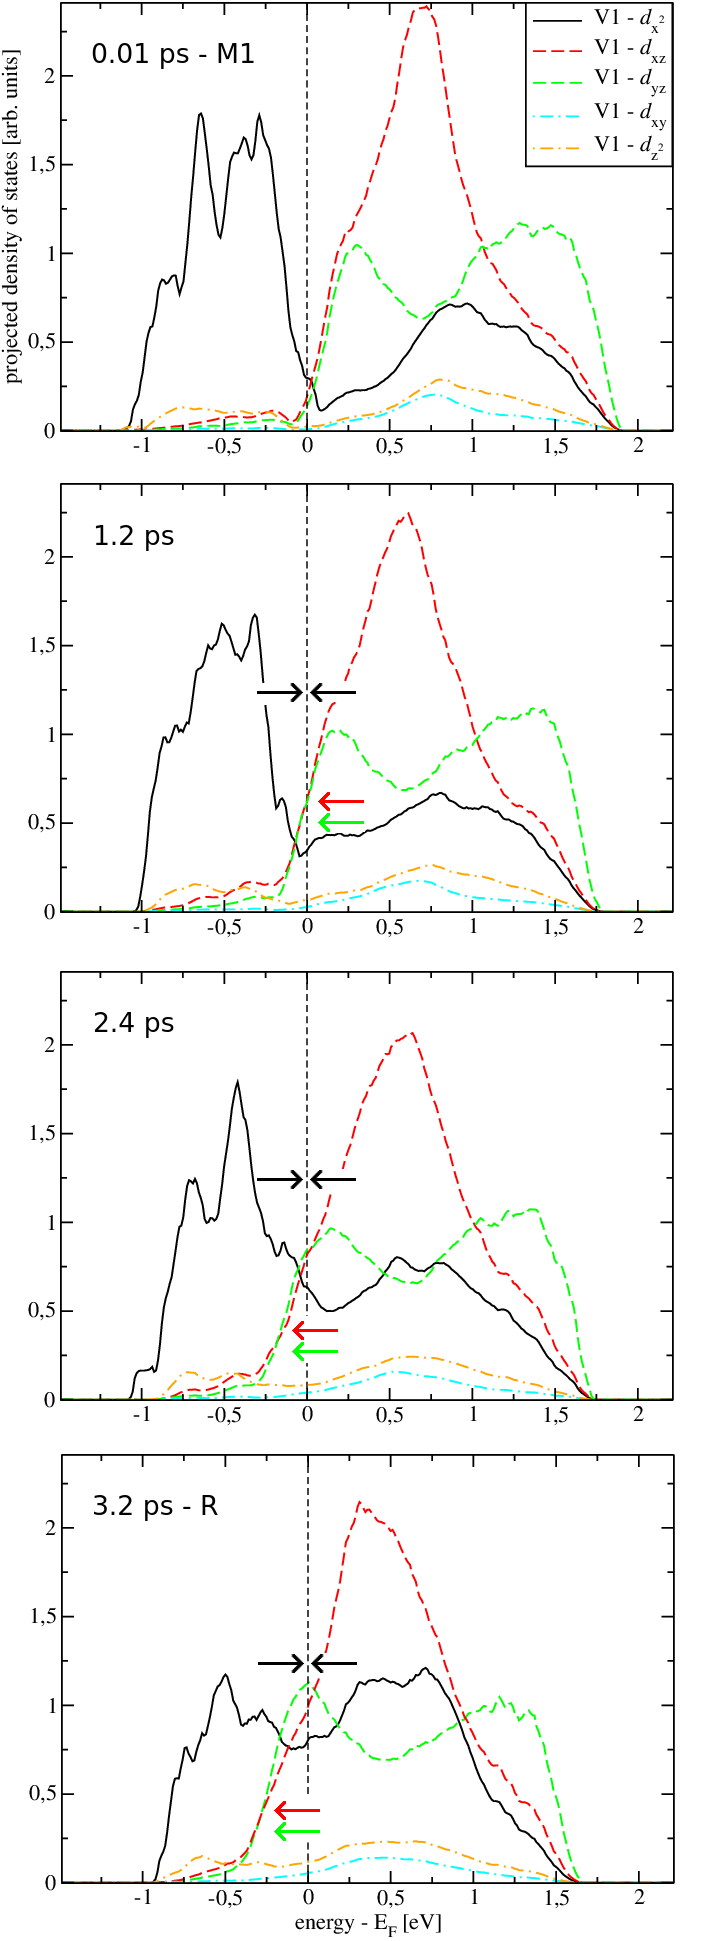
A standard band structure picture provides a description of M1 band gap as a mutual effect of V-V dimerization, which causes splitting of V- states and zig-zag displacement of dimers (tilting) that leads to energetic upshift of V- and states, in the local geometry of V1 atoms Eyert (2002, 2011); Goodenough (1971); Biermann et al. (2005); Lazarovits et al. (2010); Brito et al. (2016); Gray et al. (2016). The Peierls-like instability hence, in standard notation, applies to states in an embedded background of states.
The time evolution of projected electronic densities of states (peDOS) during the M1 to R phase transition that occurred in the simulations at 450 K is shown in Fig. 4. We note that within the applied PBE+U scheme the band gap drops to nearly zero value even before the transition, effectively turning the M1 phase, semiconducting at , into semimetal. The principal change in peDOS applies for states that, after being split in dimerized M1 (0.01 ps), become merged after the transition into R (3.2 ps). At the same time, disappearance of tilting brings energy of states below the Fermi level E and the states become partially occupied. The V1- and -derived states, which participate in V-O bonds, do not change upon the transition much.
The correlation between electronic and atomic structure (Fig. 4 and Fig. 2, respectively) indicates that these two aspects of M1-R transformation are closely related and we did not observe any evidence of separation between electronic and structural transition. Also, the two different types of atomic motion - loss of dimerization and loss of tilting, that are directly reflected in anti-splitting and energy lowering, respectively, proceed mutually as well, as one could already conclude from Fig. 2.
III.3 R-M1 transition
After obtaining the R phase, we also tried to decrease the temperature in order to study the symmetry-breaking process of the reverse R to M1 transition. We found that cooling rate (which is adjustable in NPT simulation) crucially influences the final product of dimerization process. If fast quenching was applied (temperature dropped by 100 K in 2 ps), a dimerized form with randomly distributed V-V dimers was created. On the other hand, if considerably slower cooling rate was applied (decrease by 100 K lasted for over 15 ps), a much more organized state was obtained - Fig. 5. In this state, most of the individual chains emerged properly, but their overall arrangement was not regular as is in the M1 phase.
The failure of V-V dimers to organize on a long-range scale may be attributed to the limited simulation time that is accessible in first-principles dynamical studies. The system upon cooling dimerizes in order to decrease its energy, but follows a randomly chosen pathway on the energy landscape, which usually leads into a metastable local minimum (corresponding to dimerized, but not fully-organized crystalline state). The system afterwards remains trapped in this state and reaching the global minimum requires a longer time scale. This might be partially avoided by using very slow thermal equilibration enabling system to explore a larger region of the configuration space, in analogy to the phenomenon of glass formation via rapid melt quenching, where disordered system is formed from the liquid upon fast quenching, while at lower cooling rates a regular crystal can be obtained instead.
III.4 coherent X-ray diffraction comparison
It is useful to contrast ab initio calculations with complementary ultra-fast pump-probe coherent X-ray diffraction experiments that provide access to femto-second time-resolution and angstrom spatial resolution. Such experiments have become feasible with the recent advent of 4th generation X-ray free electron laser (XFEL) synchrotron facilities such as the European XFEL. The spatially varying far-field scattering amplitude distribution is proportional to the exponentiated phase associated with scattering from each atom in the supercell. Monitoring changes in the simulated scattering angle and intensity from the speckle pattern provides direct comparison of theory with experiment (see Suppl. Mat.).
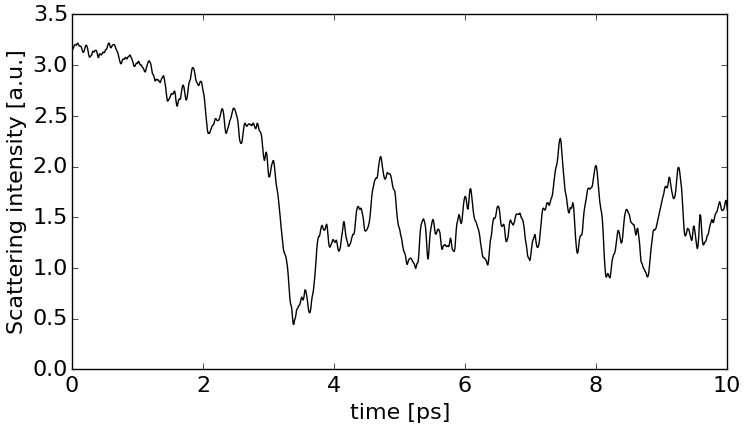
Fig. 6 shows the intensity of the resulting speckle patterns’ centroid plotted as a function of . As the total intensity of the speckle pattern is dependent on the amplitude of the complex object, only the relative value of the diffraction patterns’ intensity is meaningful in the simulations. A characteristic dip lasting for 400 fs is observed immediately before the rutile phase begins at ca. 3.5 ps, which corresponds nicely with the onset of dimerization (Fig. 2). This is also observed experimentally (See Newton et al., Ref. Newton et al. (2014)) and can be attributed to destructive interference due to disordering at the onset of the structural transition. The intensity dip is also understood from the perspective of fundamental Fourier optics where it can be shown that a phase object imaged with a limited transfer function produces sharp reduction in scattering intensity precisely at the location of the phase change. Goodman (1995)
IV Conclusions
In summary, we studied the structural and electronic transition in VO2 by means of ab initio molecular dynamics in variable-cell approach. Within the employed PBE+U description, the temperature-induced transition from M1 to R phase was observed at the transition temperature of 450 K. We found that dimerization and tilting of octahedra evolve at the same time scale and electronic and structural changes occur concurrently, as revealed by detailed microscopic analysis of structural and electronic transformations. The reverse process of dimerization upon cooling the rutile phase was found, however, to be critically contingent upon the rate of cooling. Moreover, we find that the high-temperature rutile phase is characterized by large fluctuations of positions of V atoms, in good agreement with the large value of the Debye-Waller factor known from experiment.
V acknowledgments
This work was supported by the Slovak Research and Development Agency under Contract APVV-15-0496 and VEGA project No. 1/0904/15 and by the project implementation 26220220004 within the Research & Development Operational Programme funded by the ERDF. This work is funded in part by Royal Society Research Grant RG/130498. The authors acknowledge the use of the IRIDIS High Performance Computing Facility, and associated support services at the University of Southampton, in the completion of this work. Part of the calculations were also performed in the Computing Centre of the Slovak Academy of Sciences using the supercomputing infrastructure acquired in project ITMS 26230120002 and 26210120002 (Slovak infrastructure for high-performance computing) supported by the Research & Development Operational Programme funded by the ERDF.
References
- Morin (1959) F. J. Morin, Phys. Rev. Lett. 3, 34 (1959).
- Eyert (2002) V. Eyert, Ann. Phys. (Leipzig) 11, 650 (2002).
- Imada et al. (1998) M. Imada, A. Fujimori, and Y. Tokura, Rev. Mod. Phys. 70, 1039 (1998).
- Wegkamp and Stähler (2015) D. Wegkamp and J. Stähler, Prog. Surf. Sci. 90, 464 (2015).
- Park et al. (2013) J. H. Park, J. M. Coy, T. S. Kasirga, C. Huang, Z. Fei, S. Hunter, and D. H. Cobden, Nature 500, 431 (2013).
- Eyert (2011) V. Eyert, Phys. Rev. Lett. 107, 016401 (2011).
- Kim et al. (2010) J. Kim, C. Ko, A. Frenzel, S. Ramanathan, and J. E. Hoffman, Appl. Phys. Lett. 96, 213106 (2010).
- Yang et al. (2011) Z. Yang, C. Ko, and S. Ramanathan, Annu. Rev. Mater. Res. 41, 337 (2011).
- Driscoll et al. (2009) T. Driscoll, H.-T. Kim, B.-G. Chae, M. D. Ventra, and D. N. Basov, Appl. Phys. Lett. 95, 043503 (2009).
- Kats et al. (2013) M. A. Kats, R. Blanchard, S. Zhang, P. Genevet, C. Ko, S. Ramanathan, and F. Capasso, Phys. Rev. X 3, 041004 (2013).
- Goodenough (1971) J. B. Goodenough, J. Solid Stat. Chem. 3, 490 (1971).
- Zylbersztejn and Mott (1975) A. Zylbersztejn and N. F. Mott, Phys. Rev. B 11, 4383 (1975).
- Cavalleri et al. (2005) A. Cavalleri, M. Rini, H. H. W. Chong, S. Fourmaux, T. E. Glover, P. A. Heimann, J. C. Kieffer, and R. W. Schoenlein, Phys. Rev. Lett. 95, 067405 (2005).
- Biermann et al. (2005) S. Biermann, A. Poteryaev, A. I. Lichtenstein, and A. Georges, Phys. Rev. Lett. 94, 026404 (2005).
- Baum et al. (2007) P. Baum, D.-S. Yang, and A. H. Zewail, Science 318, 788 (2007).
- Cocker et al. (2012) T. L. Cocker, L. V. Titova, S. Fourmaux, G. Holloway, H.-C. Bandulet, D. Brassard, J.-C. Kieffer, M. A. ElKhakani, and F. A. Hegmann, Phys. Rev. B 85, 155120 (2012).
- Gray et al. (2016) A. X. Gray, J. Jeong, N. P. Aetukuri, P. Granitzka, Z. Chen, R. Kukreja, D. Higley, T. Chase, A. H. Reid, H. Ohldag, et al., Phys. Rev. Lett. 116, 116403 (2016).
- Pashkin et al. (2011) A. Pashkin, C. Kübler, H. Ehrke, R. Lopez, A. Halabica, R. F. Haglund, R. Huber, and A. Leitenstorfer, Phys. Rev. B 83, 195120 (2011).
- Morrison et al. (2014) V. R. Morrison, R. P. Chatelain, K. L. Tiwari, A. Hendaoui, A. Bruhács, M. Chaker, and B. J. Siwick, Science 346, 445 (2014).
- Wegkamp et al. (2014) D. Wegkamp, M. Herzog, L. Xian, M. Gatti, P. Cudazzo, C. L. McGahan, R. E. Marvel, J. Richard F. Haglund, A. Rubio, M. Wolf, et al., Phys. Rev. Lett. 113, 216401 (2014).
- Laad et al. (2006) M. S. Laad, L. Craco, and E. Müller-Hartmann, Phys. Rev. B 73, 195120 (2006).
- Koethe et al. (2006) T. C. Koethe, Z. Hu, M. W. Haverkort, C. Schussler-Langeheine, F. Venturini, N. B. Brookes, O. Tjernberg, W. Reichelt, H. H. Hsieh, H.-J. Lin, et al., Phys. Rev. Lett. 97, 116402 (2006).
- Zhu and Schwingenschlögl (2012) Z. Zhu and U. Schwingenschlögl, Phys. Rev. B 86, 075149 (2012).
- Gatti et al. (2007) M. Gatti, F. Bruneval, V. Olevano, and L. Reining, Phys. Rev. Lett. 99, 266402 (2007).
- Tomczak et al. (2008) J. M. Tomczak, F. Aryasetiawan, and S. Biermann, Phys. Rev. B 78, 115103 (2008).
- Sakuma et al. (2008) R. Sakuma, T. Miyake, and F. Aryasetiawan, Phys. Rev. B 78, 075106 (2008).
- Lazarovits et al. (2010) B. Lazarovits, K. Kim, K. Haule, and G. Kotliar, Phys. Rev. B 81, 115117 (2010).
- Wentzcovitch et al. (1994) R. M. Wentzcovitch, W. W. Schulz, and P. B. Allen, Phys. Rev. Lett. 72, 3389 (1994).
- Yao et al. (2010) T. Yao, X. Zhang, Z. Sun, S. Liu, Y. Huang, Y. Xie, C. Wu, X. Yuan, W. Zhang, Z. Wu, et al., Phys. Rev. Lett. 105, 226405 (2010).
- Brito et al. (2016) W. H. Brito, M. C. O. Aguiar, K. Haule, and G. Kotliar, Phys. Rev. Lett. 117, 056402 (2016).
- Zheng and Wagner (2015) H. Zheng and L. K. Wagner, Phys. Rev. Lett. 114, 176401 (2015).
- Newton et al. (2014) M. C. Newton, M. Sao, Y. Fujisawa, R. Onitsuka, T. Kawaguchi, K. Tokuda, T. Sato, T. Togashi, M. Yabashi, T. Ishikawa, et al., Nano lett. 14, 2413 (2014).
- Belozerov et al. (2012) A. S. Belozerov, M. A. Korotin, V. I. Anisimov, and A. I. Poteryaev, Phys. Rev. B 85, 045109 (2012).
- Weber et al. (2012) C. Weber, D. D. O’Regan, N. D. M. Hine, M. C. Payne, G. Kotliar, and P. B. Littlewood, Phys. Rev. Lett. 108, 256402 (2012).
- Kim et al. (2013) S. Kim, K. Kim, C.-J. Kang, and B. I. Min, Phys. Rev. B 87, 195106 (2013).
- Wall et al. (2012) S. Wall, D. Wegkamp, L. Foglia, K. Appavoo, J. Nag, R. F. H. Jr., J. Stähler, and M. Wolf, Nat. Commun. 3, 721 (2012).
- Wall et al. (2013) S. Wall, L. Foglia, D. Wegkamp, K. Appavoo, J. Nag, J. R. F. Haglund, J. Stähler, and M. Wolf, Phys. Rev. Lett. 87, 115126 (2013).
- Momma and Izumi (2011) K. Momma and F. Izumi, J. Appl. Cryst. 44, 1272 (2011).
- Budai et al. (2014) J. D. Budai, J. Hong, M. E. Manley, E. D. Specht, C. W. Li, J. Z. Tischler, D. L. Abernathy, A. H. Said, B. M. Leu, L. A. Boatner, et al., Nature 515, 535 (2014).
- Anisimov et al. (1991) V. I. Anisimov, J. Zaanen, and O. K. Andersen, Phys. Rev. B 44, 943 (1991).
- Liechtenstein et al. (1995) A. I. Liechtenstein, V. I. Anisimov, and J. Zaanen, Phys. Rev. B 52, R5467 (1995).
- Gervais and Kress (1985) F. Gervais and W. Kress, Phys. Rev. B 31, 4809 (1985).
- McWhan et al. (1974) D. B. McWhan, M. Marezio, J. P. Remeika, and P. D. Dernier, Phys. Rev. B 10, 490 (1974).
- Kresse and Furthmüller (1996a) G. Kresse and J. Furthmüller, Phys. Rev. B 54, 11169 (1996a).
- Kresse and Furthmüller (1996b) G. Kresse and J. Furthmüller, Comput. Mat. Sci. 6, 15 (1996b).
- Kresse and Hafner (1993) G. Kresse and J. Hafner, Phys. Rev. B 47, 558 (1993).
- Kresse and Joubert (1999) G. Kresse and D. Joubert, Phys. Rev. B 59, 1758 (1999).
- Goodman (1995) J. Goodman, Introduction to Fourier optics (McGraw-Hill, New York, NY, 1995).
- Longo and Kierkegaard (1970) J. M. Longo and P. A. Kierkegaard, Acta Chem. Scand. 24, 420 (1970).
- von Laue (1936) M. von Laue, Annalen der Physik 26, 55 (1936).
- Miao et al. (2000) J. Miao, J. Kirz, and D. Sayre, Acta Crystallographica Section D 56, 1312 (2000).
- Newton et al. (2010) M. C. Newton, S. J. Leake, R. Harder, and I. K. Robinson, Nature Materials 9, 120 (2010), ISSN 1476-1122.
- Robinson and Miao (2004) I. Robinson and J. Miao, MRS Bulletin 29, 177 (2004), ISSN 0883-7694.
- Robinson and Harder (2009) I. Robinson and R. Harder, Nature Materials 8, 291 (2009), ISSN 1476-1122.
Supplementary Material - Ab initio molecular dynamics study of the structural and electronic transition in VO2
VI Effect of Hubbard parameters on structural, energetic and electronic properties of VO2
In our simulations, we used three different settings for U and J parameters, which yield different lattice parameters, M1 band gap and energy difference E between monoclinic M1 and rutile R phases at T = 0. These different settings of the parameters also resulted in different Tc(U,J) observed in the MD simulations and also in different energy difference E at the corresponding T = Tc(U,J). Results are summarized in Tables I and II.
| Hubbard parameters [eV] | PBE (U=J=0) | U = 2.4, J = 0.5 | U = 3.15, J = 0.6 | U = 4.2, J = 0.8 |
| M1 | ||||
| [Å] | 5.634 | 5.660 | 5.666 | 5.681 |
| [Å] | 4.560 | 4.601 | 4.605 | 4.607 |
| [Å] | 5.413 | 5.437 | 5.443 | 5.449 |
| [] | 121.88 | 122.03 | 122.04 | 122.10 |
| M1 band gap [eV] | 0.0 | 0.25 | 0.36 | 0.56 |
| R | ||||
| [Å] | 4.616 | 4.626 | 4.631 | 4.637 |
| [Å] | 2.773 | 2.792 | 2.797 | 2.799 |
| Hubbard parameters [eV] | PBE (U=J=0) | U = 2.4, J = 0.5 | U = 3.15, J = 0.6 | U = 4.2, J = 0.8 |
| MD-estimated Tc [K] | 300 | 450 | 750 | |
| E(Tc) [meV/atom] | 5 | 11 | 15 | |
| E(T=0) [meV/atom] | -3.7 | 12.2 | 21.9 | 35.0 |
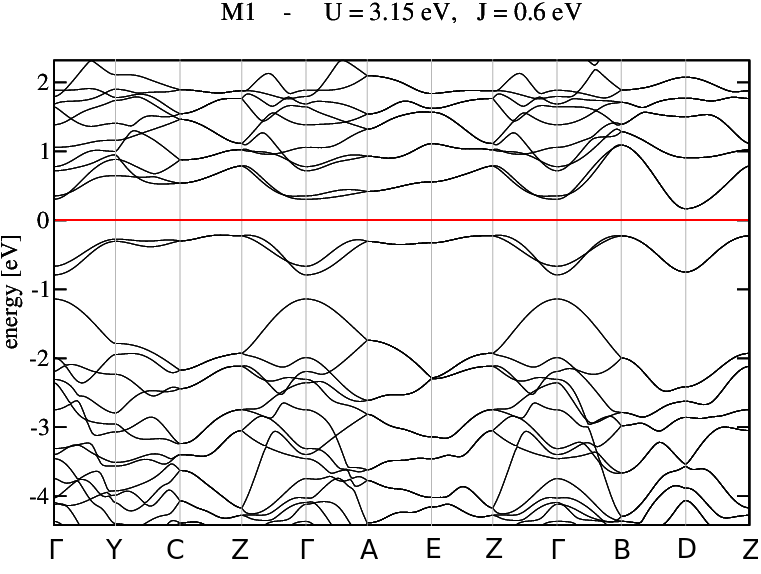
The optimal U, J setting that yields best compromise between the band gap, energetics of VO2 phases and MD-estimated Tc between M1 and R was found to be U = 3.15 eV, J = 0.6 eV with Tc=450 K. The corresponding band structure of M1 and R phases and projected densities of states (peDOS) calculated with these parameters are shown in Figs. S1 and S2, respectively.
|
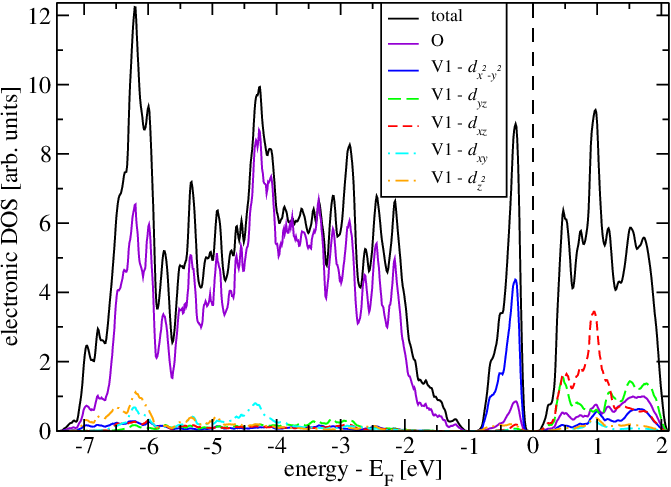
Fig. S1. Band structure along -Y-C-Z--A-E-Z--B-D-Z path and peDOS in the local geometry of V1 atoms Eyert (2002) for optimized M1 phase.
|
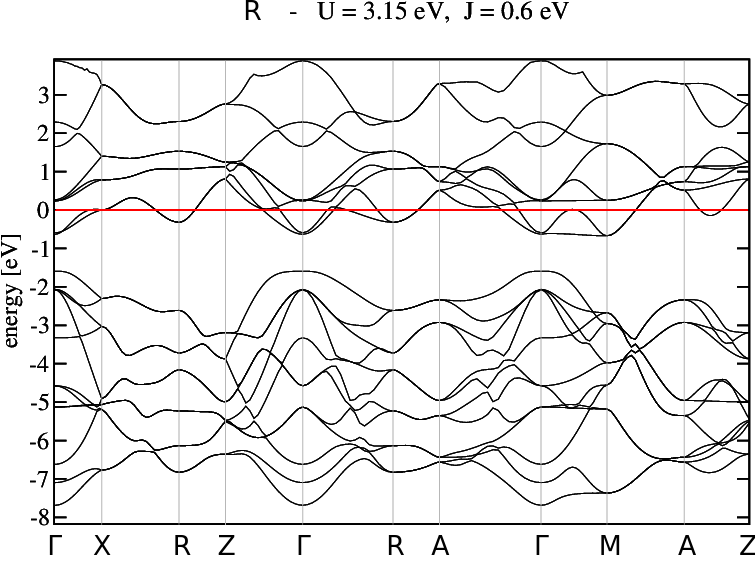
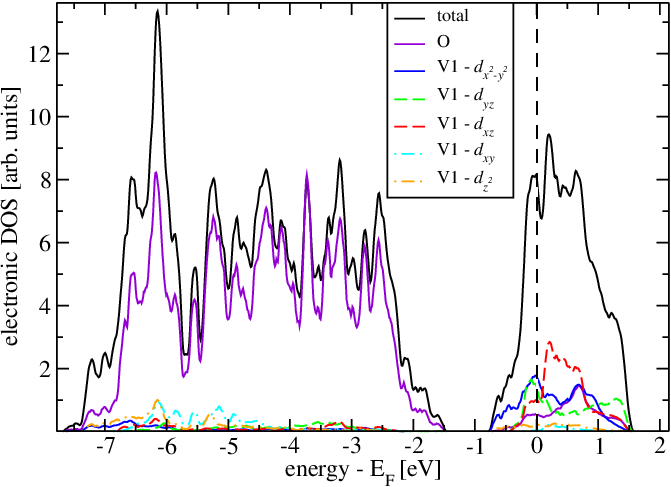
Fig. S2. Band structure along -X-R-Z--R-A--M-A-Z path and peDOS in the local geometry of V1 atoms Eyert (2002) for optimized R phase.
VII Definition of order parameters
The actual structural state of the system during the MD simulations was determined by tracking the dimerization amplitudes (DA) of individual chains of V atoms and the average tilting parameter of V-V dimers. We define the dimerization amplitude of a chain by the formula
,
where is the index of a chain atom (with total of atoms in a chain within the supercell) and is the deviation of V atom coordinate from its ideal position in the R phase. The dimerization amplitude for each -th chain - hence for the R phase equals zero, while for M1 it is 0.169 Å for an optimized (T=0) structure. There are 32 chains in our simulation sample, each with 8 V atoms, whose DA were averaged to obtained mean DA.
The tilting order parameter is defined here as the average angle between the dimers and the -axis (in M1 supercell geometry). The twisting angle yields 0 in the R phase and 7.5 in T=0 M1. There are 128 dimers in our simulation sample and the tilting parameter was taken as the average twisting angle from all these dimers.
VIII Evolution at 400 K before the M1-R transition
As described in the main text, at T=400 K the system simulated with U=3.15 eV and J=0.6 eV exhibited large fluctuations of DAs towards low values - Fig. S3, which corresponds to the fact that some chains were fairly disrupted during some time intervals within the MD run. This regular loss of the long-range order between some dimers is an indication that the transitions from M1 to R already tries to initiate.
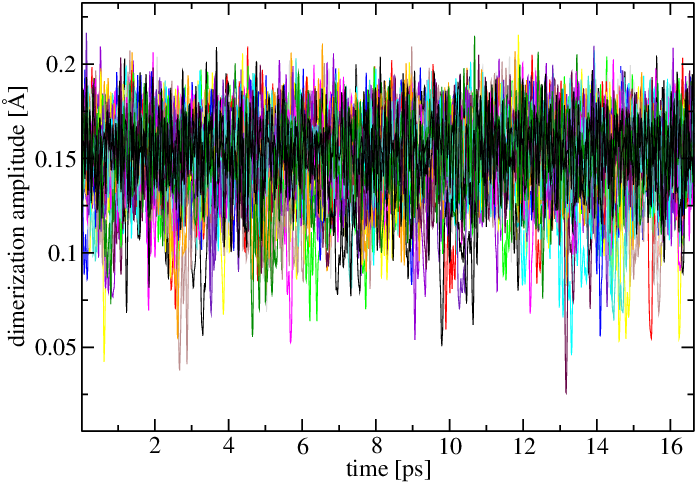
Fig. S3. Evolution of dimerization amplitudes at 400 K calculated with U=3.15 eV and J=0.6 eV showing large fluctuations of certain chains in some time intervals.
After rising the temperature to 450 K, the M1 phase quickly transformed into R, as described in the main text. The pictures of the actual simulation supercells with 768 atoms before and after this process are shown in Fig. S4.
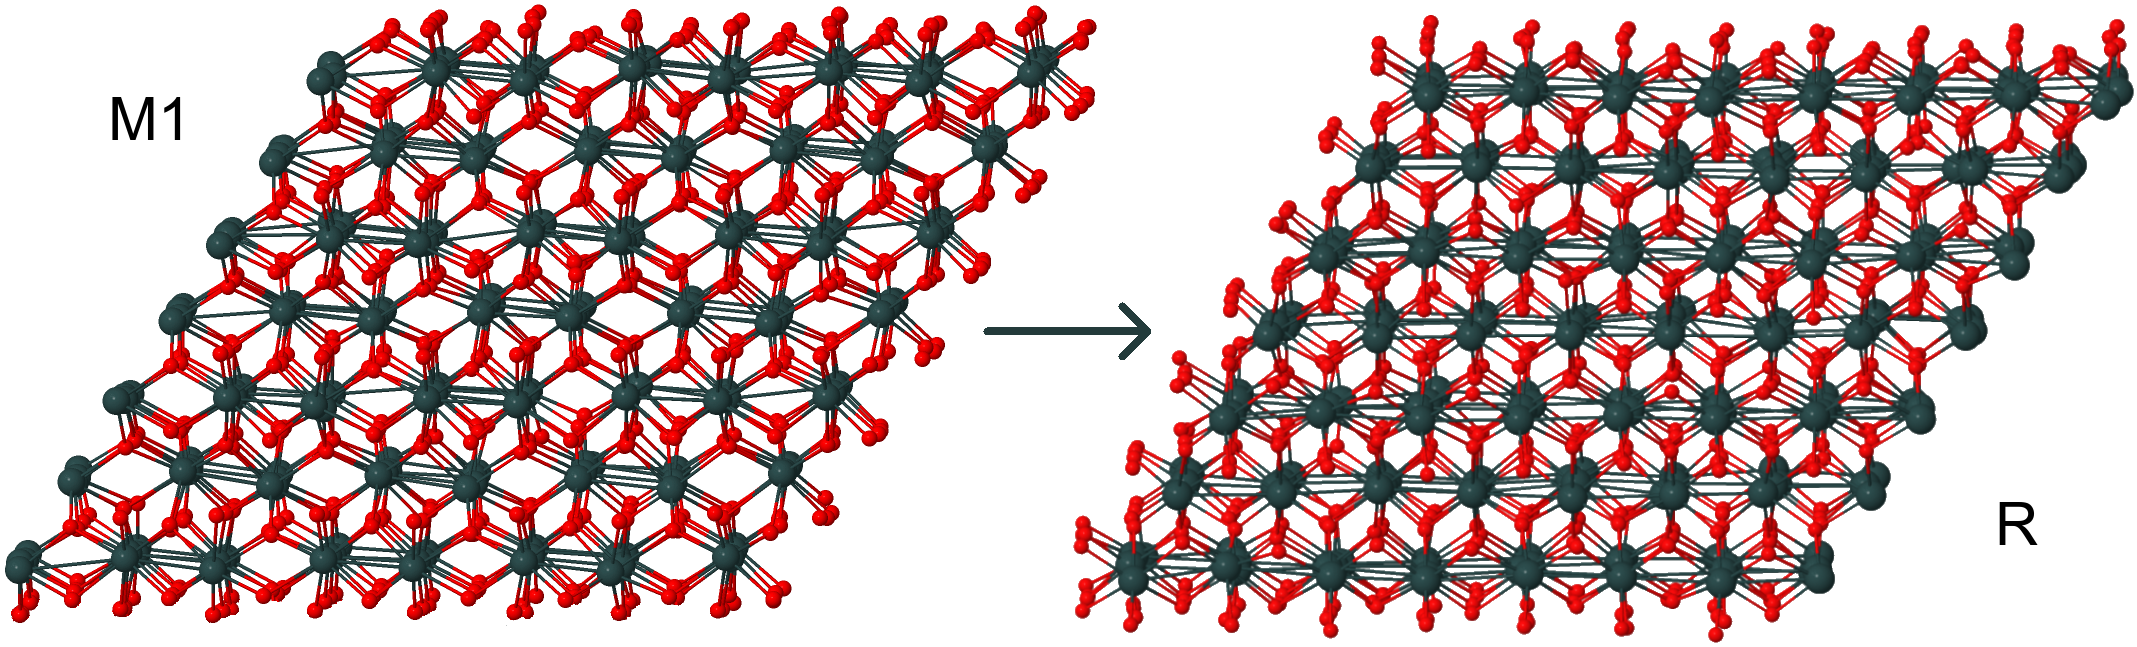
Fig. S4. 768-atomic supercells used in the simulations - M1 before the transition at 400 K and R phase at 450 K.
IX Transitions at different temperatures
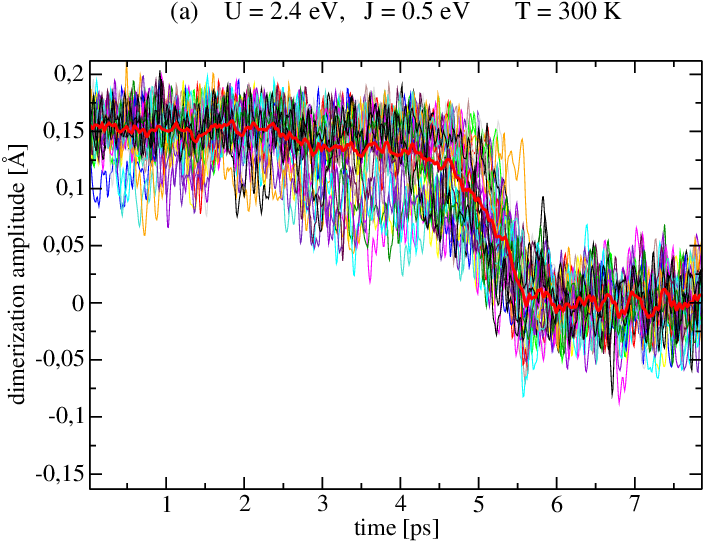
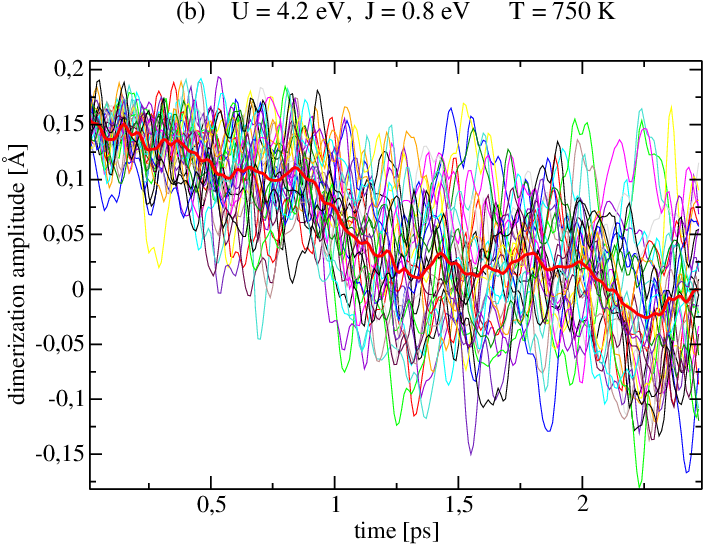
The M1-R transformations were observed at different temperatures when different U, J settings were used and the main results are summarized in Table II. The corresponding evolutions of DA are shown in Fig. S5 for K (U=2.4 eV, J=0.5) and for K (U=4.2 eV, J=0.8 eV).
|
Fig. S5. Evolution of dimerization amplitudes at 300 K (a) and at 750 K (b).
X Atomic fluctuations in M1 and R phases
The calculated values of static fluctuations of V and O atoms (calculated with U=3.15 eV and J=0.6 eV) show good agreement with experimental findings - Table 3. Fluctuations of lighter O atoms are greater than fluctuations of V atoms in the M1 phase at 300 K by a factor of 1.4, while in R phase at 450 K the opposite is true and is nearly 1.5 times higher than , according to the current simulations.
| fluctuations [Å2] | experiment - Ref. Longo and Kierkegaard (1970) | simulations - Ref. Budai et al. (2014) | current simulations |
|---|---|---|---|
| M1 | |||
| T = 298 K | T = 300 K | ||
| 0.0114 | 0.0102 | ||
| 0.0159 | 0.0142 | ||
| R | |||
| T = 470 K | T = 425 K | T = 450 K | |
| 0.036 | 0.037 | 0.0348 | |
| 0.028 | 0.021 | 0.0235 |
These large fluctuations of V atoms in the R phase are the well-known cause for the large Debye-Waller factors that are commonly observed in XRD experiments McWhan et al. (1974). This implies that V atoms remain relatively long time far away from their mean positions in R indicating a flat energy surface for the variation of V atomic positions, in contrast to M1, where the movement of V atoms in dimers is much more constrained. This might possibly be attributed to the strong tendency of vanadium atoms to dimerize even at the P-T conditions corresponding to the stable R phase region.
XI Coherent X-ray Diffraction during the M1-R transition
Bragg coherent X-ray diffraction imaging (BCXDI) is a lens-less imaging technique that permits imaging of crystalline materials with a sub-angstrom sensitivity. It is largely non-destructive and provides strain tensor information at the surface and throughout the bulk of a material. Experimentally, BCXDI is routinely performed at 3rd generation synchrotron facilities by illuminating a sample with a spatially coherent X-ray source while ensuring that the coherence length exceeds the dimensions of the crystal. In the Bragg reflection geometry, scattered light from the crystal interferes in the far-field, producing a three-dimensional k-space speckle pattern. The diffracted intensity is measured using an area X-ray detector which is positioned far enough away from the sample to resolve the finest fringes of the speckle pattern. The third dimension is obtained by rotating the Ewald sphere through the Bragg condition while maintaining a largely fixed incident () and reflected () wave vector. Iterative phase reconstruction methods are then used to recover the complex three-dimensional electron density and phase information. The displacement of ions throughout the bulk is directly related to the phase and can be used to obtain strain information according to the relation , where is a particular reciprocal lattice point and is the atomic displacement.von Laue (1936); Miao et al. (2000); Newton et al. (2010); Robinson and Miao (2004); Robinson and Harder (2009)
With the advent of 4th generation X-ray free electron laser (XFEL) synchrotron facilities, it has become possible to study ultra-fast structural dynamics using femto-second coherent X-ray pulses. When combined with a femto-second optical excitation source, it is possible to perform stroboscopic measurements in a pump-probe scheme.Newton et al. (2014)
In order to contrast ab initio calculations with ultra-fast pump-probe coherent X-ray diffraction experiments, we can define a static reference lattice at the initial low temperature phase of the system (i.e the M1 phase). This is achieved by averaging thermal fluctuations of each atomic position over a predefined time interval () such that:
| (1) |
For each subsequent time frame, the displacement of each atom from this equilibrium position is then given by:
| (2) |
The spatially varying far-field scattering amplitude distribution is proportional to the exponentiated phase associated with scattering from each atom in the supercell:
| (3) |
where is the wavevector transfer between the incident wavevector and a general reflected scattering vector and is the atomic scattering factor.
We monitored changes in the intensity from the speckle pattern that results from the (011) Bragg reflection in order to obtain a direct comparison with ultra-fast femto-second coherent X-ray diffraction experiments performed on nanoscale crystals.