Hydrodynamic theory of freezing: Nucleation and polycrystalline growth
Abstract
Structural aspects of crystal nucleation in undercooled liquids are explored using a nonlinear hydrodynamic theory of crystallization proposed recently [G. I. Tóth et al., J. Phys.: Condens. Matter 26, 055001 (2014)], which is based on combining fluctuating hydrodynamics with the phase-field crystal theory. We show that in this hydrodynamic approach not only homogeneous and heterogeneous nucleation processes are accessible, but also growth front nucleation, which leads to the formation of new (differently oriented) grains at the solid-liquid front in highly undercooled systems. Formation of dislocations at the solid-liquid interface and interference of density waves ahead of the crystallization front are responsible for the appearance of the new orientations at the growth front that lead to spherulite-like nanostructures.
pacs:
64.60.qe, 64.70.dm, 68.08.Bc, 68.08.De, 71.15.MbCrystal nucleation, i.e., stochastic formation of crystal grains via fluctuations that are able to grow plays an essential role in the making of polycrystalline and nanostructured matter ref1 ; ref2 , including the formation of polycrystalline growth forms such as disordered dendrites ref3 , and spherulites ref4 . The latter structures appear via the formation of new grains at the solidification front, a process termed “growth front nucleation” (GFN ref5 ). This phenomenon has been successfully addressed by conventional phase-field methods relying on coarse grained fields ref5 . Unfortunately, these works cannot provide details on the micromechanism of GFN. Although molecular simulations and theory recently shed light on many details of nucleation and liquid ordering preceding nucleation ref6 , GFN seems to be out of scope for such studies. Continuum theories working on the molecular scale offer a complementary approach to molecular simulations, and may deliver additional information on the relevant nanoscale processes, such as the mechanism of polycrystalline growth.
A fairly successful continuum approach, termed the Phase-Field Crystal (PFC) model, was developed recently to address the microscopic aspects of crystallization ref7 ; ref8 . The majority of the PFC studies were done assuming diffusive dynamics, which approximates reasonably crystalline aggregation in suspensions of micron size colloidal particles. In a recent work, we have proposed a hydrodynamic theory of freezing (HPFC) ref9 that applies for solidification in normal liquids. Our approach relies on fluctuating nonlinear hydrodynamicsref10 , and employs the free energy functional of the PFC model in determining the reversible stress tensor. This model recovers the proper dispersion relation for long wavelength acoustic phonons, a steady state front velocity, which is inversely proportional to the viscosity (as opposed to the time dependent front velocity observed in the case of diffusive dynamics), and describes the stress relaxation reasonably ref9 . It is thus expected to be able to capture defect formation, and therefore polycrystalline growth on the nanoscale.
Herein, we first employ the HPFC model for describing homogeneous and heterogeneous crystal nucleation, and then to the formation of new grains at the solidification front (GFN). While there were other PFC-based hydrodynamic models put forward recently ref11 , it is only the HPFC for which steady state growth, , and proper capillary wave spectrum were demonstrated.
In the HPFC model, we start from momentum transport and continuity equations used in fluctuating nonlinear hydrodynamics ref10 :
| (1) |
| (2) |
Here is the momentum, the mass density, the velocity, the divergence of the reversible stress tensor, the functional derivative of the free energy with respect to density, a reference density, and the dissipative stress tensor, and are the shear and bulk viscosities, respectively, while the fluctuation-dissipation theorem yields the following covariance tensor for the momentum noise :
Here is Boltzmann’s constant and the temperature.
We adopt the free energy functional of the PFC model with parameters used in Ref. ref9 :
| (4) |
where the local free energy density is
| (5) |
The order parameter is the normalized mass density: , where ( is the reference density, where is the atomic mass and the number density of the reference liquid). can be related to the bulk modulus of the reference liquid via , while and are responsible for elasticity ref9 . This formalism transforms into the usual Swift-Hohenberg formalism as follows ref8 : the reduced temperature and reduced density are expressed as and , where , , , , and . The HPFC model differs from the original PFC model in only the dynamic equations.
(a)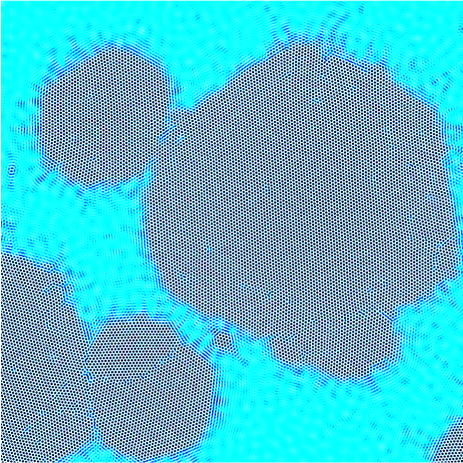
|
(b)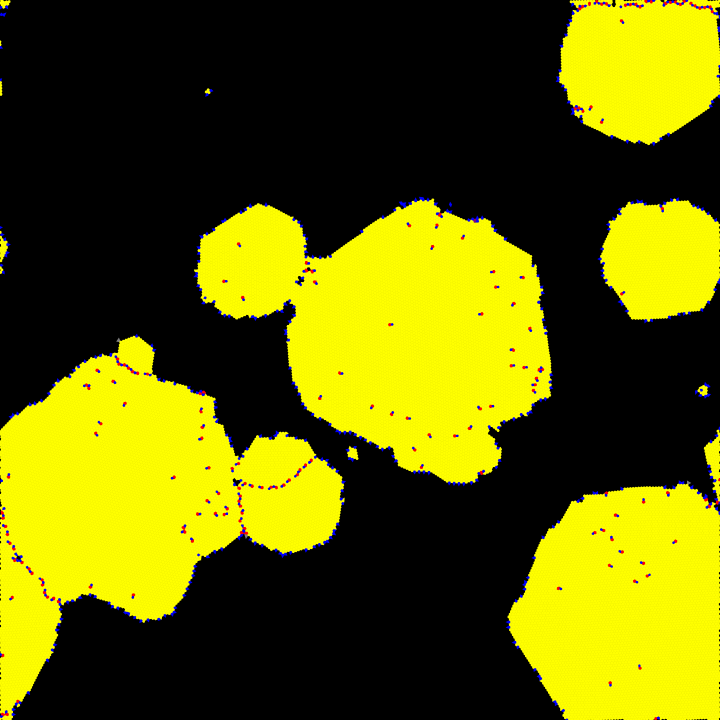
|
|
(c)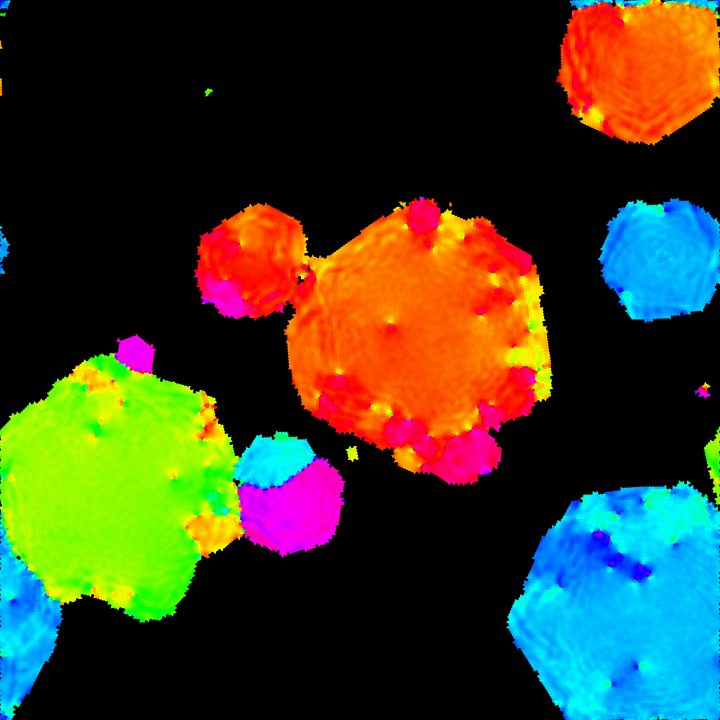
|
(d)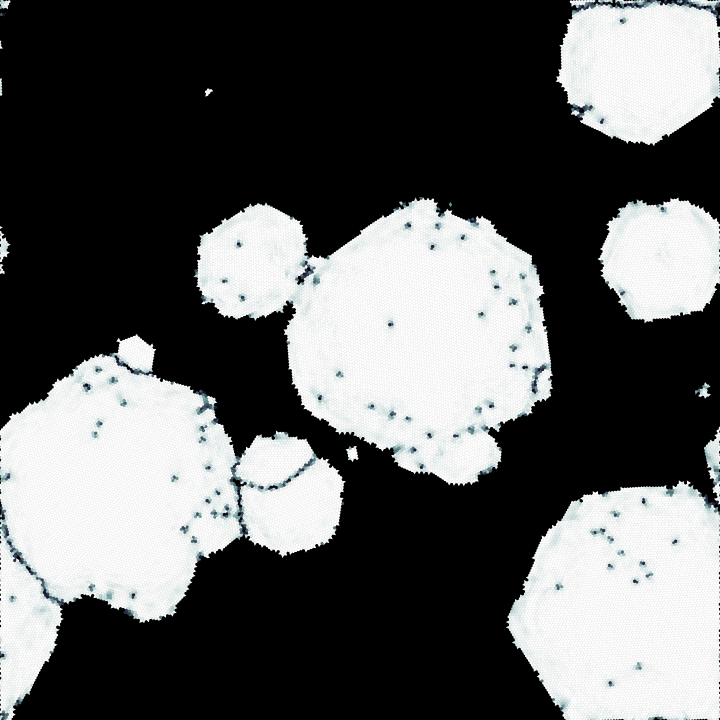
|
|
The combination of fluctuating hydrodynamics with atomic scale theory is supported by recent results, which indicate that fluctuating hydrodynamics remains valid down to the nanoscale ref12 . To avoid interatomic flows in the crystal owing to the large density gradients, we employ coarse-grained momentum and density fields when computing the velocity field: , an approximation used in the advective and viscous dissipation terms ref9 . While the HPFC model is not restricted to two dimensions (2D), an extensive testing was performed so far in 2D (see Ref. ref9 ).
Following Ref. ref9 , the properties of liquid iron were used to fix the model parameters for the 2D simulations. The kinetic equations were solved in 2D, using a pseudo-spectral scheme with a second order Runge–Kutta time stepping, while employing periodic boundary conditions on square grids of sizes ranging from to . Accordingly, the presented results refer to a hypothetical 2D iron, which can in principle be realized in molecular dynamics simulations, and are expected to be relevant to crystallization in thin metal films. The melting point corresponds to , whereas the scaled liquid density is . The linear stability limits taken at constant density or at constant temperature are and . The reduced temperature, and thus the undercooling, was tuned by varying .
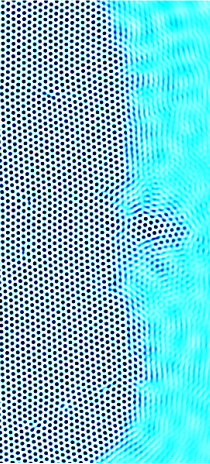
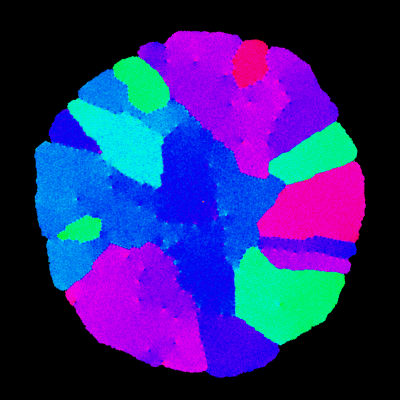
The structure of the solid phase is characterized by the number density map, whose peak positions are analyzed in terms of Voronoi polygons, and the bond-order parameter, , where is the angle corresponding to the -th neighbor in the laboratory frame. The crystal grains in polycrystalline cases were identified on the basis of the orientation map obtained as the phase angle of the complex hexatic bond-order parameter . The Voronoi polygons were colored gray, blue, yellow and red, when having 4, 5, 6, and 7 neighbors, respectively. characterizes the degree of disorder, and its phase specifies the local crystallographic orientation. Examples of these fields are displayed in Fig. 1.
(a)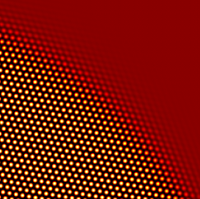 (b)
(b)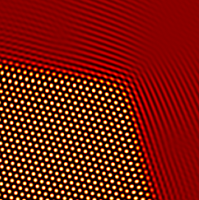
|
|---|
(c)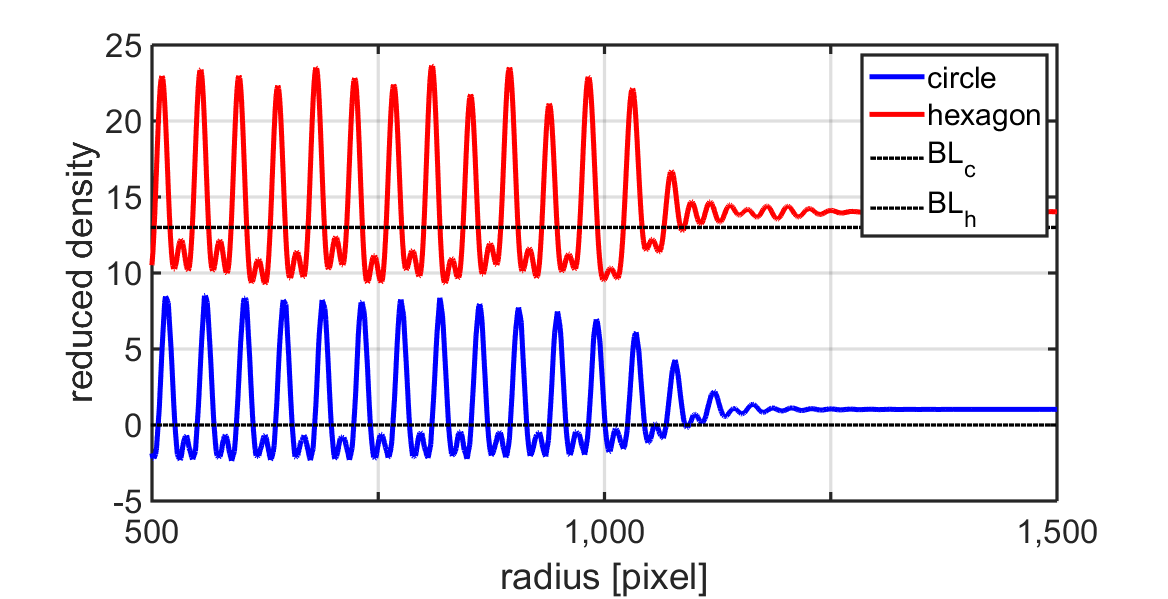
|
(d)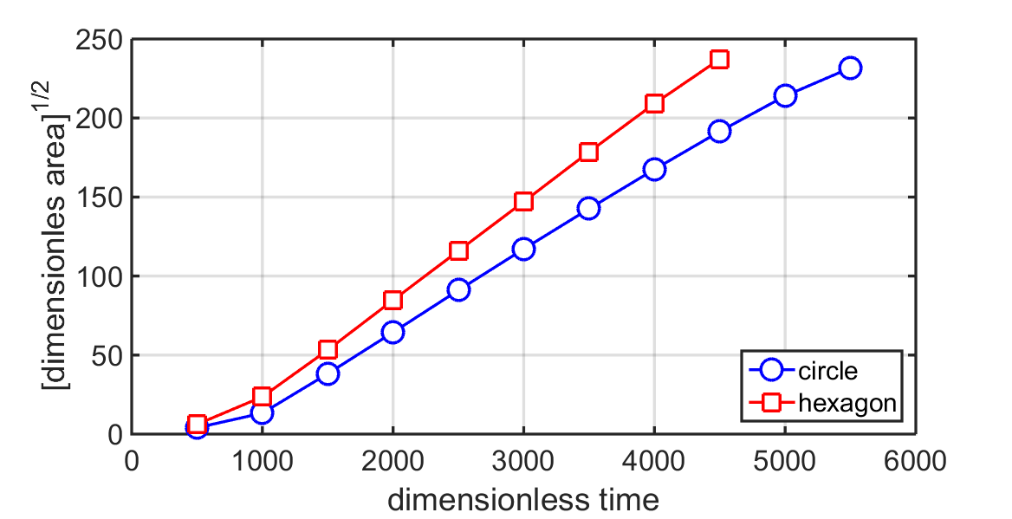
|
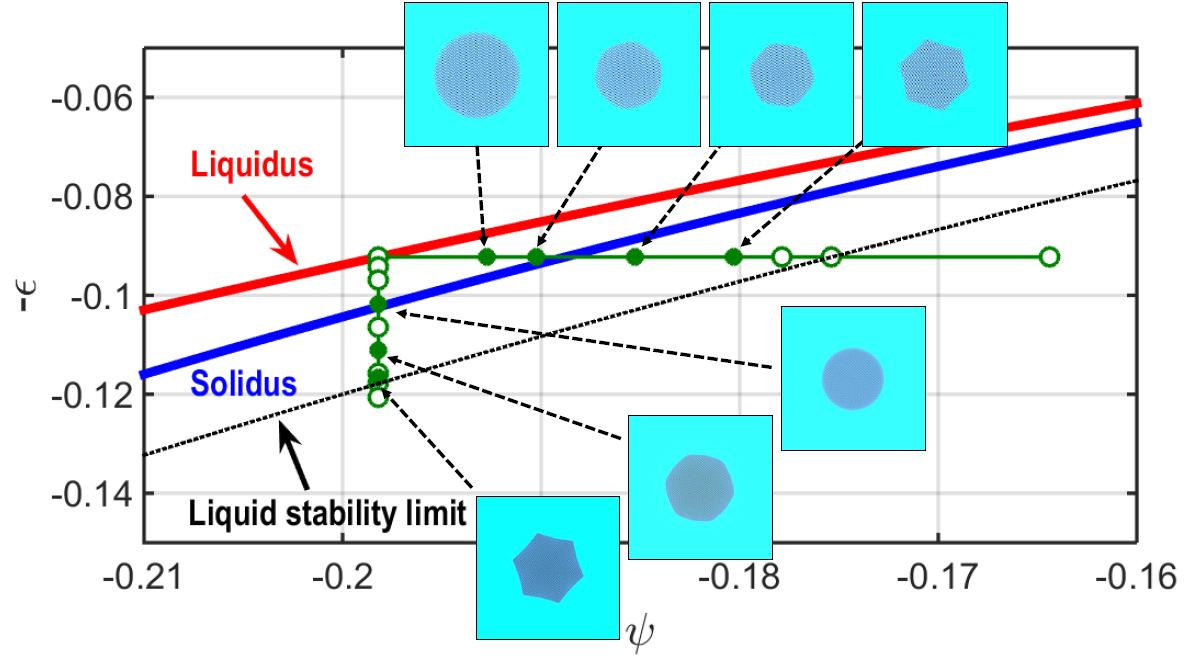
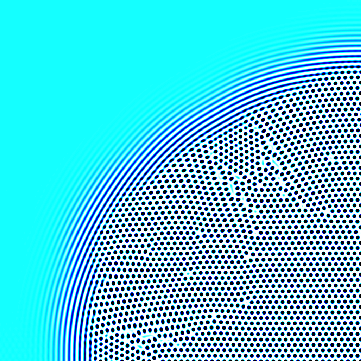
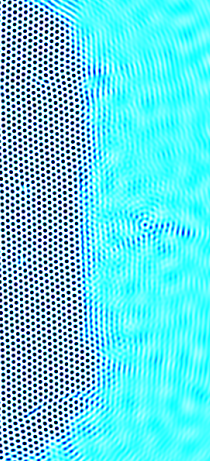
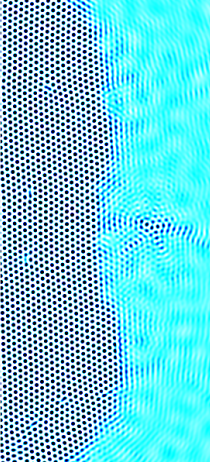
The section of the phase diagram, where HPFC simulations were performed is shown in Fig. 2. First, we studied growth initiated by a small (atom size) potential well. Close to the liquidus circular crystals grow, whereas approaching the stability limit, the growth form becomes hexagonal first with rounded corners, evolving into hexagons with pointed corners and concave edges. This behavior is attributed to a change of the interface structure: The respective density distributions are displayed in Fig. 3. Panels (a) and (b) show a closeup of the growth fronts, whereas panels (c) and (d) present the respective density profiles, and the time dependencies of the average crystal radius. Near equilibrium, the solid-liquid interface extends to 6-7 interatomic distances, becoming considerably sharper, when approaching the stability limit. The respective change in anisotropy is expected to be responsible for the different crystal shapes. Apart from an initial transient, the crystals display essentially linear growth as predicted in ref9 .
(a)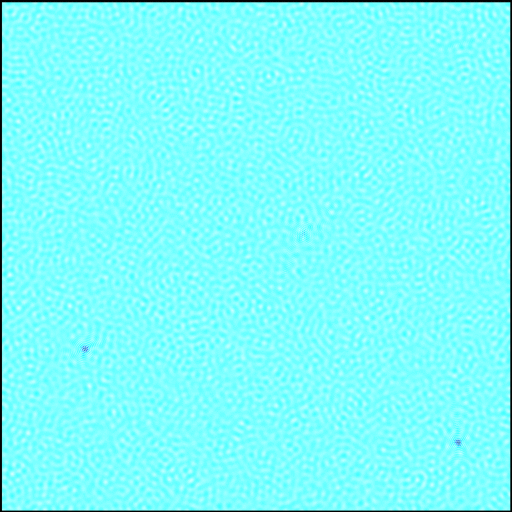 (b)
(b)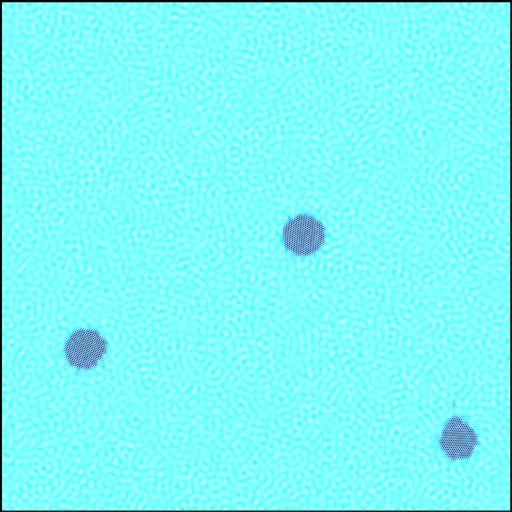
|
(c)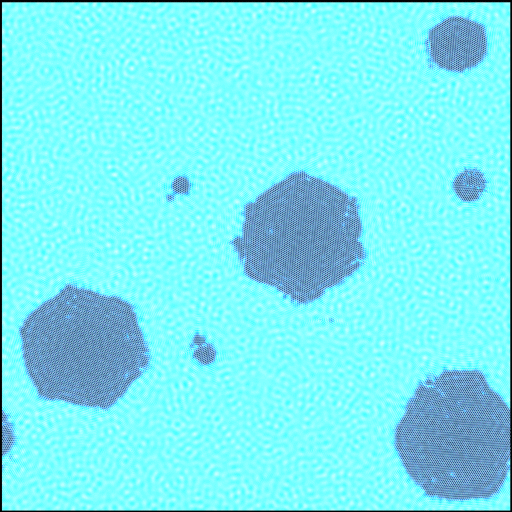 (d)
(d)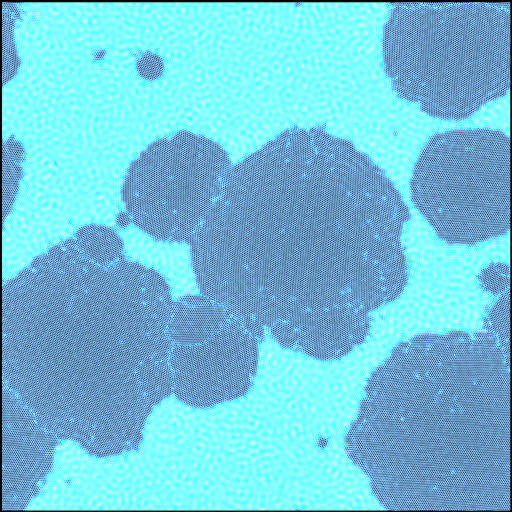
|
(e)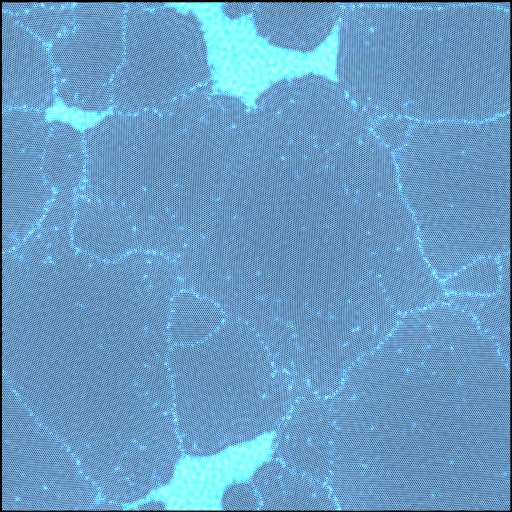 (f)
(f)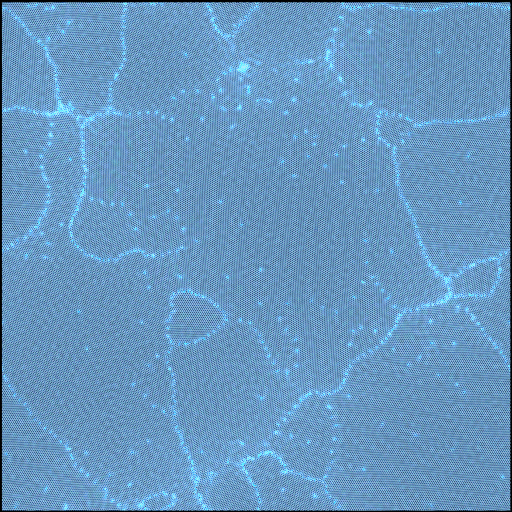
|
(g)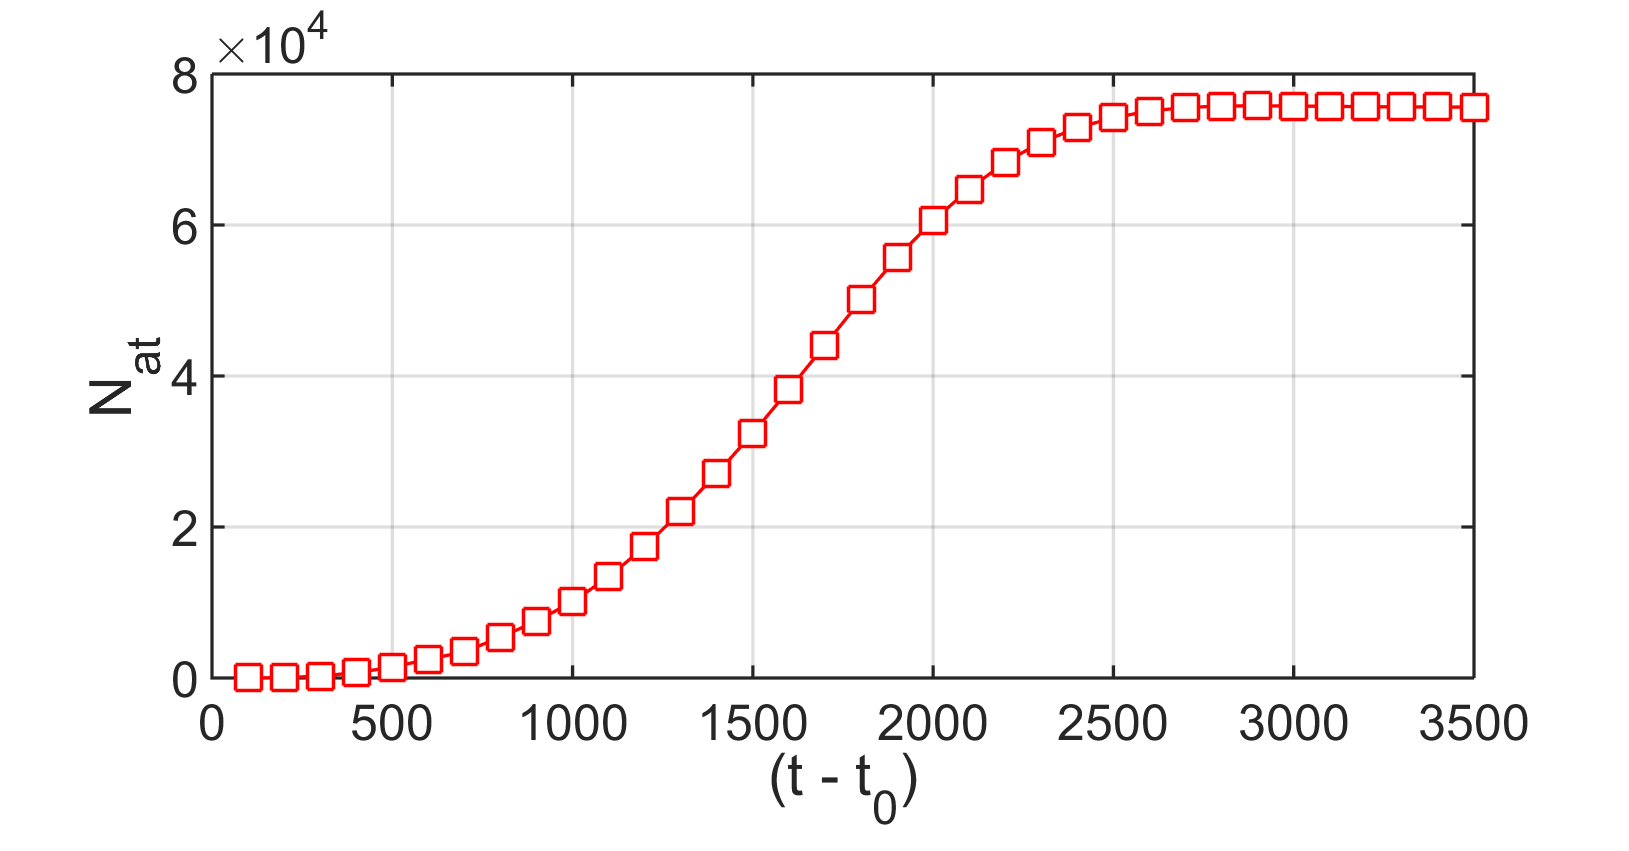
|
(h)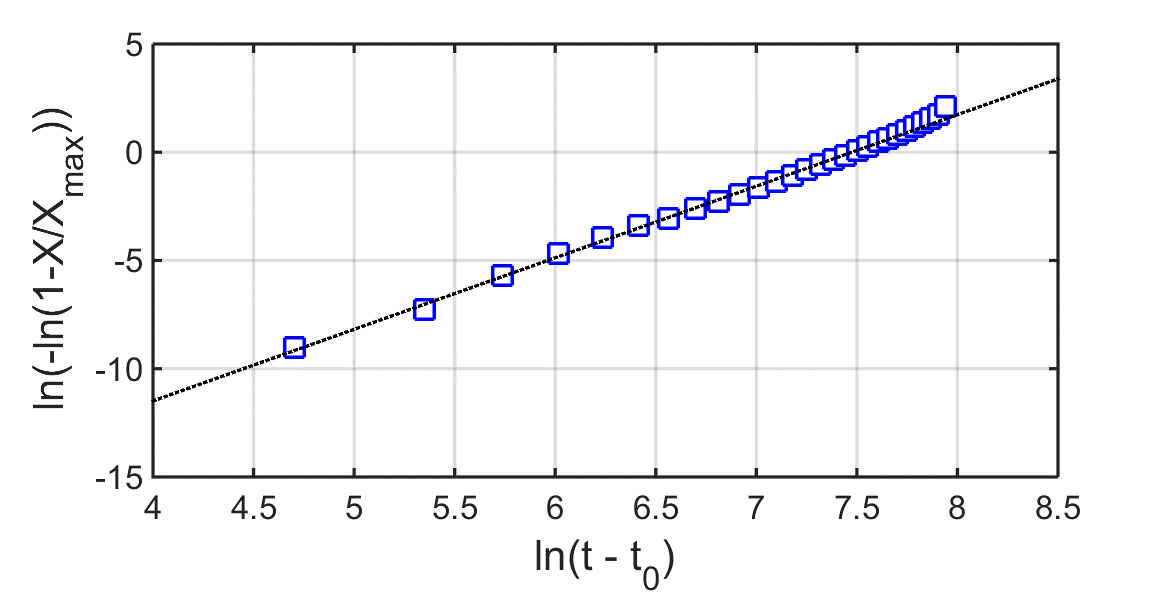
|
Crystallization kinetics: The momentum noise in Eq. 1 gives rise to density fluctuations, which together with molecular scale density waves from the reversible stress tensor, lead to the formation of crystal-like fluctuations (homogeneous nucleation), followed by crystal growth, yielding to polycrystalline freezing. We investigated this in the metastable liquid domain slightly backward from liquid instability: and . The results are summarized in Fig. 4. The Johnson-Mehl-Avrami-Kolmogorov expression, ref2 was fitted to the temperature dependent crystalline fraction evaluated from the number of density peaks. Here is the incubation time, a characteristic time related to the nucleation and growth rates, and is the Avrami-Kolmogorov exponent indicative to the mechanism of crystallization ref2 . In our case, from the average slope of the vs. plot, we obtained a [Fig. 4] implying linear growth with slightly increasing nucleation rate. This result differs considerably from the strongly decreasing with increasing reported for diffusive dynamics ref13 .
(a)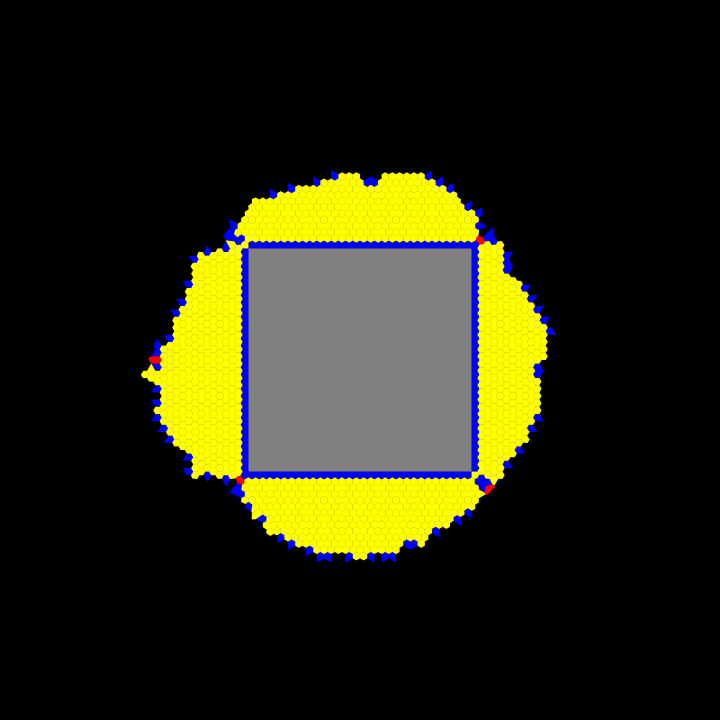 (b) (b)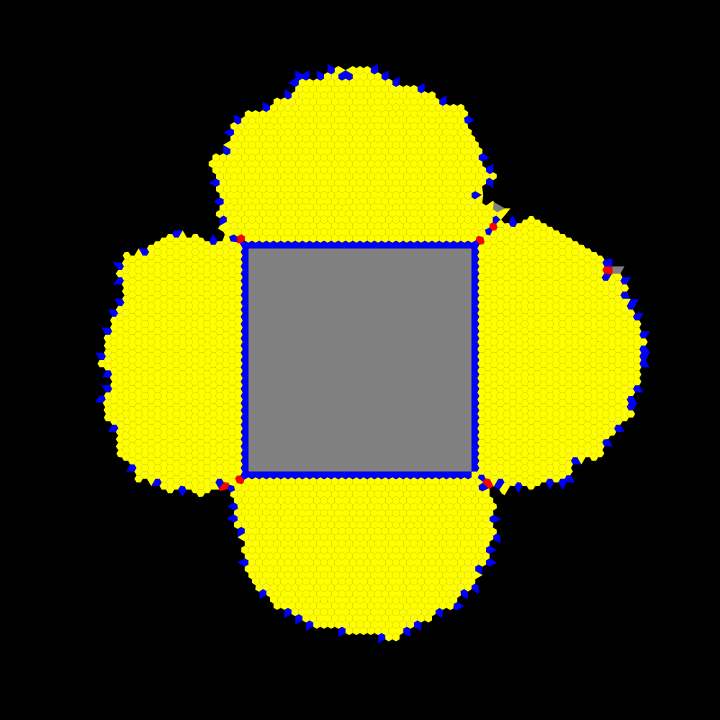
|
(c)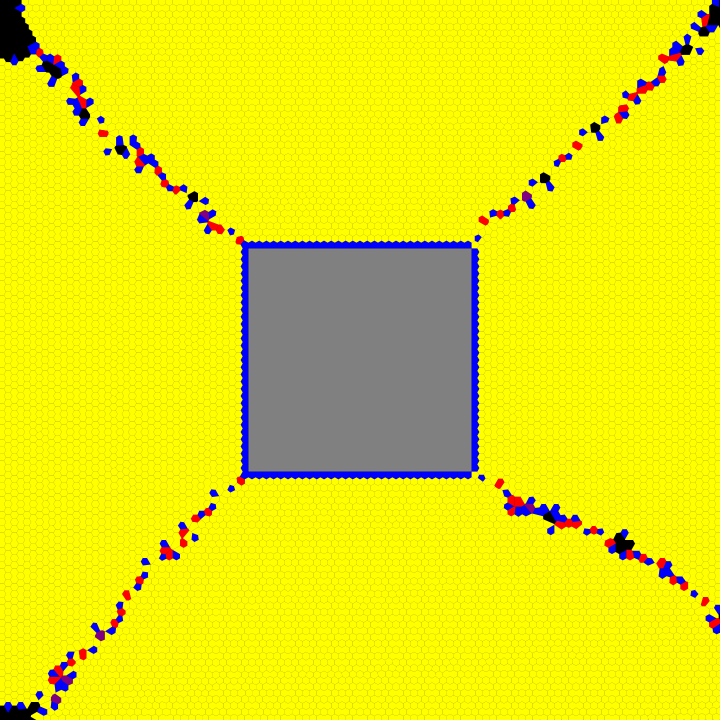 (d) (d)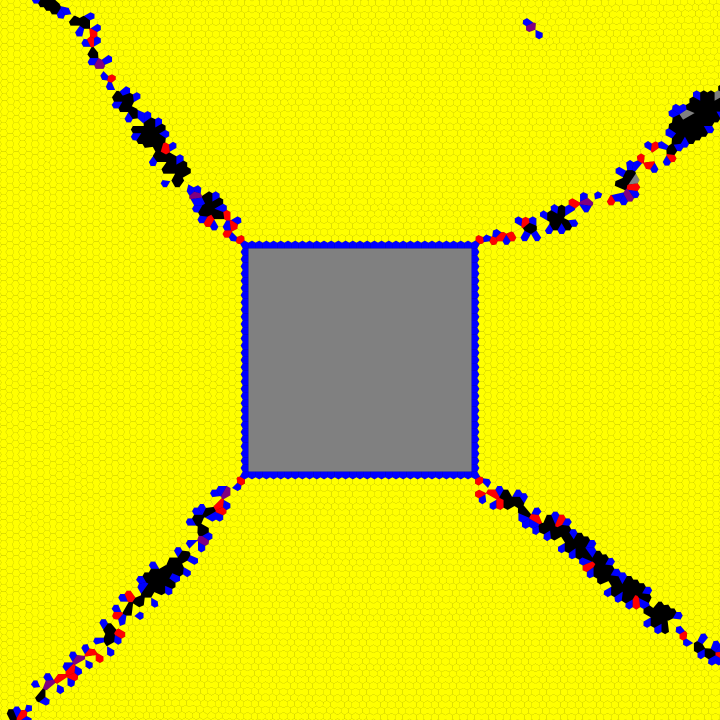
|
Particle induced ’nucleation’: To model a foreign particle (substrate), an extra term, , was added to the free energy density, where outside the substrate, whereas it is a periodic potential inside that determines the crystal lattice of the substrate. To test whether the free growth limited model of Greer and coworkers ref14 remains valid in the presence of hydrodynamics, we employ a square shape substrate of made of a square lattice, whose lattice constant coincides with that of the forming triangular crystal. This approximates the ideal wetting Greer and coworkers assumed between the substrate and the crystal. The undercooling has been increased by multiplying by factors and . In Fig. 5, we present long-time solutions as a function of . In the HPFC model (as well as in the PFC model with diffusive dynamics ref15 ), there exists a critical undercooling for a given particle size, beyond which free growth takes place.
 |
Growth Front Nucleation (GFN): Formation of new grains at the solidification front has been identified as the mechanism by which complex polycrystalline growth forms appear ref3 ; ref4 ; ref5 . This phenomenon has been successfully modeled by phase-field methods employing orientation fields to monitor the local crystallographic orientation. In these models, new grains form either by quenching orientational defects (bundles of dislocations) into the crystal (at large undercoolings), or via branching in directions of low grain-boundary energies (at small undercoolings). The orientation field approach, became fairly successful in capturing complex growth structures ref5 . Yet it is desirable to clarify the microscopic background of GFN. It is suspected that in substances of different molecular structures/interactions different GFN mechanisms may occur. Herein, we employ the HPFC model to study the formation of new grains at the solid-liquid interface of 2D hexagonal crystals at high undercoolings.
(a)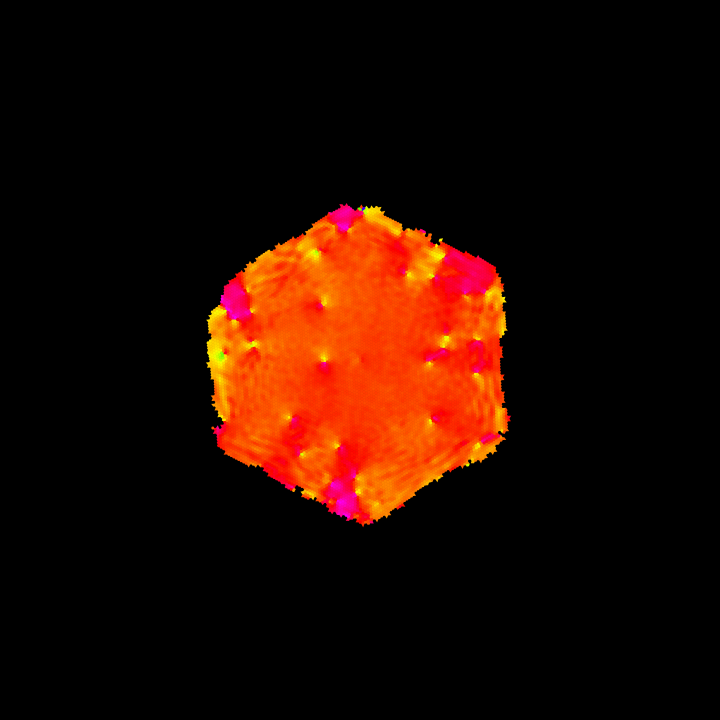 (b) (b)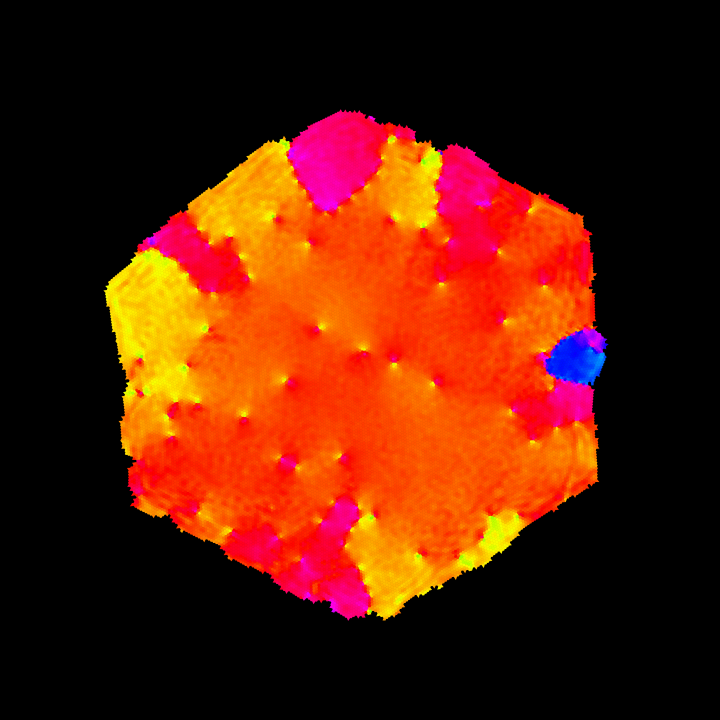 (c) (c)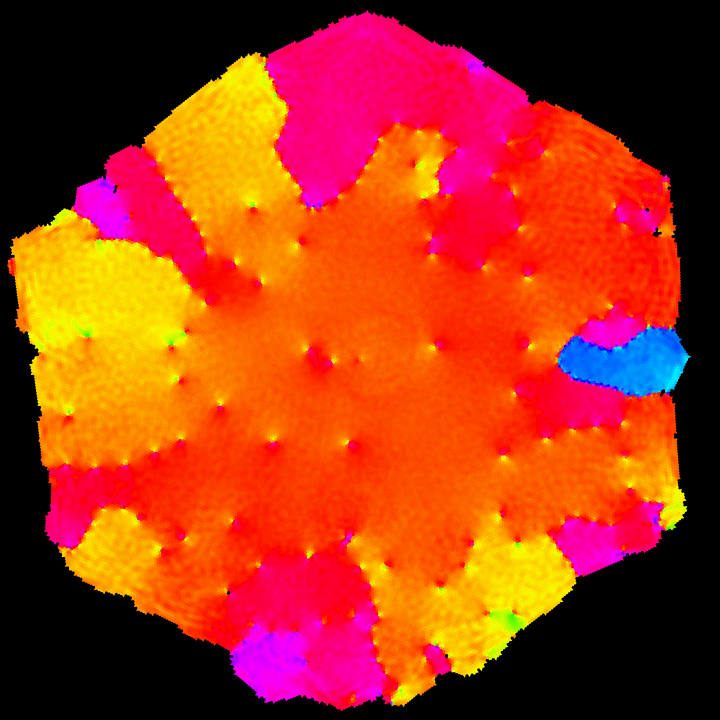
|
(d)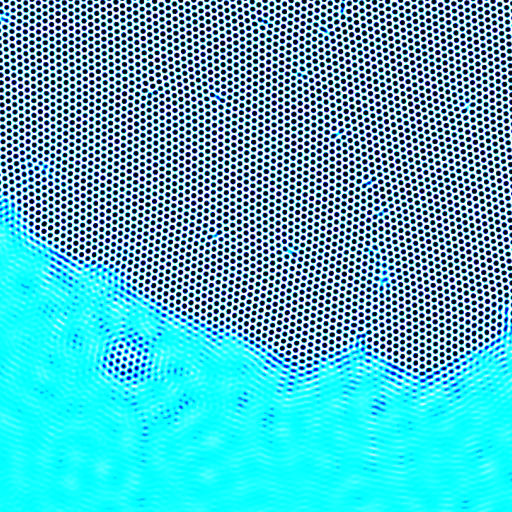 (e) (e)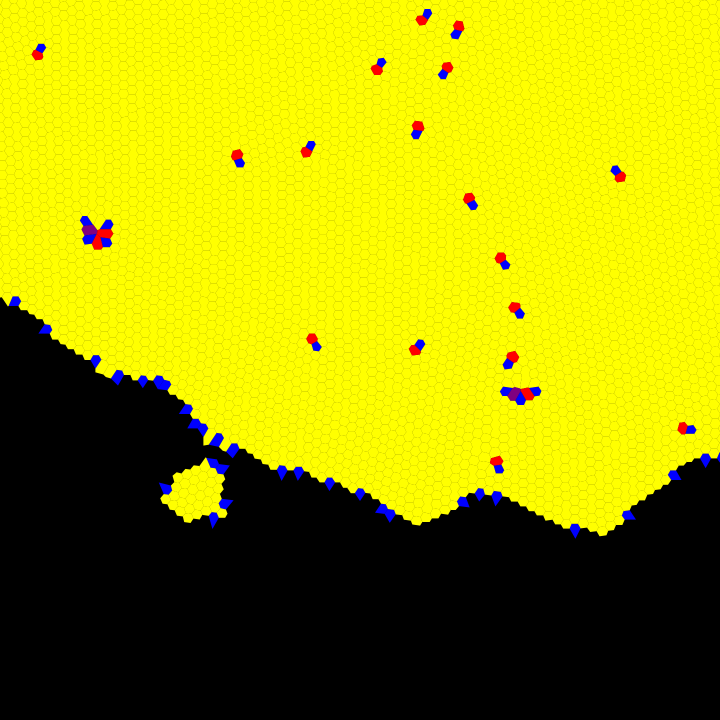 (f) (f)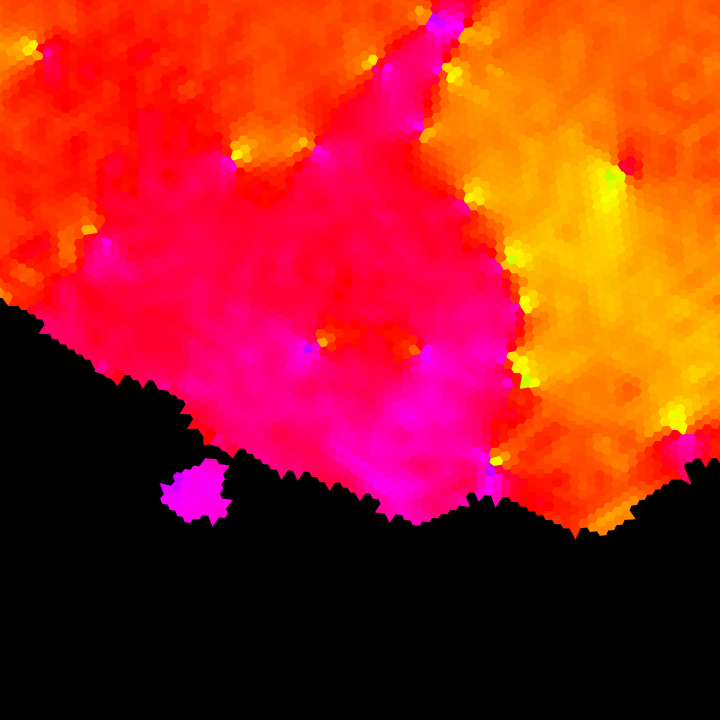
|
(g)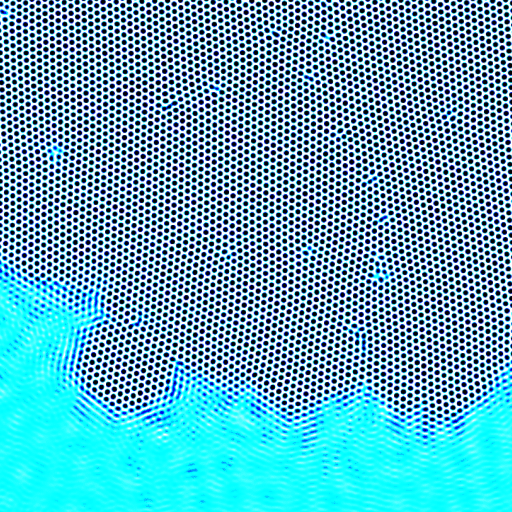 (h) (h)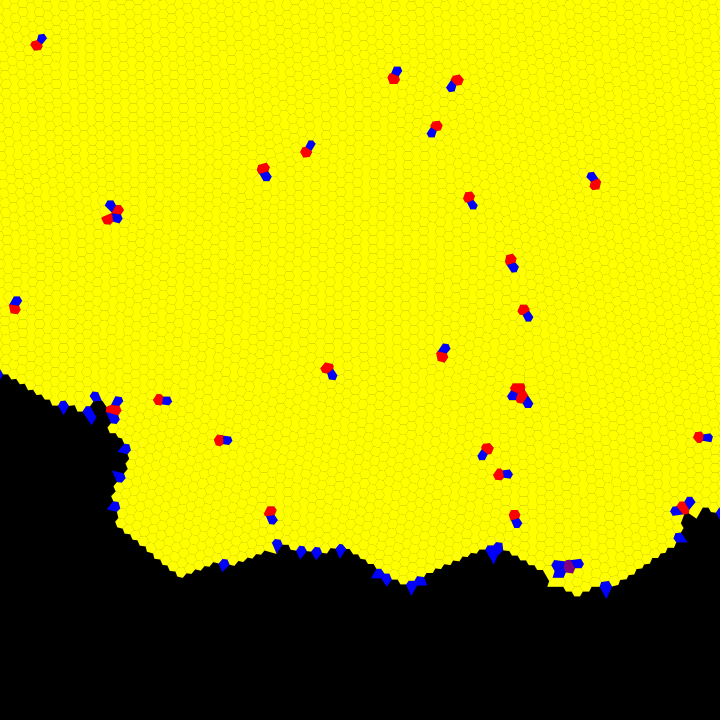 (i) (i)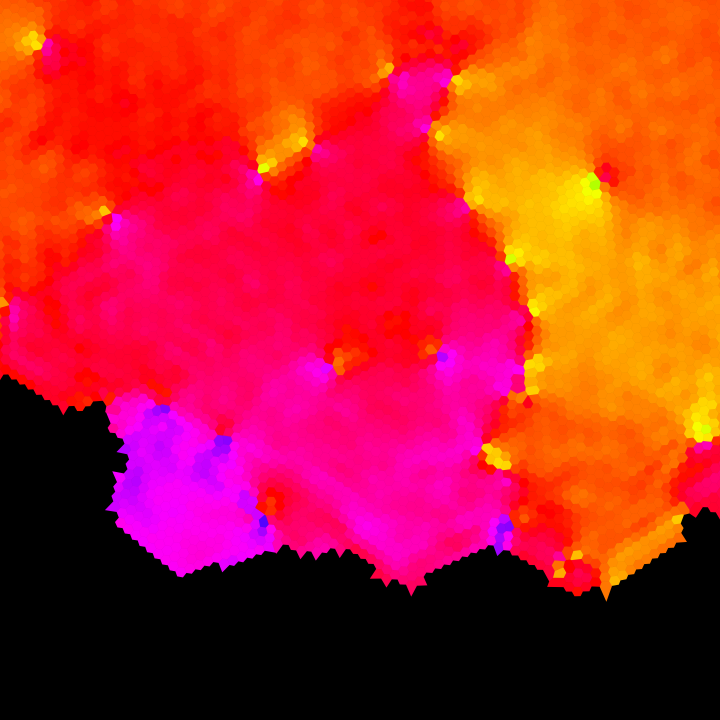
|
(j)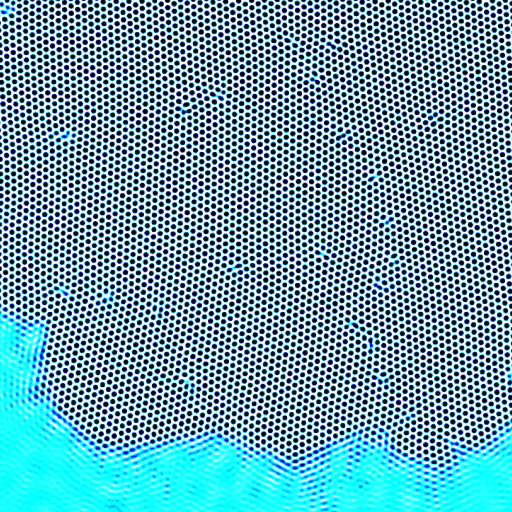 (k) (k)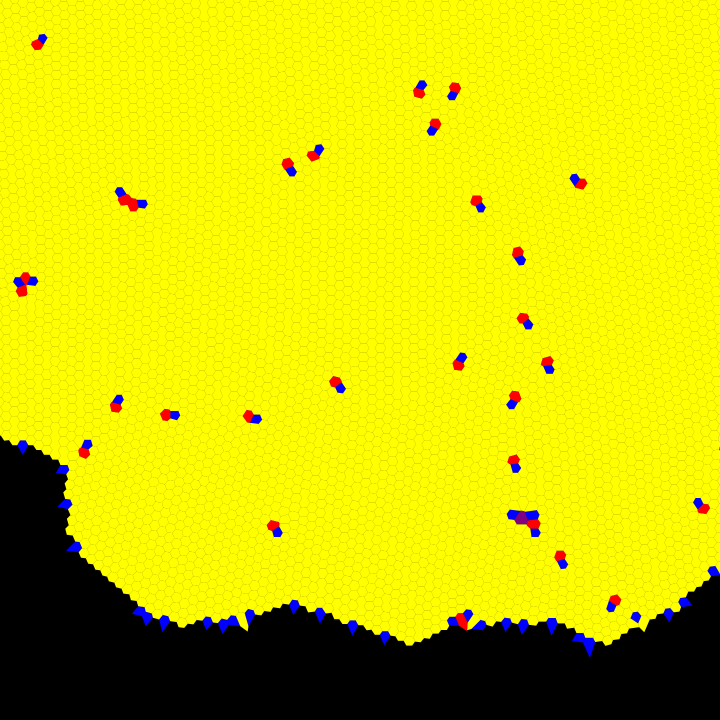 (l) (l)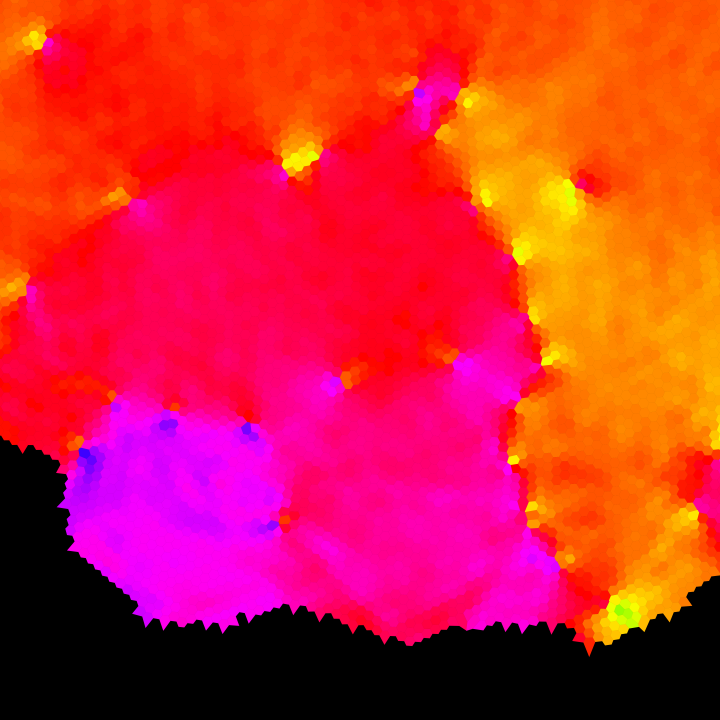
|
We made our first attempts to model GFN years ago ref16 using the original PFC model. At supersaturations beyond the liquid stability limit , we observed that without noise crystal seeds evolved into ordered polycrystalline structures. The growing crystal was surrounded by concentric density waves, which initiated crystallization accordingly: in six directions these waves helped the growth of the original crystal, whereas in other directions a large number of defects formed and new orientations appeared that fitted better to the local direction of the density waves (Fig. 6). Later works performed without noise in the unstable liquid regime indicate the transition of a flat single crystal front into polycrystalline growth and eventually into glassy freezing with increasing driving force ref17 . These findings could be regarded as signs of elementary processes of GFN. However, when a noise term obeying the fluctuation-dissipation theorem is added to the equations of motion in the unstable regime, these solutions are suppressed by explosive nucleation. Inside the metastable regime, we were unable to observe GFN, probably owing to the lack of an extended layer of molecular scale density waves ahead of the front.
In the HPFC model, we were able to observe polycrystalline growth forms in the metastable liquid (see Fig. 7). The kinetic equations were solved on a rectangular grid. A shallow molecular size potential well was used to initiate freezing. It induced concentric density waves (akin to the ’onion structures’ predicted in ref18 , then a small hexagonal single crystal formed, but as it grew new orientations appeared gradually via two mechanisms of GFN: (i) Dislocations entered in the growing crystallites at cusps centers. These appear due to the interaction of the stress field of the growing nanoscale crystallite with density fluctuations. (ii) Small crystallites nucleate in the close vicinity of the solid-liquid interface, which apparently originate from the interference of the density waves ahead of the the rough solid-liquid interface (see Fig. 8). The two mechanisms are clearly visible in the snapshots of the density, orientation and Voronoi maps (Figs. 7 and 8).
We found that mechanism (i) occurs in a relatively broad range of undercoolings or densities, however, the formation rate of dislocations decreases with decreasing driving force, a finding that might be associated with a decreasing growth velocity (see the discussion below). In contrast, mechanism (ii) can only be observed in the close vicinity of the linear stability limit of the liquid. For example, at the reduced temperature , mechanism (ii) appears in the scaled density range ; whereas at fixed scaled density of , nucleation ahead of the front occurs in the reduced temperature range . This observation correlates with the finding that in the HPFC model, the thickness of the liquid layer, in which liquid ordering in the form of density waves takes place, increases towards the stability limit.
|
Although our simulations are on the nanoscale, we observe spherulite-like structures (Fig. 9) similar to those seen on larger scales. We note that polycrystalline growth structures can form spontaneously on this scale as shown by molecular dynamics simulations ref19 and experiments on organic and metallic nanospherulites ref20 . Our work might be directly relevant to them and to carbon nanostructures.
An intriguing question is, why the HPFC model recovers GFN in the metastable liquid domain, whereas the diffusive PFC model does not. This might be related to either the differences in the interface structure or defect dynamics, or in both. For example, in the case of diffusive PFC, a fast diffusionless growth mode characterized by a broad interface occurs at large driving forces (still in the metastable liquid) ref21 , in which healing of the defects can be relatively easy, avoiding the formation of dislocations at the perimeter of the growing crystal, preventing thus GFN. In the HPFC model, the relatively sharp inter face may be unable to do this. We discuss these issues below.
The original PFC model incorporates elastic interactions as well as crystal plasticity combined with diffusive dynamics, however without hydrodynamic modes of the evolution of the density field. Defect dynamics, including vacancy motion, dislocation glide, climb, and annihilation, and grain boundary melting were studied extensively on the diffusive time scale ref7 ; ref8 ; ref22 . A few studies went beyond this approximation by incorporating faster processes enabled by the inclusion of a second order time derivative into the equation of motion (see the MPFC model in Ref. ref23 ), or via linearizing the Navier-Stokes equations ref24 . In both of these quasi-hydrodynamic models the atomic positions are relaxed rapidly at early times in a manner consistent with elasticity theory, while the late time defect motion, including vacancy diffusion, grain boundary kinetics, and dislocation climb, is governed by diffusive dynamics. This suggests that defect dynamics alone may not be responsible for the observed differences in GFN.
A work by Majaniemi et al. ref24 explored differences between dynamics of mass distribution in the MPFC model (they termed it Type-2 model) and a more sophisticated linearized hydrodynamic model (termed Type-3 model) in the non-equilibrium case of a crack relaxation under stress. They found that the dynamic mass distribution the two models predict can be quite different, which they attributed to the transport differences of the quasi-phonons appearing in the MPFC model and the acoustic phonons of the Type-3 model. Remarkably, in the Type-3 linearized hydrodynamics model, which is close to the present full hydrodynamic model, the system relaxed to a multigrain structure, as opposed to the single crystal solution from the MPFC model. The behavior predicted by the Type-3 model appears to be similar to what we observed in our full hydrodynamic HPFC simulations, in which, after engulfing low density fluctuations into the solid, dislocations and new grains were formed at the interface. This phenomenon is more frequent in the cusps of the interface, and the dislocations may be of misfit origin.
(a)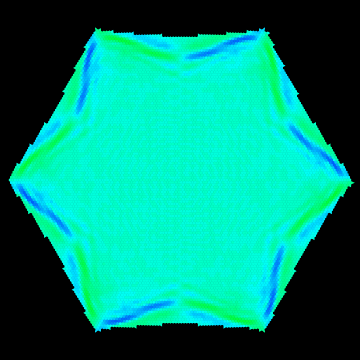 (b)
(b)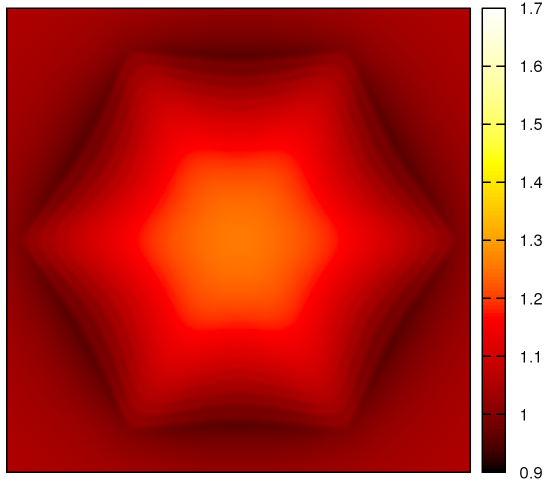
|
(a)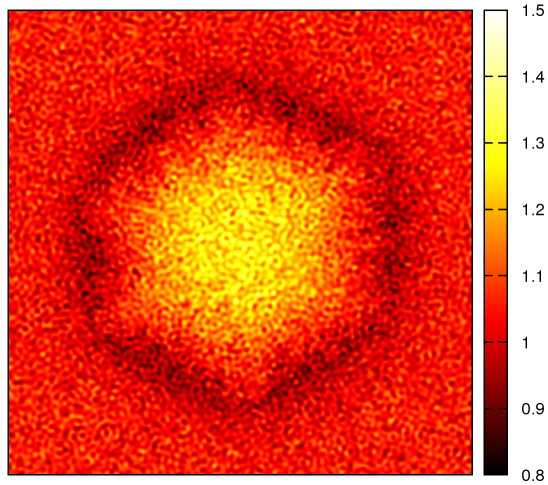 (b)
(b)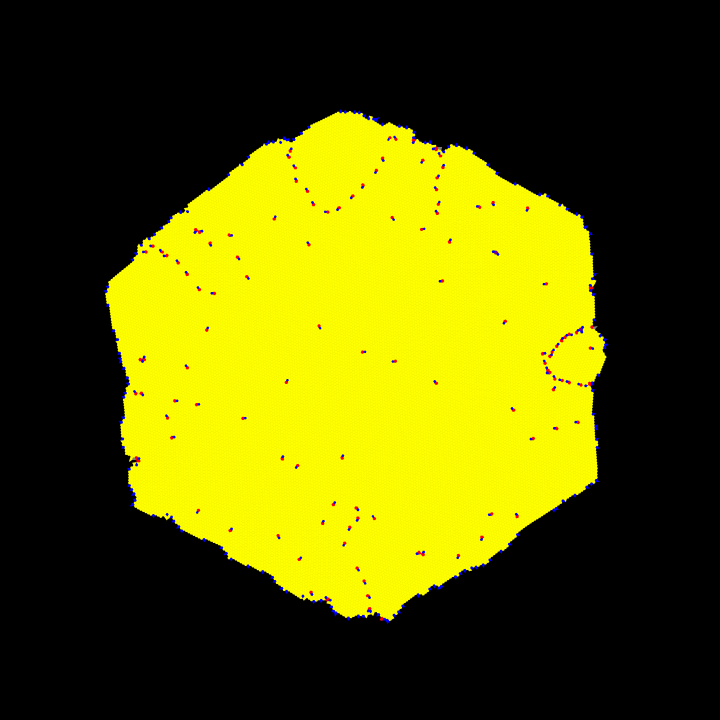
|
Apparently, we have stress at the growth front already in the early single crystal state, as reflected by the non-uniform orientation field that indicates slight misorientations (relative rotation of the Voronoi cells) between the two sides of the corners of the crystallite and at the central region of its sides. To see this clearly, we performed simulations without momentum fluctuations for the highly nonequilibrium liquid, starting crystallization with a small cluster that evolves due to a weak potential of 2D hexagonal structure. The potential contains a central well and 6 neighboring wells of equal depth given by the single mode solution for the particle density for this structure.
The orientation field of a crystallite, grown from such a cluster, is shown in Fig. 10(a). The deformation and the related stress that causes the inhomogeneity of the orientation field appears to originate from a radial density change shown in Fig. 10(b). The latter panel displays the coarse grained particle density obtained by FIR (Finite Impulse Response) filtering ref25 from the particle density. The spatial modulation of coarse grained density at the interface might indicate a weakly oscillating growth velocity. Despite the presence of the hydrodynamic mode of density relaxation, density depletion is observed ahead of the solidification front, which is probably responsible for the curving of the sides of the crystal, yielding orientation and stress fields antisymmetric to the lines across the tips and centers of the opposite sides. An essentially similar, though more noisy coarse grained distribution is obtained in the presence of momentum fluctuations [see Fig. 11(a)].
We observe the formation of dislocations at the interface both with [Fig. 11(b)] and without momentum fluctuations, however at a much later stage in the latter case: In the simulations without noise, we do not observe dislocations below an equivalent radius (, where is the number of particles in the crystallite, see Figs. 10). Beyond this size the stress at the interface is large enough to initiate the formation of cusps, and the nucleation of dislocations in them. A possible mechanism for this can be the Asaro-Tiller-Grinfeld instability ref26 ; ref27 . We find that these misfit dislocations appear at a much smaller size in the presence of momentum noise (). These findings indicate that the fluctuations play a key role in the formation of defects. This conclusion is further supported by a recent PFC study, which has shown that the formation of misfit dislocations is helped by an increasing strength of the density fluctuations ref27 . We note furthermore, that the noise influences the appearance of dislocations, which leads to symmetry breaking ref27 . Apparently, in the presence of density fluctuations the dislocations appear fairly randomly, although normally in cusps forming at the interface.
To test the role of fluctuations further, we have determined the wavenumber spectrum of the density fluctuations in the HPFC model emerging from the momentum fluctuations, and included the same noise in the equation of motion of the diffusive PFC model under the same and values (under these conditions the diffusionless ’fast growth mode’, takes place in the diffusive PFC model ref21 ). Despite these, no GFN was observed in the diffusive PFC model. This observation suggests that under equivalent conditions the diffusive PFC model is less susceptible to defect formation than the HPFC model.
It appears that a combination of faceted growth, a weak depletion at the interface, and the presence of density fluctuations is needed for initiating GFN. Work is underway to investigate further the microscopic aspects of these phenomena.
Summarizing, we applied the HPFC model to solidification problems in 2D. We demonstrated that
(i) radial growth happens at a steady state rate,
(ii) crystallization takes place via homogeneous nucleation and steady state growth, and the respective Avrami-Kolmogorov exponent is ,
(iii) the free growth limited mode of particle induced crystallization ref14 remains valid down to the nanoscale for simple liquids, and
(iv) the model predicts two modes for growth front nucleation.
While (i) to (iii) are important demonstrations of the capabilities of the model, the most significant result is (iv): The HPFC appears to be the first atomic scale model that yields growth front nucleation in the metastable liquid regime. The identification of the basic mechanisms of growth front nucleation in simple liquids might help to control microstructure evolution in such systems.
Acknowledgements.
This work has been supported by NKFIH, Hungary under contract No OTKA-K-115959, by the ESA MAP/PECS projects “MAGNEPHAS III” (Contract No 40000110756/11/NL/KML) and “GRADECET” (Contract No 40000110759/11/NL/KML). G. Tegze is a grantee of the János Bolyai Scholarship of the MTA, Hungary.References
- (1) K. F. Kelton and A. L. Greer, Nucleation in condensed matter (Elsevier, Amsterdam, 2010).
- (2) (a) J. W. Christian, Transformations in Metals and Alloys (Pergamon, Oxford, 1981); (b) W. Kurz and D. J. Fisher, Fundamentals of Solidification (Trans. Tech. Publ., Aedermannsdorff, 1985).
- (3) V. Ferreiro, J. F. Douglas, J. A. Warren, and A. Karim, Phys. Rev. E 65, 042802 (2002); V. Ferreiro, J. F. Douglas, J. A. Warren, and A. Karim, Phys. Rev. E 65, 051606 (2002).
- (4) J. H. Magill, J. Mater. Sci. 36, 3143 (2001).
- (5) L. Gránásy, T. Pusztai, J. A. Warren, J. F. Douglas, T. Börzsönyi, and V. Ferreiro: Nature Mater. 2, 92 (2003); L. Gránásy, T. Pusztai, T. Börzsönyi, J. A. Warren, J. F. Douglas, Nature Mater. 3, 645 (2004); L. Gránásy, T. Pusztai, G. Tegze, J. A. Warren, and J. F. Douglas, Phys. Rev. E 72, 011605 (2005); L. Gránásy, L. Rátkai, A. Szállás, B. Korbuly, G. I. Tóth, L. Környei, and T. Pusztai, Metall. Mater. Trans. A 45, 1694 (2014).
- (6) P. R. ten Wolde, M. J. Ruiz-Montero, and D. Frenkel Phys. Rev. Lett. 75, 2714 (1995); J. F. Lutsko and G. Nicolis, Phys. Rev. Lett. 96, 046102 (2006); T. Schilling, H. J. Schöpe, M. Oettel, G. Opletal, and I. Snook, Phys. Rev. Lett. 105, 027501 (2010); T. Kawasaki and H. Tanaka, Proc. Natl. Acad. Sci. 107, 14036 (2010); H. Tanaka, Eur. Phys. J. E 35, 1 (2012); G. I. Tóth, T. Pusztai, G. Tegze, G. Tóth, and L. Gránásy, Phys. Rev. Lett. 107, 175702 (2011).
- (7) K. R. Elder, M. Katakowski, M. Haataja, and M. Grant, Phys. Rev. Lett. 88, 245701 (2002); K. R. Elder, N. Provatas, J. Berry, P. Stefanovic, and M. Grant, Phys. Rev. B 75, 064107 (2007); K.-A. Wu, A. Adland, and A. Karma, Phys. Rev. E 81, 061601 (2010); M. Greenwood, N. Provatas, and J. Rotter, Phys. Rev. Lett. 105, 045702 (2010).
- (8) For a recent review on PFC models see: H. Emmerich, H. Löwen, R. Wittkowski, T. Gruhn, G. I. Tóth, G. Tegze, and L. Gránásy, Adv. Phys. 61, 665 (2012).
- (9) G. I. Tóth, L. Gránásy, and G. Tegze, J. Phys.: Condens. Matter 26, 055001 (2014).
- (10) B. Z. Shang, N. K. Voulgarakis, and J.-W. Chu, J. Chem. Phys. 135, 044111 (2011).
- (11) A. Baskaran, A. Baskaran, and J. Lowengrub, J. Chem. Phys. 141, 174506 (2014); V. Heinonen, C. V. Achim, J. M. Kosterlitz, S.-C. Ying, J. Lowengrub, and T. Ala-Nissila, Phys. Rev. Lett. 116, 024303 (2016); A. Baskaran, Z. Guan, and J. Lowengrub, Comput. Meth. Appl. Mech. Eng. 299, 22 (2016).
- (12) H. Okumura, Mol. Phys. 104, 3751 (2006); G. De Fabritiis, M. Serrano, R. Delgado-Buscalioni, and P. V. Coveney, Phys. Rev. E 75, 026307 (2007); R. Delgado-Buscalioni, E. Chacón, and P. Tarazona, J. Phys.: Condens. Matter 20, 494229 (2008); N. K. Voulgarakis, S. Satish, and J.-W. Chu, J. Chem. Phys. 131, 234115 (2009); A. Markesteijn, S. Karabasov, A. Scukins, D. Nerukh, V. Glotov, and V. Golovizin, Phil. Trans. R. Soc. A 372, 20130379 (2014).
- (13) E. Pineda, T. Pradell. D. Crespo, N. Clavaguera, and M. T. Clavaguera-Mora, J. Non-Cryst. Solids 287, 92 (2001); L. Gránásy, T. Börzsönyi, and T. Pusztai, Phys. Rev. Lett. 88, 206105 (2002); T. Pusztai, G. Tegze, G. I. Tóth, L. Környei, G. Bansel, Z. Fan, and L. Gránásy, J. Phys.: Condens. Matter 20, 404205 (2008).
- (14) A. L. Greer, A. M. Brunn, A. Tronche, P. V. Evans, and D. J. Bristow, Acta Mater. 48, 2823 (2000); T. E. Quested and A. L. Greer, Acta Mater. 53, 2683 (2005).
- (15) G. I. Tóth, G. Tegze, T. Pusztai, and L. Gránásy, Phys. Rev. Lett. 108, 025502 (2012).
- (16) L. Gránásy, G. Tegze, G. I. Tóth, F. Podmaniczky, and T. Pusztai, Atomistic phase-field approach to crystal nucleation and growth in two and three dimensions. GRC on Thin Films and Crystal Growth Mechanisms, 12-17 July 2009, New London, NH.
- (17) A. J. Archer, M. J. Robbins, U. Thiele, and E. Knobloch, Phys. Rev. E 86, 031603 (2012); A. J. Archer, M. C. Walters, U. Thiele, and E. Knobloch, Phys. Rev. E 60, 042404 (2014).
- (18) K. Barros and W. Klein, J. Chem. Phys. 139, 174505 (2013).
- (19) B. O’Malley and I. Snook, Phys. Rev. Lett. 90, 085702 (2003); Ph. Lambin, A. Loiseau, M. Monthioux, and J. Thibault, in Understanding Carbon Nanotubes, eds. A. Loiseau, P. Launois, P. Petit, S. Roche, and J.-P. Salvetat (Springer, Berlin, Heidelberg, 2006), Chapt. 3, p. 161; T. Koishi, K. Yasuoka, and T. Ebisuzaki, J. Chem. Phys. 119, 11298 (2003).
- (20) T. Yano, Y. Yorikado, Y. Akeno, F. Hori, Y. Yokoyama, A. Iwase, A. Inoue, and T. J. Konno, Mater. Trans. 46, 2886 (2005); P. J. Phillips, IEEE Trans. Electr. Insul. EI 13, 69 (1978); B. Fitton and C. H. Griffiths, J. Appl. Phys. 39, 3663 (1968).
- (21) G. Tegze, G. I. Tóth, and L. Gránásy, Phys. Rev. Lett. 106, 195502 (2011); G. Tegze, L. Gránásy, G. I. Tóth, J. F. Douglas, and T. Pusztai, Soft Matter 7, 1789 (2011).
- (22) For example: K. R. Elder and M. Grant, Phys. Rev. E 70, 051605 (2004); J. Berry, M. Grant, and K. R. Elder, Phys. Rev. E 73, 031609 (2006); A. Adland, A. Karma, R. Spatchek, D. Buta, and M. Asta, Phys. Rev. B 87, 024110 (2013).
- (23) P. Stefanovic, M. Haataja, and N. Provatas, Phys. Rev. Lett. 96, 225504 (2006); S. Majaniemi and M. Grant, Phys. Rev. B 75, 054301 (2007); J. Berry and M. Grant, Phys. Rev. Lett. 106, 175702 (2011); A. Adland, Y. Xu, and A. Karma, Phys. Rev. Lett. 110, 265504 (2013).
- (24) S. Majaniemi, M. Nonomura, and M. Grant, Eur. Phys. J. B 66, 329 (2008).
- (25) R. L. Davidchack and B. B. Laird, J. Chem. Phys. 108, 9452 (1998).
- (26) R. J. Asaro and W. A. Tiller, Metall. Trans. 3, 1789 (1972); M. Grinfeld, Dokl. Akad. Nauk SSSR 290, 1358 (1986) [Sov. Phys. Dokl. 31, 831 (1986)]; Z.-F. Huang and K. R. Elder, Phys. Rev. Lett. 101, 158701 (2008).
- (27) F. Podmaniczky, G. I. Tóth, G. Tegze, and L. Gránásy, Metall. Mater. Trans. A 46, 4908 (2015).