The sensitivity of rapidly rotating Rayleigh–Bénard convection to Ekman pumping
Abstract
The dependence of the heat transfer, as measured by the nondimensional Nusselt number , on Ekman pumping for rapidly rotating Rayleigh–Bénard convection in an infinite plane layer is examined for fluids with Prandtl number . A joint effort utilizing simulations from the Composite Non-hydrostatic Quasi-Geostrophic model (CNH-QGM) and direct numerical simulations (DNS) of the incompressible fluid equations has mapped a wide range of the Rayleigh number – Ekman number parameter space within the geostrophic regime of rotating convection. Corroboration of the – relation at from both methods along with higher covered by DNS and lower by the asymptotic model allows for this extensive range of the heat transfer results. For stress-free boundaries, the relation has the dissipation-free scaling of for all . This is directly related to a geostrophic turbulent interior that throttles the heat transport supplied to the thermal boundary layers. For no-slip boundaries, the existence of ageostrophic viscous boundary layers and their associated Ekman pumping yields a more complex 2D surface in parameter space. For results suggest that the surface can be expressed as indicating the dissipation-free scaling law is enhanced by Ekman pumping by the multiplicative prefactor where . It follows for that the geostrophic turbulent interior remains the flux bottleneck in rapidly rotating Rayleigh–Bénard convection. For , where DNS and asymptotic simulations agree quantitatively, it is found that the effects of Ekman pumping are sufficiently strong to influence the heat transport with diminished exponent and .
I Introduction
Rotation and convection are key components of many geophysical and astrophysical systems, including planetary oceans, atmospheres and interiors, as well as stellar interiors Jones (2007); Marshall and Schott (1999); Miesch (2005). These systems are typically rapidly rotating, highly turbulent and observationally remote, rendering them difficult to study. To investigate the fundamental dynamics of these systems in a simplified setting many investigations employ the Rayleigh–Bénard configuration of a fluid confined between two parallel rotating plates with an imposed buoyancy inducing temperature difference . Complications are further reduced by assuming the rotation, at rate , is aligned with the gravitational axis and using a horizontally periodic Cartesian box for simulations Stellmach et al. (2014); Plumley et al. (2016) or an upright cylinder for experiments Cheng et al. (2015), both with vertical scale .
The rotation of the system can be quantified by the Ekman number , which measures the importance of the Coriolis force relative to viscous dissipation. The Rayleigh number measures the magnitude of thermal forcing relative to dissipative effects. Here is the kinematic viscosity, is the thermal diffusivity, is the thermal expansion coefficient and is gravitational acceleration. The rotational constraint of the system is determined by the Rossby number , a ratio of the strength of the Coriolis force to inertial forces. Here is a characteristic velocity scale, which when expressed as a free-fall velocity gives an a priori measure . The Prandtl number is an attribute of the fluid; for air, . These nondimensional parameters can be tied to the efficiency of the vertical heat transfer in the system through the Nusselt number , where is the heat flux and is the volumetric heat capacity.
The interplay between rotation and buoyancy and the sensitivity of the flow to each of these forces can be examined through the heat transfer scalings of with each parameter. The precise nature of these scalings has become the focal point of both laboratory experiments and numerical simulations due to the relative ease of measuring the Nusselt number and the link between these scalings and the realized flow Aurnou et al. (2015). In fact, the power law scalings provide a proxy for determining the flow morphologies Julien et al. (2012a); Nieves et al. (2014) and once understood, can potentially be used to extrapolate to settings like planetary interiors. Results from numerical simulations have revealed the existence of four flow morphologies with increasing at fixed . These include cellular motions that give way to convective Taylor columns formed out of the instability and synchronization of the thermal boundary layers. This gives way to state of boundary layer plumes which synchronize intermittently. Eventually, the inability of the boundary layers to synchronize gives rise to a state of geostrophic turbulence (GT) in the fluid interior Sprague et al. (2006); Julien et al. (2012a); Nieves et al. (2014); Stellmach et al. (2014).
Assumptions for the functional form of the heat transport scaling law are not unique; one such consideration is
| (1) |
allowing , and to independently determine the sensitivity to fluid type, thermal forcing and rotation, respectively. This choice follows logically from a common strategy within the rotating Rayleigh–Bénard fluids community to either vary the rotation rate while holding fixed to focus on (e.g., Kunnen et al., 2016; Ecke and Niemela, 2014; Weiss et al., 2016) or instead vary the heating at constant rotation to find (e.g., Stellmach et al., 2014). This difference in approach has led to difficulties in consolidating results into a robust scaling theory as the connection between exponents and remains ill-understood. Studies frequently report differing values of the exponents obtained from various slices through the multi-dimensional parameter space Cheng et al. (2015); Kunnen et al. (2016). Accordingly, there has been much debate about the value of the scaling exponents within the field. We proffer that this contention is formed from a lack of insight into the surface in – parameter space and how the directional path of a given study within that parameter space affects the scaling exponents. Admittedly, the paucity of both laboratory and DNS data within the low regime constitutes the primary cause for this situation.
This issue has been resolved for the case of stress-free boundaries with many verifications of the dissipation-free scaling law of , (implying ) for a turbulent interior that throttles the efficiency of the heat transport through the boundary layer regions Julien et al. (2012b); Stellmach et al. (2014); Kunnen et al. (2016). Thus
| (2) |
for stress-free boundaries. This relation can be further rearranged as
| (3) |
illustrating that the heat transport is controlled solely by a supercriticality parameter through the reduced Rayleigh number ; a parameter that appears naturally in the asymptotic theory of rotating convection Chandrasekhar (1961). More generally, a sole dependence of the scaling law (2) on and implies , indicating the expectation that the heat transport law can be uncovered by measurement at either fixed or .
We note specifically that the Ekman dependence in the supercriticality parameter arises as a consequence of critical Rayleigh number for rotating convection Chandrasekhar (1961), thus . This should be juxtaposed with the non-rotating problem where is a fixed constant which results in a direct parameter-independent link between and the supercriticality parameter, such that .
For no-slip boundary conditions, King et al. (2012) first proposed a scaling law akin to the Malkus–Howard Malkus (1954) theory requiring the thermal boundary layers to be marginally stable. Consistent with , this produced scaling exponents and . Neither this result nor the stress-free result is observed Julien et al. (2016); Plumley et al. (2016); Kunnen et al. (2016); Cheng et al. (2015); Aurnou et al. (2015) and it is now generally accepted that the presence of Ekman pumping associated with no-slip boundaries further complicates the heat transport scaling law. Progress towards an understanding of this fundamental interaction for the case of no-slip boundaries has been furthered through a collaborative effort combining heat transfer data from asymptotic theory Julien et al. (2016), direct numerical simulations Stellmach et al. (2014); Kunnen et al. (2016), and laboratory experiments Cheng et al. (2015); Ecke and Niemela (2014).
Here we present an empirical investigation of the asymptotic heat transfer scaling appropriate for fluids with no-slip boundaries. We focus on fluids because it is known to rapidly enter the regime of geostrophic turbulence as a function of buoyancy forcing Julien et al. (2012a); Nieves et al. (2014). Presently, it is the only case for which data from DNS and asymptotic models exist for the geostrophic turbulence regime. Laboratory experiments still trail in their ability to access this regime Ecke and Niemela (2014); Aurnou et al. (2015). The asymptotic model, referred to as the composite non-hydrostatic quasi-geostrophic model (CNH-QGM) is valid in the limit Julien et al. (2016). It imposes a pointwise geostrophic balance where the Coriolis force is balanced by the pressure gradient force. Buoyantly driven fluid motions then evolve under the dominant action of horizontal inertial advection and horizontal dissipation. Currently, this model represents the only means of probing the turbulent – low regime of rotating Rayleigh–Bénard convection.
One aim of this work is to explore how different scalings can coexist within the complex parameter space for no-slip boundaries. This is addressed through an analysis of runs for both fixed and and the consolidation of these results to form a surface of over a range of and . We utilize a combination of results obtained from DNS Stellmach et al. (2014); Kunnen et al. (2016) at and above the current lower bound of and the asymptotic CNH-QGM for Julien et al. (2016). The fidelity of this model was verified with DNS at for in Plumley et al. (2016). While visually helpful, the complexities of the surface render it difficult to characterize analytically. However, low Ekman results can be utilized to quantify the effect of pumping within the GT regime. A key question we address is to what extent Ekman-pumping disrupts the ability of the geostrophic turbulent interior to throttle the heat flux through the layer. This may be understood by assessing the departure from the dissipation-free scaling law (3). Inherent in this statement is the need to produce a heat transport scaling law that provides an understanding of measurements obtained from different pathways through – parameter space.
II Stress-free results
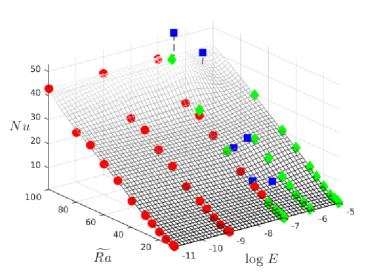
In figure 1 we illustrate the 2D surface obtained for in – parameter space. The surfaces were generated from a combination of DNS and CNH-QGM data and the MATLAB scattered_interpolant and gridded_interpolant functions. A coarse mesh surface is created from all the scattered data, where the scattered_interpolant function generates a continuous surface of the given data points using linear interpolation. This surface is then smoothed using the spline option of the gridded_interpolant function to reduce any artificial variations.
Evident from this surface is the delayed onset of convection for increasing rotation rates (decreasing ) where for Chandrasekhar (1961) (see dashed line). Also observable is the excellent quantitative agreement between DNS and CNH-QGM data at . However, we find the –– surface of less visual utility in comparison to ––, which has the added benefit of providing equivalence in the supercriticality for differing (figure 2).
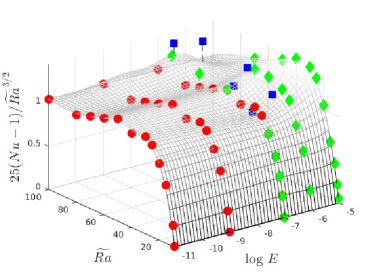
As noted, in the case of stress-free boundaries, exponents in (3) can be predicted by seeking the turbulent dissipation-free scalings and , and from (1) it follows . This scaling holds for all Julien et al. (2012b), thus creating a simple 2D surface in –– parameter space (figure 2). For , it is observed that the contours are parallel to the axis confirming the appropriateness of the supercriticality parameter . Departure from the planar surface is visible for which may be taken as evidence of a breakdown in the asymptotic regime. The features of the surface are more pronounced in the compensated surface normalized by the scaling law (figure 3). Approximate surface values of unity indicate the region in – space obeys the dissipation-free scaling law (1) for geostrophic turbulence. It also implies in (4) for the stress-free surface as expected given the absence of Ekman pumping.
III No-slip results
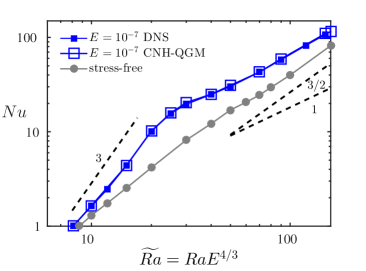
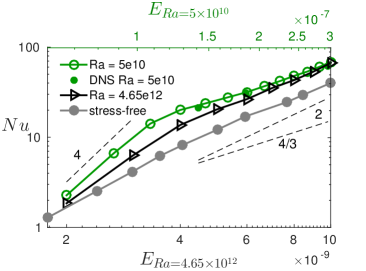
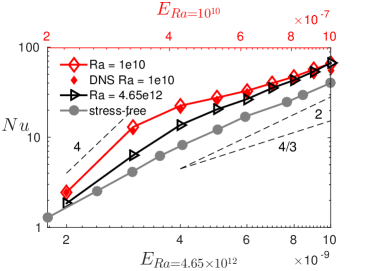
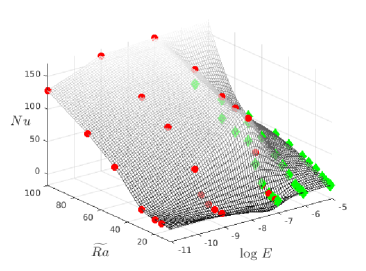
The presence of no-slip boundaries in low Rossby-number convection requires the attenuation of the interior velocity field to zero within an Ekman boundary layer Greenspan (1968); Julien et al. (2016). Within this layer geostrophic balance is lost and a relaxation of the associated horizontal non-divergence of the axial vortical field must occur. This results in Ekman pumping (and suction) for local cyclonic (anticyclonic) motions. We refer to this phenomena generically as Ekman pumping where the strength of the dimensional vertical pumping velocities, , can be related directly to the local vortical motions, , via a classical linear boundary layer analysis, i.e., Greenspan (1968). It has been shown Julien et al. (2016) that despite the dependence, there exists a transitional where vortical motions intensify sufficiently so pumping remains finite in the limit of rapid rotation, i.e., . Thus comparative differences with the stress-free case are to be expected. One example is the enhancement of the convective heat flux and large increases in the heat transport. The increase in heat transport has been investigated and confirmed by DNS at Stellmach et al. (2014) and by the CNH-QGM for Plumley et al. (2016); Julien et al. (2016) for fixed explorations. The quantitative overlap of results at (Figure 4), which represents a current lower bound for DNS and upper bound for the CNH-QGM, supports the validity of both methods in their respective parameter regions.
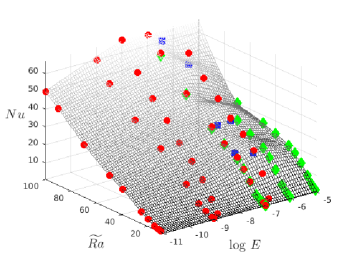
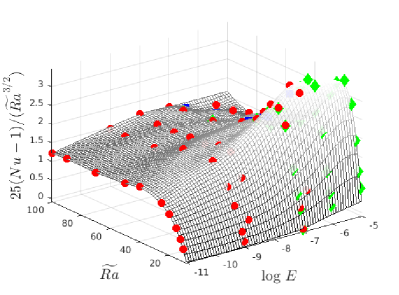
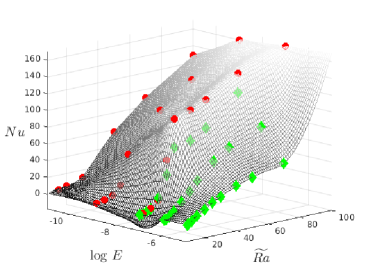
Results from DNS Stellmach et al. (2014); Kunnen et al. (2016) and the CNH-QGM along different pathways through parameter space are combined to create a surface of the heat transfer for the no-slip case. The surface illustrated in figure 5 is a markedly different and more complex surface in comparison with the stress-free surface of figure 2. Specifically, contours at fixed are no longer parallel to the -axis. As illustrated in the figure, the effect on the heat transfer is nontrivial even at Plumley et al. (2016), due to the addition of Ekman pumping. Also evident are the much higher slopes in the lower regime Stellmach et al. (2014); Plumley et al. (2016) where the cellular morphology occurs Julien et al. (2012a).
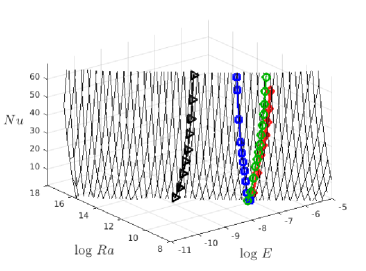
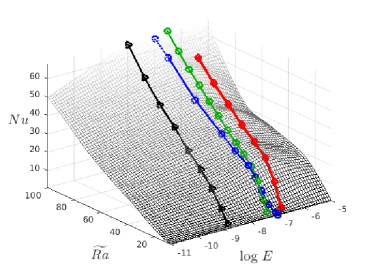
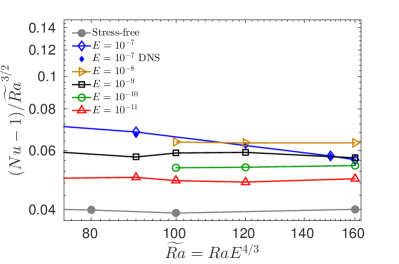
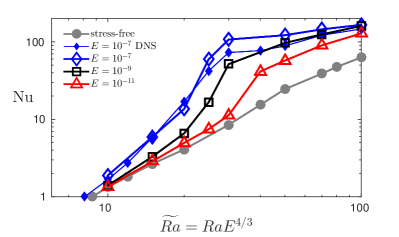
Figure 6 shows the heat transfer results for cross-sections through parameter space at fixed . The result at (upper plot), with near , shows agreement between DNS Kunnen et al. (2016) (3 data points) and the CNH-QGM. These curves do display a loss of agreement towards the upper range of , which is especially evident for the data (lower plot). This divergence signals a break down of validity for the CNH-QGM for values near .
The transition of the no-slip curves away from the stress-free curve (gray line, figure 6) can be predicted by or as found in Julien et al. (2016) and fit with (Plumley et al., 2016). For all of the curves in figure 6, the transition occurs below the lowest plotted; for example, the constant data has a predicted transitional . Within the cellular regime (), the slopes are much higher than the stress-free slopes, nearing in figure 4 and equivalently in figure 6 before the transition to the GT regime. This is consistent with recent laboratory and DNS investigations Cheng et al. (2015). The transition from the cellular to GT regimes occurs when the horizontally averaged temperature gradient reaches its minimum and the slope stabilizes at a finite value, indicating unstable stratification in contrast to an isothermal interior Julien et al. (2012a).
In figure 7 the curves obtained at fixed and fixed (figures 6 and 4 respectively) are illustrated as pathways on the and surfaces. The directionality of fixed or is clear in the figure, although an asymptotically more useful view is obtained for , where the constant lines appear as diagonal cross sections. Unlike the stress-free surface, the complexities extend below .
III.1 Quantifying the effects of pumping within the low , GT regime
For comparison with the stress-free surface, the no-slip surface is compensated by the dissipation-free results (3) in figure 8. This makes explicit the enhancement due to Ekman pumping as the surface appears to be a plane, with height greater than , that is tilted upwards with in the high - low domain. This implies that the stress-free fit is a useful base model for the no-slip curve at high , which only requires alteration to account for the increase in the heat transfer.
The enhancement can be directly computed from the compensated heat transfer results obtained for cross-sections at multiple values of fixed as plotted in figure 9. For an important observation is the evolution of the compensated curves to the dissipation-free exponent for . This is more explicit in a blow up of the region (figure 10).
The data exhibits no such convergence to in this region and continues to decrease with . Instead we observe that, in addition to multiplicative effects, the ageostrophic effect of Ekman pumping now diminishes the heat transport efficiency to exponent . The transition to a self-similar scaling regime (3) thus occurs for . This elicits a few remarks. Given that represents an established quantitative benchmark between DNS and CNH-QGM data this supports an extended range of for which the CNH-QGM is valid. Despite this endorsement of the CNH-QGM model, the result complicates the understanding of the enhancement as it appears entering the self-similar regime is associated with non-monotonic behavior in . Indeed, given that CNH-QGM is geostrophically balanced in both interior and thermal boundary layer, the result cannot be attributed to loss of geostrophic balance in the latter. The transition for loss of balance has been predicted in Julien et al. (2012b) to be given by (or equivalently ). Thus, the exploration of parameter space implies . It then appears that the observed non-monotonicity, captured by the DNS and CNH-QGM, can be attributed solely to the ageostrophic effects of the Ekman pumping and the associated Ekman boundary layer.
The influence of pumping on the heat transfer for is also visible in figure 6 for the curves with constant (green circles) and (red diamonds). These curves show , demonstrating that the heat transfer slope is similarly diminished from the stress-free result (of ) as for the constant data. However, the curve at higher () reaches the self-similar regime and runs parallel to the stress-free result with .
This can be understood as a Rossby number effect. Departures from the stress-free scaling exponents are expected for larger . For the three curves in figure 6, the Rossby number ranges within the GT regime are for the data (red diamonds), for the data (green circles) and for the data (black triangles). The Rossby number acts as a control parameter and for high the results depart from the expected scaling behavior. This is confirmed in figure 10 as the curves follow the expected scaling behavior for the runs with lower (lower ). For the data at , , whereas for and , , and only the – lower curves result in the self-similar solution.
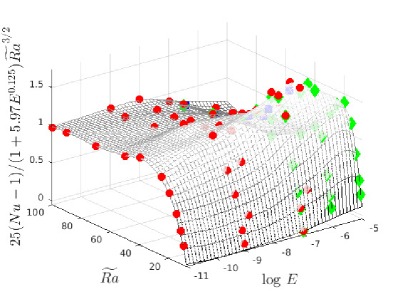
The combination of observations from figures 5, 8, and 10 leads to (4), where accounts for the vertically shifted increase and the decreasing impact of Ekman pumping as . Therefore, we propose for the self-similar regime. The values of and can be fitted from the values of the curves in figure 10. Additional points for and were calculated to supply four points to fit, and the was not included. Using the increase for each in relation to the stress-free value at , and provides an empirical estimate of the expected increase due to pumping within the GT regime. Thus, for ,
| (5) |
From the viewpoint of probing the geostrophic regime by decreasing , the exponent indicates a slow decrease in the effect of Ekman pumping. Indeed, given the amplification factor , a relative difference of requires . This is a bound satisfied by rotating convection in most planetary and stellar objects Aurnou et al. (2015).
Figure 11 shows the surface compensated according to (5). The high values compress to a compensated value , showing that the fit captures the expected curves well in this region. The low , high still shows variations in the surface. This region is characterized by cellular motions rather than GT and is not expressed as well in the fit.

Another way to examine the no-slip results is to ignore the scaling laws and instead compare the ratio of , where the subscripts denote either no-slip (NS) or stress-free (SF) values. Figure 12 shows the results of this calculation. The majority of the plot shows that this ratio is bounded by 2 and the surface is relatively flat. This simultaneously indicates a bound on the enhancement due to Ekman pumping and highlights the similarity in the efficiency of heat transport as measured by the exponents for both the stress-free and no-slip cases. The strong effect of Ekman pumping within the cellular regime is also observed in this figure in the low , high domain.
IV Conclusions
The heat transfer scalings as function of thermal forcing and rotation rate are a primary focus of rotating convection studies. However thermal and mechanical difficulties, and issues of numerical stability, limit laboratory experiments and DNS to . This value is known to be on the boundary for probing geostrophic dynamics Ecke and Niemela (2014). Different approaches for entering the geostrophic regime (fixed or ) have also produced results that appear incompatible. We have demonstrated that the surface is complex and that by mapping the full 2D surface of results the aforementioned incompatibility can be understood as cross-sections through the surface in different directions.
Indeed, the surfaces show that any observed scaling exponent is dependent on the particular cross-section through - parameter space. The surface highlights the vertical shift of the heat transport results from the stress-free to no-slip cases as well as the additional dependence caused by pumping. This dependence creates a more convoluted surface as the heat transfer is a non-monotonic function of even within the geostrophic regime. The deviation from the simplified 1D stress-free slope emerges from the dependence of the Ekman pumping velocity for no-slip boundaries. Thus, varying at fixed for the no-slip case continuously varies the strength of pumping and adds greater complexity in understanding the results despite the ease of experimental design.
For low and high , the results reach an utlimate scaling that is used to characterize this section of parameter space. Utilizing the stress-free scaling law as a guide and fitting the heat transfer enhancement due to pumping, the scaling law applies for the no-slip case.
We finally note that a majority of laboratory experiments for RRBC are performed for water where . Mapping the surface for (or other ) is complicated by a lack of laboratory and numerical data in the geostrophic regime, and a reduced overlap of results at between DNS and the CNH-QGM Plumley et al. (2016). The difficulties are compounded by the extended range of parameter space dominated by columnar or plume structures for Sprague et al. (2006). Such coherent structures act as conduits for efficient heat transfer and most likely do not reflect the ultimate characteristics of geostrophic turbulence that has been shown to throttle the heat flux. The present status of the 2D surface is illustrated in figure 13. The increased magnitude of resulting from the columnar morphology is evident in the diagram when compared to the results in figure 2. However, we note that after a steep increase in the - curve at fixed the slope appears to be settling into a regime that bears similarity with the dissipation-free regime observed for (Figure 14). Future results by the UCLA Spinlab, Eindhoven TROCONVEX, and Gottingen Uboot laboratory experiments should help by adding data at higher to this surface for .
Acknowledgments
This work was supported by NASA Headquarters under the NASA Earth and Space Science Fellowship Program (M.P.) and the National Science Foundation under EAR grants #1320991 & CSEDI #1067944 (K.J., P.M.). S.S. gratefully acknowledges the Gauss Centre for Supercomputing (GCS) for providing computing time through the John von Neumann Institute for Computing (NIC) on the GCS share of the supercomputer JUQUEEN at Jülich Supercomputing Centre (JSC) in Germany. This work utilized the NASA Pleiades supercomputer and the Janus supercomputer, which is supported by the National Science Foundation (award number CNS-0821794) and the University of Colorado Boulder.
References
- Jones (2007) CA Jones, “Thermal and compositional convection in the outer core,” Treatise in Geophysics, Core Dynamics 8, 131–185 (2007).
- Marshall and Schott (1999) J. Marshall and F. Schott, “Open-ocean convection: Observations, theory, and models,” Reviews of Geophysics 37, 1–64 (1999).
- Miesch (2005) M. S. Miesch, “Large-scale dynamics of the convection zone and tachocline,” Living Reviews in Solar Physics 2 (2005), 10.12942/lrsp-2005-1.
- Stellmach et al. (2014) S. Stellmach, M. Lischper, K. Julien, G. Vasil, J. S. Cheng, A. Ribeiro, E. M. King, and J. M. Aurnou, “Approaching the asymptotic regime of rapidly rotating convection: Boundary layers versus interior dynamics,” Phys. Rev. Lett. 113, 254501 (2014).
- Plumley et al. (2016) Meredith Plumley, Keith Julien, Philippe Marti, and Stephan Stellmach, “The effects of ekman pumping on quasi-geostrophic rayleigh–bénard convection,” Journal of Fluid Mechanics 803, 51–71 (2016).
- Cheng et al. (2015) J. S. Cheng, S. Stellmach, A. Ribeiro, A. Grannan, E. M. King., and J. M. Aurnou, “Laboratory-numerical models of rapidly rotating convection in planetary cores,” Geophysics Journal International 201, 1–17 (2015).
- Aurnou et al. (2015) J. M. Aurnou, M. A. Calkins, J. S. Cheng, K. Julien, E. M. King, D. Nieves, K. M. Soderlund, and S. Stellmach, “Rotating convective turbulence in earth and planetary cores,” Physics of the Earth and Planetary Interiors 246, 52–71 (2015).
- Julien et al. (2012a) K. Julien, A. M. Rubio, I. Grooms, and E. Knobloch, “Statistical and physical balances in low Rossby number Rayleigh-Bénard convection,” Geophysical & Astrophysical Fluid Dynamics 106, 392–428 (2012a).
- Nieves et al. (2014) D. Nieves, A. M. Rubio, and K. Julien, “Statistical classification of flow morphology in rapidly rotating Rayleigh-Bénard convection,” Physics of Fluids 26, 086602 (2014), http://dx.doi.org/10.1063/1.4892007.
- Sprague et al. (2006) M. Sprague, K. Julien, E. Knobloch, and J. Werne, “Numerical simulation of an asymptotically reduced system for rotationally constrained convection,” Journal of Fluid Mechanics 551, 141–174 (2006).
- Kunnen et al. (2016) R. P. J. Kunnen, R. Ostilla-Mónico, E. P. van der Poel, R. Verzicco, and D. Lohse, “Transition to geostrophic convection: the role of the boundary conditions,” Journal of Fluid Mechanics 799, 413–432 (2016).
- Ecke and Niemela (2014) R. E. Ecke and J. J. Niemela, “Heat transport in the geostrophic regime of rotating Rayleigh-Bénard convection,” Phys. Rev. Lett. 113, 114301 (2014).
- Weiss et al. (2016) Stephan Weiss, Ping Wei, and Guenter Ahlers, “Heat-transport enhancement in rotating turbulent Rayleigh-Bénard convection,” Phys. Rev. E 93, 043102 (2016).
- Julien et al. (2012b) Keith Julien, Edgar Knobloch, Antonio M. Rubio, and Geoffrey M. Vasil, “Heat transport in low-rossby-number Rayleigh-Bénard convection,” Phys. Rev. Lett. 109, 254503 (2012b).
- Chandrasekhar (1961) S. Chandrasekhar, Hydrodynamic and Hydromagnetic Stability (Oxford University Press, Oxford, 1961).
- King et al. (2012) E. M. King, S. Stellmach, and J. M. Aurnou, “Heat transfer by rapidly rotating Rayleigh-Bénard convection,” Journal of Fluid Mechanics 691, 568–582 (2012).
- Malkus (1954) W. V. R. Malkus, “The heat transport and spectrum of thermal turbulence,” Proc. R. Soc. A 225, 196–212 (1954).
- Julien et al. (2016) K. Julien, J. Aurnou, M. Calkins, E. Knobloch, P. Marti, S. Stellmach, and G. Vasil, “A nonlinear model for rotationally constrained convection with ekman pumping,” Journal of Fluid Mechanics 798, 50–87 (2016).
- Greenspan (1968) H. P. Greenspan, The Theory of Rotating Fluids (Cambridge University Press, Cambridge, United Kingdom, 1968).