Gram-scale cryogenic calorimeters for rare-event searches
Abstract
The energy threshold of a cryogenic calorimeter can be lowered by reducing its size. This is of importance since the resulting increase in signal rate enables new approaches in rare-event searches, including the detection of MeV mass dark matter and coherent scattering of reactor or solar neutrinos. A scaling law for energy threshold vs. detector size is given. We analyze the possibility of lowering the threshold of a gram-scale cryogenic calorimeter to the few eV regime. A prototype 0.5 g Al2O3 device achieved an energy threshold of ) eV, the lowest value reported for a macroscopic calorimeter.
pacs:
Valid PACS appear hereI Introduction
Cryogenic calorimetry [Stodolsky, 1991] is based on the idea that the temperature rise in a target after an energy deposition is given by
| (1) |
where is the heat capacity of the object. A small , which can be achieved in crystalline materials at mK temperatures, leads to a large temperature jump and so to a high sensitivity to small energies. State-of-the-art cryogenic detectors with a mass of g have reached energy thresholds down to eV [Angloher et al., 2016].
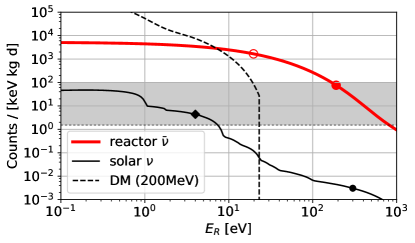
A further reduction of the threshold is of great interest since for many important processes, such as coherent neutrino nucleus scattering (CNNS) or the scattering of the hypothetical dark matter (DM) particles, the count rate increases strongly as the threshold of a detector is lowered. In Fig. 1 we show the count rate in a CaWO4 detector for various processes as a function of the recoil energy : For CNNS of anti-neutrinos at a distance of 40 m from a 4 GW nuclear power reactor (thick full line), for a hypothetical DM particle with a mass of 200 MeV/c2 and a cross-section of 1 pb (dashed line), and for CNNS of solar neutrinos (full line). Measured background rates at different shallow low-background facilities Gastrich et al. [2016], Akerib et al. [2010], extrapolated to lower energies, are shown as a grey band. The lower limit (dotted line) indicates the present fundamental background limitation due to the intrinsic radiopurity of CaWO4 crystals, as measured deep underground Strauss et al. [2015]. One observes that a threshold in the 10 eV regime can allow the count rates to rise significantly above background levels. Below, we show that a rapid detection of CNNS at a nuclear reactor is in reach and that the technology offers unique possibilities for the detection of MeV-scale DM and solar neutrinos.
Since macroscopic amounts of target material are necessary to obtain reasonable count rates for such weak interaction processes, microscopic calorimeters with target masses below milligrams are impractical for rare-event searches. Here we describe how it is possible to achieve a suitably low threshold with a small but macroscopic calorimeter, and present the results of a 0.5 g prototype.
II Gram-scale cryogenic calorimeters
A straight forward application of Eq. 1 would seem to suggest that an improved response for small energies is to be achieved by simply reducing by lowering the temperature or using smaller devices [Stodolsky, 1991].
However, there are some subtleties in applying Eq. 1. For example it may apply not to the whole device in question, but to some sensitive subsystem. This explains why we obtain results with macroscopic devices, on the order of grams in mass, which one would have thought only possible with very small or microscopic systems. Below we report an energy threshold of eV – which is in the order of atomic binding energies – for a 0.5 g device operated under unshielded conditions.
II.1 Pulse height
To understand this apparently surprising result, we consider the operation of the detectors similar to those used in CRESST (Cryogenic Rare Event Search with Superconducting Thermometers) for direct dark matter search [Angloher et al., 2016, 2012]. These detectors operate out of thermal equilibrium after an energy deposition. The signal originates from the initial ballistic non-thermal phonons of the particle event occuring in the absorber crystal. The deposited energy is measured using a superconducting transition-edge-sensor (TES). This is explained at length in Ref. [Pröbst et al., 1995], and we use the terminology and notation of this reference. In particular we deal with detectors operating in the calorimetric mode (section 3.3.1 in [Pröbst et al., 1995]), where the film thermalizes slowly with respect to the signal duration and so integrates the energy of the incoming non-thermal phonons. This results in a temperature rise in the thermometer film given by
| (2) |
where is the fraction of the deposited energy thermalized in the film, and is the heat capacity of the electrons in the film.
Since is the energy absorbed in the film, Eq. 2 amounts to Eq. 1, but applied to the electrons of the superconducting film. Their temperature rise and thus our readout signal is given by a pulse whose magnitude originates in a microscopic system, although the detector itself is macroscopic.
A fundamental limitation only arises through the fact that for very small a body coupled to a heat bath has large irreducible temperature fluctuations [Moseley et al., 1984], where we use . This corresponds to theoretical energy resolutions of (1 eV) for massive calorimeters with masses of g [Formaggio et al., 2012]. This is not a significant limitation for the detectors we consider ( for the W film used here), but it does set a limit on an indefinite reduction of .
II.2 Scaling law
A simple scaling law enables us to extrapolate results with previous CRESST detectors to smaller sizes. This is possible on the basis of Eq. 2. We are interested in the threshold energy , which is inversely proportional to the temperature rise for a given energy deposition.
We arrive at the following approximate scaling law for threshold energy vs. detector mass :
| (3) |
The proportionality constant will depend on the material and geometry but not on the size of the crystal. Further, constant noise conditions and a similar performance of the TES sensors is assumed.
Eq. 3 results from Eq. 2 as follows. The appearance of , representing the fraction of the original non-thermal phonons thermalizing in the film shows that the main effect entering in Eq. 2 is the competition between the thermalization in the superconducting film and the thermalization on the surfaces of the crystal. We expect that is small due to the great difference in the respective surface areas and is simply given the ratio of thermalization rates which we write as . Taking the ratio for the film and crystal surface one has , where the refer to material properties and the to the surface areas. Inserting in Eq. 2 and keeping only factors related to size, one obtains
| (4) |
where we have left out all factors that do not depend on the crystal size in the last step. has cancelled because , and the films all have about the same thickness . Eq. 4 shows that the main effect in reducing the size of the crystals is to reduce their surface area and so increase the signal correspondingly. For a cube one has and where is the edge length. Since the threshold varies inversely to the pulse height or , we obtain Eq. 3.
Fig. 2 shows the scaling law for CaWO4 (dashed line) and Al2O3 (dotted line) calorimeters versus mass operated in the CRESST low-background setup, here referred to as benchmark setup.
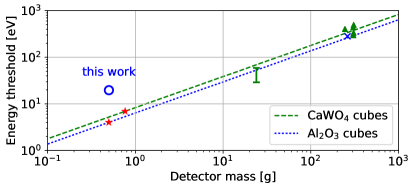
The offset between the dashed and dotted lines is due to the different density and sound-speed of the materials and due to material-dependent transmission properties of phonons into the superconducting film (total factor 0.77). The model is fitted to the results of CaWO4 detectors with g (triangles) used in CRESST-II [Angloher et al., 2014, 2016] and a Al2O3 cube of 262 g (cross) used in CRESST-I [Meier et al., 2000]. The scaling law nicely matches the performance of 24 g CaWO4 detectors for CRESST-III as infered from a above-ground measurement [Strauss et al., 2017a]. The error bar indicates the threshold range of this device when operated in the benchmark setup depending on the noise level of the individual readout channel Strauss et al. [2017a]. Red stars show the projected performance of () mm3 CaWO4 and Al2O3 calorimeters. Below we discuss the result of a prototype 0.5 g Al2O3 detector operated in a surface test setup (blue circle).
III Results from a prototype
For the first test of a gram-scale calorimeter, an Al2O3 cube of () mm3 with a mass of 0.5 g was used. All surfaces were optically polished. The cube was equipped with a W thin film TES similar to those used for CRESST light detectors [Angloher et al., 2009]. The TES design was adjusted for operation in the “calorimetric mode” [Pröbst et al., 1995] on the cubic crystal.
The data presented here were acquired in a cryostat at the Max-Planck-Institut (MPI) for Physics in Munich, Germany. The setup at surface-level had no shielding against environmental radio-activity or cosmogenic backgrounds. The crystal was placed on three Al2O3 spheres with a diameter of 1 mm resting on a copper plate and providing point-like contacts. From the top, a bronze clamp (with a central Al2O3 sphere) presses on the cube. The electrical and thermal connections are realized by Al and Au wire bonds (diameter 25 m), respectively. The cryostat reached a base temperature of 6 mK and the mixing chamber was stabilized during the measurement at 11 mK. The W TES on the Al2O3 crystal showed a normal-to-superconducting transition at 22 mK. Commercial SQUID magnetometers and a state-of-the-art data acquisition system were used [Angloher et al., 2012].
A 55Fe X-ray calibration source with an activity of 0.6 Bq was installed about 2 cm from the Al2O3 cube. The detector was neither shielded against external radiation nor against radioactivity originating from materials and surfaces inside the experimental volume. The data amount to a total measuring time of 5.3 h corresponding to an exposure of 0.11 g-days. The total particle pulse rate was 0.36 Hz of which % was from the X-ray lines of the 55Fe calibration source.
The particle pulses can be well described by the thermal model for cryogenic detectors [Pröbst et al., 1995]. A fit of the model to the template pulse confirms that the Al2O3 detector is operating in the calorimetric mode. The rise time, which corresponds to the life time of the non-thermal phonons, is ms. The two decay times of the model, which depend on the thermal couplings of the TES and the absorber crystal to the thermal bath, are found to be ms and ms.
III.1 Energy Calibration
The energy of an event is inferred from its pulse height. The pulses were fitted by a template pulse extracted from an energy region were the pulse response is completely linear, in this case around V, which corresponds to an energy of about keV. The detector response becomes increasingly non-linear at about 3 keV. To reconstruct the energy of large, saturated, pulses the method of a truncated template fit was used, a standard method in cryogenic calorimetry (see e.g. [Angloher et al., 2009]). The pulse shape is fitted in the linear region up to the truncation limit, which here is chosen at 0.4 V. Fig. 3 (upper frame) shows a 100 eV pulse which is nicely fitted by the template pulse (red line).
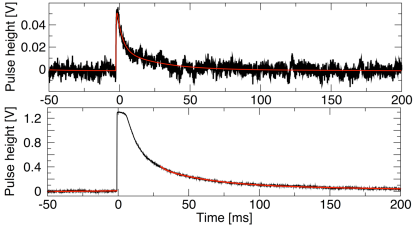
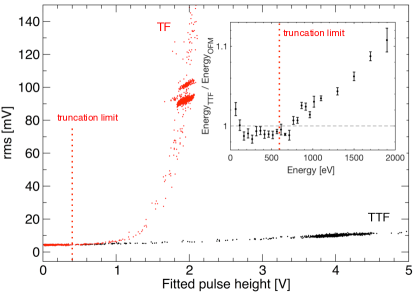
In comparison, a 5.9 keV pulse from the 55Fe source (lower frame) is depicted. The event is only fit up to the truncation limit. Above this limit the pulse shapes deviate from that of the template. Fig. 4 (main frame) shows the fit goodness (rms value) of the truncated template fit (black) in comparison to a template fit without truncation (red). The truncated fit shows no significant energy dependence of the rms values over the considered energy range. The slight rise (factor of ) is expected since only part of the recorded pulse samples are exploited for the energy reconstruction. Without truncation, the fit fails above the linear region since the pulse shape of the events deviates significantly from the template.
The dominant Kα line (keV) is found to have a pulse height of (3.9250.003) V and is used for the calibration of the pulse spectrum. The energy of the line on the right shoulder is then found at an energy of keV, which is in good agreement with the literature value of 6.490 keV.
The energy reconstruction of the calibration line is robust against a change of the truncation limit. A variation of 20% corresponds to a moderate error of 1.1% on the energy calibration. This value is considered as a systematic error for the energy threshold (see below). Even a dramatic variation of the truncation limit by a factor of 2 changes the reconstructed pulse height of the X-ray lines by only %.
III.2 Energy spectrum
Fig. 5 shows the final energy spectrum up to 10 keV after stability and (standard) data quality cuts (see e.g. [Angloher et al., 2016, 2014]).
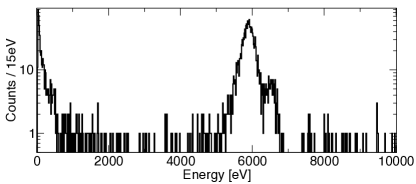
The energy resolution of the reconstructed X-ray lines is keV which is significantly larger than the baseline resolution at zero energy, as determined from the variance of the baseline (see below). Part of this degradation (41%) is due to the truncated fit that uses only partial information of pulses at higher energies ( eV), as shown in Fig. 3 (bottom). The remaining energy dependence of the detector resolution (by factor of 23 at 5.9 keV) was observed previously for cryogenic Al2O3 detectors and matches the results of [Sisti et al., 2001].
The measurement shows a constant background rate of counts/[kg keV day] (7-10 keV) above the calibration peaks, see Fig. 5. This background rate is not unexpected due to the lack of any shielding against ambient and cosmogenic backgrounds. At lower energies ( keV) the event rate significantly rises towards threshold. Auger electrons from the 55Fe source and surface-contamination induced backgrounds are the most plausible explanation for this increase.
Earlier results of cryogenic detectors operated in low-background setups, e.g. [Angloher et al., 2016], show a flat background on a level of 10 counts/[kg keV day] (4-5 orders of magnitude lower compared to this measurement) down to the threshold energy of 300 eV. This clearly demonstrates that by a proper selection of the materials surrounding the detector, the surface background contribution can be drastically reduced. An active veto system by using Si slabs equipped with TESs which surround the calorimeter is planned. A dedicated Monte Carlo study shows that surface backgrounds can be reduced to negligible values Strauss et al. [2017b].
III.3 Threshold determination
For the pulse height evaluation at low energies, the optimum filter method is used (see e.g. [Gatti and Manfredi, 1986, Piperno et al., 2011]). The optimum filter maximizes the signal-to-noise for a known signal, in our case the template pulse, in the presence of stochastic noise with a known power spectrum. To build the filter transfer function, the Fourier transform of the template pulse and the noise power spectrum are required. Here, the latter is derived from randomly chosen baseline samples. In the selection of the baseline samples the same quality cuts were applied as for the pulse samples. In the frequency domain, the optimum filter weights the spectral components according to their signal-to-noise ratio. Usually the filter is applied in frequency space to minimize the computing time and is then transformed back to the time domain. The result is normalized so that it reproduces the unfiltered pulse height at the pulse’s maximum (see Fig. 6, left). The energy reconstruction by the optimum filter agrees with that of the truncated template fit on a 1%-level in the linear region (up to 600 eV) and deviates significantly above as expected due to a different pulse-shape caused by saturation (see Fig. 4, inset). Below the truncation limit, a maximal deviation of 2.8 % is observed which is considered as systematic error of the energy calibration.
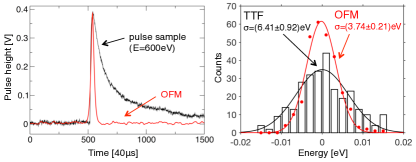
The baseline energy resolution after filtering is found to be eV. This compares to a value of eV without filtering, showing a clear improvement (see Fig. 6, right). Accordingly, this effect reduces the energy threshold. This improvement can be exploited using a data acquisition system which continuously streams the detector output, so that the pulse-triggering can be done in post-processing, when signal and noise power spectra are known.
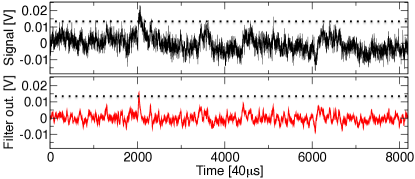
The functionality of such a software trigger based on the optimum filter is illustrated in Fig. 7. A small artificial pulse is superimposed on a randomly selected baseline sample, drawn in the upper frame. The lower frame shows the optimum filter output. The artificially added pulse clearly is seen above a given threshold (dotted line), while the random noise, which has a different pulse shape, is suppressed.
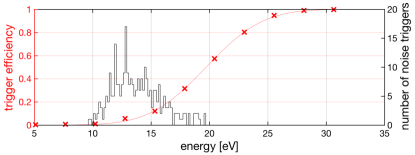
In the following we discuss how the energy threshold and the trigger efficiency can be determined in a direct way. Generally speaking, the threshold on the output of the optimum filter has to be chosen so as to be sensitive to the smallest possible energy depositions, while at the same time suppressing noise triggers sufficiently. Fig. 8 (histogram, right axis) shows the filter output of a set of pure noise samples. In contrast to the determination of the baseline noise (see above), the pulse position (in time) is not fixed but the algorithm runs over the noise trace and returns the maximal filter output. This explains the positive average reconstructed energy. The bulk of the noise samples have a reconstructed energy between 10 and 15 eV with a tail up to eV. Most probably the latter is due to small pulses on the noise samples which can not by identified by data-quality cuts selecting the noise samples. This effect is enhanced due to the exponentially increasing rate towards threshold in this calibration measurement. It is reasonable to set the trigger threshold just above this assumed noise population.
We choose a trigger threshold of 13.0 mV and validate this choice by a study of the trigger efficiency as a function of energy. Onto the set of baseline samples, template pulses of various discrete pulse heights (from about 1 to ) are added. The energy dependent trigger efficiency is the fraction of the filtered artificial pulse samples which fall above the threshold. Fig. 8 (left axis) shows the results of this procedure for the discrete pulse heights (crosses). The resulting curve can be nicely fitted by the function , where erf is the Gaussian error function [Angloher et al., 2014]. The validity of the threshold choice manifests itself as a vanishing trigger efficiency at low energies, corresponding to negligible noise triggers. Furthermore, the width of the error function is eV which is in good agreement with the baseline noise of eV, demonstrating that the resolution of the detector at these energies is dominated by the baseline noise. The energy threshold (by definition at 50% trigger efficiency) is found to be eV, which corresponds to . In a setup with optimized noise conditions, the threshold can presumably be lowered to 4.5-5, a typical value reached in low-background underground environments [Angloher et al., 2014]. Considering the systematic errors of the energy calibrations (see above), the energy threshold is eV.
III.4 Discussion of results
The prototype detector shows the lowest energy threshold reported for macroscopic calorimeters, an improvement by one order of magnitude with respect to previous results [Strauss et al., 2017a]. It should be stressed that, since the device is a calorimeter, its calibration does not rely on quenching factors that arise when dealing with ionization or scintillation detectors. The detector has the same response for a given energy deposit, regardless of the interacting particle type and can approach energies below the fundamental nuclear-recoil reach of ionization detectors (e.g. 40 eV for Si and Ge Agnese et al. [2017]). The threshold, shown as a blue circle in Fig. 2, is higher than predicted by the scaling law, indicated by the red stars. However, this is expected to improve in a low-noise, low background environment. When operated in a low-noise underground setup, the energy threshold of the investigated Al2O3 detector is expected to improve by a factor of 1.5-3 [Strauss et al., 2017a], to a value between 6 and 13 eV. Further improvements (e.g. optimizing the TES design) are foreseen to fully match the expectation of eV.
The threshold is determined by comparing the measured noise with the amplitude of template pulses calibrated with events induced by the 55Fe source. Thus the main assumption in arriving at our very low threshold is in the linear extrapolation of the pulse height-energy relation to low energies. Our threshold lies in a new energy range, never explored with this type of detector. Nevertheless, such low energies still correspond to the creation of very many of the (1 meV) non-thermal phonons involved in the detection mechanism [Pröbst et al., 1995]. For energy depositions around or below 10 eV there is the possibility of different nuclear recoil mechanisms as one approaches lattice dislocation energies. It could be interesting for rare event searches to attempt a direct calibration at lowest energies, as with recoils from neutron capture, nuclear isomeric transitions or electron capture.
IV Outlook for rare-event searches
Due to the smallness of the calorimeters presented here, the technology permits new experiments in three aspects: 1) ultra-low energy thresholds down to the 10 eV-regime, 2) encapsulation of the small calorimeters by cryogenic veto detectors and 3) ability to operate the detectors above-ground in a high-rate environment. These features enable interesting possibilities involving the exploitation of the enhancement of the cross section by coherent scattering [Drukier and Stodolsky, 1984].
A new energy regime of nuclear recoils is accessible for the first time with this technology which implies that a new range of DM particles can be probed. The prototype run described here can be used to set a new limit on the spin-independent DM particle-nucleon cross section for masses below MeV/c2 [Angloher et al., ], extending the reach of direct DM search experiments down to MeV/c2. Operated in a low-background setup gram-scale detectors will significantly improve in sensitivity. Assuming the present detector performance using Al2O3 and a background level of 10 counts/[kg keV day], which seems feasible even at a shallow site Gastrich et al. [2016], an upper limit for of pb (at 500 MeV/c2) can be achieved with a moderate exposure of 1 kg-day. Improvements on the threshold, as predicted by the presented scaling law, might enable searches for DM masses in the 10 MeV regime.
The rate of solar neutrinos scattering coherently on nulcei in CaWO4 exceeds the present intrinsic background level at recoil energies below eV, as shown in Fig. 1. In this energy regime, the spectrum is dominated by scatters from Be7 and pp neutrinos of the solar cycle. An array of gram-scale detectors with a total target mass of (1 kg) would allow flavor-independent precision measurements of the solar neutrino flux and enable new solar physics Cerdeno et al. [2016].
The technology presented here shows promise for a rapid detection of coherent neutrino nucleus scattering (CNNS) and opens a window to study many interesting physics scenarios beyond the Standard Model [Lindner et al., 2017]. Lowering the energy threshold from, e.g. 300 eV to 20 eV, boosts the expected count rate by about two orders of magnitude (Fig. 1). Operating an array of such detectors with a total mass of 10 g at a distance of 40 m from a GW-scale nuclear power reactor, yields a count rate of counts/[kg keV day] which is a factor of 10-103 above expected backgrounds (see Fig. 1 and [Strauss et al., 2017b]). A 5 discovery of CNNS is then expected within weeks of measuring time, and precision measurements of the cross-section are in reach. Such a small-scale experiment can be realized with a commercial cryostat, standard lab electronics and a (presumably) compact shielding, which results in a moderate cost estimate. With this technology, real-time monitoring of nuclear reactors for non-proliferation and accident control is in reach.
References
- Stodolsky [1991] Leo Stodolsky. Phys. Today, 44N8:24–32, 1991.
- Angloher et al. [2016] G. Angloher et al. Eur. Phys. J., C76(1):25, 2016.
- Gastrich et al. [2016] H. Gastrich et al. Appl. Radiat. Isot., 112:165–176, 2016.
- Akerib et al. [2010] D. S. Akerib et al. Phys. Rev., D82:122004, 2010.
- Strauss et al. [2015] R. Strauss et al. JCAP, 1506(06):030, 2015.
- Strauss et al. [2017a] R. Strauss et al. Nucl. Instrum. Meth., A845:414–417, 2017a.
- Angloher et al. [2012] G. Angloher et al. Eur. Phys. J., C72:1971, 2012.
- Pröbst et al. [1995] F. Pröbst et al. J. Low Temp. Phys., 100(1-2):69–104, 1995.
- Moseley et al. [1984] S. H. Moseley et al. J. Appl. Phys., 56(5):1257–1262, 1984.
- Formaggio et al. [2012] J. A. Formaggio et al. Phys. Rev. D, 85:013009, 2012.
- Angloher et al. [2014] G. Angloher et al. Eur. Phys. J., C74(12):3184, 2014.
- Meier et al. [2000] O. Meier et al. Nucl. Instrum. Meth., A444:350–352, 2000.
- Angloher et al. [2009] G. Angloher et al. Astropart. Phys., 31:270–276, 2009.
- Sisti et al. [2001] M. Sisti et al. Nucl. Instrum. Meth., A466:499–508, 2001.
- Strauss et al. [2017b] R. Strauss et al. Eur. Phys. J., C77(8):506, 2017b.
- Gatti and Manfredi [1986] E. Gatti and P. F. Manfredi. Riv. Nuovo Cim., 9N1:1–146, 1986.
- Piperno et al. [2011] G. Piperno, S. Pirro, and M. Vignati. JINST, 6:P10005, 2011.
- Agnese et al. [2017] R. Agnese et al. Phys. Rev. D, 95:082002, 2017.
- Drukier and Stodolsky [1984] A. Drukier and L. Stodolsky. Phys. Rev. D, 30:2295–2309, 1984.
- [20] G. Angloher et al. arXiv e-prints: 1707.06749.
- Cerdeno et al. [2016] D. G. Cerdeno et al. JHEP, 05:118, 2016.
- Lindner et al. [2017] M. Lindner et al. JHEP, 2017(3):979, 2017.