Investigating the X-ray counterparts to unidentified sources in the 1000-orbit INTEGRAL/IBIS catalogue
Abstract
The latest INTEGRAL/IBIS all-sky survey lists 219 hard X-ray sources whose nature is still unknown. We report on our ongoing campaign aimed at identifying these high-energy emitters by exploiting the focusing capabilities of the X-ray Telescope (XRT, 0.2–10 keV) on board Swift, which allow an enhancement of the source localisation to arcsec level, thus facilitating the identification of the likely counterpart. By cross-correlating the list of the unidentified IBIS sources included in the latest IBIS catalogue with Swift/XRT archival data, we found a set of 14 objects, not yet reported in the literature, for which XRT data were available. We found no detection in only one case, a single X-ray association in 9 sources, and 2/3 associations in the remaining objects. We then made use of multi-waveband archives to search for counterparts at other wavelengths of these XRT detections and exploited X-ray spectral information in an attempt to determine their nature and association with the IBIS object. As a result of our analysis, we identified a single counterpart for 13 sources, although in some cases its nature/class could not be assessed on the basis of the information collected. More specifically, we found that SWIFT J0924.23141 and SWIFT J1839.15717 are absorbed AGN, while SWIFT J0800.74309 and 1SWXRT J230642.8550817 are Cataclysmic Variable binary systems. Finally, we found that IGR J140596116 is likely associated with the Fermi source 3FGL J1405.46119. In the case of XMMSL1 J030715.5545536 no XRT counterpart was detected. In all the other cases, optical/infrared spectroscopy is necessary to classify properly each X-ray counterpart and confirm their association with the INTEGRAL/IBIS detection.
keywords:
gamma-ray: general – X-ray: general1 Introduction
Over the last decade, our knowledge of the soft gamma-ray sky (10 keV) has been significantly revolutionised thanks to the results obtained by IBIS (Ubertini et al. 2003) on board INTEGRAL (Winkler et al. 2003) and the Burst Alert Telescope (BAT, Barthelmy et al. 2005) on board Swift (Gehrels et al. 2004). Both telescopes operate in similar wavebands (around 20–200 keV) with a limiting sensitivity of about a mCrab and a point source location accuracy of the order of a few arcmin, depending on the source strength. Both instruments continue to survey the sky at high energies, thus providing an unprecedented sample of objects selected in the soft gamma-ray band. A significant fraction of these sources are still unidentified/unclassified, often because they lack coverage in the 2–10 keV energy range. The recent all sky INTEGRAL/IBIS survey (Bird et al. 2016) lists 939 soft gamma-ray selected sources of which 219 are still unassociated/unidentified. The identification process is crucial if one wants to gain an insight into the nature of the sources that populate our Universe at soft gamma-ray energies. To this aim, a refined localisation, atteinable by exploiting the capability of current focusing X-ray telescopes, is necessary to pinpoint and classify their optical counterparts. Furthermore, information in the X-ray band can help to characterise these sources in terms of spectral shape, flux, absorption properties and variability.
In this paper, we present the results of our ongoing campaign focused on identifying the still unknown INTEGRAL/IBIS sources. To this aim, we searched for X-ray archival data acquired with XRT on board the Swift satellite available before the end of June 2016, finding a set of 14 objects for which low energy data can provide X-ray information. Most of these sources are on the Galactic plane except for five objects (XMMSL1 J030715.5545536, IGR J0924.23141, 1RXS J145959.4120124, IGR J180743827, and SWIFT J1839.15717), which are instead located at high (above 20 degrees) Galactic latitudes.
The paper is structured as follows: in Sect. 2 we present the XRT data reduction and analysis and the criteria adopted to search for the likely counterparts to the IBIS sources. Sect. 3 is devoted to the discussion of the results for each individual source. Conclusions are drawn in Sect. 4.
2 Swift/XRT data reduction and analysis
The log of all X-ray observations taken into account in this work is shown in Table 1 where we report for each individual IBIS source, the observation ID, as well as the date and the on-source exposure time of each XRT pointing. The XRT data of the 14 selected sources were reduced by means of the XRTDAS standard data pipeline package (xrtpipeline v. 0.13.2) to produce screened event files. All data were extracted only in the Photon Counting (PC) mode that ensures a source fine positioning.
We then, for each IBIS source, summed together all the available XRT pointings using XSELECT v. 2.4c to enhance the signal-to-noise ratio and thus facilitate the detection of candidate counterparts. As a following step, we analysed the XRT images in the 0.3–10 keV energy band by means of XIMAGE v. 4.5.1 in search of X-ray detections above 3 confidence level (c.l.) within both the 90% and 99% IBIS error circles. Furthermore, we checked the XRT images in the 3–10 keV band to select those sources with the hardest spectra (i.e. those with detection above 3 keV), since these are most likely to be the counterparts to the IBIS objects. For this reason, throughout the paper we will restrict our discussion to these sources, providing details on weaker X-ray detections only when possibly relevant. We estimated the X-ray positions using the task xrtcentroid v.0.2.9. In the XRT images we plot the 90% and 99% IBIS positional uncertainties (black and black-dotted circles, respectively) and the 90% Swift/BAT error circle (black-dashed-dotted circle) when available. To visualise better the X-ray counterparts, in most cases we smoothed the images. Therefore, the presence of grains and/or features inside the XRT field of view are undoubtedly spurious; in some cases the poor quality of the XRT images is due to the low exposure.
For spectral analysis, source events were extracted within a circular region with a radius of 20 pixels (1 pixel 2.36 arcsec) centred on the source position, while background events were extracted from a source-free region close to the X-ray source of interest. The spectra were obtained from the corresponding event files using the XSELECT v. 2.4c software and generally binned using grppha to 20 counts per energy bin so that the statistic could be applied. For sources with fewer counts (typically around 50–60), data were binned to 1 count per energy bin and the Cash statistic (Cash 1979) was adopted. We used version v.014 of the response matrices and created individual ancillary response files arf using xrtmkarf v.0.6.3.
For objects with more than one pointing, we first checked variability by analysing each single observation, then performed the spectral analysis of the average spectrum; this approach may provide further information that could be used as a possible filter on counterparts. For the spectral analysis, in the first instance, we adopted a basic model consisting of a simple power law passing through Galactic absorption in the source direction (Kalberla et al. 2005). If this baseline model was not adequate to fit the data, we then introduced extra spectral components as required.
| IBIS source | ID | Obs. Date | Exposurea |
| (s) | |||
| XMMSL1 J030715.5545536 | 00034389001 | Mar 03, 2016 | 3277 |
| 00034389002 | Mar 08, 2016 | 2314 | |
| SWIFT J0800.74309 | 00041761001 | Dec 08, 2010 | 692 |
| 00041761002 | Dec 12, 2010 | 5509 | |
| 00041761003 | Dec 15, 2010 | 5717 | |
| 00041761004 | Dec 16, 2010 | 1063 | |
| SWIFT J0924.23141 | 00091688001 | Apr 02, 2013 | 2600 |
| 00091688002 | Apr 07 2013 | 2352 | |
| 00080674001 | Apr 19, 2014 | 6622 | |
| IGR J140596116 | 00041805001 | Oct 04, 2011 | 3114 |
| 00041805005 | Sep 21, 2012 | 4623 | |
| 1RXSJ 145959.4120124 | 00034408001 | Mar 15, 2016 | 577 |
| 00034408002 | Mar 16, 2016 | 303 | |
| 00034408003 | Mar 17, 2016 | 399 | |
| 00034408004 | Mar 18, 2016 | 652 | |
| IGR J150386021 | 00046303001 | May 12, 2013 | 331 |
| 00046303002 | Jul 04, 2013 | 1299 | |
| IGR J164475138 | 00034390001 | Mar 04, 2016 | 2695 |
| 00034390002 | Mar 06, 2016 | 1850 | |
| IGR J175083219 | 00034409001 | Mar 18, 2016 | 3731 |
| IGR J180074146 | 00085658001 | Feb 06, 2016 | 233 |
| 00085658002 | Mar 20, 2016 | 3016 | |
| IGR J180743827 | 00034391001 | Mar 06, 2016 | 4207 |
| XMMSL1 J182831.8022901 | 00049376001 | Nov 09, 2012 | 148 |
| 00049376003 | Feb 09, 2013 | 421 | |
| 00049376004 | May 23, 2013 | 401 | |
| 00049376005 | May 30, 2013 | 181 | |
| 00049376006 | Jun 13, 2013 | 108 | |
| 00049376007 | Jun 19, 2013 | 266 | |
| 00049376008 | Jun 21, 2013 | 3741 | |
| SWIFT J1839.15717 | 00038080001 | Oct 17, 2008 | 7675 |
| 00038080002 | Nov 02, 2008 | 8364 | |
| IGR J203103835 | 00049381001 | Dec 04, 2012 | 108 |
| 00049381002 | Dec 05, 2012 | 1028 | |
| 00049381003 | Dec 06, 2012 | 1550 | |
| 00049381004 | Dec 07, 2012 | 281 | |
| 00049381005 | Dec 10, 2012 | 672 | |
| 00049381006 | Dec 11, 2012 | 135 | |
| 00049381007 | Dec 12, 2012 | 1053 | |
| 1SWXRT J230642.8550817 | 00039882001 | Sep 01, 2010 | 592 |
| 00039882002 | Oct 26, 2010 | 354 |
-
a On-source exposure time.
| XRT source | R.A. | Dec. | error | Count rate | N. obs/Total expo | |
| (0.3–10 keV) | (3–10 keV) | |||||
| (J2000) | (J2000) | (arcsec) | (10-3 counts s-1) | (10-3 counts s-1) | (s) | |
| XMMSL1 J030715.5545536 (R.A.(J2000) = , Dec.(J2000) = , error radius (90%)= 5′.04; (99%) = 7′.86) | ||||||
| no detection | 2/5591 | |||||
| SWIFT J0800.74309 (R.A.(J2000) = , Dec.(J2000) = , error radius (90%)= 4′.86; (99%) = 7′.58) | ||||||
| #1 (in 90%) | 3.62 | 4/12981 | ||||
| #2 (in 90%) | 4.32 | |||||
| #3 (in 90%) | 4.60 | – | ||||
| SWIFT J0924.23141 (R.A.(J2000) = , Dec.(J2000) = , error radius (90%) = 4′.32; (99%) = 6′.74) | ||||||
| #1 (in 90%) | 4.11 | 3/11574 | ||||
| #2 (in 99%) | 3.51 | |||||
| IGR J140596116 (R.A.(J2000) = , Dec.(J2000) = , error radius (90%) = 4′.13; (99%) = 6′.44) | ||||||
| #1 (in 99%) | 5.24 | 2/7737 | ||||
| 1RXSJ 145959.4120124 (R.A.(J2000) = , Dec.(J2000) = , error radius (90%) = 4′.39; (99%) = 6′.85) | ||||||
| #1 (in 90%) | 3.90 | 4/1931 | ||||
| IGR J150386021 (R.A.(J2000) = , Dec.(J2000) = , error radius (90%) = 3′.95; (99%) = 6′.16) | ||||||
| #1 (in90%) | 5.11 | 2/1630 | ||||
| IGR J164475138 (R.A.(J2000) = , Dec.(J2000) = , error radius (90%) = 4′.95; (99%) = 7′.72) | ||||||
| #1 (border of 90%) | 3.82 | 2/4545 | ||||
| IGR J175083219 (R.A.(J2000) = , Dec.(J2000) = , error radius (90%) = 2′.31; (99%) = 3′.60) | ||||||
| #1 (in 90%) | 5.24 | 1/3731 | ||||
| #2 (in 99%) | 3.80 | – | ||||
| IGR J180074146 (R.A.(J2000) = , Dec.(J2000) = , error radius (90%) = 3′.19; (99%) = 4′.98) | ||||||
| #1 (in 90%) | 4.04 | 2/3249 | ||||
| IGR J180743827 (R.A.(J2000) = , Dec(J2000) = , error radius (90%) = 4′.95; (99%) = 7′.72) | ||||||
| #1 (in 90%) | 6.12 | – | 1/4207 | |||
| XMMSL1 J182831.8022901 (R.A.(J2000) = , Dec(J2000) = , error radius (90%) = 3′.74; (99%) = 5′.83) | ||||||
| #1 (in 90%) | 3.89 | 7/5266 | ||||
| SWIFT J1839.15717 (R.A.(J2000) = , Dec.(J2000) = , error radius (90%) = 4′.69; (99%) = 7′.32) | ||||||
| #1 (in 90%) | 3.57 | 2/16039 | ||||
| #2 (border of 90%) | 3.89 | – | ||||
| IGR J203103835 (R.A.(J2000) = , Dec.(J2000) = , error radius (90%) = 4′.54; (99%) = 7′.08) | ||||||
| #1 (in 90%) | 4.35 | 7/4827 | ||||
| #2 (in 99%) | 6.21 | – | ||||
| 1SWXRT J230642.8550817 (R.A.(J2000) = , Dec(J2000) = , error radius (90%) = 3′.79; (99%) = 5′.91) | ||||||
| #1 (in 90%) | 4.51 | 2/946 | ||||
3 Results
To investigate the nature of each potential counterpart, we browsed various on-line archives
such as NED (NASA/IPAC Extragalactic Database), HEASARC (High Energy Astrophysics Science
Archive Research Center) and SIMBAD (Set of Identifications, Measurements, and Bibliography
for Astronomical Data) in search of radio, infrared, optical, and UV counterparts within the
XRT positional uncertainty. When relevant, we also discuss the association with objects
reported in the ROSAT and XMM-Newton Slew
catalogues (Voges et al.1999;
Saxton et al. 2008)111More information for these two catalogues are available at:
https://heasarc.gsfc.nasa.gov/W3Browse/rosat/rassbsc.html;
https://heasarc.gsfc.nasa.gov/W3Browse/xmm-newton/xmmslewcln.html.
In Table 2 we list the 14 IBIS sources analysed here together with their coordinates and relative uncertainty (90% c.l.) as listed in Bird et al. (2016). For each of these gamma-ray emitters, we then report the coordinates and relative uncertainties (at 90% c.l.) of all sources detected by XRT within the 90% and 99% IBIS positional uncertainties, the count rate in both the 0.3–10 and 3–10 keV energy range, the number of X-ray observations analysed and the total on-source exposure time. For each IBIS source, in Table 3 we report those XRT objects for which an optical and IR counterpart was found; references for the databases used are reported at the end of Table 3.
The results of the spectral analysis are shown in Table 4 where we report the Galactic column density in the source direction (Kalberla et al. 2005) and the best-fit parameters (intrinsic column density, power law photon index, or C-stat versus degrees of freedom and 2–10 keV flux). Spectra and data-to-model ratio are shown for only those sources treated with the statistic.
In the following, we discuss each INTEGRAL/IBIS source (as reported in Bird et al. 2016) and briefly analyse the overall properties found for each candidate counterpart.
3.1 XMMSL1 J030715.5545536
(Detected as a persistent source)
This is the only IBIS source for which XRT follow-up observations do not reveal the presence of X-ray sources in the region surrounding the high-energy emitter. However, within the 90% IBIS positional uncertainty there is an XMM-Newton Slew source (XMMSL1 J030715.5545536) that is detected at around 2 c.l. in the 0.2–12 keV energy band with a flux of erg cm-2 s-1. The XRT upper limit in the same energy range is erg cm-2 s-1, which indicates significant flux variability over the period covered by the XMM-Newton Slew (November 2010) and XRT (March 2016) pointings. Within the restricted positional uncertainty of the XMM-Newton Slew detection (5.1 arcsec), we do not find any optical or IR counterpart. We note that 4 of the sources in the clean Slew Survey catalogue are expected to be spurious from statistical considerations (see Saxton et al. 2008), which suggests that this possibility cannot be totally discounted. Alternatevely, an X-ray source is present inside the IBIS positional uncertainty but variable over time, more strongly at lower than at higher energies given the persistent nature of the source within the INTEGRAL database used by Bird et al. (2016). If so, and considering the source high Galactic latitude (), this X-ray detection could be an AGN maybe of the blazar type. Only X-ray monitoring of the source can provide some clues on its nature, while spectroscopy of the only possible X-ray counterpart can confirm or not its association with the gamma-ray source.
3.2 SWIFT J0800.74309
(Detected as a persistent source)
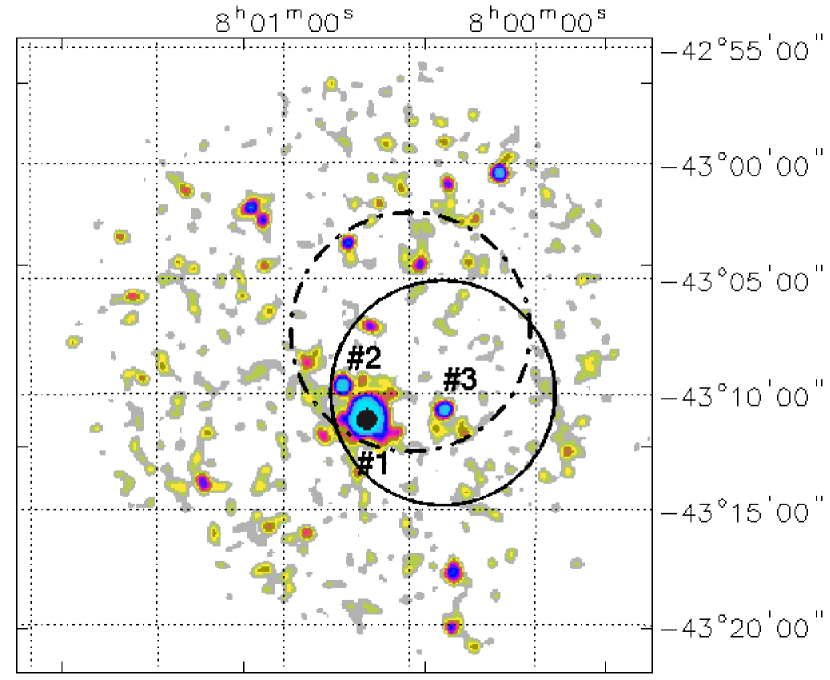
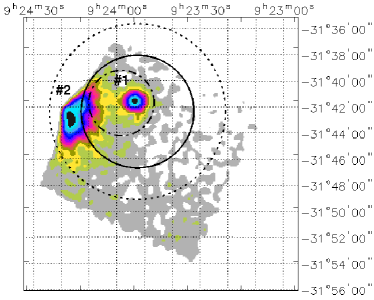
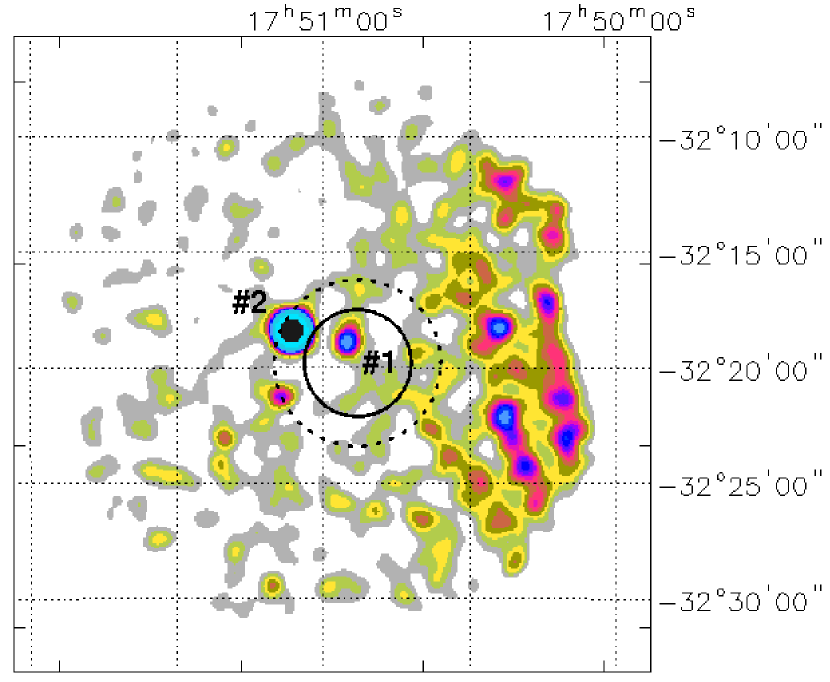
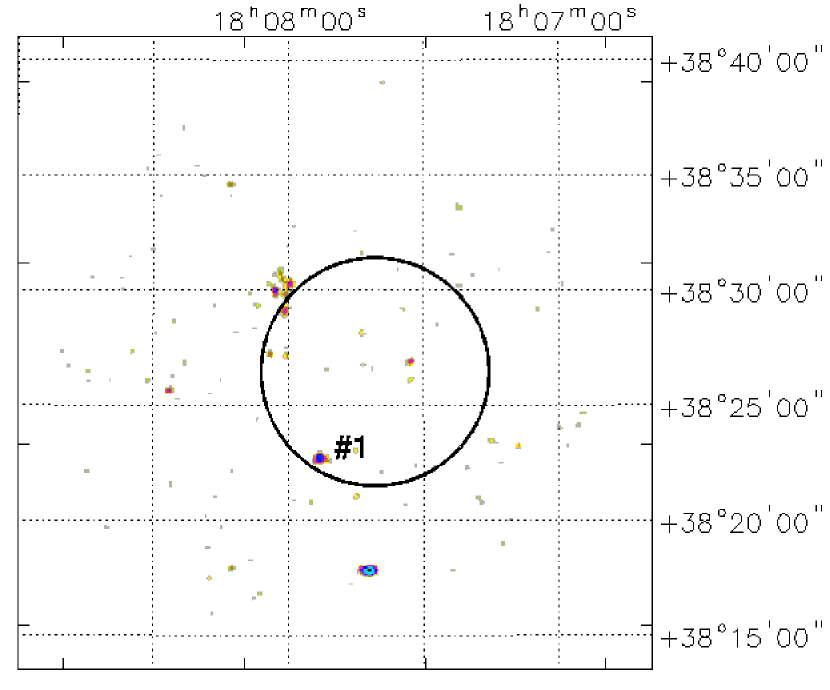
This source is also unclassified in the 70-month Swift/BAT survey (Baumgartner et al. 2013). The observations performed with XRT show the presence of three X-ray sources within the 90% IBIS/BAT positional uncertainty (see Table 2 and Figure 1), two of which (source #1 and #2) are still detected above 3 keV.
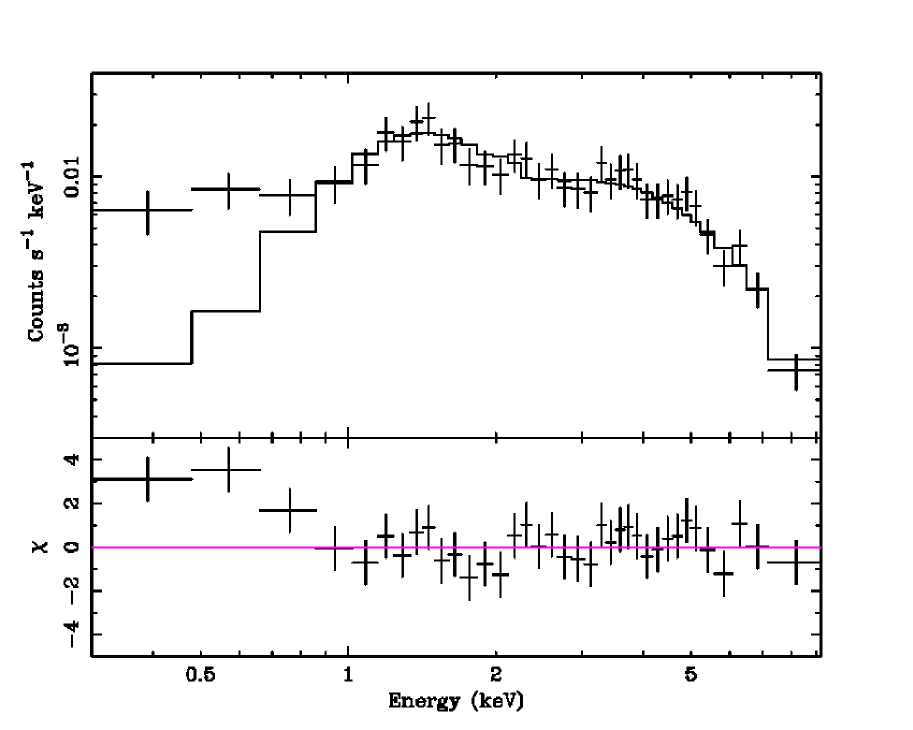
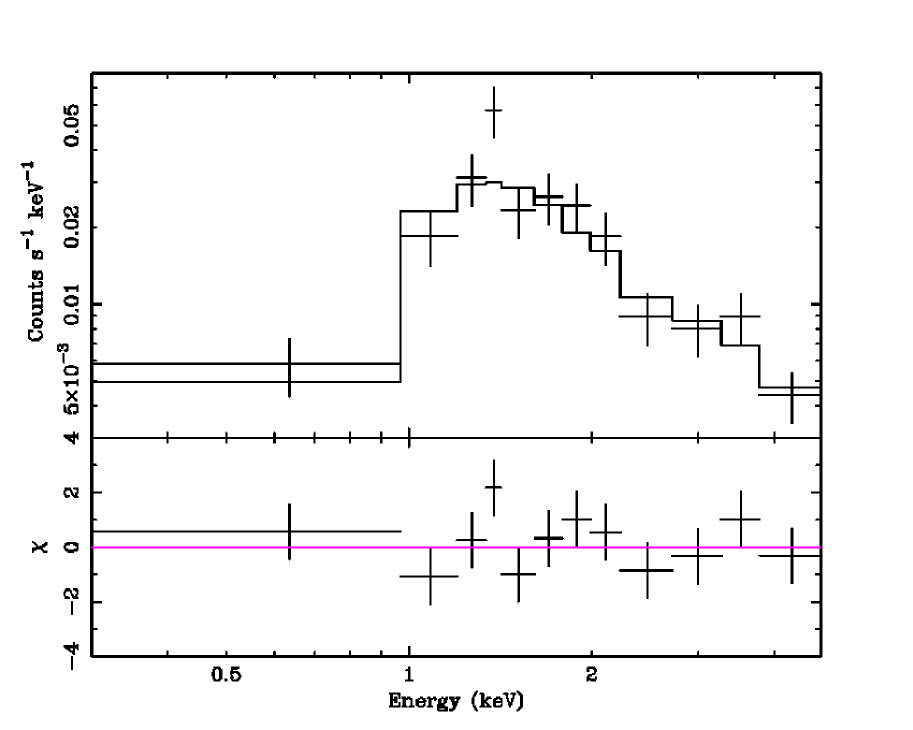
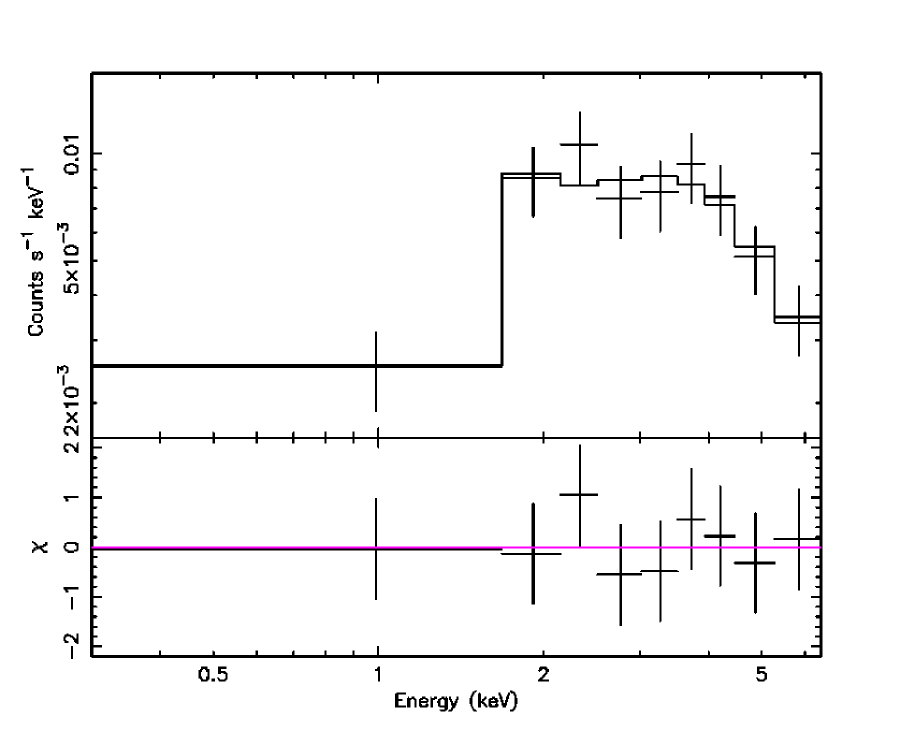
In more detail, for source #1, which is the brightest object even above 3 keV (15.2 c.l.), we found a single optical and IR counterpart within its error circle (see Table 3). Recent optical follow-up observations (Rojas et al. 2016) indicate that this is a Cataclysmic Variable binary system source (CV). Our basic model ( and 2–10 keV flux of erg cm-2 s-1, see Table 4) does not yield a good fit to the XRT data (), as an excess below 1 keV is clearly visible in the data-to-model ratio (see Figure 2). This feature, which is expected to be observed in CVs (see Landi et al. 2009 and references therein), can be modelled with a blackbody component. Unfortunately, the statistical quality of the X-ray data does not allow us to place any constraint on this component.
A single optical and IR counterpart (see Table 3) was also found within the positional uncertainty of source #2, which is still detected above 3 keV but only at 3.4 c.l.. For this object, the XRT spectral analysis yields a 2–10 keV flux of erg cm-2 s-1 and a photon index around 1.2 (see Table 4).
The X-ray brightness of source #1 and its optical classification argue in favour of its association with SWIFT J0800.74309, but optical spectroscopy of source #2 is required before its contribution to the soft gamma-ray emission can totally be disregarded.
3.3 SWIFT J0924.23141
(Detected as a persistent source)
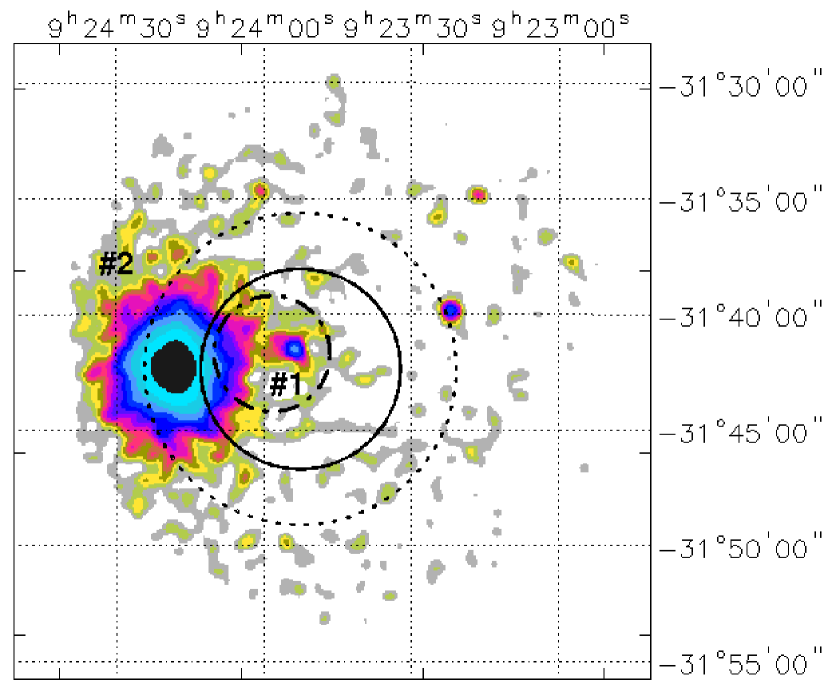
Also this source is reported in the Swift/BAT 70-month survey (Baumgartner et al. 2013). XRT follow-up observations reveal the presence of two objects (see Figure 3 and Table 2) in the region surrounding this high-energy emitter. Their positions are compatible with either the 90% (# 1) or the 99% (#2) IBIS positional uncertainties, but only source #1 is located within the 90% BAT error circle.
Source # 1 is detected at 5.7 c.l. both in 0.3–10 keV energy range and above 3 keV. The source is visible at 2.4 c.l. up to 6.7 keV. Its optical/IR counterparts are listed in Table 3: both are associated with the galaxy 2MASX J092353713141305, classified as a Seyfert 1.8 at in the Veron & Veron (13th edition) catalogue (2010). The XRT localization is also compatible with a NVSS radio source belonging to the NRAO VLA Sky Survey (NVSS; Condon et al. 1998), namely NVSS J092353314126, listed with a 20 cm flux density of mJy. This source was proposed by Baumgartner et al. (2013) as the counterpart to SWIFT J0924.23141. Furthermore, Ricci et al. (2015), combining XRT and BAT spectra, have recently suggested that this may be a Compton thick AGN. The XRT data, although of poor statistical quality, require a double power-law model, with the primary component absorbed by an intrinsic column density and the secondary component, having the same photon index (frozen to 1.8) of the primary one, passing only through the Galactic absorption. The intrinsic , albeit poorly constrained, is found to be around cm-2 and compatible with the Compton thick regime within uncertainties, while the 2–10 keV flux is erg cm-2 s-1 (see Table 4).
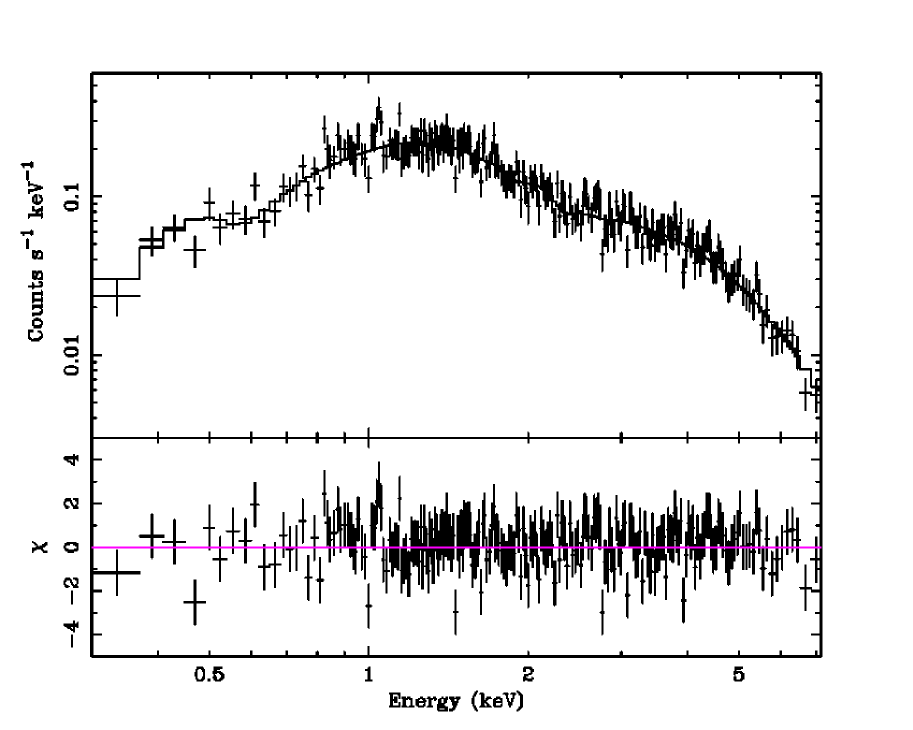
Source #2, which lies just outside the 90% IBIS error circle but within the 99% one, is much brighter than object #1, as it is detected at around 126 and 72 c.l. in the 0.3–10 keV energy band and above 3 keV, respectively. Its XRT position is compatible with an USNOA2.0 object; no IR counterpart has been found (see Table 3). Browsing the HEASARC archive, we find that this source was detected by various X-ray instruments like Chandra as CXO J092418.2314217, BeppoSAX Wide Field Camera as SAXWFC J0924.33142.4, and ROSAT as the bright source 1RXS J092418.0314212. It also coincides with an XMM-Newton Slew source (XMMSL1 J092418.4314219), which is detected at 14.3 c.l., with a 0.2–12 keV flux of erg cm-2 s-1. Historically, the source may have also been observed by ARIEL V and UHURU with a 2–6 keV flux around erg cm-2 s-1 and reported in the HEAO–1 A3 MC LASS catalogue (H0922374), where it is classified as an X-ray binary in the Galaxy, due to the fact that the X-ray flux is by far too bright for an AGN of magnitude . Furthermore, the X-ray/optical fluxes and ASM colours most likely resemble low luminosity ultra compact binaries. By fitting the average XRT spectrum with a simple power law, we found a photon index and a 2–10 keV flux of erg cm-2 s-1. The addition of a blackbody component provides a significant improvement of the fit ( for two d.o.f. less), yielding a temperature keV, a photon index of and a 2–10 keV flux of erg cm-2 s-1 (see Figure 4). Analysing single XRT observations we find variability by a factor of 1.7 over a year time-scale and by a factor of 2 in comparison with the XMM-Newton Slew flux measurement.
As can be seen in Figure 3, the XRT data are not able alone to discriminate between
source #1, located within the 90% IBIS/BAT error circle, very hard but less bright and
source #2, 100 times brighter but located outside the 90 % IBIS positional uncertainty.
Luckily, NuSTAR has recently performed an observation of this sky region: although both
sources are clearly visible in the 3–79 keV image, only source #1 is present above 15 keV
(see Figure 5)222NuSTAR images were extracted starting from the event files
available in the ASI/ASDC data archive available at:
http://www.asdc.asi.it/mmia/index.php?mission=numaster. and is therefore the real
counterpart of this IBIS/BAT detection. Source #2 remains, however, an interesting object to
study and one for which optical follow-up observations would be very useful. Fitting
the NuSTAR spectrum of source #1333For this spectral extraction, we follow the
prescription used by Malizia et al. (2016) for other AGN observed by NuSTAR. with an absorbed
power law provides a good fit () to the data and the following
best-fit parameters: a photon index of , a column density of cm-2 and a 2–10 keV flux of erg
cm-2 s-1; this indicates that source #1 is heavily absorbed, but not quite Compton
thick.
3.4 IGR J140596116
(Detected in a 2198.6-day outburst from MJD = 52980.4)
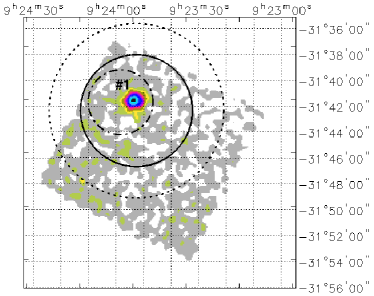
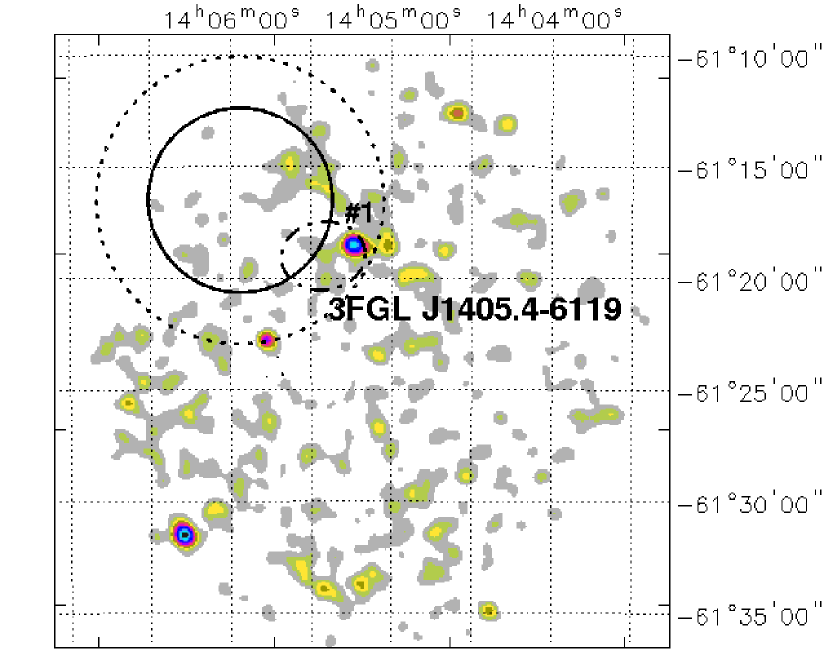
According to the bursticity method (see Bird et al. 2016 for details), this source was detected during activity in a set of data corresponding to roughly 2200 days over the period December 7, 2003 to December 14, 2009 (MJDs 52980.45 – 55179.04). XRT follow-up observations were instead carried out at a later time, more specifically during 2011 (October 4, 8 and November 1), 2012 (September 21) and 2015 (February 19 and April 27). It is therefore possible that the X-ray pointings missed the active phase seen by IBIS above 20 keV and observed the source in a more typical X-ray state. Despite this note of caution, the combined XRT image of this sky region (Figure 6) shows the presence of only one source whose position is compatible with the 99% IBIS positional uncertainty (see Table 2).
This source, which is detected around 4 and 3.4 c.l. in the range 0.3–10 and 3–10 keV, respectively, is also included in the positional uncertainty of the source 3FGL J1405.46119 (black-dashed-dotted ellipse in Figure 6) belonging to the third Fermi Large Area Telescope catalogue (Acero et al. 2015). The XRT positional uncertainty contains a single infrared (2MASS/WISE) counterpart that is not reported in any optical catalogue (see Table 3).
From the XRT data, we can only infer a 2–10 keV flux roughly around erg cm-2 s-1, by assuming our basic model with the photon index frozen to 1.8. The source has also been observed by Chandra on September 19, 2013: it is listed in the Chandra ACIS GSG Point-Like X-Ray Source Catalog (Wang et al. 20016) as CXOGSG J140514.4611827 (only 1 arcsec uncertainty) with a 0.3–8.0 keV flux of erg cm-2, i.e. similar to the XRT one.
The detection of the XRT source inside the 3FGL error ellipse and its connection with the IBIS object is particularly interesting and worth investigating. Unfortunately, at this stage, the limited multi-waveband information prevents us from finding any secure clues on the nature of the source. The lack of a radio emission within the XRT potional uncertainty together with the allWISE colours (, and ) of the IR counterpart, indicates that a blazar interpretation is unlikely (Masetti et al. 2013). Moreover, the source is located at low Galactic latitude (), i.e. on the Galactic plane, and 3FGL J1405.46119 has already been reported as a pulsar candidate by Lee et al. (2012) and more recently by Saz-Parkinson et al. (2016).
Clearly, this remains an object of uncertain type, but its association with GeV emission is of particular interest and future dedicated high-energy observations and optical spectroscopy of the XRT source may shed light on its ultimate nature.
3.5 1RXS J145959.4120124
(Detected in a 48.7-day outburst from MJD = 54640.7)
This is another IBIS source detected with the bursticity method; it was detected during a
49-day outburst starting from June 23, 2008. The XRT observations were instead performed on
March (15 to 18) 2016. As shown in Figure 7, there is only one X-ray source within
the IBIS 90% positional uncertainty; it is detected around 12 and 5 in the
0.3–10 and 3–10 keV energy range respectively. It has a counterpart in an XMM-Newton
Slew object (XMMSL1 J145959.6120131, 2 error radius) that is also
reported in the ROSAT Bright source catalogue as 1RXS J145959.4120124 ( error radius). By XMM-Newton it is detected at 3.7 c.l. in the 0.2–12
keV energy range with a flux of 5.32 erg cm-2 s-1, 60 of which
is above 2 keV444XMM-newton Slew observation date is February 6, 2002.. In the
XMM-Newton Slew catalogue, the source is associated with HD 132658/TYCHO
9228651555See more information at:
http://www.astrostudio.org/xhip.php?hip=73397., a bright star of spectral type F5 D,
whose location is also compatible with the positional uncertainty of the ROSAT
detection.
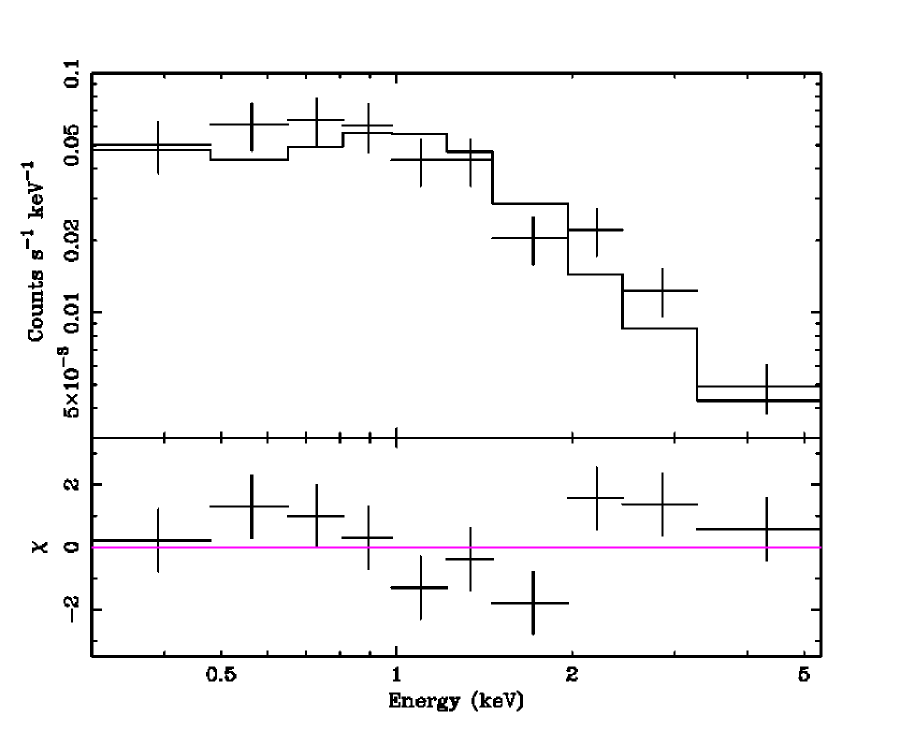
The spectral analysis of the average XRT spectrum provides a photon index of and a 2–10 (0.2–12 keV) keV flux of 2.4 (5.0) erg cm-2 s-1 (see Figure 8 and Table 4); the XRT flux ranges from 1.2 to 2.4 erg cm-2 s-1. Therefore, spectral analysis of each single observation indicates variability by a factor of on a four-day time-scale, while comparison of the average XRT flux with the XMM-Newton Slew one indicates similar flux levels.
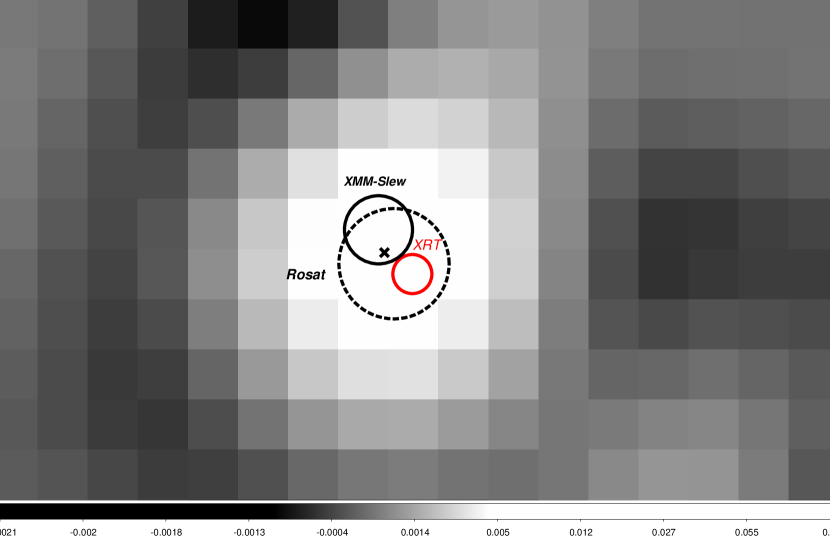
The X-ray source may also be associated with radio emission since a NVSS and FIRST (Faint Images of the Radio Sky at 20 cm, Helfand et al. 2015) source is listed nearby. The source, named NVSS J145959120126/FIRST J145959.3120125, has a 20 cm flux density of 6.50.4 and 8.880.15 mJy in the two catalogues, respectively. The NVSS image of this sky region is shown in Figure 9 where we plot the XRT, ROSAT, and XMM-Newton Slew error circles, as well as the position of the star HD 132658/TYCHO 9228651. Figure 9 emphasises that this is clearly a difficult case: on the one hand the star is formally outside the XRT positional uncertainty, but it is compatible with the ROSAT and XMM-Newton Slew error circles and it is spatially coincident with the radio source; on the other hand it is difficult to explain radio and soft gamma-ray emission from an F type class object. Alternatevely, one must consider the possibility that the star is a chance association and that the true counterpart is a background object masked by the brightness of the star. In this case, the X-ray properties, the location of the source at high Galactic latitudes and the presence of radio emission suggest an extragalactic nature, i.e. a variable AGN behind HD 132658/TYCHO 9228651. Unfortunately, optical/IR follow-up observations cannot help in this case, since the bright star prevents the detection of objects nearby or behind it, thus making this case difficult to solve.
3.6 IGR J150386021
(Detected as a persistent source)
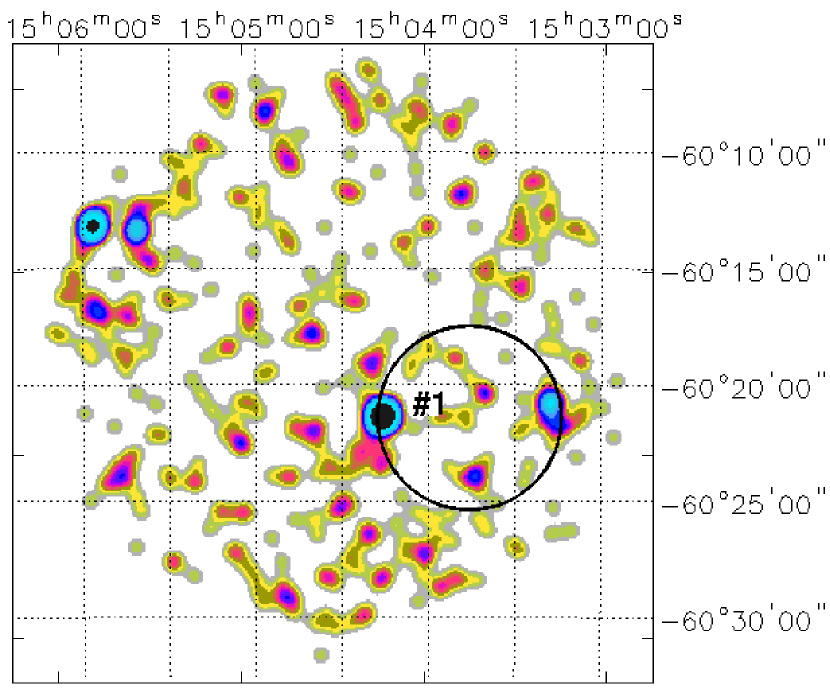
In this case, only one X-ray source is clearly visible inside the 90% IBIS error circle as listed in Table 2 and depicted in Figure 10. It is detected at 5 and 3.4 c.l., in the 0.3–10 and 3–10 keV energy range, respectively. Because of the poor quality of the XRT data, we can only infer a 2–10 keV flux of erg cm-2 s-1, by freezing the photon index to 1.8.
Two optical and one IR counterparts were found within the XRT positional uncertainty (see Table 3).
The hardness of this source in X-rays and the lack of other X-ray detections suggest that it is a likely association with IGR J150386021. Spectroscopy of both optical candidates are therefore encouraged to pinpoint which of the two is the true counterpart and assess its nature.
3.7 IGR J164475138
(Detected in a 35.7-day outburst from MJD = 54141.5)
This source was detected during an outburst lasting roughly 5 weeks starting from February 10, 2007; the XRT pointings were made at a much later time (March 4–6, 2016) and may be related to a more inactive state of the source.
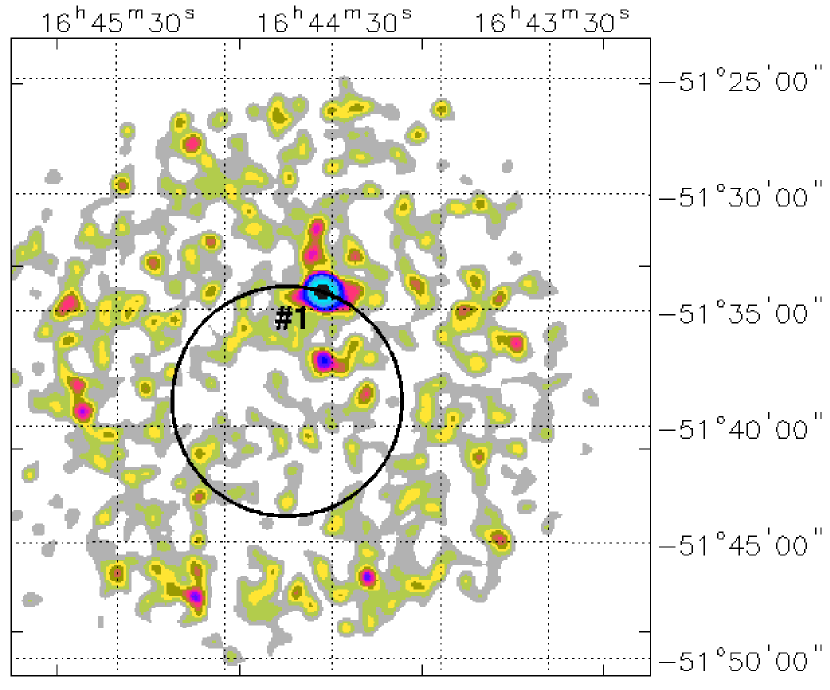
The only X-ray object seen in the region surrounding the IBIS emitter is located at the border of the 90% IBIS error circle (see Figure 11). It is detected at 13.4 and 7.1 c.l. in the 0.3–10 and 3–10 keV energy range. The source is also reported as an XMM-Newton Slew object XMMSL1 J164433.3513420 with a 0.2–12 keV flux of 1.30 erg cm-2 s-1.
The XRT spectrum is well modelled with an absorbed power law ( cm-2), yielding a photon index and 2–10 keV flux of erg cm-2 s-1 (see Figure 12 and Table 4). The source shows flux variability by a factor of 1.5 over a two-day time-scale comparing closeby Swift pointings. The XRT flux is also higher by a factor of 3.5 than the XMM-Newton Slew one in the same energy range. In Table 3 we report the only optical and IR counterpart to the XRT source.
We note that this object is on the Galactic plane and has been suggested to be a Young Stellar Object (YSO) by Marton et al. (2016) on the basis of its WISE and 2MASS photometric data. above 20 keV during flaring events, while coronal activity. However, we note that extragalactic sources, especially galaxies with ongoing star formation or active galactic nuclei, show similar infrared spectral shape to that of YSOs and may be variable over time; this leaves the final answer on which is the nature of this source to optical follow-up spectroscopic observations and eventually to X-ray monitoring campaigns.
3.8 IGR J175083219
(Detected as a persistent source)
In this case, two X-ray detections are revealed by XRT in the region surrounding IGR J175083219 as can be seen in Figure 13
Source #1, which is located within the 90% IBIS error circle, is the weakest of the two, but also the only one detected above 3 keV (at 3.1 c.l., see Table 2). In Table 3 it has a single infrared counterpart (GLIMPSE G357.692202.7203), which is not seen at optical wavelengths; because of the low statistical quality of the X-ray data the spectral parameters are poorly constrained. The fit with our basic model yields a flat photon index around 0.6 and a 2–10 keV flux around 8 erg cm-2 s-1; fixing the photon index to 1.8 provides an intrinsic absorption around cm-2.
Source #2, which lies within the 99% IBIS positional uncertainty, is detected at 13.4 c.l. in the 0.3–10 keV energy range, but it is not revealed above 3 keV. This source coincides with the XMM-Newton Slew source (XMMSL1 J175106.4321824, error radius 2 arcsec), detected at 4.4 c.l. with a 0.2–12 keV flux of 7.48 erg cm-2 s-1. It has also been associated with the ROSAT Bright object 1RXS J175106.2321836 (error radius 10 arcsec), itself identified as the star HIP 87368 (HD 162186) of spectral type G3IV(e).
The XRT data are best modelled with a bremsstrahlung component having keV and a 2–10 keV flux of around erg cm-2 s-1; the flux extrapolation to the 0.2–12 keV energy band gives erg cm-2 s-1, roughly a factor of 7 below the XMM-Newton Slew one.
Considering the star’s optical class, its X-ray properties and the persistent nature of the IBIS detection we conclude that HIP 87368 (HD 162186) is quite unlikely to emit at soft gamma-ray energies, leaving XRT object #1 as the most likely counterpart to IGR J175083219.
| XRT source | Optical/IR source† | Distance‡ | Magnitudes |
| (arcsec) | |||
| SWIFT J0800.74309 | |||
| #1 | USNO–A2.0 U0450.05566363 | 2.28 | , |
| 2MASS J080039984311076 | 2.22 | , , | |
| allWISE J080039.96431107.2 | 2.34 | , , , | |
| #2 | USNO–A2.0 U0450.05571649 | 3.66 | , |
| allWISE J080045.83430939.3 | 1.86 | , , , | |
| SWIFT J0924.23141 | |||
| #1 | USNO–A2.0 U0525.11601717 | 1.62 | , |
| 2MASS J092353733141308 | 1.68 | , , | |
| allWISE J092353.73314130.9 | 1.68 | , , , | |
| #2 | USNO–A2.0 U0525.11615396 | 1.32 | , |
| IGR J140596116 | |||
| #1 | 2MASS J140514416118282 | 3.78 | , , |
| G311.6718+00.3053 | 3.84 | 3.6m = , 4.5m = , 5.8m =, 8.0m = | |
| allWISE J140514.40611827.7 | 3.90 | , , , | |
| IGR J150386021 | |||
| #1 | USNO–B1.0 0296–0547603 | 3.18 | , |
| USNO–B1.0 0296–0547602 | 3.36 | ||
| 2MASS J150416116021225 | 1.32 | , , | |
| IGR J164475138 | |||
| #1 | USNO–B1.0 0384–0622801 | 3.18 | , |
| 2MASS J164433245134131 | 3.42 | , , | |
| allWISE J164433.25513413.2 | 3.48 | , , , | |
| IGR J175083219 | |||
| #1 | USNO–B1.0 0576–0768321 | 4.50 | |
| #1 | 2MASS J175052713219488 | 4.26 | , , |
| G357.692202.7203 | 2.40 | 3.6m = , 4.5m = , 5.8m = | |
| IGR J180074146 | |||
| #1 | USNO–B1.0 0482–0651082 | 1.38 | |
| USNO–B1.0 0482–0651086 | 1.92 | , , | |
| 2MASS J180042474146466 | 2.16 | , , | |
| 2MASS J180042704146503 | 2.76 | , , | |
| WISE J180042.63414648.9 | 1.50 | , , , | |
| IGR J180743827 | |||
| #1 | USNO–A2.0 U1275.09785770 | 5.52 | , |
| 2MASS J180752913822384 | 4.74 | , , | |
| allWISE J180752.92382238.5 | 4.50 | , , , | |
| XMMSL1 J182831.8022901 | |||
| #1 | UGPS J182831.01022906.6 | 1.2 | |
| UGPS J182831.03022908.3 | 1.86 | ||
| SWIFT J1839.15717 | |||
| #1 | allWISE J183905.95571505.1 | 3.42 | , , |
| IGR J203103835 | |||
| #1 | UGPS J203055.29383347.1 | 3.06 | , , |
| UGPS J203055.30383347.2 | 3.12 | , , | |
| 1SWXRT J230642.8550817 | |||
| #1 | USNO–A2.0 U1425.14606199 | 3.66 | , |
| 2MASS J230642695508200 | 3.36 | , , | |
| allWISE J230642.67550820.1 | 3.18 | , , , | |
-
† The catalogs are the Two Micron All Sky Survey (2MASS, Skrutskie et al. 2006), the United States Naval Observatory (USNO–B1.0 and USNO–A2.0, Monet 1998,2003), the Wide-field Infrared Survey Explorer all sky survey (WISE, Wright et al. 2010) or, if available, allWISE (available at: http://vizier.u-strasbg.fr/viz-bin/VizieR?-source=II/328), the Galactic Legacy Infrared Mid-Plane Survey Extraordinaire (GLIMPSE, Churchwell et al. 2009), and the UKIRT Infrared Deep Sky Survey (UKIDSS) Galactic Plane Survey (UGPS, Lucas et al. 2008);
-
‡ Angular distance from the XRT cetroid.
3.9 IGR J180074146
(Detected as a persistent source)
For this INTEGRAL emitter, only one X-ray source is detected within the 90% IBIS positional uncertainty (see Figure 14 and Table 2). It is detected at 9.5 and 5.5 c.l. in the 0.3–10 and 3–10 keV energy range, respectively.
Within the XRT error box we also found an XMM-Newton Slew object (XMMSL1 J180042.8414651) that is detected at 2.7 c.l. with a 0.2–12 keV flux of 1.78 erg cm-2 s-1. Another XMM-Newton Slew object (XMMSL1 J180042.8414656) was found at 8.4 arcsec from the XRT centroid. It is detected at 2.6 c.l. with a 0.2–12 keV flux of 2.79 erg cm-2 s-1. The distance between the two XMM-Newton Slew detections is only 6 arcsec, whereas their respective error radii are 3.6 and 4.1 arcsec: this strongly suggests that they are probably the same source seen in different periods (observing times 2010–10–06 and 2013–03–08 for the first and second XMM-Newton Slew objects, respectively) and both are associated with the single XRT detection. If the two XMM-Newton Slew objects are the same object, then the observed fluxes indicate that the source may be variable on yearly timescales.
Our XRT baseline model provides a flat photon index () and a 2–10 keV flux of erg cm-2 s-1 (see Figure 15 and Table 4); the extrapolation of the XRT flux to the 0.2–12 keV energy range yields a flux of erg cm-2 s-1, higher than those shown by the XMM-Newton Slew detections.
Within the XRT positional uncertainty we find two possible counterparts (see Table 2); optical spectroscopy of both of them is necessary to disintangle which of the two is the real counterpart and assess its nature.
3.10 IGR J180743827
(Detected in a 447.2-day outburst from MJD = 53275.0)
In this case the source detection by IBIS is optimised over a period of around 15 months starting from September 26, 2004, while the only XRT pointing was carried out much later, at the beginning of June 2016.
In the region surrounding IGR J180743827 there is only one X-ray source that lies within the 90% IBIS positional uncertainty (see Figure 16). It is revealed at 3.3 in the 0.3–10 keV energy range, but not above 3 keV. The XRT error circle is compatible with that of an XMM-Newton Slew source (XMMSL1 J180752.6382240, error radius of 3.4 arcsec), which is detected at 2.1 c.l. with a 0.2–12 keV flux of 1.55 erg cm-2 s-1.
Given the poor quality of the XRT data, we can only infer a 2–10 keV flux of erg cm-2 s-1, by freezing the photon index to 1.8; comparison with XMM-Newton Slew detection indicates strong X-ray variability. This suggests that XRT pointed at the source during a period of quite low flux, while INTEGRAL and XMM-Newton observed it during a much brighter flux state. Within the XRT positional uncertainty we find a single optical/infrared counterpart that is also reported as a bright UV source (GALEX J180752.91382238.9 with Near and Far UV magnitudes of 17.9 and 17.6, respectively). The UV detection and the source location, well above the Galactic plane (), argue for an extragalactic nature, but unfortunately there is no radio counterpart associated with the optical-UV/IR counterpart nor are its WISE colours compatible with an AGN nature for the source. Using the 2MASS magnitudes to compute the free reddening parameter Q = (J–H)–1.7(H–Ks) to create a Q/Ks diagram (Neguerela & Schurch 2007), we find that the source falls in the region of late type stars (Reig & Milonaki 2016) casting doubts on its detection above 20 keV. Furthermore, the lack of emission above 3 keV and the variability seen mostly at X-ray energies further complicate the issue and provide indication that the XRT/XMM-Newton Slew source may not be the correct association to the INTEGRAL object.
Clearly, optical spectroscopy of the only X-ray counterpart found together with further observations at time of strong X-ray emission can shed light and eventually help to classify this source.
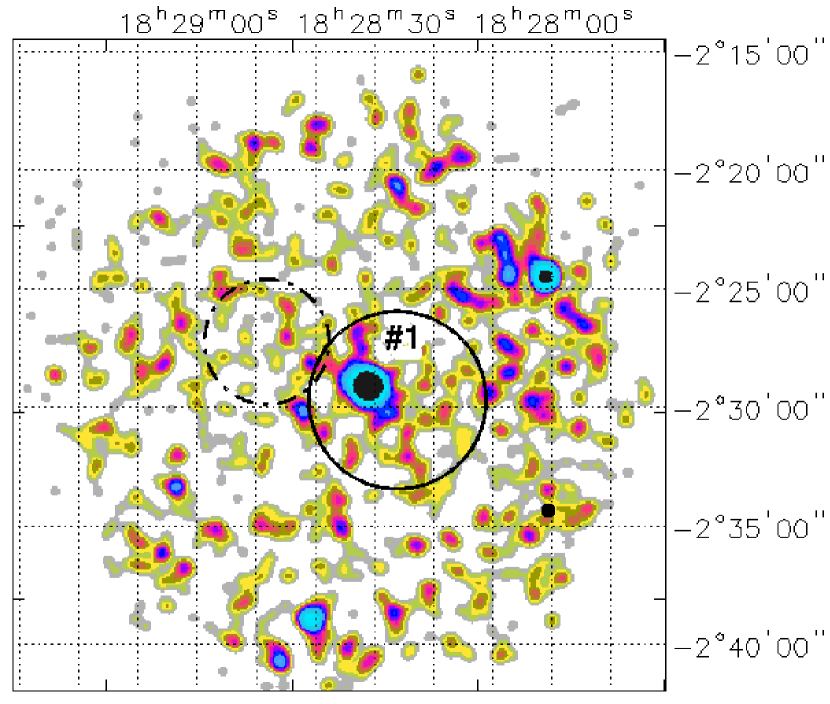
3.11 XMMSL1 J182831.8022901 (also 3PBC J1828.70227)
(Detected as a persistent source)
This source is also reported in the Palermo 66-month Swift/BAT hard X-ray catalogue as
3PBC J1828.70227666Available at:
http://bat.ifc.inaf.it/bat_catalog_web/66m_bat_catalog.html.. XRT detects only one
source which lies within the 90% IBIS error circle, but just outside the 90% BAT positional
uncertainty (see Figure 17). It is seen at 11.6 and 8.9 c.l. in the
0.3–10 and 3–10 keV, respectively (see Table 2). The XRT position is
compatible within respective uncertainties with the location of the XMM-Newton Slew
detections XMMSL1 J182831.8022901 and XMMSL1 J182831.4022914, which are detected at 2.7
and 2.3 c.l. in the 0.2–12 keV energy range with a flux of erg
cm-2 s-1 and erg cm-2 s-1 respectively. Both
detections correspond to a single source seen by XMM-Newton at different epochs
(September 23 and October 12, 2012) and possibly varying over time.
This X-ray source has only a couple of possible IR counterparts (see Table 3).
Our basic power law model does not provide a good fit to the XRT data, which require additional intrinsic absorption ( cm-2). The photon index turns out to be around 1.2 and the 2–10 keV (0.2–12 keV) flux is erg cm-2 s-1 (see Table 4 and Figure 18), which suggests some variability (by a factor of 2.6) if compared to the XMM–Newton Slew ones.
The location of XMMSL1 J182831.8022901 on the Galactic plane () indicates that we may be dealing with either a Galactic source (i.e. some type of X-ray binary) or an AGN hidden behind the Galactic plane. Only IR spectroscopy of the likely counterparts can disintangle which is the correct association and eventually unveils its nature.
| Source | ||||||
|---|---|---|---|---|---|---|
| ( cm-2) | ( cm-2) | ( erg cm-2 s-1) | ||||
| SWIFT J0800.74309 | ||||||
| #1 | 0.353 | – | 43.3/35 | – | ||
| #2 | 0.355 | – | – | 46.5/46 | ||
| SWIFT J0924.23141 | ||||||
| #1a | 0.133 | [1.8] | – | 86.8/71 | ||
| #2b | 0.132 | – | 221.3/213 | – | ||
| IGR J140596116 | ||||||
| #1 | 1.84 | – | [1.8] | – | 52.4/38 | |
| 1RXSJ 145959.4120124 | ||||||
| #1 | 0.0232 | – | 12.0/9 | – | ||
| IGR J150386021 | ||||||
| #1 | 1.26 | – | [1.8] | – | 4.0/7 | |
| IGR J164475138 | ||||||
| #1 | 0.387 | 0.6 | 10.7/9 | – | ||
| IGR J175083219 | ||||||
| #1c | 0.452 | – | – | 27.5/25 | ||
| 0.452 | [1.8] | – | 28.5/25 | |||
| IGR J180074146 | ||||||
| #1 | 0.120 | – | 5.9/6 | – | ||
| IGR J180743827 | ||||||
| #1 | 0.0273 | – | [1.8] | – | 18.5/18 | |
| XMMSL1 J182831.802290 | ||||||
| #1 | 0.512 | 5.3/6 | – | |||
| SWIFT J1839.15717 | ||||||
| #1 | 0.0726 | 71.7/63 | – | |||
| IGR J203103835 | ||||||
| #1c | 1.04 | – | – | 44.2/58 | ||
| 1.04 | [1.8] | – | 45.8/57 | |||
| 1SWXRT J230642.8550817 | ||||||
| #1 | 0.311 | – | – | 44.3/52 | ||
-
a In this case, the best-fit model requires a second power law component, having the same photon index of the primary absorbed power law, and passing only through the Galactic column density;
b In this case, the best-fit model includes a black-body component ( keV) to account for the excess observed below 2 keV;
c For this source, we report the results of the spectral analysis obtained both by leaving the photon index to vary and by freezing it to 1.8 (see text).
3.12 SWIFT J1839.15717
(Detected as a persistent source)
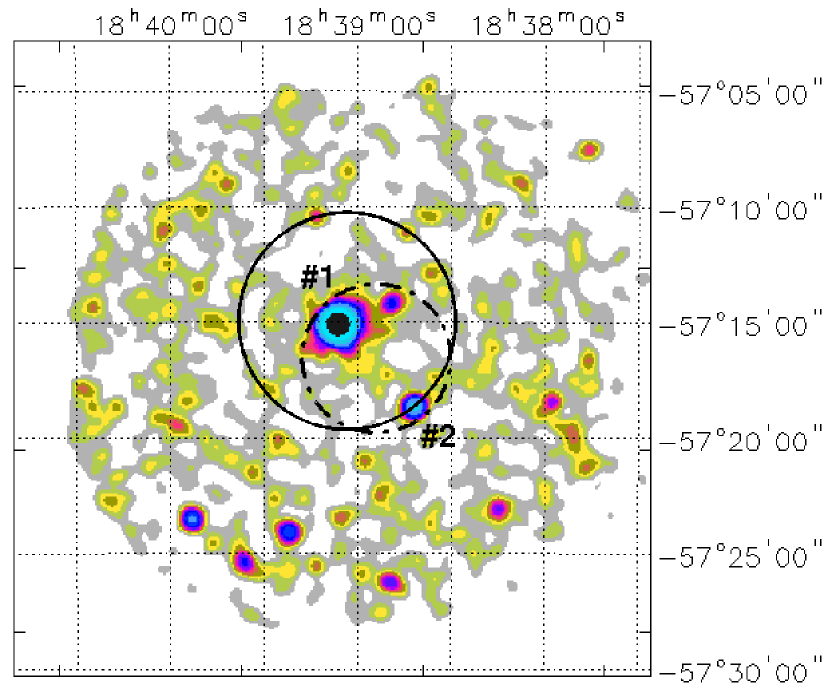
This source is also listed in the 70-month Swift/BAT catalogue (Baumgartner et al. 2013) and it is one of the few objects in our sample located off the Galactic plane (). XRT follow-up observations indicate the presence of two X-ray sources whose positions are compatible with the 90% IBIS/BAT error circles (see Figure 19 and Table 2).
Source #1 is the brightest of the two X-ray detections (around 32.5 and 23.8 c.l. in the 0.3–10 and 3–10 keV, respectively) and also the only one still detected above 3 keV; it is positionally compatible with the allWISE source listed in Table 2.
Its X-ray spectrum requires intrinsic absorption ( cm-2) and shows a photon index and 2–10 keV flux of erg cm-2 s-1 (see Table 4 and Figure 20).
Thus, the XRT data univocally bring us to consider the association of source #1 with SWIFT J1839.15717 highly likely. Not only is it the brightest and hardest object detected in X-rays, but it is also listed in the WISE AGN catalogue by Secrest et al. (2015) since its WISE colours ( and ) are typical of an IR-selected AGN. Furthermore, its location off the Galactic plane strengthens its extragalactic nature. Last but not least, its spectral behaviour suggests a type 2 AGN, i.e. the X-ray spectrum requires intrinsic absorption in excess to the Galactic one.
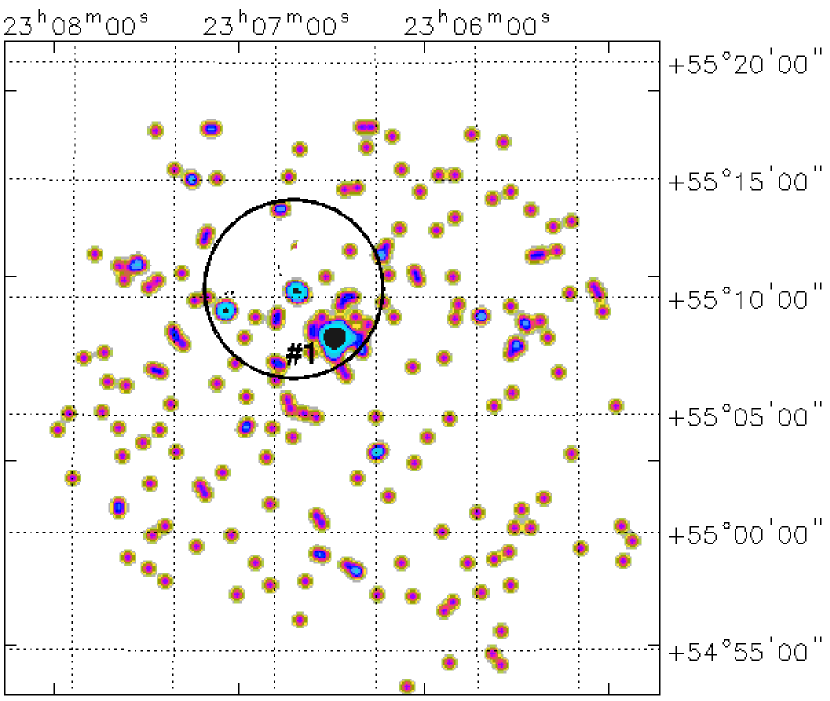
3.13 IGR J203103835 (also 3PBC J2030.83833)
(Detected as a persistent source)
This source is listed in the Palermo 66 month Swift/BAT hard X-ray catalogue as 3PBC J2030.83833.
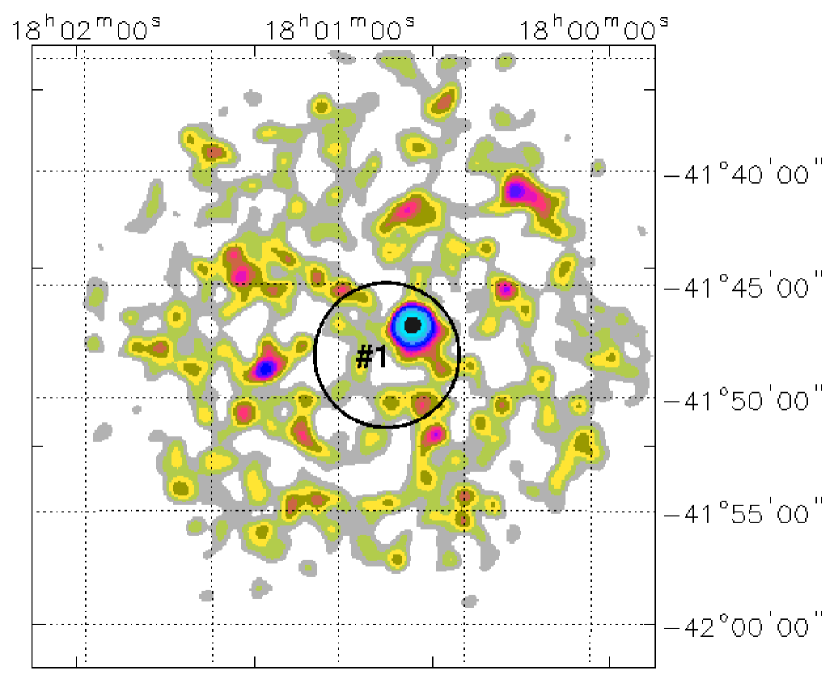
XRT detects two sources whose positions are compatible with either the 90% or 99% IBIS error circle (see Figure 21 and see Table 2), but only one is likely associated with the IBIS/BAT emitter.
Source #1, which is detected at 7.4 c.l. in the range 0.3–10 keV, is the only one detected above 3 keV (6.2 c.l. in the range 3–10 keV) and hence the hardest of the two; it is also the only source compatible with the BAT positional uncertainty. Only two IR counterparts were found for this XRT object (see Table 2).
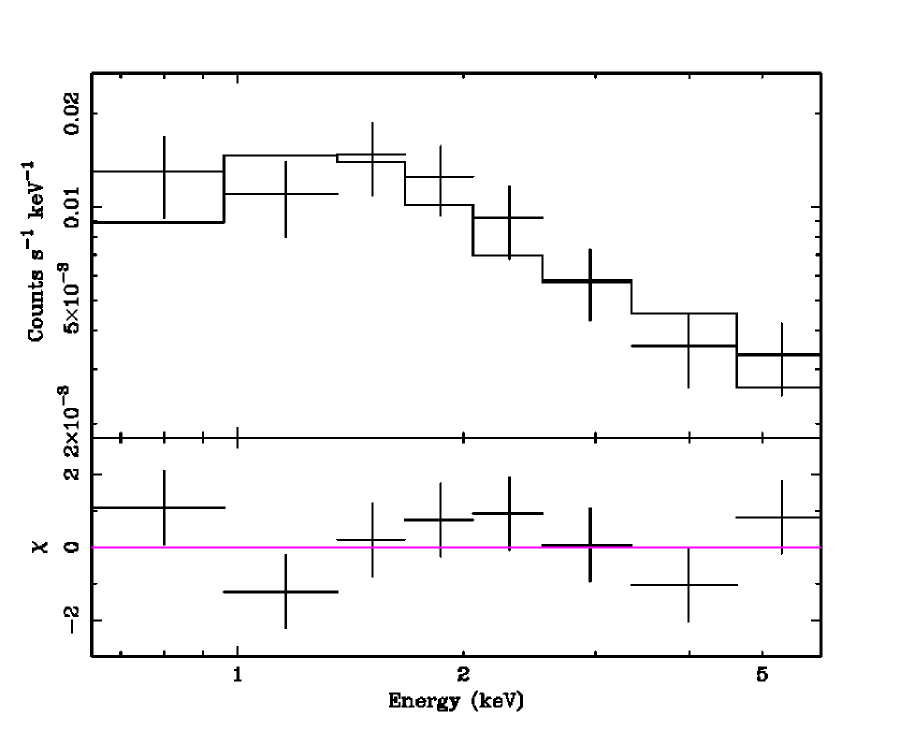
By fitting the XRT data with our basic model we find a flat photon index () and a 2–10 keV flux of erg cm-2 s-1. If we freeze the photon index to 1.8, the data require an intrinsic column density cm-2; in this case the 2–10 keV flux is around erg cm-2 s-1 (see Table 4).
These findings, combined with the location of IGR J203103835 on the Galactic plane (), suggest again that we may be dealing with either a Galactic source or an absorbed AGN hidden behind the Galactic plane. Only IR spectroscopy of the likely counterparts can discriminate between these two options.
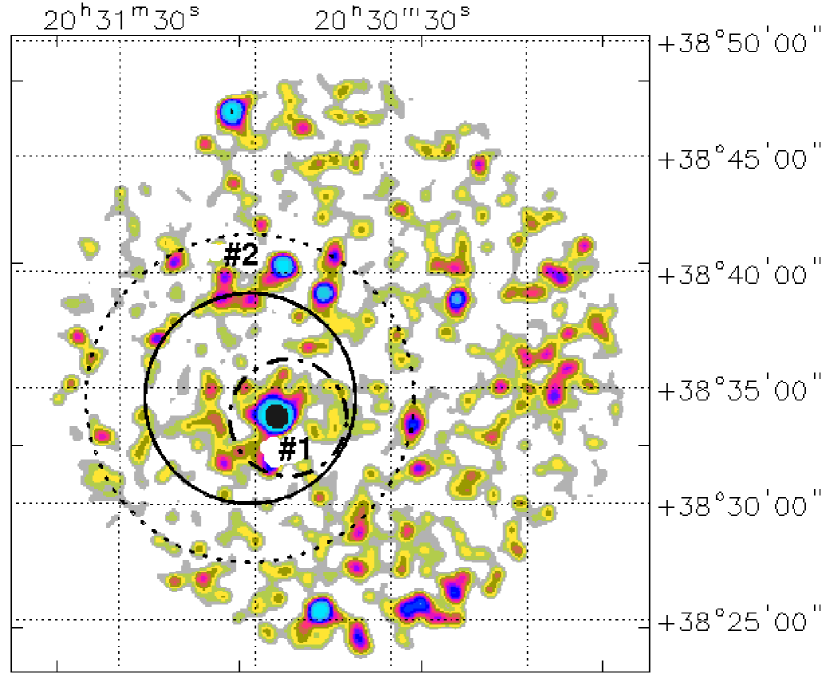
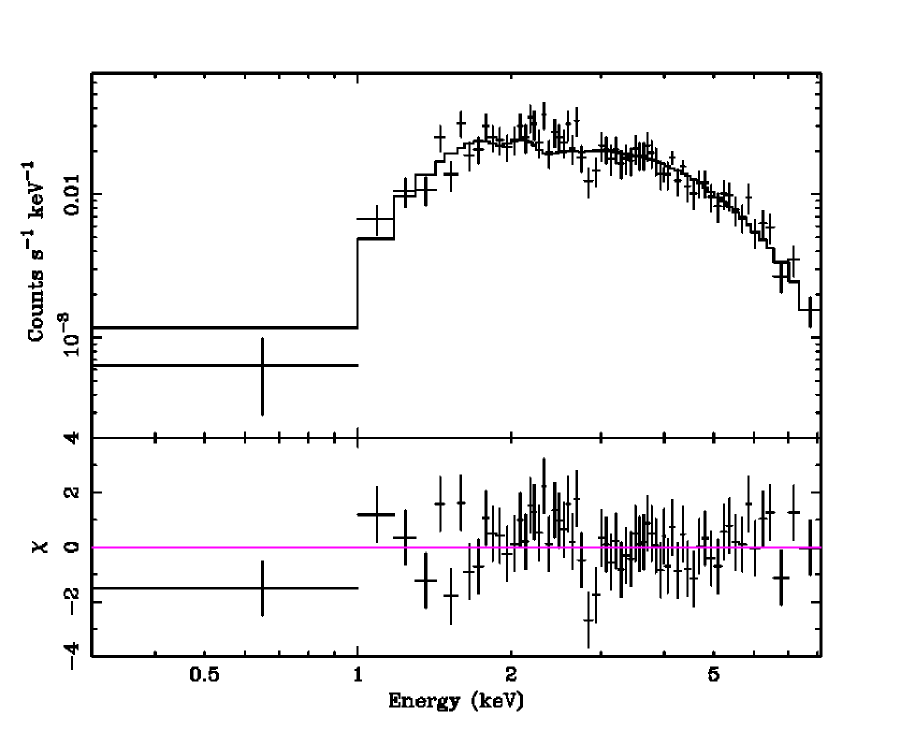
3.14 1SWXRT J230642.8550817
(Detected as a persistent source)
As shown in Figure 22 only one X-ray source is detected by XRT within the 90% IBIS positional uncertainty at 7.4 and 4.4 c.l. in the 0.3–10 and 3–10 keV energy band, respectively. It has a single optical/infrared counterpart as reported in Table 2. This source is also listed as an Hα emission line object in the INT/WFC Photometric Hα Survey (IPHAS, Witham et al. 2008). Indeed, it has recently been classified as a CV by Masetti et al. (in preparation), who will provide details on the optical spectrum in a forthcoming paper.
The XRT spectrum shows a flat photon index () and a 2–10 keV flux of erg cm-2 s-1 (see Table 4). The source properties and its optical classification argue strongly in favour of its association with the newly reported IBIS object.
4 Summary and conclusions
In this paper, we report on the results of a work aimed at exploiting Swift/XRT archival data to search for candidate counterparts to a set of still unidentified sources listed in the latest INTEGRAL/IBIS survey (Bird et al. 2016). Only in one case, we were not able to provide an XRT association, although a possible X-ray counterpart was reported in the XMM-Newton Slew survey; in all other cases one or two likely associations were found. The more accurate position provided by XRT enabled us to pinpoint the optical, IR, and UV counterpart for most of these candidate associations. Moreover, for the brightest objects, i.e. those having a signal-to-noise ratio good enough to allow a reliable spectral analysis, we also characterised the X-ray spectrum, while for the fainter sources only a flux estimate in the 2–10 or 0.2–12 keV energy range is reported. When more than one XRT pointing were available and/or an association/s with XMM-Newton Slew survey were found, we also explored flux varibility in the X-ray band. All the information gathered helped us to propose, for each IBIS source, the most likely counterpart and discuss its nature. For SWIFT J0924.23142 we found that the high-energy emission, although most likely due to the contribution of two objects (a Seyfert 2 and a bright unclassified source) up to 15 keV, it is related only to the AGN above these energies. Optical follow-up observations of the proposed counterpart to SWIFT J0800.74309 and 1SWXRT J230642.8550817 has led Rojas et al. (2016) and Masetti et al. (in preparation) to classify both of them as CVs. The properties found for one of the few IBIS objects detected off the Galactic plane (SWIFT J1839.15717) suggest it is most likely a type 2 AGN. Finally, we note that IGR J140596116 is likely associated with a GeV source (3FGL J1405.46119). In all other cases, follow-up optical/IR observations are necessary to help to classify the proposed counterparts and assess their ultimate nature.
As a final remark, we note that the results of this work confirms the key role played by follow-up observations with current X-ray telescopes and the importance of multi-waveband studies, in particular optical/infrared spectroscopy.
Acknowledgments
We thank the anonymous referee for useful comments/suggestions that help to improve the quality of the paper. This research has made use of data obtained from the SIMBAD database operated at CDS, Strasbourg, France; from the High Energy Astrophysics Science Archive Research Center (HEASARC), provided by NASA’s Goddard Space Flight Center; from the NASA/IPAC Extragalactic Database (NED); and from the Palermo BAT catalogue and database opened at INAF–IASF Palermo. The authors also acknowledge the use of public data from the Swift data archive. The authors acknowledge financial support from ASI under contract INTEGRAL ASI 2013–025–R.0.
References
- Acero (2015) Acero F. et al., 2015, ApJS, 218, 23
- Barthelmy (2005) Barthelmy S. D. et al. 2005, Space Sci. Rev., 120, 143
- Baumgartner (2013) Baumgartner W. H., Tueller J., Markwardt C. B., Skinner G. K., Barthelmy S., Mushotzky R. F., Evans P. A. Gehrels N. 2013, ApJS, 207, 19
- Bird (2016) Bird A. J. et al. 2016, ApJS, 223, 15
- Cash (1979) Cash W. 1979, ApJ, 228, 939
- Condon (1998) Condon J. J., Cotton W. D., Greisen E. W., Yin Q. F., Perley R. A., Taylor G. B., Broderick J. J., 1998, AJ, 115, 1693
- Churcwell (2009) Churchwell E. et al. 2009, PASJ, 212, 213
- Cusumano (2010) Cusumano G. et al., 2010, A&A, 524, A64
- Gehrels (2004) Gehrels N. et al., 2004, ApJ, 611, 1005
- Helfand (2015) Helfand D. J., White R. L., Becker R. H. 2015, ApJ, 801, 26
- Kalberla (2005) Kalberla P. M. W., Burton W. B., Hartmann D., Arnal E. M., Bajaja E., Morras R., Pöppel W. G. L., 2005, A&A, 440, 775
- Kuhn (2013) Kuhn M. A., Povich M. S., Luhman K. L., Getman K. V., Busk H. A., Feigelson E. D. 2013, ApJS, 209, 29
- Landi (2009) Landi R., Bassani L., Dean A. J., Bird A. J., Fiocchi M., Bazzano A., Nousek J. A., Osborne J. P. 2009, MNRAS, 392, 630
- Landi (2012) Landi R., Bassani L. Masetti N., Bazzano A., Tarana A., Bird, A. J. 2012. ATel, 4233
- Lee (2012) Lee K. J., Guillemot L., Yue Y. L., Kramer M., Champion D. J. 2012, MNRAS, 424, 2832
- Lucas (2008) Lucas P. W. et al. 2008, MNRAS, 391, 136
- Malizia (2016) Malizia A., Landi R., Molina M., Bassani L., Bazzano A., Bird A. J., Ubertini P. 2016, MNRAS, 460, 19
- Marton (2016) Marton G., Tóth L. V., Paladini R., Kun M., Zahorecz S., McGehee P., Kiss Cs, 2016, MNRAS, 458, 3479
- Monet (1998) Monet D. G., 1998, American Astronomical Society, 193rd AAS Meeting, BAAS, Vol. 30, p.1427
- Monet (2003) Monet D. G. et al. 2003, AJ, 125, 984
- Masetti (2013) Masetti N. et al. 2013, A&A, 559, A58
- Neguerela (2007) Negueruela I., Schurch M. P. 2007, A&A, 461, 631
- Reig (2016) Reig, P., Milonaki F. 2016, A&A, 594, A45
- Ricci (2016) Ricci C., Ueda Y., Koss M. J., Trakhtenbrot B., Bauer F. E., Gandhi P. 2015, ApJL, 815, L13
- Rojas (2016) Rojas, A. F. et al. 2017, preprint (arXiv:1702.01629)
- Saz-parkinson (2016) Saz-Parkinson P. M., Xu H., Yu P. L. H., Salvetti D., Marelli M., Falcone A. D. 2016, ApJ, 820, 8
- Saxton (2008) Saxton R. D., Read A. M., Esquej P., Freyberg M. J., Altieri B., Bermejo D. 2008, A&A, 480, 611
- Secrest (2015) Secrest N. J., Dudik R. P., Dorland B. N., Zacharias N., Makarov V., Fey A., Frouard J., Finch C. 2015, ApJS, 221, 12
- Skrutskie (2006) Skrutskie M. F. et al. 2006, AJ, 131, 1163
- Ubertini (2003) Ubertini P. et al. 2003, A&A, 411, L131
- Voges (1999) Voges W., et al. 1999, A&A, 349, 389
- Veron (2010) Véron-Cetty M. P., Véron, P. 2010, A&A, 518, A10
- Wang (2016) Wang S., Liu J., Qiu Y., Bai Y., Yang H., Guo J., Zhang P. 2016, ApJS, 224, 40
- Winkler (2003) Winkler C. et al. 2003, A&A, 411, L1
- Witham (2008) Witham A. R., Knigge C., Drew J. E., Greimel R., Steeghs D., Gänsicke B. T., Groot P. J., Mampaso A. 2008, MNRAS, 384, 1277