Light curve analysis of ordinary type IIP supernovae based on neutrino-driven explosion simulations in three dimensions
Abstract
Type II-plateau supernovae (SNe IIP) are the most numerous subclass of core-collapse SNe originating from massive stars. In the framework of the neutrino-driven explosion mechanism, we study the SN outburst properties for a red supergiant progenitor model and compare the corresponding light curves with observations of the ordinary Type IIP SN 1999em. Three-dimensional (3D) simulations of (parametrically triggered) neutrino-driven explosions are performed with the (explicit, finite-volume, Eulerian, multifluid hydrodynamics) code Prometheus, using a presupernova model of a 15 star as initial data. At approaching homologous expansion, the hydrodynamical and composition variables of the 3D models are mapped to a spherically symmetric configuration, and the simulations are continued with the (implicit, Lagrangian radiation-hydrodynamics) code Crab to follow the blast-wave evolution during the SN outburst. Our 3D neutrino-driven explosion model with an explosion energy of about erg produces 56Ni in rough agreement with the amount deduced from fitting the radioactively powered light-curve tail of SN 1999em. The considered presupernova model, 3D explosion simulations, and light-curve calculations can explain the basic observational features of SN 1999em, except for those connected to the presupernova structure of the outer stellar layers. Our 3D simulations show that the distribution of 56Ni-rich matter in velocity space is asymmetric with a strong dipole component that is consistent with the observations of SN 1999em. The monotonic luminosity decline from the plateau to the radioactive tail in ordinary SNe IIP is a manifestation of the intense turbulent mixing at the He/H composition interface.
1 Introduction
Massive stars in the range of 9 produce a core of iron which collapses to a neutron star with the subsequent explosion ending the stellar lives as type II-plateau supernovae (SNe IIP) (e.g., Heger et al., 2003). These hydrogen-rich objects are subdivided into the ordinary SNe IIP (e.g., SN 1999em, SN 2004et, SN 2012A), which show a plateau in the light curve, and the peculiar SNe IIP (e.g., SN 1987A, SN 2000cb, SN 2009E), which instead exhibit a dome-like light curve. For a wealth of detail, insightful commentary, and further references, the reader may refer to large samples of SNe IIP collected by Bersten & Hamuy (2009), Anderson et al. (2014), Faran et al. (2014), and Sanders et al. (2015). Relative fractions of the ordinary SNe IIP and the SN 1987A-like events are about 50% (Li et al., 2011; Smith et al., 2011) and 1–3% (Pastorello et al., 2012) of all core-collapse SNe (CCSNe), respectively. It is theoretically established (Grassberg et al., 1971; Falk & Arnett, 1977) and empirically confirmed (Smartt, 2009) that the most common ordinary SNe IIP originate from red supergiant (RSG) stars, while the peculiar objects are identified with the explosions of blue supergiant (BSG) stars (e.g., Arnett et al., 1989).
The phenomenon of CCSNe is very complex while considerable progress has been made in the last years in simulating these events (see, e.g., the reviews Janka et al., 2016; Müller, 2016), we need more observational information about how the explosion engine works. Fortunately, very different energies and timescales inside the star just before the gravitational collapse of its central iron core allow us to divide the whole problem into two: an “internal problem” (the gravitational collapse itself) and an “external problem” (the collapse-initiated SN outburst) (Imshennik & Nadezhin, 1989), and to explore them independently. In a previous paper we applied this approach to the well-observed and well-studied peculiar SN 1987A showing that the available pre-SN models, three-dimensional (3D) neutrino-driven explosion simulations with an approximate, parametrized neutrino engine (tuned to yield the observed values of the explosion energy and ejected 56Ni mass of SN 1987A), and light curve modeling can explain the basic observational data (Utrobin et al., 2015).

In this work we continue the study of SNe IIP in the framework of the neutrino-driven explosion mechanism. Ordinary SNe IIP exhibit a wide range of luminosities in the plateau phase and total masses of radioactive 56Ni, which is illustrated, for example, by the luminous SN 2004et, the normal SN 1999em, and the sub-luminous SN 2012A (Fig. 1). All of these SNe originate from RSG stars, and their luminosities are produced by the release of the internal energy deposited during the shock wave propagation through the pre-SN envelope. This energy release results in a monotonic decrease of the bolometric luminosity from the shock breakout to the radioactive tail. Of particular interest is the luminosity decline at around 100 days, which is related to the exhaustion of radiation energy from the inner layers of the ejecta. These layers are subject to hydrodynamic instabilities and turbulent mixing at the C+O/He and He/H composition interfaces occurring during the explosion. The band light curves of the bright SN 2009bw, the normal SN 1999gi, and the sub-luminous SN 2008in support the monotonicity of the luminosity decline (see inset in Fig. 1).
Important properties of the explosion can be deduced from observations and modeling of SNe IIP in the nebular phase when the ejecta become optically thin and nucleosynthesis products in the inner layers become visible. Spectroscopic observations of the peculiar SN 1987A provide clear evidence for macroscopic mixing of the elements occurring during the explosion, which is well quantified (Utrobin et al., 2015). Unfortunately, among the ordinary SNe IIP there is no such well-observed and well-studied object as SN 1987A to firmly assess the extent of mixing of radioactive 56Ni and hydrogen in the ejecta. Maguire et al. (2012) found for all of the spectra in their sample of eight SNe IIP that the line profile shapes do not evolve with time. They concluded that radioactive 56Ni is not concentrated in the central core of the ejecta, but instead is distributed by mixing to regions farther out. Elmhamdi et al. (2003) analyzed the H and He i 10 830 Å lines in the normal SN 1999em at the nebular epoch and concluded that the distribution of the bulk of radioactive 56Ni can be approximated by a sphere of 56Ni with a velocity of 1500 km s-1, which is shifted towards the far hemisphere by about 400 km s-1. Chugai (2007) interpreted the double-peak structure of H at the nebular epoch in terms of asymmetric bipolar radioactive 56Ni jets. Maguire et al. (2012) also showed that the line profiles are intrinsically peaked in shape and suggested that mixing of the elements including hydrogen must occur in the ejecta to allow elements to be located at zero velocity.
Hydrodynamic models, solving the external problem of the SN explosion and based on evolutionary calculations of pre-SN models, are consistent with the observed light curves of ordinary SNe IIP only in basic aspects. In particular, the theoretical light curves exhibit a conspicuous shoulder-like (Woosley & Heger 2007, Fig. 5; Morozova et al. 2015, Fig. 17; Sukhbold et al. 2016, Fig. 33, lower panel) or spike-like (Chieffi et al. 2003, Fig. 11; Young 2004, Fig. 1a) feature during the luminosity decline from the plateau to the radioactive tail, which is not observed (Fig. 1). The feature occurs in hydrodynamic simulations of SN explosions triggered by both a thermal and/or kinetic bomb (Chieffi et al., 2003; Young, 2004; Morozova et al., 2015) and a piston (Woosley & Heger, 2007; Sukhbold et al., 2016). It is noteworthy that even invoking artificial mixing in the inner layers of the ejecta does not eliminate the unobserved post-plateau feature (Young, 2004).
On the other hand, hydrodynamic simulations based on nonevolutionary pre-SN models fairly well fit the observations of the luminous SN 2004et (Utrobin & Chugai, 2009), the normal SN 1999em (Baklanov et al., 2005; Utrobin, 2007)111Bersten et al. (2011) also used nonevolutionary pre-SN models to study SN 1999em, but invoked an extended 56Ni mixing to eliminate a bump feature at the end of the plateau and to obtain a nearly flat plateau of the light curve. See Sect. 6 for details., and the sub-luminous SN 2012A (Utrobin & Chugai, 2015). In addition, the density profile of the nonevolutionary pre-SN models and the artificial mixing of radioactive 56Ni and hydrogen produce the monotonic luminosity decline from the plateau to the radioactive tail.

Our representative sample of ordinary SNe IIP, restricted to six different objects with luminosities in the range from low to high values, shows that SN 1999em is a typical one (Fig. 1). For this reason, the normal SN 1999em is commonly considered as a template case of ordinary SNe IIP, and we will focus on it in our study. As in the case of SN 1987A (Utrobin et al., 2015), we carry out 3D hydrodynamic simulations of neutrino-driven explosions for the evolutionary pre-SN model of an RSG star. These simulations yield a complex morphology of radioactive 56Ni and hydrogen mixing. This morphology is retained in its global radial features after mapping to a spherically symmetric grid in order to simulate the evolution of SN 1999em after shock breakout and its light curve. It is noteworthy that the turbulent mixing in the inner layers of the ejecta results in a modified density profile and sufficient mixing of both radioactive 56Ni and hydrogen such that the spike in the luminosity decline from the plateau to the radioactive tail nearly disappears (see below).
The paper is organized as follows. In Sect. 2 we briefly describe the pre-SN model, the 3D simulations of the neutrino-driven onset of the explosion, the 3D hydrodynamic modeling of the subsequent evolution until shock breakout, and the hydrodynamic light curve modeling. We analyze the simulation results in Sect. 3 and compare them with observations of SN 1999em in Sect. 5. The origin of the unobserved luminosity spike in 1D hydrodynamic models is studied in Sect. 4. Finally, in Sect. 6 we summarize and discuss our results.

2 Numerical methods and model overview
2.1 Presupernova models
| Model | Ref. | |||||||
|---|---|---|---|---|---|---|---|---|
| L15 | 627 | 4.35 | 14.85aaActual mass of the pre-SN/progenitor model. | 15.0bbNominal mass of the progenitor star. | 0.666 | 0.314 | 2.0 | 1 |
| Optimal | 500 | — | 20.60 | 22.2 | 0.735 | 0.248 | 1.7 | 2 |
Note. — The columns give the name of the pre-SN model, its radius, ; the helium-core mass, ; the pre-SN mass, ; the progenitor mass, ; the mass fraction of hydrogen, ; helium, ; and heavy elements, , in the hydrogen-rich envelope at the stage of core collapse; and the corresponding reference.
We investigate a pre-SN model obtained for a 15 progenitor star evolved by Limongi et al. (2000) from the pre-main sequence up to the onset of collapse with the stellar evolution code Franec (Table 2.1). The model has solar chemical composition and was evolved with a nuclear reaction network extending up to 68Zn. Convection was treated by means of the mixing-length formalism of Böhm-Vitense with the Schwarzschild criterion. Semiconvection and overshooting were taken into account too. The evolution was calculated without considering mass loss and the effects of rotation. The pre-SN model, which we name L15, provides the initial data for our 3D neutrino-driven CCSN explosion simulations. It has a helium core of 4.35 and a radius of 627 typical of RSG stars (Table 2.1, Fig. 2). The chemical composition of pre-SN model L15 is shown in Fig. 3.
For comparison, we provide the basic parameters of a nonevolutionary pre-SN model for SN 1999em (optimal model in Table 2.1) constructed by Utrobin (2007). Creating an adequate hydrodynamic explosion model is based on the method of trial and error using general relations between its basic physical parameters, the density and chemical composition distributions of the pre-SN model, and observed properties (Utrobin, 2007). A comprehensive comparison of the calculated observable model properties with photometric and spectroscopic observations allows one to select the optimal hydrodynamic model. Applying this procedure to SN 1999em results in a model that is quite different from that of the evolutionary pre-SN model L15. In particular, the nonevolutionary model has no steep density gradients like those present in the pre-SN model L15 (Fig. 2). We note that such a nonevolutionary pre-SN model mimics the intense turbulent mixing occurring during the explosion at the locations of the Si/O, (C+O)/He, and He/H composition interfaces (Utrobin & Chugai, 2008). In addition, a sharp density decline in the outermost layers of the model is favorable for an acceleration of these layers to the high velocities inferred from the spectral lines of SN 1999em.
2.2 3D hydrodynamic modeling until shock breakout
Our 3D calculations are performed with the explicit finite-volume, Eulerian, multifluid hydrodynamics code Prometheus (Fryxell et al., 1991; Müller et al., 1991a, b). It integrates the multidimensional hydrodynamic equations using dimensional splitting (Strang, 1968), piecewise parabolic reconstruction (Colella & Woodward, 1984), and a Riemann solver for real gases (Colella & Glaz, 1985). To relax the restrictive CFL-timestep condition and to avoid numerical artifacts near the polar axis, Prometheus employs an axis-free overlapping “Yin-Yang” grid (Kageyama & Sato, 2004) in spherical polar coordinates, which was implemented into the code by Wongwathanarat et al. (2010). Newtonian self-gravity is taken into account by solving Poisson’s equation in its integral form, using an expansion into spherical harmonics (Müller & Steinmetz, 1995).
The SN explosion is triggered by imposing a suitable value of the neutrino luminosities at an inner grid boundary located at an enclosed mass of 1.1 well inside of the neutrinosphere. Outside this boundary, which is moved to mimic the contracting proto-neutron star, we apply an approximate neutrino transport and neutrino-matter interactions as described in Scheck et al. (2006). The explosion energy of the model is determined by the imposed isotropic neutrino luminosity, whose temporal evolution we prescribe too, and the accretion luminosity which results from the progenitor dependent mass accretion rate and the gravitational potential of the contracting neutron star. To follow the explosive nucleosynthesis approximately, a small -chain reaction network, similar to the network described in Kifonidis et al. (2003), is solved.
| Model | Remark | |||||||
|---|---|---|---|---|---|---|---|---|
| (B) | ( s) | |||||||
| L15-le | 2.04 | 12.81 | 0.54 | 1.8 | 5.7 | 3.6 | 1.11 | 3D Sim. |
| L15-he | 1.79 | 13.06 | 0.93 | 2.8 | 9.6 | 6.8 | 0.88 | 3D Sim. |
| L15-lm | 2.04 | 11.16 | 0.54 | 1.8 | 5.7 | 3.6 | 0.68 | 3D Sim. |
| L15-pn | 1.53 | 13.32 | 0.50 | — | — | 3.6 | — | Piston |
| Optimal | 1.60 | 19.00 | 1.30 | — | — | 3.6 | — | Piston |
Note. — The computed models are based on the corresponding pre-SN models of Table 2.1. is the mass of the collapsed remnant; the ejecta mass; the explosion energy; the mass of radioactive 56Ni produced directly by our -chain reaction network; the aggregate mass of directly produced 56Ni and tracer nucleus; and the radioactive 56Ni mass used in the 1D simulations. is the time at which the 3D simulations are mapped to a spherically symmetric grid.
As our reference model we choose a 3D CCSN explosion model calculated by Wongwathanarat et al. (2013), which was denoted L15-5 in Wongwathanarat et al. (2013). It is based on the pre-SN model L15 (Table 2.1) and was evolved until 1.4 s after core bounce with the simplified, gray neutrino transport. We simulated the subsequent evolution until shock breakout for two models, L15-le and L15-he, which differ mainly by their explosion energies (Table 2). To increase the explosion energy without destroying the global morphology of the ejecta, we boosted model L15-he by a constant neutrino-driven wind at the inner grid boundary for another 2 s, whereas we simulated model L15-le with a neutrino-driven wind that declines with time by a power law (Wongwathanarat et al., 2015). This treatment is supposed to single out the dependence of the light curve modeling on the explosion energy, while preserving the explosion asymmetry of the 3D reference model at 1.4 s. Redoing a 3D explosion simulation from core bounce on with a final explosion energy similar to model L15-he but different (stochastically developing) ejecta morphology, we do neither expect significant differences in the 56Ni yield (explosion energy and 56Ni production are tightly correlated in neutrino-driven explosions; see Sukhbold et al. (2016)) nor in the extent of 56Ni mixing, which depends mostly on the explosion energy and the progenitor structure (Wongwathanarat et al., 2015). For explosion simulations with energies similar to model L15-he we therefore expect very similar light curves.
Basic properties of the averaged 3D simulations for two computed models L15-le and L15-he are listed in Table 2. The explosion energy is defined as the sum of the total (i.e., internal plus kinetic plus gravitational) energy of all grid cells at the time when the 3D data are mapped to the 1D grid for simulating the light-curve formation. Throughout this paper, we employ the energy unit erg.
Because the approximate treatment of neutrino-transport employed in the 3D explosion model does not allow us to capture accurately the time evolution of the electron fraction in the neutrino-processed ejecta, where a significant fraction of 56Ni can be produced, we provide minimum and maximum 56Ni yields of the 3D models in Table 2. The minimum yield of 56Ni is produced directly (mostly in shock-heated ejecta) by our -chain reaction network. The maximum yield of 56Ni, in turn, is given by the mass of 56Ni plus the mass of a tracer species which is produced in neutrino-heated ejecta under conditions of neutron excess.
To match the duration of the plateau phase of the light curve of SN 1999em, we construct an additional model, L15-lm in Table 2, which is based on model L15-le, but whose ejecta mass is decreased by removing the outermost hydrogen-rich layers of . This reduction in the ejecta mass can be interpreted as a mass loss of by the progenitor star (Table 2.1). A justification of this assumption can be obtained from an analysis of the observations of SN 1999em, in which Chugai et al. (2007) showed that its progenitor star had lost about 1 during the RSG stage. For a 20 star with a luminosity of 105 and a mass-loss rate of less than 10-7 year-1 (Krtička, 2014), the mass lost by winds is less than 1 during the 107 year it spends on the main sequence. Thus, the total mass lost by the progenitor of SN 1999em does not exceed 2 .
To compare the hydrodynamic models based on 3D neutrino-driven explosion simulations and the evolutionary pre-SN model L15 with 1D explosions triggered by a piston, we compute model L15-pn using the evolutionary pre-SN model L15, and also consider the optimal model based on the nonevolutionary pre-SN model (Utrobin, 2007) (Table 2). In 3D explosion simulations 56Ni mixing results from hydrodynamic instabilities. In contrast, both in model L15-pn and the optimal model, which are exploded with a 1D piston, 56Ni is mixed artificially and nearly uniformly in velocity space up to 450 and 660 km s-1, respectively.
2.3 Mapping 3D simulations to 1D problem
To follow the evolution beyond shock breakout, we average the 3D hydrodynamic flow and the distribution of chemical elements on a spherically symmetric grid at chosen times and interpolate them onto the Lagrangian (mass) grid of the 1D simulations. These data are used as the initial conditions for the external problem of the hydrodynamic modeling of the SN outburst. With the hydrodynamic flow being given by our 3D simulations of neutrino-driven explosions, there is no need to initiate the explosion by a supersonic piston. Another way of triggering a SN explosion is a thermal and/or kinetic bomb, whose effect on the light curve from the shock breakout to the end of the plateau is indistinguishable from that of piston-driven explosion, if the bomb does not extend significantly beyond the Si shell and acts no longer than a few seconds.
2.4 Light curve modeling
We simulate the evolution of the SN outburst after shock breakout with the implicit Lagrangian radiation hydrodynamics code Crab (Utrobin, 2004, 2007). It solves the set of spherically symmetric hydrodynamic equations including self-gravity, and a radiation transfer equation in gray approximation (e.g., Mihalas & Mihalas, 1984). The time-dependent radiative transfer equation, written in a comoving frame of reference to accuracy of order ( is the fluid velocity, is the speed of light), is solved using the zeroth and first angular moments of the nonequilibrium radiation intensity. This system of moment equations is closed by calculating a variable Eddington factor directly taking into account scattering of radiation in the SN ejecta. The diffusion of equilibrium radiation, occurring in the inner, optically thick layers of the ejecta, is treated in the approximation of radiative heat conduction. The resultant set of equations is discretized spatially using the method of lines (e.g., Hairer et al., 1993; Hairer & Wanner, 1996). Energy deposition of gamma rays with energies of about 1 MeV from the decay chain 56Ni Co Fe is calculated by solving the corresponding gamma-ray transport. The equation of state, the mean opacities, and the thermal emission coefficient are computed taking non-LTE and non-thermal effects into account. In addition, the contribution of spectral lines to the opacity in a medium expanding with a velocity gradient is estimated by the generalized formula of Castor et al. (1975). We refer to Utrobin et al. (2015) and references therein for details on the numerical set up.
3 Results
3.1 Mixing in 3D explosion simulations
First of all we outline the development of neutrino-driven explosions after core bounce (see, e.g., Wongwathanarat et al., 2015, for details). As an illustrative example, we consider our fiducial model L15-le (Table 2). Growth of Rayleigh-Taylor mushrooms from the imposed seed perturbations are first visible at about ms after bounce. These small mushrooms merge into high-entropy bubbles, which rise outward to the immediate vicinity behind the SN shock, providing pressure support for the SN shock against the ram pressure of infalling material. Supported by convective overturn and global shock motions due to the standing accretion shock instability (SASI; e.g., Blondin et al., 2003; Scheck et al., 2008; Ohnishi et al., 2006), the delayed, neutrino-driven explosion sets in at roughly ms after bounce.
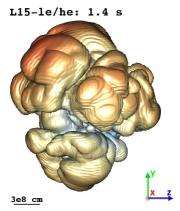
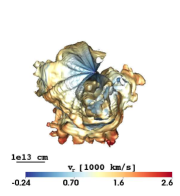
Neutrino-driven convection and SASI mass motions during the launch of the explosion create the morphology of the neutrino-heated ejecta. Kifonidis et al. (2003) showed that 56Ni is explosively produced in “pockets” between the high-entropy bubbles of neutrino-heated matter, i.e. the distribution of 56Ni reflects the asymmetries of the first second of the explosion (Fig. 4, left panels). Around s after bounce, when the SN shock reaches the (C+O)/He composition interface, the morphology of the 56Ni-rich ejecta still resembles their initial asymmetries.
The further evolution of the explosion depends strongly on the density profile of the pre-SN star, because the profile determines the amount of deceleration that the shock experiences while propagating through the helium and hydrogen layers of the star. Dense shells form behind the decelerating shock, which become Rayleigh-Taylor unstable. Thereby the initial morphology of the metal (iron) rich ejecta can be modified, if the dense shells form before these ejecta reach the formation sites of the dense shells. Whether this happens depends on the relative speed of the shock wave and the innermost ejecta (Wongwathanarat et al., 2015).
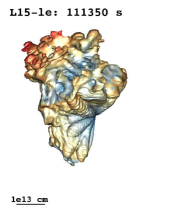
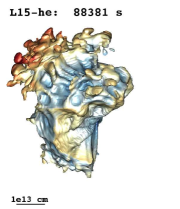
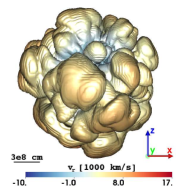
Figure 4 (middle and left panels) shows that the morphology of the 56Ni-rich ejecta of model L15-le at late times reflects the initial asymmetries of the neutrino-heated bubbles, i.e. global asymmetry is imprinted by the explosion mechanism rather than being a result of (secondary) Rayleigh-Taylor instabilities at the pre-SN composition interfaces. The figure also shows (middle panels) that the 56Ni-rich ejecta have a pronounced dipolar component of asymmetry, the radial velocities of the fastest 56Ni-rich fingers reaching 2600 km s-1. Relative to the center of mass motion of the 56Ni ejecta (containing the directly produced 56Ni and 50% of the tracer nucleus) the velocity asymmetry amounts to nearly 300 km s-1.
Models L15-le and L15-he have significantly different explosion energies (0.54 B and 0.93 B; see Table 2). The more energetic model L15-he is evolving faster than model L15-le, i.e. the velocities of its shock and 56Ni-rich matter are higher than those of the less energetic model L15-le. However, because both models are based on the same explosion calculation (L15 at 1.4 s post bounce) and the increased explosion energy of model L15-he is the result of a subsequently imposed spherically symmetric constant neutrino-driven wind, we find no significant differences between the morphologies of their 56Ni-rich ejecta (Fig. 4, middle and right panels).
The asymmetry of 56Ni-rich matter with a strong dipole component in model L15-le differs considerably from that of the more energetic models L15-1-cw and L15-2-cw, which are based on the same pre-SN star but have an explosion energy of 1.75 B and 2.75 B, respectively (Wongwathanarat et al., 2015). The model sequence L15-le, L15-1-cw, and L15-2-cw, along which the explosion energy increases, reveals a clear correlation between the morphology of 56Ni-rich matter and the explosion energy. These models demonstrate that long-lasting phases of SASI activity tend to give rise to more extreme asymmetries of the distribution of 56Ni-rich ejecta, correlated with lower explosion energies, in which case low-mode asymmetries have more time to grow during shock revival before the explosion sets in.
As the main shock propagates through the exploding star until it finally breaks out from the stellar surface, the initial explosion asymmetry and shock deformation shape the ejecta and thus determine the global morphology also of the outer layers. To measure the asphericity of the outer layers in the 3D simulations of model L15-le, we approximated the photosphere by an ellipsoidal surface for a density close to the photospheric density found in the averaged 3D simulations. The maximum ratio of the semiaxes for the approximation thus obtained at 1.86 days is 1.153.
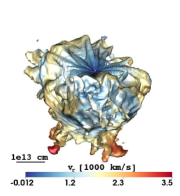
3.2 Approach to homologous expansion
Homologous expansion occurs when the contributions of pressure gradients and gravitational forces to the momentum equation may be neglected. We show the approach of the flow to homology for model L15-le in Fig. 5, which covers the evolution of the (Lagrangian) velocity profile from the time of mapping from 3D to 1D at 1.29 days up to 30 days. At the mapping epoch, well before the time of shock breakout at 1.77 days, the hydrodynamic flow is far from homologous, because the velocity profile of the outer layers evolves still significantly in the 1D simulations. This implies that in the 3D neutrino-driven simulations outward mixing of radioactive 56Ni and inward mixing of hydrogen-rich matter in velocity space will continue until complete homology is reached.
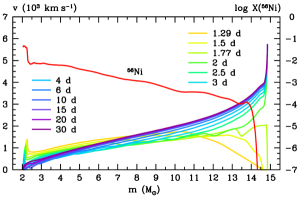
Figure 5 permits us to estimate the time at which the hydrodynamic flow approaches homologous expansion. For the velocity range from 1000 to 4000 km s-1, containing a significant mass of radioactive 56Ni, this time is as large as 6 days, when energy deposition by radioactive decay of 56Ni to 56Co already becomes important and might affect the dynamics of the 56Ni-rich ejecta, too. This physical process is not yet included in our current numerical code, but it is a subject of future investigation. Nevertheless, we consider our 3D neutrino-driven simulations mapped at as an acceptable approximation of the final mixing of heavy elements and hydrogen in velocity space, in particular of the inner regions, which we focus on for the light-curve discussion in the present work.
3.3 Light curve
The development of an ordinary SN IIP consists of the following basic stages: shock breakout, adiabatic cooling phase, phase of cooling and recombination wave (CRW), phase of radiative diffusion cooling, and a radioactive tail (e.g., Utrobin, 2007, for details). As an illustrative example, we consider our fiducial model L15-le (Figs. 6a and b). During shock breakout from the stellar surface and the adiabatic cooling phase a narrow peak in the bolometric luminosity forms, and the luminosity decreases for the next 20 days. By this epoch, the CRW sets in and cools the ejecta, completely dominating the SN luminosity to nearly day 100. A basic CRW property reads that the higher the ratio of explosion energy and ejecta mass is, the higher is the luminosity in the CRW phase, because the expanding and cooling ejecta radiate more energy. This dependence is clearly demonstrated by models L15-le and L15-he (Table 2, Fig. 6a). The release of internal energy by the CRW is followed by cooling by radiative diffusion, which starts in the optically thick expelled envelope at about day 100 and ends in the semi-transparent medium around day 140. After exhaustion of internal energy, the radioactive decay of 56Ni and 56Co nuclides dominates the luminosity beyond day 150. Before this moment and during the radioactive tail the bolometric light curve depends on the amount of radioactive material and its distribution over the ejecta.
Our 3D supernova simulations are characterized by the explosion energy, the total amount of radioactive 56Ni, and the amount of macroscopic mixing of 56Ni and hydrogen-rich matter occurring during the SN explosion. The total mass of radioactive 56Ni is higher in model L15-he than in model L15-le because of its larger explosion energy (Table 2). At the same time, these models demonstrate that the larger is the explosion energy, the more intense is the mixing of radioactive 56Ni in velocity space, and the larger is the mass fraction of hydrogen in the inner layers of the ejecta (Figs. 6c and d). We note that the minimum velocity of hydrogen-rich matter is as low as zero.
4 Origin of the luminosity spike
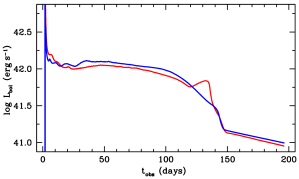
As mentioned above, 1D hydrodynamic models based on evolutionary pre-SN models and initiated by a piston-driven explosion exhibit an unobserved spike in the luminosity decline from the plateau to the radioactive tail. Our model L15-pn reproduces this general result, while our averaged 3D neutrino-driven explosion model L15-le and hydrodynamical models based on nonevolutionary pre-SN models (Utrobin, 2007) show a monotonic luminosity decline (see Fig. 7). This situation raises the question what causes the luminosity spike in the light curves of hydrodynamic explosion models of evolutionary progenitors?
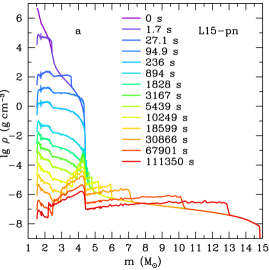
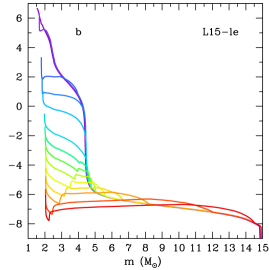
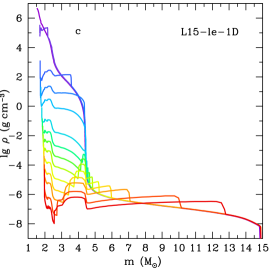
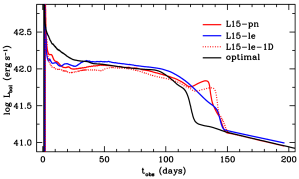
3D neutrino-driven explosion simulations differ from 1D hydrodynamical simulations by vigorous radial mixing between the core and the outer stellar layers, which significantly modifies both the density distribution and the chemical composition in the inner ejecta with respect to the spherically symmetric case. To study the influence of both effects on the luminosity spike, we compare the behavior of model L15-pn based on the evolutionary pre-SN model L15 and exploded by means of a 1D piston (Fig. 8a), model L15-le based on the pre-SN model L15 and a 3D neutrino-driven explosion simulation (Fig. 8b), model L15-le-1D computed as neutrino-driven explosion with the Prometheus code in 1D and having the somewhat lower explosion energy of 0.39 B compared to 0.54 B for model L15-le (Fig. 8c), and the optimal model of Utrobin (2007) based on a nonevolutionary pre-SN model and triggered by a 1D piston-driven explosion (Fig. 8d). The light curves corresponding to these four models are displayed in Fig. 9, where the presence or absence of the blip in the decline from the plateau to the radioactively powered tail is the most relevant feature for the discussion following below. Because of the lower explosion energy of model L15-le-1D, the plateau of its light curve is at a slightly lower level.
In the spherical piston model L15-pn (Fig. 8a) the shock wave crosses the C+O/He and He/H composition interfaces after s and s, respectively. When it passes the composition interfaces and subsequently propagates into the helium layer and the hydrogen envelope, respectively, the shock decelerates and a reverse shock forms. The shock deceleration causes the formation of a contact discontinuity at the He/H composition interface (at about 4.3 ), which is visible as a step in the density profile of the last four snapshots ( s). At the time of mapping ( s), when the main shock is about to reach the stellar surface, the density step is very pronounced.
In contrast to model L15-pn, the averaged density distribution of the 3D model L15-le is nearly flat in the region between the SN shock and the reverse shock (once the latter forms at around s) without any signature of a density step at the location of the He/H interface (Fig. 8b). The flatness of the density distribution reflects a characteristic feature of our 3D (neutrino-driven) explosion simulations, namely that large-scale macroscopic mixing occurs (see Sect. 3.1) which smoothens the density distribution.
The evolution of the density distribution of the 1D piston-driven model L15-pn (Fig. 8a) simulated with the hydrodynamic code Crab is similar to that of the 1D neutrino-driven model L15-le-1D (Fig. 8c) simulated with the hydrodynamic code Prometheus. When the shock passes the He/H interface, again a reverse shock and subsequently a contact discontinuity form, the latter being visible as a density step for s (Figs. 8a and c).
Finally, Figure 8d shows the optimal model of Utrobin (2007) which is based on a nonevolutionary pre-SN model and exploded with an 1D piston. Its internal structure, which was obtained by comparing observational data with adequate hydrodynamic explosion models, is quite different from that of the evolutionary pre-SN model L15, showing no sharp density gradients which are typical for the pre-SN model L15 (Figs. 2a and b). Hence, the shock propagation does not give rise to any step-like features in its density distribution (Fig. 8d). It is interesting to note that the density distributions of the 3D neutrino-driven model L15-le and the optimal model exploded by a 1D piston are similar at the time of mapping ( s; Figs. 8b and d).
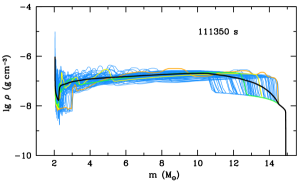
To understand the origin of the flat density distribution in the averaged 3D neutrino-driven explosion model L15-le, we show in Fig. 10 density profiles from this model along different angular directions at the time of mapping. Because the shock is globally deformed in this model, the density profiles exhibit jumps at the shock front that are spread out over a mass range from 10.5 to 14.5 (Fig. 10, blue lines). Angular averaging transforms this set of sharp fronts into a smooth density distribution (black line) which is similar to that in the outer 5 in the 1D models (compare Fig. 8b with Figs. 8a and c).
Because intense turbulent mixing initiated by Rayleigh-Taylor instabilities occurs in 3D simulations, the pronounced density steps that are present in 1D models at the (C+O)/He and He/H interfaces are smeared out, too. To illustrate this point, we marked in Fig. 10 three profiles along particular angular directions that are characterized by a density step at about 3 (green line), 5 (yellow line), and 9 (orange line). Angular averaging of the 3D hydrodynamic flow results in a nearly flat density distribution inside the helium core and in the vicinity of the (C+O)/He and He/H composition interfaces (Fig. 10, black line) with no reminiscence of any density step.
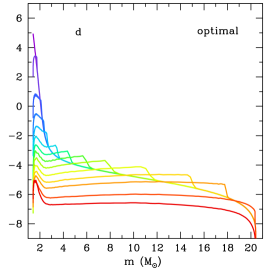
Besides flattening the density distribution, turbulent mixing also causes macroscopic mixing of the chemical composition. This property of hydrodynamic models based on 3D neutrino-driven explosion simulations implies that the original chemical composition of pre-SN models is unrealistic for modeling light curves. Moreover, light curves computed from 1D hydrodynamic models which are based on evolutionary, unmixed pre-SN models show the mentioned unobserved luminosity spike towards the end of the plateau phase, which reflects the fact that the photosphere crosses the sharp He/H interface at 4.3 in these models, before it enters and moves through the helium core. This sharp composition interface separating hydrogen-rich and helium-rich matter (Fig. 3) of quite different opacity favors the formation of the pronounced spike. In model L15-pn that happens around day 135 (Fig. 11, red solid line).
It is evident that the luminosity spike may be interpreted as an energy excess in the inner layers of the ejecta imprinted on the light curve. This energy excess can be deposited by either the shock wave or gamma-rays from radioactive 56Ni and 56Co. Let us now consider the dependence of the luminosity spike on different factors in some more detail. First, even if there were no radioactive 56Ni in the ejecta, as assumed in model L15-pn, version “zeroni”, the spike feature is still present in the light curve, although less pronounced (Fig. 11, red dotted line). This result shows that the luminosity spike is powered by both gamma-rays and the shock wave. The energy excess is indeed produced by day 100 and deposited by the shock wave and gamma-rays around the pronounced density step of model L15-pn (Fig. 8a). Second, when we artificially smooth the density step at the outer edge of the helium core at s in model L15-pn, version “denmix”, the luminosity spike does not disappear, but the luminosity still increases slightly at the end of the plateau phase (Fig. 11, olive line). Third, when we impose an artificial “boxcar” averaging (cf. Kasen & Woosley, 2009) in model L15-pn, version “chcmix”, with a boxcar mass width of at s 222Mixing, applied to the whole star, is mainly efficient at the locations of the (C+O)/He and He/H composition interfaces., but keep the radioactive 56Ni distribution and the density jump unchanged, the spike feature is less luminous and slightly shifts to later times (Fig. 11, green line), which is the result of a higher optical depth in the helium core giving rise to a longer diffusion time of photons. Thus, neither a smoothed density distribution nor a mixed chemical composition at the outer edge of the helium core erase the unobserved luminosity spike.
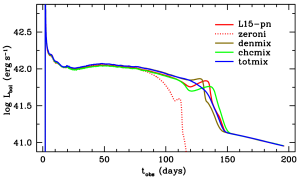
In order to mimic multidimensional effects in spherically symmetric geometry, we recomputed the reference model L15-pn with both artificial smoothing of the density step around the outer edge of the helium core and artificial mixing of the chemical composition with a boxcar mass width of at the He/H interface, both performed at s. We find that the simultaneous action of both modifications in the reference model L15-pn, version “totmix”, prevents the formation of the spike in the luminosity decline from the plateau to the radioactive tail (Fig. 11, blue line). These results imply that both the density step at the outer edge of the helium core and the unmixed chemical composition of the evolutionary pre-SN model are responsible for the presence of the unobserved spike in the light curve computed with hydrodynamic models exploded by a piston in spherically symmetric geometry. Finally, on the basis of our numerical experiments, we can state firmly that the monotonic luminosity decline from the plateau to the radioactive tail in the ordinary type IIP SN 1999em is a manifestation of macroscopic mixing during 3D neutrino-driven explosion.
5 Comparison with observations
A comparison of calculated light curves with the observed light curve of SN 1999em during the plateau phase (Fig. 6a) shows that model L15-le (blue solid line) with an explosion energy of 0.54 B reproduces the observed light curve better for the given pre-SN model L15 than model L15-he (magenta solid line) with an explosion energy of 0.93 B, whereas the calculated light curve of the latter model agrees better with the observed light curve of SN 2004et. The agreement between the calculated luminosity of model L15-le and that observed for SN 1999em only holds for the plateau phase, and does not include the initial luminosity peak observed during the first 30 days. This discrepancy is caused, as in the case of SN 1987A (Utrobin et al., 2015), by the structure of the outer layers of the pre-SN model, which is evidently different from that of the real pre-SN star. Thus, we focus our discussion mostly on the plateau phase of the light curve, neglecting the initial luminosity peak.
The duration of the plateau phase in the fiducial model L15-le is longer than that for SN 1999em (Fig. 6a). Because it is well known that the duration of the plateau phase depends mainly on the ejecta mass (e.g., Utrobin, 2007), it is not surprising that model L15-lm, which has the same explosion energy as model L15-le but an ejecta mass reduced according to the mass-loss estimate by Chugai et al. (2007), fits the observed light curve better (except for the initial luminosity peak, which gets closer to the observations but is still deficient). However, the reduced ejecta mass of model L15-lm does not remove a shoulder-like feature present in the computed light curves during the luminosity decline from the plateau to the radioactive tail (Fig. 6a). As mentioned above, this feature is not seen in the observations of ordinary SNe IIP (Fig. 1). The decline occurs when the ejecta become semi-transparent for photons (optical depth of order unity), and the SN luminosity forms in the innermost layers of the ejecta. The latter are characterized by macroscopic inhomogeneities in their chemical composition and in the density distribution in the mixing zone. These inhomogeneities can reduce the effective opacity compared to the homogeneous case, and consequently affect the luminosity. Using model L15-lm, we explored this clumping effect on both photon and gamma-ray transport in the framework of the approach developed by Utrobin & Chugai (2015). We found that the shoulder feature is insensitive to clumping because the optical depth of clumps does not exceed unity during the relevant phase.
At the mapping epoch, the density profiles of the averaged 3D models show a structural feature in the innermost layers of the ejecta at a mass coordinate of 2 (Fig. 8b). To study the influence of this feature, we performed an additional simulation, model L15-lmd, which is based on model L15-lm and in which we artificially flattened the density distribution in the central region at the mapping epoch (Fig. 12a). We find that in the resulting light curve the shoulder-like feature at the luminosity decline from the plateau to the radioactive tail is less pronounced, but still visible (Fig. 12b).
The existence of a shoulder-like feature in the computed light curve during the luminosity decline from the plateau to the radioactive tail in contrast to the observed SN light curve might be attributed to structural differences in the progenitor star compared to the model L15 that we employed. Alternatively, it might point to still missing effects in our treatment of the SN explosion, for example to mixing induced by 56Ni-decay heating, which could be accounted for only by 3D simulations continued to much later times.
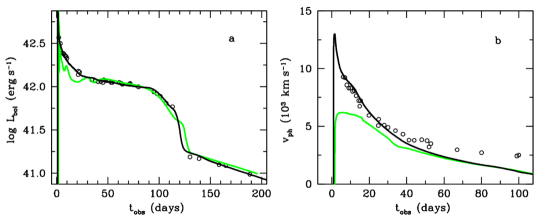
A good fit of the calculated bolometric light curve of models L15-le and L15-lm to the observations of SN 1999em during the plateau phase does not ensure that these models also give the correct evolution of the photospheric velocity (Figs. 6a and b). Actually, the disagreement between the calculated evolution of the photospheric velocity and the observed radial velocities of spectral lines during the first 20 days is serious and casts doubts on a perfectly proper choice of the pre-SN model. At later epochs the disagreement is less, but the computed photospheric velocities are well below the observed ones. With its higher explosion energy the velocities of model L15-he agree better with the observations of SN 1999em between day 20 and day 60, but its bolometric luminosity significantly exceeds the observed one.
Evaluating the total mass of radioactive 56Ni by equating the observed bolometric luminosity in the radioactive tail to the gamma-ray luminosity gives a mass of 0.036 for SN 1999em, which falls in between the minimum, , and maximum, , values obtained with our models (Table 2). Thus, our 3D neutrino-driven simulations are able to synthesize the required amount of ejected radioactive 56Ni. Note that hydrodynamic models without radioactive 56Ni in the ejecta provide a lower bound on the plateau phase duration for a given pre-SN model and explosion energy (Fig. 6a, dotted lines).
An analysis of SN 1999em observations shows that the distribution of the bulk of 56Ni can be approximated by a sphere with a velocity of 1500 km s-1 that is shifted towards the far hemisphere by about 400 km s-1 (Elmhamdi et al., 2003). As already mentioned in Sect. 3.1, the final morphology of the 56Ni-rich ejecta in velocity space possesses a strong dipole component in our models, which is characterized by a velocity asymmetry (with respect to the motion of the center of mass of 56Ni) of nearly 300 km s-1 for model L15-le, and thus comparable with the observed shift. Only model L15-le yields a maximum velocity of the bulk mass of 56Ni of 2000 km s-1 consistent with the observations, while model L15-he with an explosion energy of 0.93 B produces mixing that is too strong (Figs. 6c and d). Observational evidence for the existence of hydrogen-rich matter within the core of heavy elements of SN 1999em implies a deep macroscopic mixing down to zero velocity (Maguire et al., 2012). It is remarkable that all of our 3D neutrino-driven simulations show such a deep mixing of hydrogen-rich matter (Figs. 6c and d).
Polarimetric data of SN 1999em presented by Leonard et al. (2001) show that continuum polarization is 0.2 on day 7 and 0.3 on days 40 and 49. For our 3D simulations of model L15-le, we approximated the asphericity of the outer layers by an ellipsoidal shape and found in Sect. 3.1 that the maximum ratio of the semiaxes is 1.15. According to Höflich (1991), this ratio results in a linear polarization of 0.7 for an inclination angle of . Analyzing the double-peak profile of H at the nebular epoch in terms of an asymmetric bipolar configuration for radioactive 56Ni, Chugai (2007) argued that this bipolar configuration should be oriented at an inclination angle of to match the observations. Our 3D neutrino-driven simulations of model L15-le revealed the fact that a direction of the strong dipole component of 56Ni-rich matter nearly coincides with that of a larger deformation of the main shock around its breakout. The reason behind is that a larger deformation occurs in the direction of a stronger explosion which, in turn, leads to a larger production of 56Ni. A more accurate estimation of the angle between the directions discussed gives a value of about . Given the relations computed by Höflich (1991), an uncertainty of in the inclination angle for an ellipsoidal surface of the photosphere reduces the polarization estimated above to 0.30.1, which is consistent with the broadband polarimetry of SN 1999em.
Note that the disagreement between the calculated photospheric velocity and the observed one during the first 40 days (Fig. 13b) cannot be explained by a viewing-angle effect in a fully 3D radiation transport calculation for the neutrino-driven explosion model L15-le. The ratio of observed to calculated photospheric velocity during the discussed period of evolution is as large as two, which is significantly greater than the maximum ratio of the semiaxes of the ellipsoid of about 1.15. In other words, a viewing angle effect should not exceed about 15 in the photospheric velocity.
6 Discussion and conclusions
The present paper is our second attempt to model the light curves of type IIP supernova explosions based on 3D explosion models (our first one was concerned with the peculiar type IIP SN 1987A Utrobin et al. (2015)). We find that 3D neutrino-driven explosion simulations based on the evolutionary pre-SN model L15 of Limongi et al. (2000) with an explosion energy around 0.5 B are able to reproduce the overall behavior of the bolometric light curve of SN 1999em reasonably well, along with the production of radioactive 56Ni and mixing of hydrogen deep into the ejecta. However, the luminosity and the photospheric velocity during the first 40 days are inconsistent with observations of SN 1999em (Fig. 13). On the other hand, Utrobin (2007) constructed an optimal hydrodynamic model of the explosion of SN 1999em based on a comparison with detailed observational data. This optimal model has an initial radius of , an ejecta mass of , an explosion energy of 1.3 B, and a total 56Ni mass of (Tables 2.1 and 2). The density profile of the optimal, nonevolutionary pre-SN star is compared with that of the evolutionary model L15 in Fig. 2.
The calculated light curve and photospheric velocity of the optimal model agree well with the observational data for the first 40 days (Fig. 13). This fact confirms our conclusion from Sect. 5 that the serious disagreement of light curve models based on evolutionary pre-SN models and 3D neutrino-driven simulations with the observations of SN 1999em is caused by the inappropriate structure of the outer layers of available pre-SN models. In particular, the luminosity and photospheric velocity are too low in model L15-lm during the first 40 days compared to the observations, which implies that the internal energy deposited and the kinetic energy of the outer layers should be larger, i.e. the explosion energy should be higher than in our reference case of neutrino-driven explosion models. As a measure of this inconsistency we may consider the kinetic energy of the outer layers, which power the luminosity during the first 40 days and where extra mass accounts for the considerably higher ejecta mass of the optimal explosion model (Table 2). This kinetic energy amounts to 40% of the total kinetic energy of the optimal model or about 0.52 B, which is almost the explosion energy of model L15-lm (0.54 B), and thus it explains the significant difference in the explosion energies of the optimal model (1.30 B) and model L15-lm. In addition, it is evident from Fig. 2 that the density distribution of the outer ejecta of at least 2.5 in the hydrogen envelope of the real pre-SN RSG star was steeper than in the evolutionary model. Moreover, as pointed out by Utrobin & Chugai (2008), turbulent mixing during the explosion should also flatten the jumps in density and chemical composition at the Si/O, (C+O)/He, and He/H interfaces. The general similarity between the density profiles of the averaged 3D explosion model L15-le and the optimal model (Figs. 8b and d), and between the chemical composition mixed by realistic turbulent mixing in 3D models (Figs. 6c and d) and artificially in the optimal model (Utrobin, 2007, Fig. 2) confirms both assumptions.
It is noteworthy that the macroscopic mixing of 56Ni and hydrogen-rich matter that occurs during the SN explosions of RSG and BSG progenitors has different consequences in the corresponding ordinary and peculiar SNe IIP. In the ordinary type IIP SN 1999em, mixing induced by the 3D neutrino-driven explosion causes the monotonic luminosity decline from the plateau to the radioactive tail (Sect. 5), while in the peculiar type IIP SN 1987A it results in a broader width of the dome-like maximum of the light curve (Utrobin et al., 2015). Neglecting the influence of turbulent mixing on the light curve produces conspicuous features that are not seen in observations. It results in a luminosity spike in the case of SN 1999em (Sect. 4) and a half-truncated maximum of the SN 1987A light curve (Woosley, 1988).
Of particular importance is the morphology of the 56Ni-rich ejecta in velocity space, which reveals asymmetry with a strong dipole component (Fig. 4) consistent with the observations of the ordinary type IIP SN 1999em (Elmhamdi et al., 2003). Such a non-spherical morphology of the 56Ni-rich ejecta is not an exceptional phenomenon of ordinary SNe IIP. Analyzing the spectroscopic observations of SN 2004dj, Chugai et al. (2005) showed that the H line profile and its evolution are well reproduced in a model with asymmetric, dipolar 56Ni ejecta. Leonard et al. (2006) confirmed that 56Ni was ejected in a non-spherical manner in the explosion of SN 2004dj. Moreover, the asymmetric shape of the H line in the nebular phase of SN 2013ej may be interpreted in terms of asymmetrically ejected 56Ni as well (Huang et al., 2015).
For ordinary SNe IIP the asymmetric morphology of the 56Ni-rich ejecta affects the bolometric light curve after the plateau phase, especially during the luminosity decline from the plateau to the radioactive tail. The dipolar configuration of the 56Ni-rich ejecta in our 3D neutrino-driven simulations evidently gives rise to viewing angle effects for the light curve, which have to be calculated with a 3D radiation hydrodynamics solver. Because of a lack of the latter, this only leaves the possibility of discussing the possible influence of 3D radiation transfer on the light curve.
An asymmetry with a strong dipole component may be approximated by an aspherical explosion which is strongest and leads to most intense mixing along one direction, and is weakest and leads to least intense mixing in the opposite direction. If we are oriented along the direction of the strongest explosion, we observe an increased luminosity at the end of the plateau phase and a shorter duration of the plateau compared to what a model would show that is based on angular-averaged 56Ni-rich ejecta (Utrobin, 2007). Observations along the opposite direction would reveal the opposite effect: a decreased luminosity at the end of the plateau phase and a longer duration of the plateau. The greater the difference in the extent of 56Ni mixing is in different directions, the greater is the difference between the corresponding light curves. The influence of 3D radiation transfer on the light curve and the viewing angle effects are discussed in more detail by Utrobin et al. (2015).
Dessart et al. (2014) suggest a method for metallicity determinations based on quantitative spectroscopy of SNe IIP during the plateau, in particular with oxygen lines. As pointed out above, these objects are characterized by a wide variety of properties and imply a very different extent of matter mixing in velocity space or in mass coordinate. The detailed discussion of SNe IIP as a metallicity probe has to be carried out in the context of the corresponding 3D simulations. In this paper, we study the issue of turbulent mixing in the normal type IIP SN 1999em and are only able to give an educated guess how representative this case is for the mixing in other SNe IIP. The inner layers, which are enriched by oxygen by a factor of two compared to the outer layers, move at velocities of 1340 and 1880 km s-1 in models L15-le and L15-he, respectively. Accordingly, oxygen lines can reflect a change in the oxygen content after days 97 and 89, respectively, well after the end of the plateau phase. In these cases, the method of Dessart et al. remains applicable at least with respect to oxygen lines. As to the newly synthesized metals of the iron group, including radioactive 56Ni, we can say that they are mixed up to about 3740 and 5460 km s-1 in models L15-le and L15-he and that the corresponding layers of the ejecta enriched by them become visible after days 34 and 30, respectively. From these epochs on we could expect to observe effects of non-thermal ionization and excitation associated with radioactive decays in the spectra.
It is instructive to compare two extensive studies of SN 1999em performed by Utrobin (2007) and Bersten et al. (2011) on the basis of nonevolutionary pre-SN models. Their favorite hydrodynamic models have comparable ejecta masses, pre-SN radii, explosion energies, and total 56Ni masses, while the extent of outward 56Ni mixing is up to about 660 and 2300 km s-1 in velocity space, respectively. This kind of disparity between two hydrodynamic models, calculated with quite different radiation hydrodynamics codes, is formally admitted because hydrodynamic modeling itself belongs to the class of ill-posed inverse problems that lack a unique solution. However, the analysis of the H and He i 10 830 Å lines in SN 1999em during the nebular epoch implies that the 56Ni distribution can be approximated by a sphere with a velocity of 1500 km s-1 (Elmhamdi et al., 2003). Thus, the extent of 56Ni mixing in the model of Bersten et al. (2011) for SN 1999em seems to be inconsistent with the spectral observations and becomes, as we will see below, critical for their hydrodynamic model.
To simulate the SN 1999em outburst, both Utrobin (2007) and Bersten et al. (2011) used nonevolutionary pre-SN models with an artificially mixed chemical composition. Light curves computed from hydrodynamic models with such pre-SN models, which have no well-defined helium core (neither in density nor in chemical composition) do not exhibit any bump feature when the ejecta contain no radioactive 56Ni (Utrobin 2007, Fig. 17a; Bersten et al. 2011, Fig. 12). The corresponding light curve of Utrobin fits the observed one during the plateau phase, while the light curve of Bersten et al. declines faster than observed. Adding 56Ni to the model of Utrobin does not destroy the monotonicity of the light curve. In contrast, the 56Ni mixed up to about 700 km s-1 in the ejecta of the model of Bersten et al. gives rise to a bump feature at the end of the plateau, and as a consequence, causes a local minimum in the plateau at about day 75. To compensate this minimum in luminosity and to obtain a nearly flat plateau, Bersten et al. (2011) invoked an extended 56Ni mixing up to about 2300 km s-1, which affects the light curve starting from about day 35. We can state that the origin of the bump feature in the light curve of the model of Bersten et al. (2011) is related to an inadequate pre-SN structure and depends on the extent of 56Ni mixing. Such a behavior of this bump feature has nothing in common with the origin of the luminosity spike in the light curves of hydrodynamic explosion models of evolutionary progenitors as discussed in our work.
Comparing results of 3D neutrino-driven explosion simulations and light curve modeling with the observations of the ordinary type IIP SN 1999em, we draw the following conclusions based on the considered pre-SN model:
-
•
3D neutrino-driven explosion simulations reproduce basic properties of the overall behavior of the bolometric light curve of SN 1999em along with the radioactive 56Ni production and extent of hydrogen mixing. There is a pronounced deficit only in the luminosity and the photospheric velocity during the first 40 days compared to the observations of SN 1999em. This shortcoming is caused by the pre-SN structure of the outer stellar layers, which is inadequate to match the observed light curve and the evolution of the photospheric velocity.
-
•
Spectroscopic observations of SN 1999em show that the bulk of the radioactive 56Ni is shifted towards the far hemisphere by about 400 km s-1. This is comparable to the results of our 3D neutrino-driven explosion, in which the morphology of 56Ni-rich matter has an asymmetry with a strong dipole component in velocity space with a characteristic shift of nearly 300 km s-1.
-
•
1D piston-driven explosions of evolutionary pre-SN models inevitably produce a pronounced spike in the luminosity decline from the plateau to the radioactive tail, which disappears only in the framework of the 3D neutrino-driven explosion simulations. Thus, the monotonic luminosity decline from the plateau to the radioactive tail observed for ordinary SNe IIP is a manifestation of intense turbulent mixing at the He/H composition interface.
In summary, we can explain the basic observational data of the ordinary type IIP SN 1999em, except for those related to the detailed pre-SN structure of the outer layers, within the paradigm of the neutrino-driven explosion mechanism.
References
- Anderson et al. (2014) Anderson, J. P., González-Gaitán, S., Hamuy, M., et al. 2014, ApJ, 786, 67
- Arnett et al. (1989) Arnett, W. D., Bahcall, J. N., Kirshner, R. P., & Woosley, S. E. 1989, ARA&A, 27, 629
- Baklanov et al. (2005) Baklanov, P. V., Blinnikov, S. I., & Pavlyuk, N. N. 2005, Astronomy Letters, 31, 429
- Bersten et al. (2011) Bersten, M. C., Benvenuto, O., & Hamuy, M. 2011, ApJ, 729, 61
- Bersten & Hamuy (2009) Bersten, M. C., & Hamuy, M. 2009, ApJ, 701, 200
- Blondin et al. (2003) Blondin, J. M., Mezzacappa, A., & DeMarino, C. 2003, ApJ, 584, 971
- Castor et al. (1975) Castor, J. I., Abbott, D. C., & Klein, R. I. 1975, ApJ, 195, 157
- Chieffi et al. (2003) Chieffi, A., Domínguez, I., Höflich, P., Limongi, M., & Straniero, O. 2003, MNRAS, 345, 111
- Chugai (2007) Chugai, N. N. 2007, in American Institute of Physics Conference Series, Vol. 937, Supernova 1987A: 20 Years After: Supernovae and Gamma-Ray Bursters, ed. S. Immler, K. Weiler, & R. McCray, 357–364
- Chugai et al. (2007) Chugai, N. N., Chevalier, R. A., & Utrobin, V. P. 2007, ApJ, 662, 1136
- Chugai et al. (2005) Chugai, N. N., Fabrika, S. N., Sholukhova, O. N., et al. 2005, Astronomy Letters, 31, 792
- Colella & Glaz (1985) Colella, P., & Glaz, H. M. 1985, Journal of Computational Physics, 59, 264
- Colella & Woodward (1984) Colella, P., & Woodward, P. R. 1984, Journal of Computational Physics, 54, 174
- Dessart et al. (2014) Dessart, L., Gutierrez, C. P., Hamuy, M., et al. 2014, MNRAS, 440, 1856
- Elmhamdi et al. (2003) Elmhamdi, A., Danziger, I. J., Chugai, N., et al. 2003, MNRAS, 338, 939
- Falk & Arnett (1977) Falk, S. W., & Arnett, W. D. 1977, A&AS, 33, 515
- Faran et al. (2014) Faran, T., Poznanski, D., Filippenko, A. V., et al. 2014, MNRAS, 442, 844
- Fryxell et al. (1991) Fryxell, B., Arnett, D., & Müller, E. 1991, ApJ, 367, 619
- Grassberg et al. (1971) Grassberg, E. K., Imshennik, V. S., & Nadyozhin, D. K. 1971, Ap&SS, 10, 28
- Hairer et al. (1993) Hairer, E., Nørsett, S. P., & Wanner, G. 1993, Solving Ordinary Differential Equations I, Nonstiff Problems, second revised edn. (Springer-Verlag Berlin Heidelberg)
- Hairer & Wanner (1996) Hairer, E., & Wanner, G. 1996, Solving Ordinary Differential Equations II, Stiff and Differential-Algebraic Problems, second revised edn. (Springer-Verlag Berlin Heidelberg)
- Hamuy et al. (2001) Hamuy, M., Pinto, P. A., Maza, J., et al. 2001, ApJ, 558, 615
- Heger et al. (2003) Heger, A., Fryer, C. L., Woosley, S. E., Langer, N., & Hartmann, D. H. 2003, ApJ, 591, 288
- Höflich (1991) Höflich, P. 1991, A&A, 246, 481
- Huang et al. (2015) Huang, F., Wang, X., Zhang, J., et al. 2015, ApJ, 807, 59
- Imshennik & Nadezhin (1989) Imshennik, V. S., & Nadezhin, D. K. 1989, Astrophysics and Space Physics Reviews, 8, 1
- Inserra et al. (2012) Inserra, C., Turatto, M., Pastorello, A., et al. 2012, MNRAS, 422, 1122
- Janka et al. (2016) Janka, H.-T., Melson, T., & Summa, A. 2016, Annual Review of Nuclear and Particle Science, 66, 341
- Kageyama & Sato (2004) Kageyama, A., & Sato, T. 2004, Geochemistry, Geophysics, Geosystems, 5, 9005
- Kasen & Woosley (2009) Kasen, D., & Woosley, S. E. 2009, ApJ, 703, 2205
- Kifonidis et al. (2003) Kifonidis, K., Plewa, T., Janka, H.-T., & Müller, E. 2003, A&A, 408, 621
- Krtička (2014) Krtička, J. 2014, A&A, 564, A70
- Leonard et al. (2001) Leonard, D. C., Filippenko, A. V., Ardila, D. R., & Brotherton, M. S. 2001, ApJ, 553, 861
- Leonard et al. (2002) Leonard, D. C., Filippenko, A. V., Li, W., et al. 2002, AJ, 124, 2490
- Leonard et al. (2006) Leonard, D. C., Filippenko, A. V., Ganeshalingam, M., et al. 2006, Nature, 440, 505
- Li et al. (2011) Li, W., Leaman, J., Chornock, R., et al. 2011, MNRAS, 412, 1441
- Limongi et al. (2000) Limongi, M., Straniero, O., & Chieffi, A. 2000, ApJS, 129, 625
- Maguire et al. (2010) Maguire, K., Di Carlo, E., Smartt, S. J., et al. 2010, MNRAS, 404, 981
- Maguire et al. (2012) Maguire, K., Jerkstrand, A., Smartt, S. J., et al. 2012, MNRAS, 420, 3451
- Mihalas & Mihalas (1984) Mihalas, D., & Mihalas, B. W. 1984, Foundations of radiation hydrodynamics
- Morozova et al. (2015) Morozova, V., Piro, A. L., Renzo, M., et al. 2015, ApJ, 814, 63
- Müller (2016) Müller, B. 2016, PASA, 33, e048
- Müller et al. (1991a) Müller, E., Fryxell, B., & Arnett, D. 1991a, in European Southern Observatory Conference and Workshop Proceedings, Vol. 37, European Southern Observatory Conference and Workshop Proceedings, ed. I. J. Danziger & K. Kjaer, 99
- Müller et al. (1991b) Müller, E., Fryxell, B., & Arnett, D. 1991b, A&A, 251, 505
- Müller & Steinmetz (1995) Müller, E., & Steinmetz, M. 1995, Computer Physics Communications, 89, 45
- Ohnishi et al. (2006) Ohnishi, N., Kotake, K., & Yamada, S. 2006, ApJ, 641, 1018
- Pastorello et al. (2012) Pastorello, A., Pumo, M. L., Navasardyan, H., et al. 2012, A&A, 537, A141
- Roy et al. (2011) Roy, R., Kumar, B., Benetti, S., et al. 2011, ApJ, 736, 76
- Sahu et al. (2006) Sahu, D. K., Anupama, G. C., Srividya, S., & Muneer, S. 2006, MNRAS, 372, 1315
- Sanders et al. (2015) Sanders, N. E., Soderberg, A. M., Gezari, S., et al. 2015, ApJ, 799, 208
- Scheck et al. (2008) Scheck, L., Janka, H.-T., Foglizzo, T., & Kifonidis, K. 2008, A&A, 477, 931
- Scheck et al. (2006) Scheck, L., Kifonidis, K., Janka, H.-T., & Müller, E. 2006, A&A, 457, 963
- Smartt (2009) Smartt, S. J. 2009, ARA&A, 47, 63
- Smith et al. (2011) Smith, N., Li, W., Filippenko, A. V., & Chornock, R. 2011, MNRAS, 412, 1522
- Strang (1968) Strang, G. 1968, SIAM Journal on Numerical Analysis, 5, 506
- Sukhbold et al. (2016) Sukhbold, T., Ertl, T., Woosley, S. E., Brown, J. M., & Janka, H.-T. 2016, ApJ, 821, 38
- Tomasella et al. (2013) Tomasella, L., Cappellaro, E., Fraser, M., et al. 2013, MNRAS, 434, 1636
- Utrobin (2004) Utrobin, V. P. 2004, Astronomy Letters, 30, 293
- Utrobin (2007) —. 2007, A&A, 461, 233
- Utrobin & Chugai (2008) Utrobin, V. P., & Chugai, N. N. 2008, A&A, 491, 507
- Utrobin & Chugai (2009) —. 2009, A&A, 506, 829
- Utrobin & Chugai (2015) —. 2015, A&A, 575, A100
- Utrobin et al. (2015) Utrobin, V. P., Wongwathanarat, A., Janka, H.-T., & Müller, E. 2015, A&A, 581, A40
- Wongwathanarat et al. (2010) Wongwathanarat, A., Hammer, N. J., & Müller, E. 2010, A&A, 514, A48
- Wongwathanarat et al. (2013) Wongwathanarat, A., Janka, H.-T., & Müller, E. 2013, A&A, 552, A126
- Wongwathanarat et al. (2015) Wongwathanarat, A., Müller, E., & Janka, H.-T. 2015, A&A, 577, A48
- Woosley (1988) Woosley, S. E. 1988, ApJ, 330, 218
- Woosley & Heger (2007) Woosley, S. E., & Heger, A. 2007, Phys. Rep., 442, 269
- Young (2004) Young, T. R. 2004, ApJ, 617, 1233