Three-dimensional hydrodynamical models of wind and outburst-related accretion in symbiotic systems
Abstract
Gravitationally focused wind accretion in binary systems consisting of an evolved star with a gaseous envelope and a compact accreting companion is a possible mechanism to explain mass transfer in symbiotic binaries. We study the mass accretion around the secondary caused by the strong wind from the primary late-type component using global three-dimensional hydrodynamic numerical simulations during quiescence and outburst stages. In particular, the dependence of the mass accretion rate of the mass-loss rate, wind parameters and phases of wind outburst development is considered. For a typical wind from an asymptotic giant branch star with a mass-loss rate of and wind speeds of , the mass transfer through a focused wind results in efficient infall on to the secondary. Accretion rates on to the secondary of 5–20 per cent of the mass-loss from the primary are obtained during quiescence and outburst periods where the wind velocity and mass-loss rates are varied, about 20–50 per cent larger than in the standard Bondi–Hoyle–Lyttleton approximation. This mechanism could be an important method for explaining observed accretion luminosities and periodic modulations in the accretion rates for a broad range of interacting binary systems.
keywords:
Accretion, accretion discs – Binaries: symbiotic – Circumstellar matter – Methods: numerical – Stars: mass-loss1 Introduction
Symbiotic binaries are active bright systems with a composite spectrum that exhibits absorption features together with strong H and He emission lines. These binaries are important astrophysical laboratories for studies of wind accretion because of the wide separation of the components, and the ability to study the individual components and the accretion processes in close circumbinary environments at multiple wavelengths ranging from X-ray to radio (Karovska et al., 1997, 2005, 2010). A typical symbiotic system consists of a mass-losing red giant or asymptotic giant branch (AGB) star and a hotter accreting companion, often a white dwarf (WD). The components in these systems are believed to be detached (both components are well within their Roche lobes), and the activity is caused by the accretion of mass from the massive wind of the cool evolved star on to the compact companion at rates determined by the wind and orbital parameters (e.g., Kenyon, 1986).
Mass-loss is known to be a key factor in the late stages of the evolution on the red giant branch (RGB) and on the AGB and regulates how the star evolves. Matter escapes easily because of the low surface gravity and the stellar wind removes angular momentum from the star. Accretion of this material can occur in two different modes: Roche lobe overflow (RLOF) when the primary star fills its Roche surface (see e.g., Paczyński, 1971) or wind accretion (e.g., Theuns & Jorissen, 1993). Considerable differences are seen between simulations contingent upon whether the dust acceleration radius is close to the Roche lobe surface or not (i.e., dependent on the binary separation). In RLOF accretion, the donor star fills its Roche lobe and mass transfer occurs through the Lagrangian point on to the companion’s Roche lobe. Accretion in the canonical RLOF scenario is quasi-conservative, with the mass accretion rate on to the secondary being very similar to the mass-loss rate from the primary. None the less some material may escape the binary system through the point so the mass rate ratio may be smaller than 1.
In the quiescent phase of symbiotic binaries the fraction of the wind that is accreted by the hot companion is ionized and powers the observed luminosity in these systems. However, high accretion rates of the order of are required to maintain the high luminosity of symbiotic systems, which is about an order of magnitude larger than the values derived from standard Bondi–Hoyle–Lyttleton wind accretion (BHL; Hoyle & Lyttleton, 1939; Bondi & Hoyle, 1944). To solve this problem, a number of numerical studies of a gravitationally focused wind in Mira-type systems have been carried out recently, which produced an enhanced mass transfer in binaries compared with BHL accretion (e.g., Nagae et al., 2004; Podsiadlowski & Mohamed, 2007; de Val-Borro et al., 2009) and are capable of explaining the observed mass outflow geometries in some symbiotic systems (e.g., Karovska et al., 2005, 2010, 2011).
Previous two-dimensional models of wind accretion in detached binaries develop complex flow patterns and the formation of a stream flow between the components, which is dependent on the wind and orbital parameters of the system. These binary models suggest that the accretion rate on to the secondary is considerably modified by the effect of the gravitational interaction with a companion star (e.g., de Val-Borro et al., 2009). For slow radiative driven winds, the accretion efficiency on the companion is of the order of 10–20 per cent mass-loss rate of the primary and can be increased compared with the standard BHL accretion in two- or three-dimensional simulations (e.g., de Val-Borro et al., 2009; Mohamed & Podsiadlowski, 2012).
An additional possible mode to obtain a focused wind in the orbital plane in S-type symbiotic systems is the wind compression disc model that can enhance the efficiency of wind accretion (Bjorkman & Cassinelli, 1993; Skopal & Cariková, 2015). Wind accretion can also lead to a higher enrichment of barium and carbon in metal-poor stars and changes in the orbital parameters because of angular momentum loss from the binary system (e.g., Abate et al., 2013). Nonetheless, the applicability of this mode of accretion to large separation symbiotic binaries remains to be established precisely.
Numerical simulations of BHL accretion in a two-dimensional planar flow have shown the presence of instabilities in the accretion shock, so-called flip-flop instabilities (Matsuda et al., 1987; Fryxell & Taam, 1988), which have been suggested to occur in several systems. In this instability, the accretion flow oscillates between states with opposite spin with a brief intermediate phase. Some analytical approaches have been proposed using a perturbation analysis on a stationary flow solution (see e.g., Livio et al., 1991). This instability may cause periodic oscillations that can explain some astrophysical phenomena such as fluctuations in X-ray binaries and pulsating systems (Fryxell & Taam, 1988). However, three-dimensional simulations have found that the instability is not as strong as in the two-dimensional case, or may be completely absent (e.g., Ruffert & Arnett, 1994; Blondin & Raymer, 2012).
There is observational evidence of small-scale sporadic outbursts and stochastic variations on short time-scales (as seen in the light curves, spectra and images of symbiotic systems; Slovak & Africano, 1978; Taylor et al., 1986), which could be due to a change of the accretion rate and the accretion environment on time-scales much smaller than the orbital period. The origin of these outbursts is still a puzzle. It is possible that they are caused by a temporary increase of mass accretion on to the companion due to changes in mass-loss and wind velocity in the red giant component or a fluctuating accretion disc around the secondary. Gas shells produced by the variable mass-loss from AGB stars have been observed in several systems since the first detection by Olofsson et al. (1990). A shell around pulsating star R Sculptoris has been clearly resolved with the Atacama Large Millimeter/submillimeter Array showing a spiral structure that is formed by interaction with a previously unknown companion (Maercker et al., 2012, 2016). Recently, Booth et al. (2016) have simulated the formation of asymmetric circumstellar shells using a smoothed particle hydrodynamics (SPH) code. Their model produces a bipolar structure surrounding the recurrent nova progenitor in the RS Ophiuchi symbiotic binary, a system known to undergo recurrent outbursts that have been observed at multiple wavelengths (O’Brien et al., 2006; Bode et al., 2007).
Here we present three-dimensional hydrodynamical simulations of gravitationally focused wind accretion in symbiotic binary systems using as an example the nearby jet-ejecting CH Cygni (CH Cyg) system. This is a variable symbiotic that is of special interest to examine the basic physical processes of mass transfer due to its brightness and close distance, , to Earth. We address the variability in this system by studying stellar outbursts in the primary to consider the effect in the outflow properties and accretion rates. In a future work, we will carry out a detailed comparison of observational diagnostics in the symbiotic variable CH Cyg system with the results of our wind accretion simulations.
In Section 2, we describe the numerical set-up. In Section 3, we show our results from hydrodynamical simulations of the symbiotic binary CH Cyg, and discuss the flow structure around the accretor, accreting rates, and the circumbinary environment. Finally, we summarize the main results of this work in Section 4.
2 Numerical Model
Realistic models of mass transfer in symbiotic binaries require computationally demanding hydrodynamical simulations. The wind gas is modelled using the basic Euler equations of hydrodynamics describing the evolution of the density and velocity field in three dimensions (see e.g., Clarke & Carswell, 2014):
| (1) | ||||
| (2) |
In the above equations, symbols have their usual meaning: is the density of the fluid, is the velocity, is the pressure and is the stellar gravitational potential that is given by the point mass equation with softening length to simplify the numerical integration of the equations.
where and are the stellar masses of the two components, and and are their positions. The softening length is chosen to be . We note that the self-gravity of the fluid is not considered. The wind pressure in the fluid is derived using the polytropic equation of state for an ideal gas:
where is the internal energy per unit mass and is the adiabatic index of the gas, the ratio of specific heat at constant pressure and volume, which has a value of for the monoatomic gas in our model. Thus, the value of the polytropic index is given by . We set the mean atomic number to be the atomic hydrogen weight . The sound speed of the fluid for an ideal gas law is described by:
We use the Courant–Friedrichs–Lewy condition to constrain the time-step to ensure the numerical stability of the solution.
The numerical model is similar to previous two-dimensional models described in de Val-Borro et al. (2009), hereafter referred to as Paper I. However, the model uses a different code base with the equation of state for a polytropic fluid and the equations of hydrodynamics are solved in three dimensions. We take into account the rotation of the binary and assume circular Keplerian orbits for the system with the stellar components at rest to avoid stability issues. We work in the non-inertial reference frame that rotates around the origin with a constant angular frequency , which is given by the equation
where is the semimajor axis of the system. The two stellar components are treated as point masses with a smoothing radius in our models. The secondary is treated as an absorbing sphere, and our model includes a smooth variation of the wind properties during a short fraction of an orbital period that translates into changes in the accretion rates on to the companion. We do not resolve the surface of the secondary in our calculation.
2.1 Stellar wind
We have developed a single-fluid stellar wind model implemented in a Cartesian grid in a rotating frame of reference where both stars are at rest in the computational domain based on the publicly available piernik magnetohydrodynamics code (Hanasz et al., 2010)111The piernik source code is hosted in a public Git repository at https://github.com/piernik-dev/piernik under the GNU General Public License v3.. The numerical algorithm is based on the original relaxing total variation diminishing (RTVD) method, which is a second-order algorithm in space and time (Jin et al., 1995; Pen et al., 2003, and references therein). One of the advantages of this method is that it can handle shocks and discontinuities in the flow with high resolution without using artificial viscosity. In our calculations the wind material is treated using the equation of state of a classical ideal gas. The effect of the Coriolis and the centrifugal forces has been included in the equations for each sweep in a low-order approximation using the gas density and velocity values in the beginning of the time-step in an operator-split way. Strict numerical conservation of angular momentum to numerical precision is not achieved as we use a Cartesian coordinate grid with open outflow boundaries. Spurious changes in angular momentum occur at the outer boundary of the grid. Other solvers are found to be less diffusive than the RTVD method, and using cylindrical coordinates can bring substantial improvement in the conservation of angular momentum, in particular, at the outer boundary of the domain (e.g., Stone et al., 2008; Kowalik et al., 2013). However, we have chosen a large enough computational domain that these changes are not expected to affect the accretion process. Further details of the used numerical scheme can be found in Pen et al. (2003).
piernik uses an adaptive mesh refinement (AMR) implementation that adapts the resolution dynamically with a criterion that can be defined by the user. The AMR method allows us to efficiently study binary systems with variable mass-loss, where a perturbation propagates to large radii by refining cells at locations with sharp contrasts in density. We used the standard grid refinement criterion based on the second derivative of the gas density and pressure that has been used in the study of the tidal interaction between a protoplanetary disc and an embedded planet (see e.g. de Val-Borro et al., 2006; de Val-Borro, 2008). For our simulations, we use an adaptive grid with three to five additional refinement levels.
The code is fully parallelized using a block-structured decomposition that runs on any platform that supports the Message Passing Interface, and it has been found to scale well up to CPU cores (Hanasz et al., 2010). piernik can be extended by adding new physics modules and has been extensively tested in various compressible flow problems such as simulations of the streaming instability in protoplanetary discs (Kowalik et al., 2013).
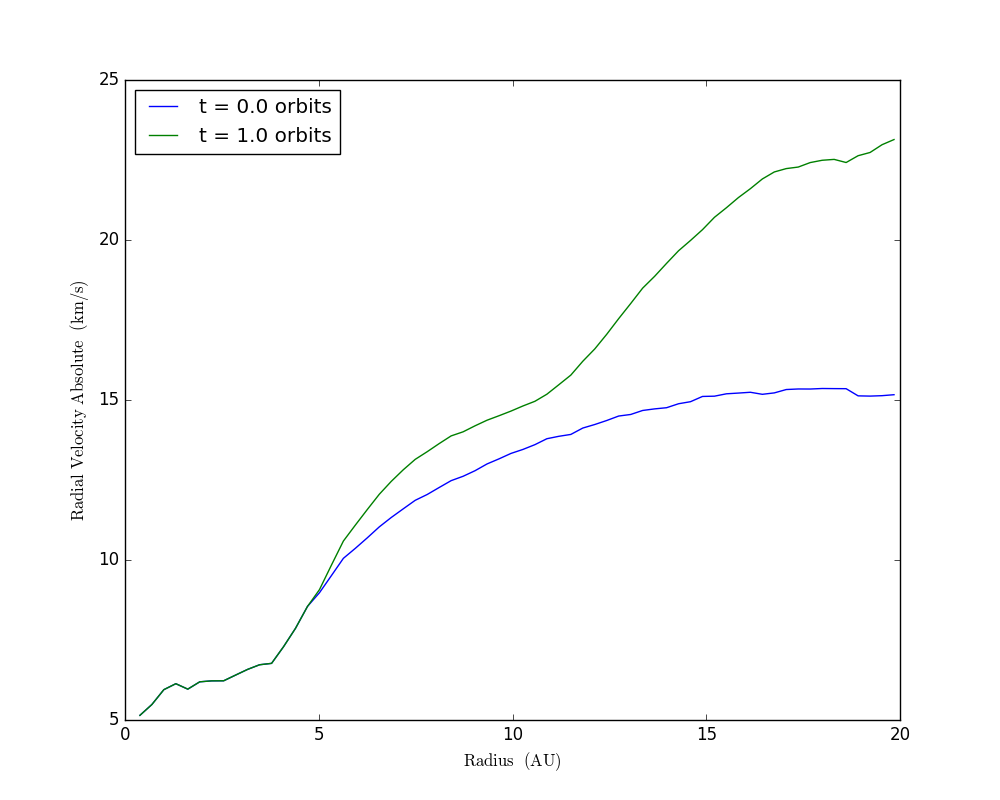
The stellar wind is characterized by its mass-loss , terminal wind velocity and dust acceleration radius. Mass-loss in evolved stars is driven by the uplift of gas molecules due to pulsation shocks that condense into dust grains at a certain distance from the star where they are accelerated by radiative pressure. An unperturbed initial velocity profile is given by the simplified analytical solution of a steady-state wind that considers the effect of radiation pressure in the mass-losing star and the pressure gradient (Parker, 1958, 1963). We impose outflow boundary conditions at all boundaries in the computational domain and constant density in the region inside the wind acceleration radius. Fig. 1 shows the azimuthally averaged radial velocity in the wind at the beginning of the simulation and after one orbit.

We modelled the effect of the radiative pressure reducing the gravity of the primary component by a factor of to take into account the acceleration mechanism of the wind, where is the ratio of the radiation pressure force per unit mass to the gravitational force per unit mass and is given by the expression (e.g., Jorissen, 2003):
where symbols have the same meaning as in previous equations. We assume that the value of the factor is independent of position (Dermine et al., 2009) and use in our simulations.
Fig. 2 shows the Roche equipotential contours and the location of the Lagrangian points in the CH Cyg system (see Table 1) when the radiation pressure of the AGB star is ignored. The shape of equipotential contours is modified when the primary star is assumed to exert radiation pressure or pulsations that drive the wind (Dermine et al., 2009). We show the contours for a ratio of the radiation pressure to gravitational force of 0.5 in the right-hand column in Fig. 2. The surface where the wind is accelerated is a substantial fraction of the Roche lobe radius of the mass-losing primary star. This radius is about two to three times larger than the stellar radius for most AGB stars (see e.g., Höfner, 2007).
The material in the disc around the WD is removed after each time step using the expression from Günther & Kley (2002):
where is a constant fraction of the order unity, denotes the time-step and is the average density in the region following Pepliński et al. (2008). The accreted material on to the secondary powers the accretion luminosity. Radiative feedback can potentially change the flow and accretion rates (Edgar & Clarke, 2004), but we have neglected its effect in our model.
| Parameter | Observed values | |
|---|---|---|
| Red giant | ||
| White dwarf | ||
| Long-period orbit | ||
| Circumstellar shell | ||
These numerical experiments were conducted using a dust acceleration radius distance of , where the wind is accelerated slightly beyond the escape velocity by the absorption of stellar radiation. For a typical value of the radius of the red giant of , the dust acceleration occurs at about twice the size of the stellar photosphere and inside the Roche lobe with the acceleration zone being about a factor of 2 smaller than the Roche radius of the system. The wind velocity, density and pressure are set in all grid cells within the wind acceleration radius of the primary component. Although this method does not include the dust as a coupled component and the full physics of the wind acceleration mechanism is not considered, it can provide the expected range of terminal wind velocities that are crucially important for deriving accretion rates on the secondary.
The donor star is assumed to have radial pulsations in its outer envelope, which are characteristic of AGB stars. These pulsations are considered as a source of the mass-loss fluctuations in the evolved star. As this effect is relevant for our investigation of accretion rate in symbiotic systems, we have included a pulsation period of and an amplitude of in the material that is introduced in the dust acceleration radius. The amplitude of stellar pulsations that can possibly produce the wind variability in the primary can be constrained by models of evolved stars (see e.g., Podsiadlowski & Mohamed, 2007).
3 Results and Discussion
In this section, we present the results of wind accretion simulations using the hydrodynamical code described in Section 2. Table 1 shows the fiducial parameters used in the accreting wind model of the variable CH Cyg system studied by Hinkle et al. (2009).
We parametrize the wind from the AGB star using the mass-loss, dust acceleration radius and initial velocity for the wind. Several steady-state cases are compared using uniform and adaptive grids to evaluate the accuracy of the results (cases 1–3). Table 2 shows the grid and wind parameters of different simulations in the three-dimensional runs, including short outburst simulations (cases 4–6). The computational domain is divided into squared blocks where , and indicate the number of grid points along the corresponding coordinate directions. Based on our previous work with two-dimensional calculations and more recent results, an adaptive mesh grid provides an adequate method to resolve the accretion region around the companion (de Val-Borro et al. 2007; Paper I; Huarte-Espinosa et al. 2013). All the simulations are run for approximately two orbital periods when the system reaches a quasi-steady state. As noted in the previous section we compute the mass accretion rates on to the secondary normalized to the mass-loss rates as a function of time during the simulation by integrating the mass within a control volume.
In the following, we present the results from three-dimensional simulations using a dynamically refined grid as they allow for adequate grid resolution. We consider a range of parameters inferred from the observations of CH Cyg summarized in Table 1 (Hinkle et al., 2009) and vary the wind velocity, mass-loss and wind acceleration radius in our simulations to account for realistic outburst events. We adopt the most probable solution of the orbit, with an orbital period of and masses of and for our model.
 |
 |
 |
 |
3.1 Steady-wind simulations
We cover the range of of the initial wind velocity at the dust acceleration surface for the steady-state wind simulations. Initially, we perform a comparison of flow structures in the three-dimensional simulations with the two-dimensional results described in Paper I. Our choice of wind velocities ensures that most of the wind material that is injected at the dust acceleration boundary will escape from the gravitational pull of the binary system and leave the computational domain. For this choice of wind parameters, the flow has a Mach number M = 2–4 at the position of the accretor.
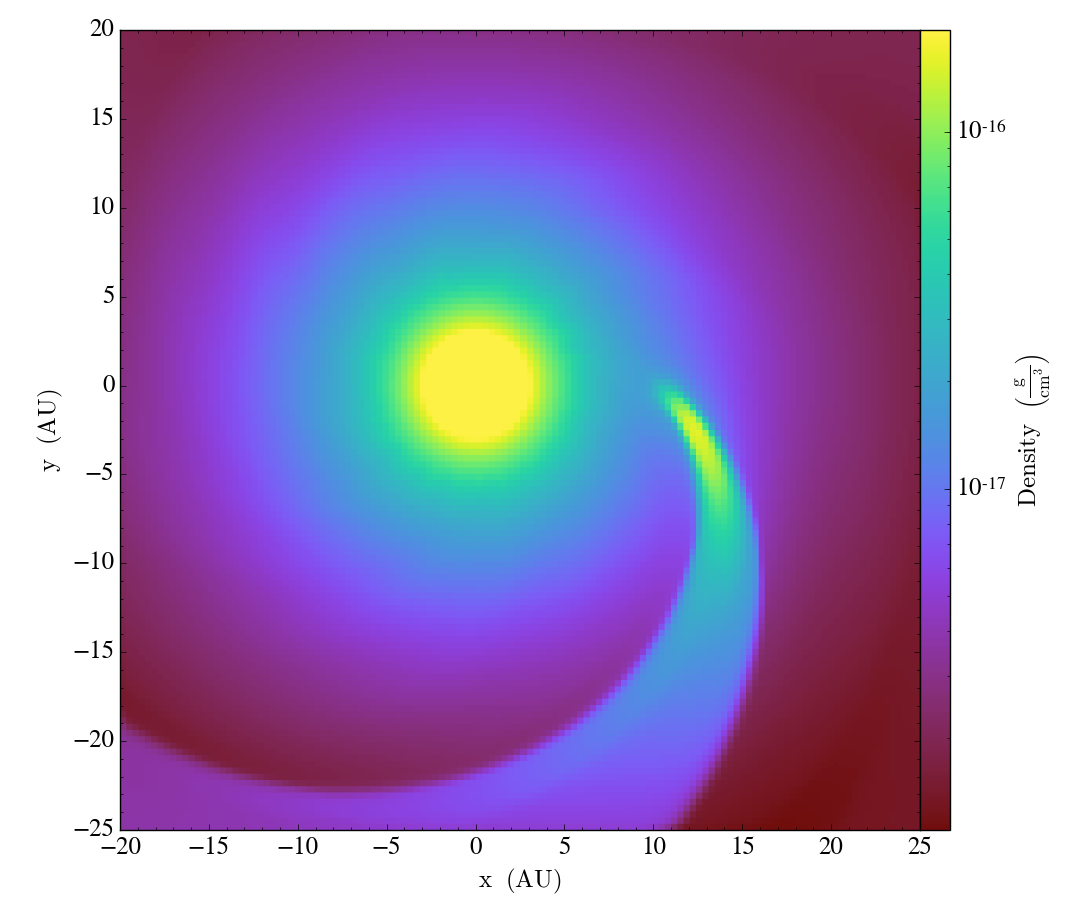
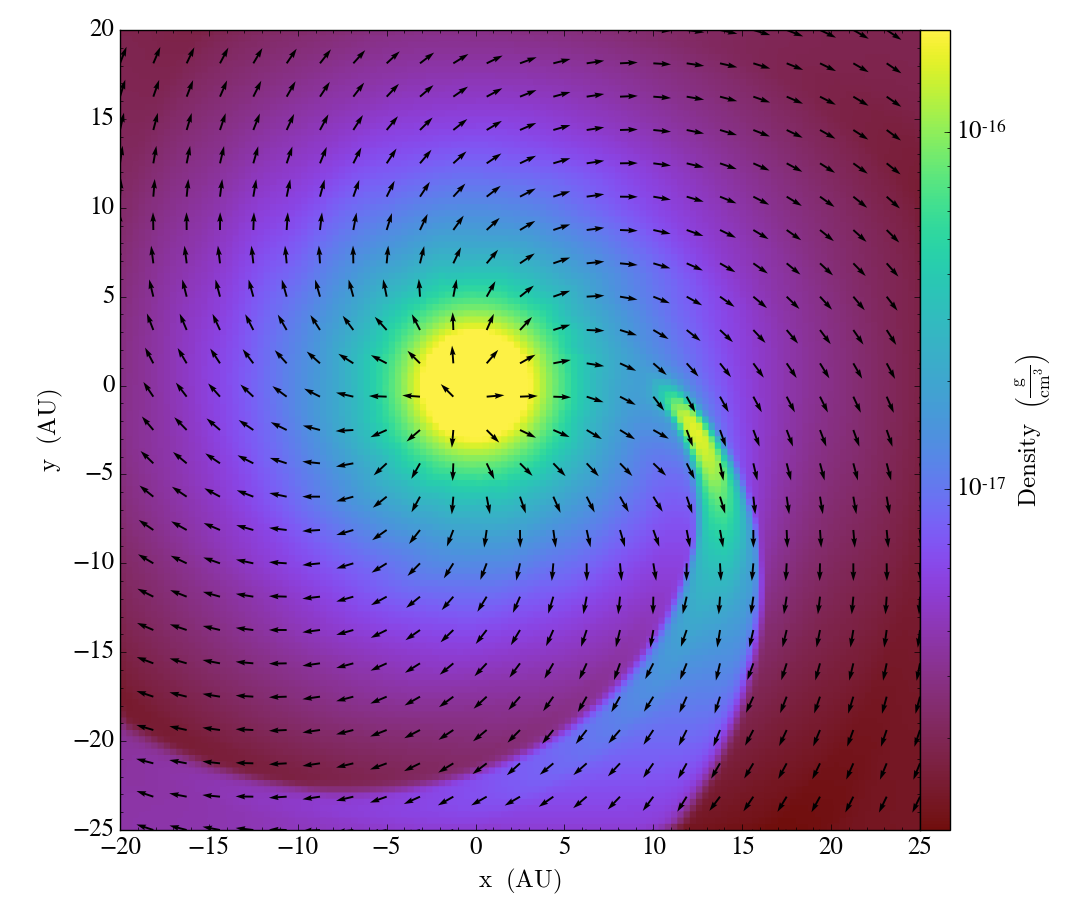
We show the density distribution of the perturbed wind in the simulation with a terminal wind speed of in Fig. 3 after one orbit. The wind material forms a spiral shock around the secondary that is detached from the accretor and is focused on the orbital plane, as has been seen in previous numerical works (Edgar et al., 2008; Pejcha et al., 2016). A flattened elongated overdensity at the position of the secondary forms by the accretion of shocked material from the stellar wind. The velocity field geometry in a quasi-steady state after one orbital period is shown in the right-hand panels of Fig. 3. In addition, we show the orbital velocity of the companion added to the total velocity of the gas. Some wind material from the giant star that passes close to the secondary and is shocked by the spiral arm has an escape velocity smaller than that of the companion. This material is accreted along the accretion line behind the companion. The gas stream observed in previous two-dimensional simulations and SPH models is considerably weaker (Paper I; Mohamed & Podsiadlowski, 2012). The deflection of the streamlines in the non-inertial frame, which are defined as the lines that are always tangential to the velocity, is shown in Fig. 4.
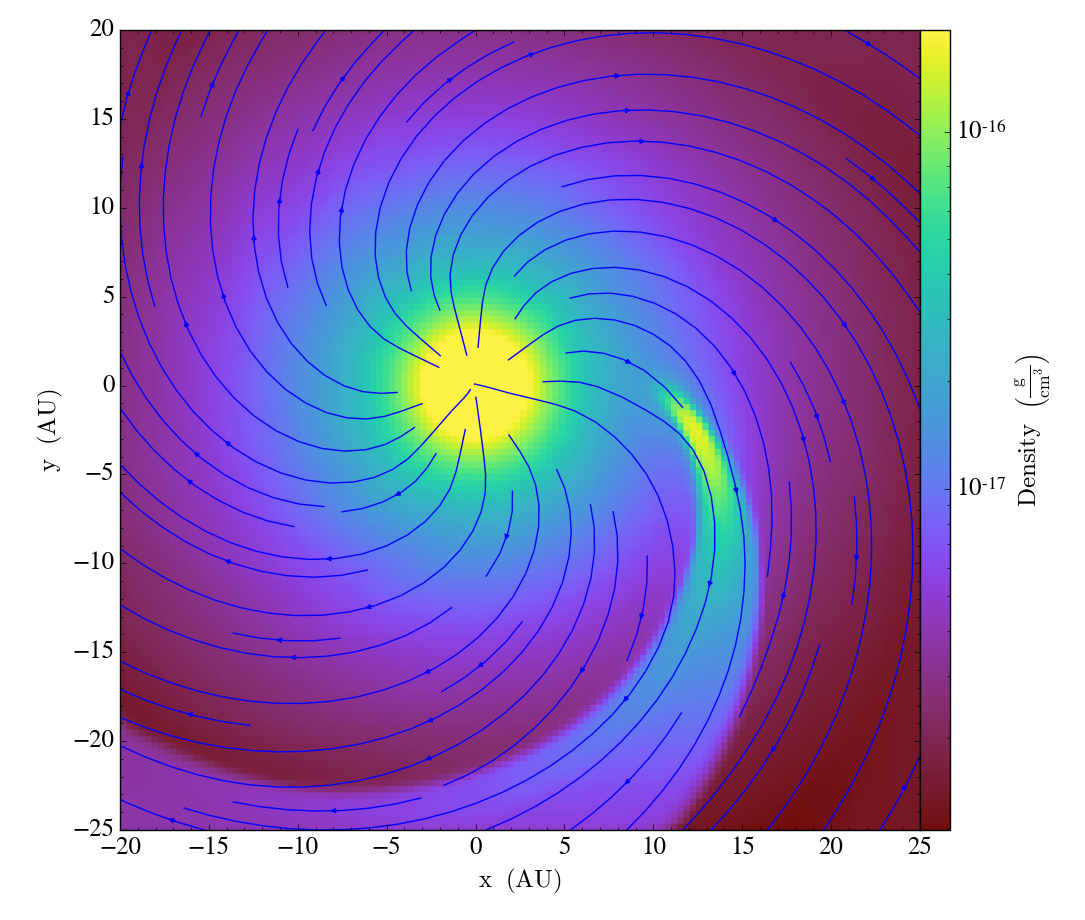
Since we have used the reduced gravity expression described in Section 2, the focused wind accretion in this system shows a complex dynamics, resulting in arc structures and low-density cavities that form in the envelope beyond the accreting companion. We observe that a significant fraction of the material in the wind lost by the giant component is focused on the orbital plane and partially accreted on to the hot compact star. Additionally, a bow shock and a spiral-like tail structure forms near the position of the secondary and on the farther side from the primary due to the supersonic orbital motion creating an asymmetric configuration. The shock winds around the primary and some of the material accumulates in the region around the secondary, forming an accretion disc. This structure is similar to that observed in other numerical simulations of wind accretion in binary systems (e.g., Theuns & Jorissen, 1993; Mastrodemos & Morris, 1999; Edgar et al., 2008). A small fraction of the matter in the stellar wind falls back on to the primary after being deflected by the companion.
We define the accretion ratio as the accreted mass over the mass lost by the secondary integrated over a hundredth of an orbit:
For comparison, we use the BHL accretion rate calculated from numerical solutions of BHL flow by Shima et al. (1985), as referred to in equation (32) of Edgar (2004). The estimated mass-capture rate by the secondary in the numerical approach is:
| (3) |
where is the sound speed of the gas; other symbols have their usual meaning. Note that this estimate includes an extra factor of 2 based on two-dimensional numerical simulations (e.g., Shima et al., 1985). In this approximation, the fluid is supposed to be non-interacting except on the downstream side of the shock where material flows on to the accretor. This framework was originally applied to the flow around single star moving through the interstellar medium. However, the accretion rate given in equation (3) is frequently used as a benchmark with numerical simulations of accretion in isolated stars and binary systems (see e.g., Edgar, 2004, 2005). Fig. 5 shows the time evolution of the accretion ratio compared with the expected BHL accretion rate for this system. After a brief transient period, the accretion ratio reaches a steady value about 20% higher than the BHL estimate defined by equation (3). The material transferred from the donor to the accretor carries angular momentum that will introduce a change in the orbital parameters with a decreasing orbital period. However, this change occurs on a time-scale much greater than the simulation characteristic time.

3.2 Outburst simulations
| Case | Grid | Resolution | Refinea | b | c | d | e |
|---|---|---|---|---|---|---|---|
| () | () | () | () | () | |||
| Uniform | |||||||
| AMR | 3 | ||||||
| AMR | 3 | ||||||
| AMR | 5 | ||||||
| AMR | 5 | ||||||
| AMR | 5 |
-
(a)
Number of AMR refinement levels.
-
(b)
Terminal wind velocity.
-
(c)
Mass-loss rate from the primary.
-
(d)
Terminal wind velocity during outburst.
-
(e)
Mass-loss rate from the primary during outburst.
We performed three sets of numerical experiments introducing a stellar outburst in the mass-losing star during a fraction of an orbital period to study the effect of the variation in the wind properties on the envelope and large-scale spiral structure. A smooth variation of the wind properties is included during a short fraction of an orbital period to prevent numerical instabilities. An estimate of the changes in the mass accretion ratios is of special interest since it is expected in various types of interacting binaries. This variation produces a smooth spherically symmetric shell that is focused towards the equatorial plane of the system by the gravity of the companion. The size of the physical domain was increased by a factor of 6 in the -and -directions, and we used two additional mesh refinement levels as compared with the steady-wind simulations presented in Section 3.1 to improve the resolution around the secondary and bow shocks. The parameters of these simulations are summarized in Table 2. The values of the wind parameters during the eruption were varied over several time-steps to avoid stability problems in the simulation.
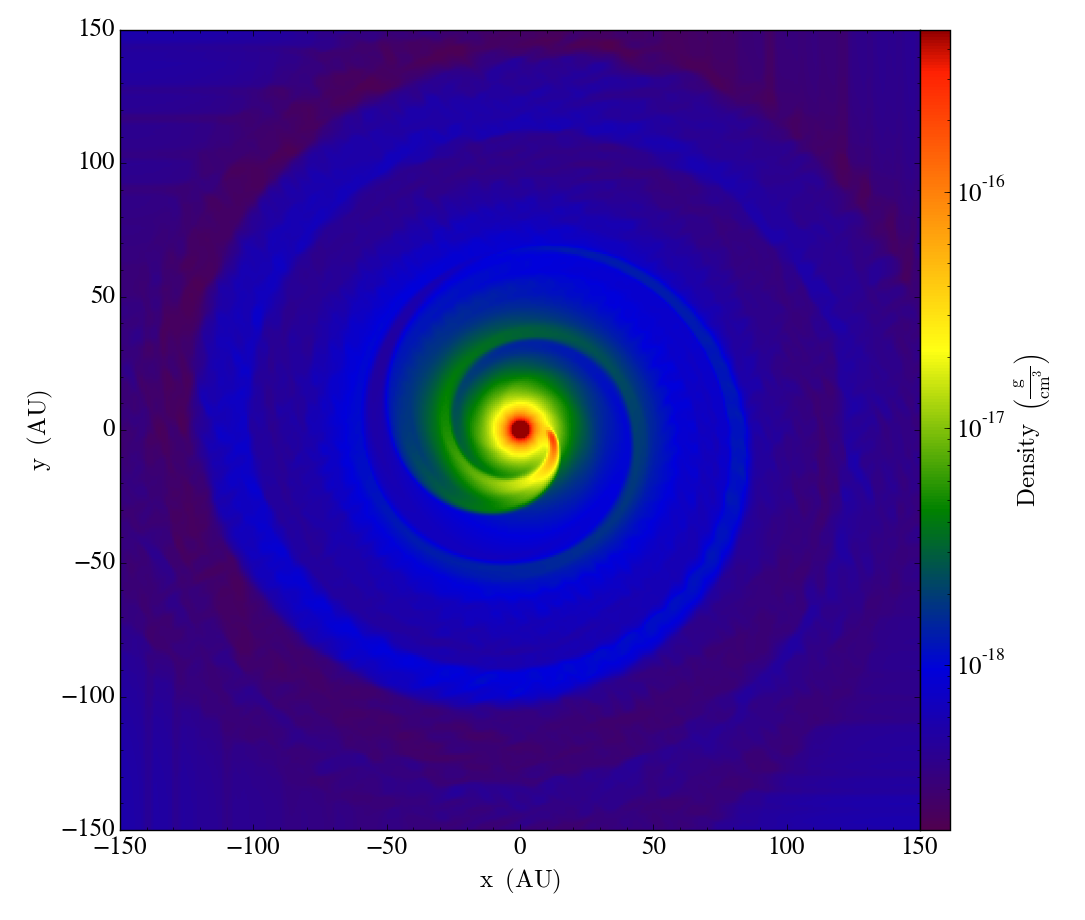
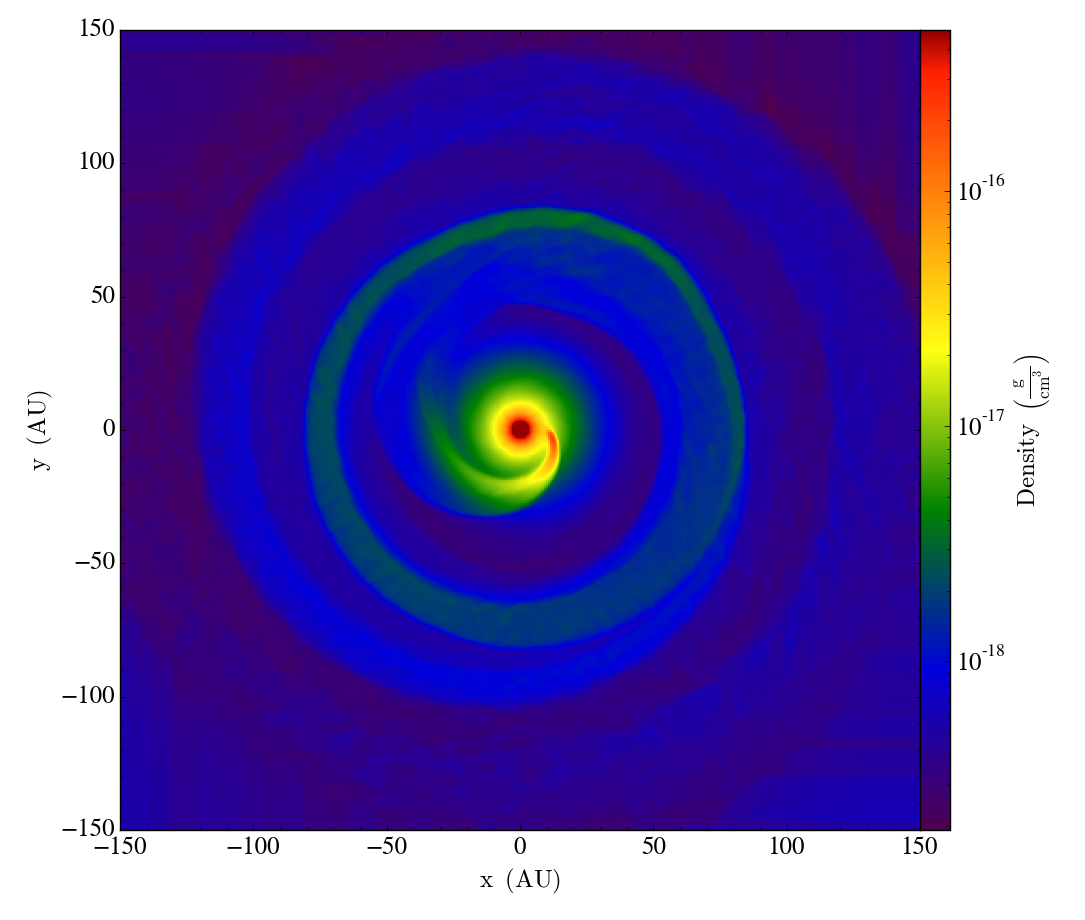
We first consider a system with the orbital parameters of CH Cyg and a mass-loss of from the primary star and a terminal wind speed of . Thus, the wind speed and the orbital velocity have comparable values. This speed ensures that the wind can escape from the computational domain without falling back on the primary. After the flow reaches the quasi-steady-state solution, spiral shocks form, surrounding the secondary from the stellar wind material of the giant star. The wind velocity at the dust acceleration distance is increased by a factor of 4 during an interval of 0.1 orbits and then brought back to its initial value (case 4 in Table 2). The radial speed is modified for all grid cells between two radii and around the primary star. During the burst the wind leaves the wind acceleration surface in a highly supersonic regime. Thus the perturbation takes about 0.04 orbits to reach the location of the accretor. The flow produced by the burst is deflected by the secondary and produces a temporary increase in the temperature. This pulse generates an expanding shell that modifies considerably the structure of the accretion flow and the rotating disc structure observed around the accretor during the quiescent phase. When the shell leaves the boundaries of the domain the accretion flow returns to its initial equilibrium state with a bow shock spiralling around the system. The mass accretion ratio is decreased during the outburst period although it is greater than the BHL prediction from equation (3). In Fig. 6 we show the density in the orbital plane.

An important indication of observational signatures of the outburst phase is the amount of matter that is accreted by the secondary and their temporal behaviour. We show the time evolution of the accretion ratio for simulations 4 and 5 in Fig. 7 compared with the standard BHL planar accretion. This approximation, where the effects of pressure and non-parallel flow are ignored, provides a good estimate, but the observed accretion rates in the simulations are, on average, higher. The accretion ratios are modified during the outburst phase and settle to a steady-state value during the period when the flow becomes stationary once again. In this model, the accretion rate from quiescence is increased by about 40% compared to the BHL value with some variability, which could be explained by the limited resolution around the secondary and numerical noise.
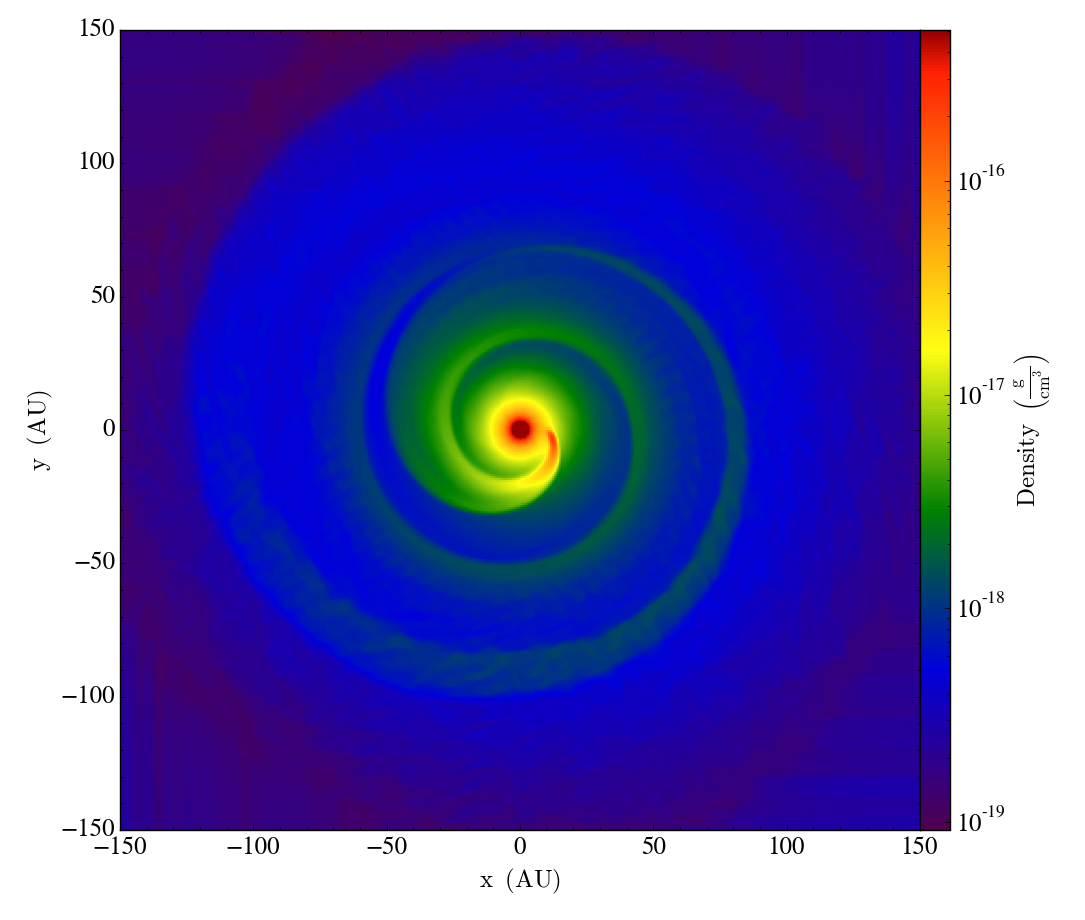
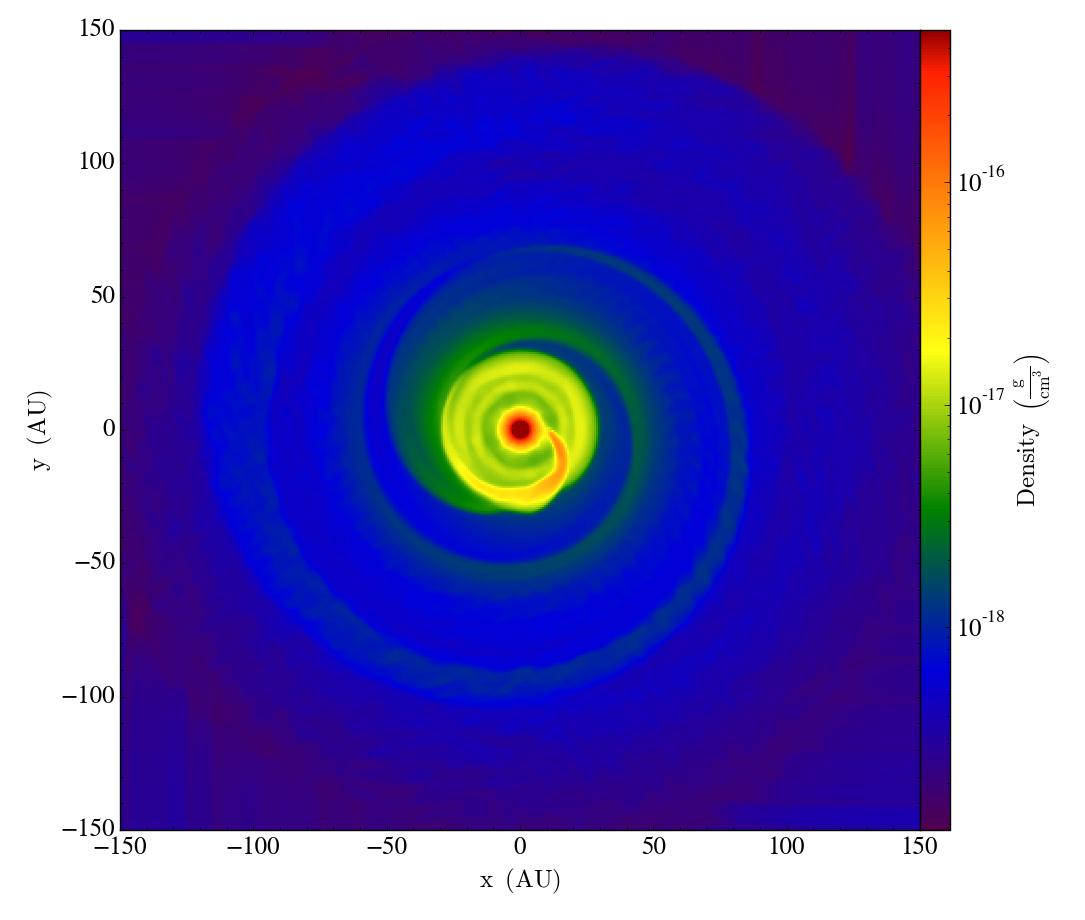
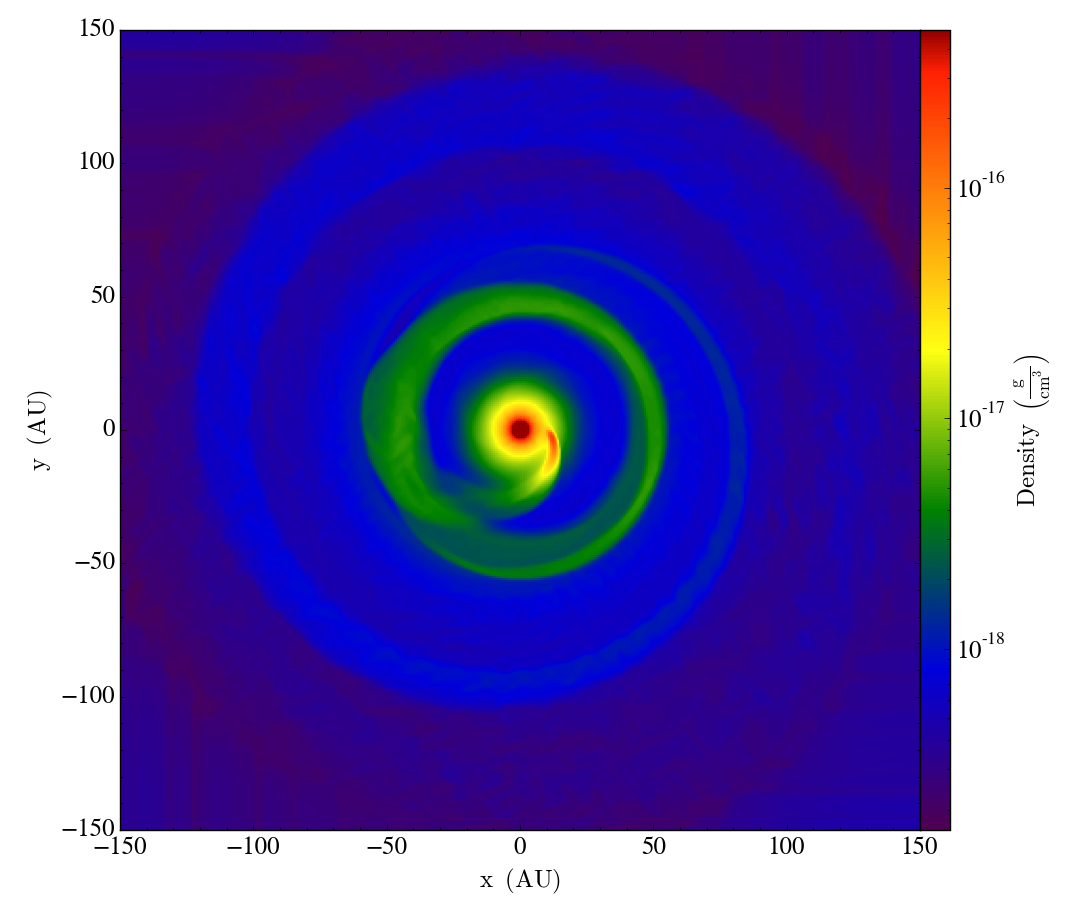
We ran another numerical experiment with an outburst phase starting from a steady-state solution for a scenario where the wind velocity was kept constant and the mass-loss rate increased by a factor of 2 during 0.1 orbit and then returned to its initial value of (simulation 5 in Table 2). This simulation was run for further 1.5 orbits after introducing the disturbance to consider the settling period of the accretion flow. The spiral structure was substantially perturbed by the outburst, and the spiral arms merged together forming a ring-shaped surface. The effect of the burst introduced in the mass-loss rate disappeared after two additional orbital periods. A sequence of density snapshots showing the temporal evolution of the flow patterns in the orbital plane is shown in Fig. 8. The flow pattern is significantly more complicated than in the constant mass-loss and wind speed simulations described previously.
 |
 |
 |
 |
Finally, we carried out a simulation where the wind velocity was increased by an order of magnitude for one-tenth of an orbit and the mass-loss rate was kept constant with a value of (simulation 6 in Table 2). With a larger velocity increase, the flow shows a more extended disturbance of the steady flow than in the previously studied cases. After about 0.2 orbit from the start of the disturbance, the flow solution returns to the steady state obtained in the other simulations. In all simulations of the outburst phase, the accretion ratio varies over a similar time over which the wind parameters are modified.
Despite the oscillations in the wake during the outburst phase, the accretion flow in the simulations is steady and there is no evidence of a violent instability, such as the flip-flop behaviour that has been previously hinted at in some numerical simulations of BHL flow (Blondin, 2013). The large-scale structure of the wake stays undisrupted. These results are consistent with previous high-resolution three-dimensional simulations of BHL accretion (Mitsumoto et al., 2005; Blondin & Raymer, 2012). Thus, introducing these perturbations is not sufficient to affect the stability of the flow and accretion, and does not bring unstable behaviour (Matsuda et al., 1987).
4 Summary and Conclusions
In this paper, we have presented a three-dimensional numerical model of focused wind accretion with an adiabatic equation of state in the context of interacting binary systems, for example, symbiotic systems such as the variable CH Cyg, and considered the dynamical aspects of the accretion flow in the simulations. A strong spiral shock forms, which is caused by the gravity of the accretor with a moderately wide opening angle. The flow pattern is similar to the two-dimensional planar geometry studied in Paper I. However, there are significant differences, including the development of a larger asymmetry in the inner and outer spiral shocks. Our numerical method does not need artificial viscosity to stabilize the flow and is well suited for studying a high Mach number flow around the accretor. The obtained wind solutions and mass accretion rates suggest that the accretion via the wind from the giant star on to the companion occurs in a more efficient manner by a factor of 1.5 than in the standard BHL estimate based on numerical simulations (e.g., Edgar, 2004).
We have performed several sets of simulations of accretion flow in symbiotic binary systems with varying mass-loss rates and wind speeds during a fraction of an orbit. First, we increased the wind speed at infinity by a factor of 4. The second run used the original wind speed and doubled the mass-loss rate from the donor. In the last scenario, we increased both the wind speed and mass-loss rate. The first and third experiments show a change in the accretion rates on to the secondary of around a factor 2 larger than the BHL accretion rates and a largely disturbed flow as the outburst material interacts with the accretion wake.
For the velocity outburst simulation, the accretion ratio decreases compared with the quiescent state. However, the accretion is higher than the value expected from the BHL estimate also during the transient outburst event. The variation in the accretion rate is consistent within a factor of 2 with the steady-state accretion expected from equation (3), which is substantially larger than the value for the pressure-free flow originally studied by Hoyle & Lyttleton (1939). None the less the simulations where we vary the mass-loss rate match more closely the BHL approximation given by equation (3). The time-scales of the variations introduced in the mass-loss rates are of the order of weeks to months, which could be associated with fluctuations in the brightness of these objects (Belczyński et al., 2000). These results agree well with two- and three-dimensional numerical simulations of BHL accretion (Ruffert & Arnett, 1994; Edgar, 2005). We do not observe any instability in the accretion column that has been described in previous works (Soker, 1990; Edgar, 2005), as expected for the Mach number of the flow that we have considered. In addition, there is no oscillation of the disc rotation in the simulations such as observed in the flip-flop instability (e.g., Pogorelov et al., 2000; Ruffert, 1999), in accord with previous three-dimensional simulations in spherical coordinates (Blondin & Raymer, 2012).
Understanding the origin of the outflows and jets in wind interacting systems is crucial for providing insights into the mass-transfer mechanism. A limitation of the models presented here is that the wind acceleration mechanism is prescribed without including the dust formation and radiative pressure that are responsible for the wind formation. Such numerical analysis may bring new effects as a treatment of dust-driven acceleration in the wind model may modify the outflow formation and mass-loss rate. We plan to address these effects in future works with an application to the interpretation of CH Cyg and other symbiotic systems.
Acknowledgements
This work was supported by NASA’s Planetary Astronomy Program. MK acknowledges support provided by NASA grants HST GO-NAS12761, and Chandra GO02-13031, and support from the Chandra X-ray Center operated by the Smithsonian Astrophysical Observatory under NASA Contract NAS8-03060. We thank the anonymous referee for carefully reading our paper and providing constructive comments. The numerical codes used in this article are based on the open source piernik code, and the publicly available flash code, which is in part developed by the DOE NNSA-ASC OASCR Flash Center at the University of Chicago. We especially thank Artur Gawryszczak and Kacper Kowalik for many useful discussions on the piernik code. All the analysis and visualization of the data were carried out using the yt toolset by Turk et al. (2011)222The package is available for download from http://yt-project.org. and the pynbody package (Pontzen et al., 2013)333The package is available at https://github.com/pynbody/pynbody. The simulations presented in this work were performed on computational resources supported by the Princeton Institute for Computational Science and Engineering (PICSciE) and the Office of Information Technology’s High Performance Computing Center and Visualization Laboratory at Princeton University. This research has made use of NASA’s Astrophysics Data System.
References
- Abate et al. (2013) Abate C., Pols O. R., Izzard R. G., Mohamed S. S., de Mink S. E., 2013, A&A, 552, A26
- Belczyński et al. (2000) Belczyński K., Mikołajewska J., Munari U., Ivison R. J., Friedjung M., 2000, A&AS, 146, 407
- Bjorkman & Cassinelli (1993) Bjorkman J. E., Cassinelli J. P., 1993, ApJ, 409, 429
- Blondin (2013) Blondin J. M., 2013, ApJ, 767, 135
- Blondin & Raymer (2012) Blondin J. M., Raymer E., 2012, ApJ, 752, 30
- Bode et al. (2007) Bode M. F., Harman D. J., O’Brien T. J., Bond H. E., Starrfield S., Darnley M. J., Evans A., Eyres S. P. S., 2007, ApJ, 665, L63
- Bondi & Hoyle (1944) Bondi H., Hoyle F., 1944, MNRAS, 104, 273
- Booth et al. (2016) Booth R. A., Mohamed S., Podsiadlowski P., 2016, MNRAS, 457, 822
- Clarke & Carswell (2014) Clarke C., Carswell B., 2014, Principles of Astrophysical Fluid Dynamics
- Dermine et al. (2009) Dermine T., Jorissen A., Siess L., Frankowski A., 2009, A&A, 507, 891
- Edgar (2004) Edgar R., 2004, New Astronomy Review, 48, 843
- Edgar (2005) Edgar R. G., 2005, A&A, 434, 41
- Edgar & Clarke (2004) Edgar R., Clarke C., 2004, MNRAS, 349, 678
- Edgar et al. (2008) Edgar R. G., Nordhaus J., Blackman E. G., Frank A., 2008, ApJ, 675, L101
- Fryxell & Taam (1988) Fryxell B. A., Taam R. E., 1988, ApJ, 335, 862
- Günther & Kley (2002) Günther R., Kley W., 2002, A&A, 387, 550
- Hanasz et al. (2010) Hanasz M., Kowalik K., Wóltański D., Pawłaszek R., 2010, in Gożdziewski K., Niedzielski A., Schneider J., eds, EAS Publications Series Vol. 42, EAS Publications Series. pp 275–280 (arXiv:0812.2161), doi:10.1051/eas/1042029
- Hinkle et al. (2009) Hinkle K. H., Fekel F. C., Joyce R. R., 2009, ApJ, 692, 1360
- Höfner (2007) Höfner S., 2007, in Kerschbaum F., Charbonnel C., Wing R. F., eds, Astronomical Society of the Pacific Conference Series Vol. 378, Why Galaxies Care About AGB Stars: Their Importance as Actors and Probes. p. 145 (arXiv:astro-ph/0702444)
- Hoyle & Lyttleton (1939) Hoyle F., Lyttleton R. A., 1939, in Proceedings of the Cambridge Philosophical Society. p. 405
- Huarte-Espinosa et al. (2013) Huarte-Espinosa M., Carroll-Nellenback J., Nordhaus J., Frank A., Blackman E. G., 2013, MNRAS, 433, 295
- Jin et al. (1995) Jin S., Xin Z., Jin S., Xin Z., 1995, Comm. Pure Appl. Math, 48, 235
- Jorissen (2003) Jorissen A., 2003, in Habing H. J., Olofsson H., eds, Asymptotic giant branch stars. Astronomy and astrophysics library. New York, Berlin: Springer, p. 461
- Karovska et al. (1997) Karovska M., Hack W., Raymond J., Guinan E., 1997, ApJ, 482, L175
- Karovska et al. (2005) Karovska M., Schlegel E., Hack W., Raymond J. C., Wood B. E., 2005, ApJ, 623, L137
- Karovska et al. (2010) Karovska M., Gaetz T. J., Carilli C. L., Hack W., Raymond J. C., Lee N. P., 2010, ApJ, 710, L132
- Karovska et al. (2011) Karovska M., de Val-Borro M., Hack W., Raymond J., Sasselov D., Lee N. P., 2011, in American Astronomical Society Meeting Abstracts #218. p. 228.03
- Kenyon (1986) Kenyon S. J., 1986, The symbiotic stars
- Kowalik et al. (2013) Kowalik K., Hanasz M., Wóltański D., Gawryszczak A., 2013, MNRAS, 434, 1460
- Livio et al. (1991) Livio M., Soker N., Matsuda T., Anzer U., 1991, MNRAS, 253, 633
- Maercker et al. (2012) Maercker M., et al., 2012, Nature, 490, 232
- Maercker et al. (2016) Maercker M., et al., 2016, A&A, 586, A5
- Mastrodemos & Morris (1999) Mastrodemos N., Morris M., 1999, ApJ, 523, 357
- Matsuda et al. (1987) Matsuda T., Inoue M., Sawada K., 1987, MNRAS, 226, 785
- Mitsumoto et al. (2005) Mitsumoto M., et al., 2005, Astronomy Reports, 49, 884
- Mohamed & Podsiadlowski (2012) Mohamed S., Podsiadlowski P., 2012, Baltic Astronomy, 21, 88
- Nagae et al. (2004) Nagae T., Oka K., Matsuda T., Fujiwara H., Hachisu I., Boffin H. M. J., 2004, A&A, 419, 335
- O’Brien et al. (2006) O’Brien T. J., et al., 2006, Nature, 442, 279
- Olofsson et al. (1990) Olofsson H., Carlstrom U., Eriksson K., Gustafsson B., Willson L. A., 1990, A&A, 230, L13
- Paczyński (1971) Paczyński B., 1971, ARA&A, 9, 183
- Parker (1958) Parker E. N., 1958, ApJ, 128, 664
- Parker (1963) Parker E. N., 1963, Interplanetary dynamical processes.
- Pejcha et al. (2016) Pejcha O., Metzger B. D., Tomida K., 2016, MNRAS, 455, 4351
- Pen et al. (2003) Pen U.-L., Arras P., Wong S., 2003, ApJS, 149, 447
- Pepliński et al. (2008) Pepliński A., Artymowicz P., Mellema G., 2008, MNRAS, 386, 164
- Podsiadlowski & Mohamed (2007) Podsiadlowski P., Mohamed S., 2007, Baltic Astronomy, 16, 26
- Pogorelov et al. (2000) Pogorelov N. V., Ohsugi Y., Matsuda T., 2000, MNRAS, 313, 198
- Pontzen et al. (2013) Pontzen A., Roškar R., Stinson G. S., Woods R., Reed D. M., Coles J., Quinn T. R., 2013, pynbody: Astrophysics Simulation Analysis for Python
- Ruffert (1999) Ruffert M., 1999, A&A, 346, 861
- Ruffert & Arnett (1994) Ruffert M., Arnett D., 1994, ApJ, 427, 351
- Shima et al. (1985) Shima E., Matsuda T., Takeda H., Sawada K., 1985, MNRAS, 217, 367
- Skopal & Cariková (2015) Skopal A., Cariková Z., 2015, A&A, 573, A8
- Slovak & Africano (1978) Slovak M. H., Africano J., 1978, MNRAS, 185, 591
- Soker (1990) Soker N., 1990, ApJ, 358, 545
- Stone et al. (2008) Stone J. M., Gardiner T. A., Teuben P., Hawley J. F., Simon J. B., 2008, ApJS, 178, 137
- Taylor et al. (1986) Taylor A. R., Seaquist E. R., Mattei J. A., 1986, Nature, 319, 38
- Theuns & Jorissen (1993) Theuns T., Jorissen A., 1993, MNRAS, 265, 946
- Turk et al. (2011) Turk M. J., Smith B. D., Oishi J. S., Skory S., Skillman S. W., Abel T., Norman M. L., 2011, ApJS, 192, 9
- de Val-Borro (2008) de Val-Borro M., 2008, PhD thesis, University of Stockholm
- de Val-Borro et al. (2006) de Val-Borro M., et al., 2006, MNRAS, 370, 529
- de Val-Borro et al. (2007) de Val-Borro M., Artymowicz P., D’Angelo G., Peplinski A., 2007, A&A, 471, 1043
- de Val-Borro et al. (2009) de Val-Borro M., Karovska M., Sasselov D., 2009, ApJ, 700, 1148