Amplification of perpendicular and parallel magnetic fields by cosmic ray currents
Abstract
Cosmic ray (CR) currents through magnetised plasma drive strong instabilities producing amplification of the magnetic field. This amplification helps explain the CR energy spectrum as well as observations of supernova remnants and radio galaxy hot spots. Using magnetohydrodynamic (MHD) simulations, we study the behaviour of the non-resonant hybrid (NRH) instability (also known as the Bell instability) in the case of CR currents perpendicular and parallel to the initial magnetic field. We demonstrate that extending simulations of the perpendicular case to 3D reveals a different character to the turbulence from that observed in 2D. Despite these differences, in 3D the perpendicular NRH instability still grows exponentially far into the non-linear regime with a similar growth rate to both the 2D perpendicular and 3D parallel situations. We introduce some simple analytical models to elucidate the physical behaviour, using them to demonstrate that the transition to the non-linear regime is governed by the growth of thermal pressure inside dense filaments at the edges of the expanding loops. We discuss our results in the context of supernova remnants and jets in radio galaxies. Our work shows that the NRH instability can amplify magnetic fields to many times their initial value in parallel and perpendicular shocks.
keywords:
magnetic fields; (magnetohydrodynamics) MHD; turbulence; acceleration of particles; galaxies: jets; (ISM:) supernova remnants.1 Introduction
Cosmic rays (CRs) are detected on Earth with energies up to eV, but the origin of the highest energy CRs is still unknown. The CR energy spectrum is characterised by an power law up to a spectral break at eV, commonly known as the knee, after which the spectrum steepens. There is now good evidence that CRs are accelerated up to, and possibly beyond, the knee in Supernova remnants (SNRs; Allen et al. 1997; Buckley et al. 1998; Tanimori et al. 1998; Vink & Laming 2003). The best candidate mechanism for accelerating high energy CRs is diffusive shock acceleration (DSA; Axford et al. 1977; Krymskii 1977; Bell 1978; Blandford & Ostriker 1978), in which CRs are scattered multiple times across a shock front, successively gaining energy. DSA produces an power law spectrum, which is consistent with that observed when escape losses in the Galactic disc are taken into account.
The characteristic maximum energy attainable by a CR undergoing DSA is set by the Hillas (1984) energy, which can be written as
| (1) |
where is the charge on the particle, is the size of the acceleration region, is the shock velocity and is the magnetic field. Since and are set from the parameters of the system in question, it becomes clear that the value of is crucial in estimating the maximum energy available to CR in a given astrophysical system.
It is possible to estimate the magnetic field strength in a non-thermal plasma from the observed synchrotron emission. In SNRs, X-ray synchrotron emission is confined to a thin rim close to the shock (e.g. Hughes et al. 2000; Long et al. 2003). Associating the synchrotron cooling length with the thickness of these rims allows the strength of the magnetic field to be inferred, resulting in estimates of roughly 100 times in excess of the expected ambient value of a few (Vink & Laming 2003; Berezhko et al. 2003; Berezhko & Völk 2004; Völk et al. 2005; Ballet 2006; Cassam-Chenaï et al. 2007; Uchiyama et al. 2007). Similar estimates are obtained from observations of hot spots in radio galaxies (Araudo et al. 2015, Araudo et al. in preparation), thought to be a potential source of ultra-high energy CRs (UHECRs; e.g. Axford 1994). A mechanism to strongly amplify the magnetic field is therefore required to explain both the acceleration of the highest energy cosmic rays and the observed non-thermal emission from shocks.
CR themselves can cause fluctuations in the magnetic field via the resonant (Lerche 1967; Kulsrud & Pearce 1969; Wentzel 1974; Skilling 1975a, b, c) and non-resonant hybrid (NRH; Lucek & Bell 2000; Bell 2004, 2005) instabilities; Bell (2004) showed that the latter causes strong field amplification. The NRH instability is also known in the literature as the Bell instability, and has been extensively studied using both magnetohydrodynamic (MHD; Bell 2004, 2005; Zirakashvili & Ptuskin 2008; Reville et al. 2008; Beresnyak & Li 2014) and particle-in-cell (PIC; Niemiec et al. 2008; Riquelme & Spitkovsky 2009; Stroman et al. 2009) simulations, as well as hybrid MHD-PIC treatments that combine the two techniques (Lucek & Bell 2000; Reville & Bell 2012a, 2013; Bell et al. 2013a). The NRH instability is driven by a cosmic ray current, , which is introduced through an additional term in the MHD equations. This current drives exponential growth of the magnetic field, even when the perturbed field has grown stronger than the initial uniform field, (that is, once the instability has become non-linear). Other instabilities are important for particle acceleration and magnetic field amplification; for example, the Weibel (1959) instability can provide the turbulence needed to scatter low energy CRs (Spitkovsky 2008; Sironi & Spitkovsky 2011), whilst other long-wavelength instabilities (Drury & Falle 1986; Bykov et al. 2011; Schure & Bell 2011; Reville & Bell 2012b) and vorticity created by density inhomogeneities (Giacalone & Jokipii 2007; Mizuno et al. 2014) may help perturb or amplify the magnetic field.
Much of the work on the NRH instability has focused on the case in which is parallel to the initial magnetic field, the situation in parallel shocks such as those thought to accelerate high energy particles in SNRs. However, perpendicular shocks are also common, especially in relativistic cases when the shock is always quasi-perpendicular. Highly relativistic shocks are unlikely to be the source of UHECR (Lemoine & Pelletier 2010; Sironi & Spitkovsky 2011; Reville & Bell 2014, Araudo et al. in preparation; Bell et al. in preparation), but kpc-scale, mildly relativistic shocks () may permit acceleration up to eV if the value of is high enough ( from equation 1, which assumes Bohm diffusion). Bohm diffusion must apply so that high energy CRs do not escape upstream before being accelerated and also has some observational support in SNRs (Stage et al. 2006). The question of whether a perpendicular current can effectively amplify the ambient magnetic field is therefore crucial in understanding whether, for example, jets from active galactic nuclei can accelerate the highest energy CRs.
Bell (2005) initially gave the general form of the NRH dispersion relation – which governs the growth of the instability – for all orientations of and . Milosavljević & Nakar (2006) built on this by developing an analytical model for turbulence driven by CR currents perpendicular to the initial magnetic field in gamma-ray burst (GRB) afterglows, finding that the instability may generate a large-scale magnetic field consistent with GRB synchrotron emission. Riquelme & Spitkovsky (2010) considered the perpendicular case in detail, also deriving the dispersion relation and related growth rates, before presenting two-dimensional (2D) PIC simulations using both constant CR current and CR injection at a boundary. They found that, in the constant current simulation, the instability grew exponentially in time but could become saturated due to charge separation in the plasma (see section 5.1). PIC simulations are powerful tools for modelling the interaction of CRs with magnetised plasma and are essential for studying the early stages of instability growth and particle acceleration as well as the ‘injection problem’ (e.g. Eichler 1979; Burgess 1987; Malkov & Voelk 1995; Giacalone 2005; Martins et al. 2009; Spitkovsky 2008; Sironi & Spitkovsky 2011; Caprioli et al. 2015). However, they are much more performance intensive than MHD codes and cannot yet be easily run in three dimensions (3D; although see e.g. Riquelme & Spitkovsky 2009; Huntington et al. 2015). In addition, the nature of PIC simulations usually requires adopting artificially low proton-to-electron mass ratios, which can affect results (Ruyer et al. 2016). Furthermore, particle localisation into fluid elements is not fully accounted for. Simple MHD codes such as those originally used by Bell (2004) do not have these limitations and can thus be used, complementarily to PIC studies, to examine the effect of considering the problem in 3D.
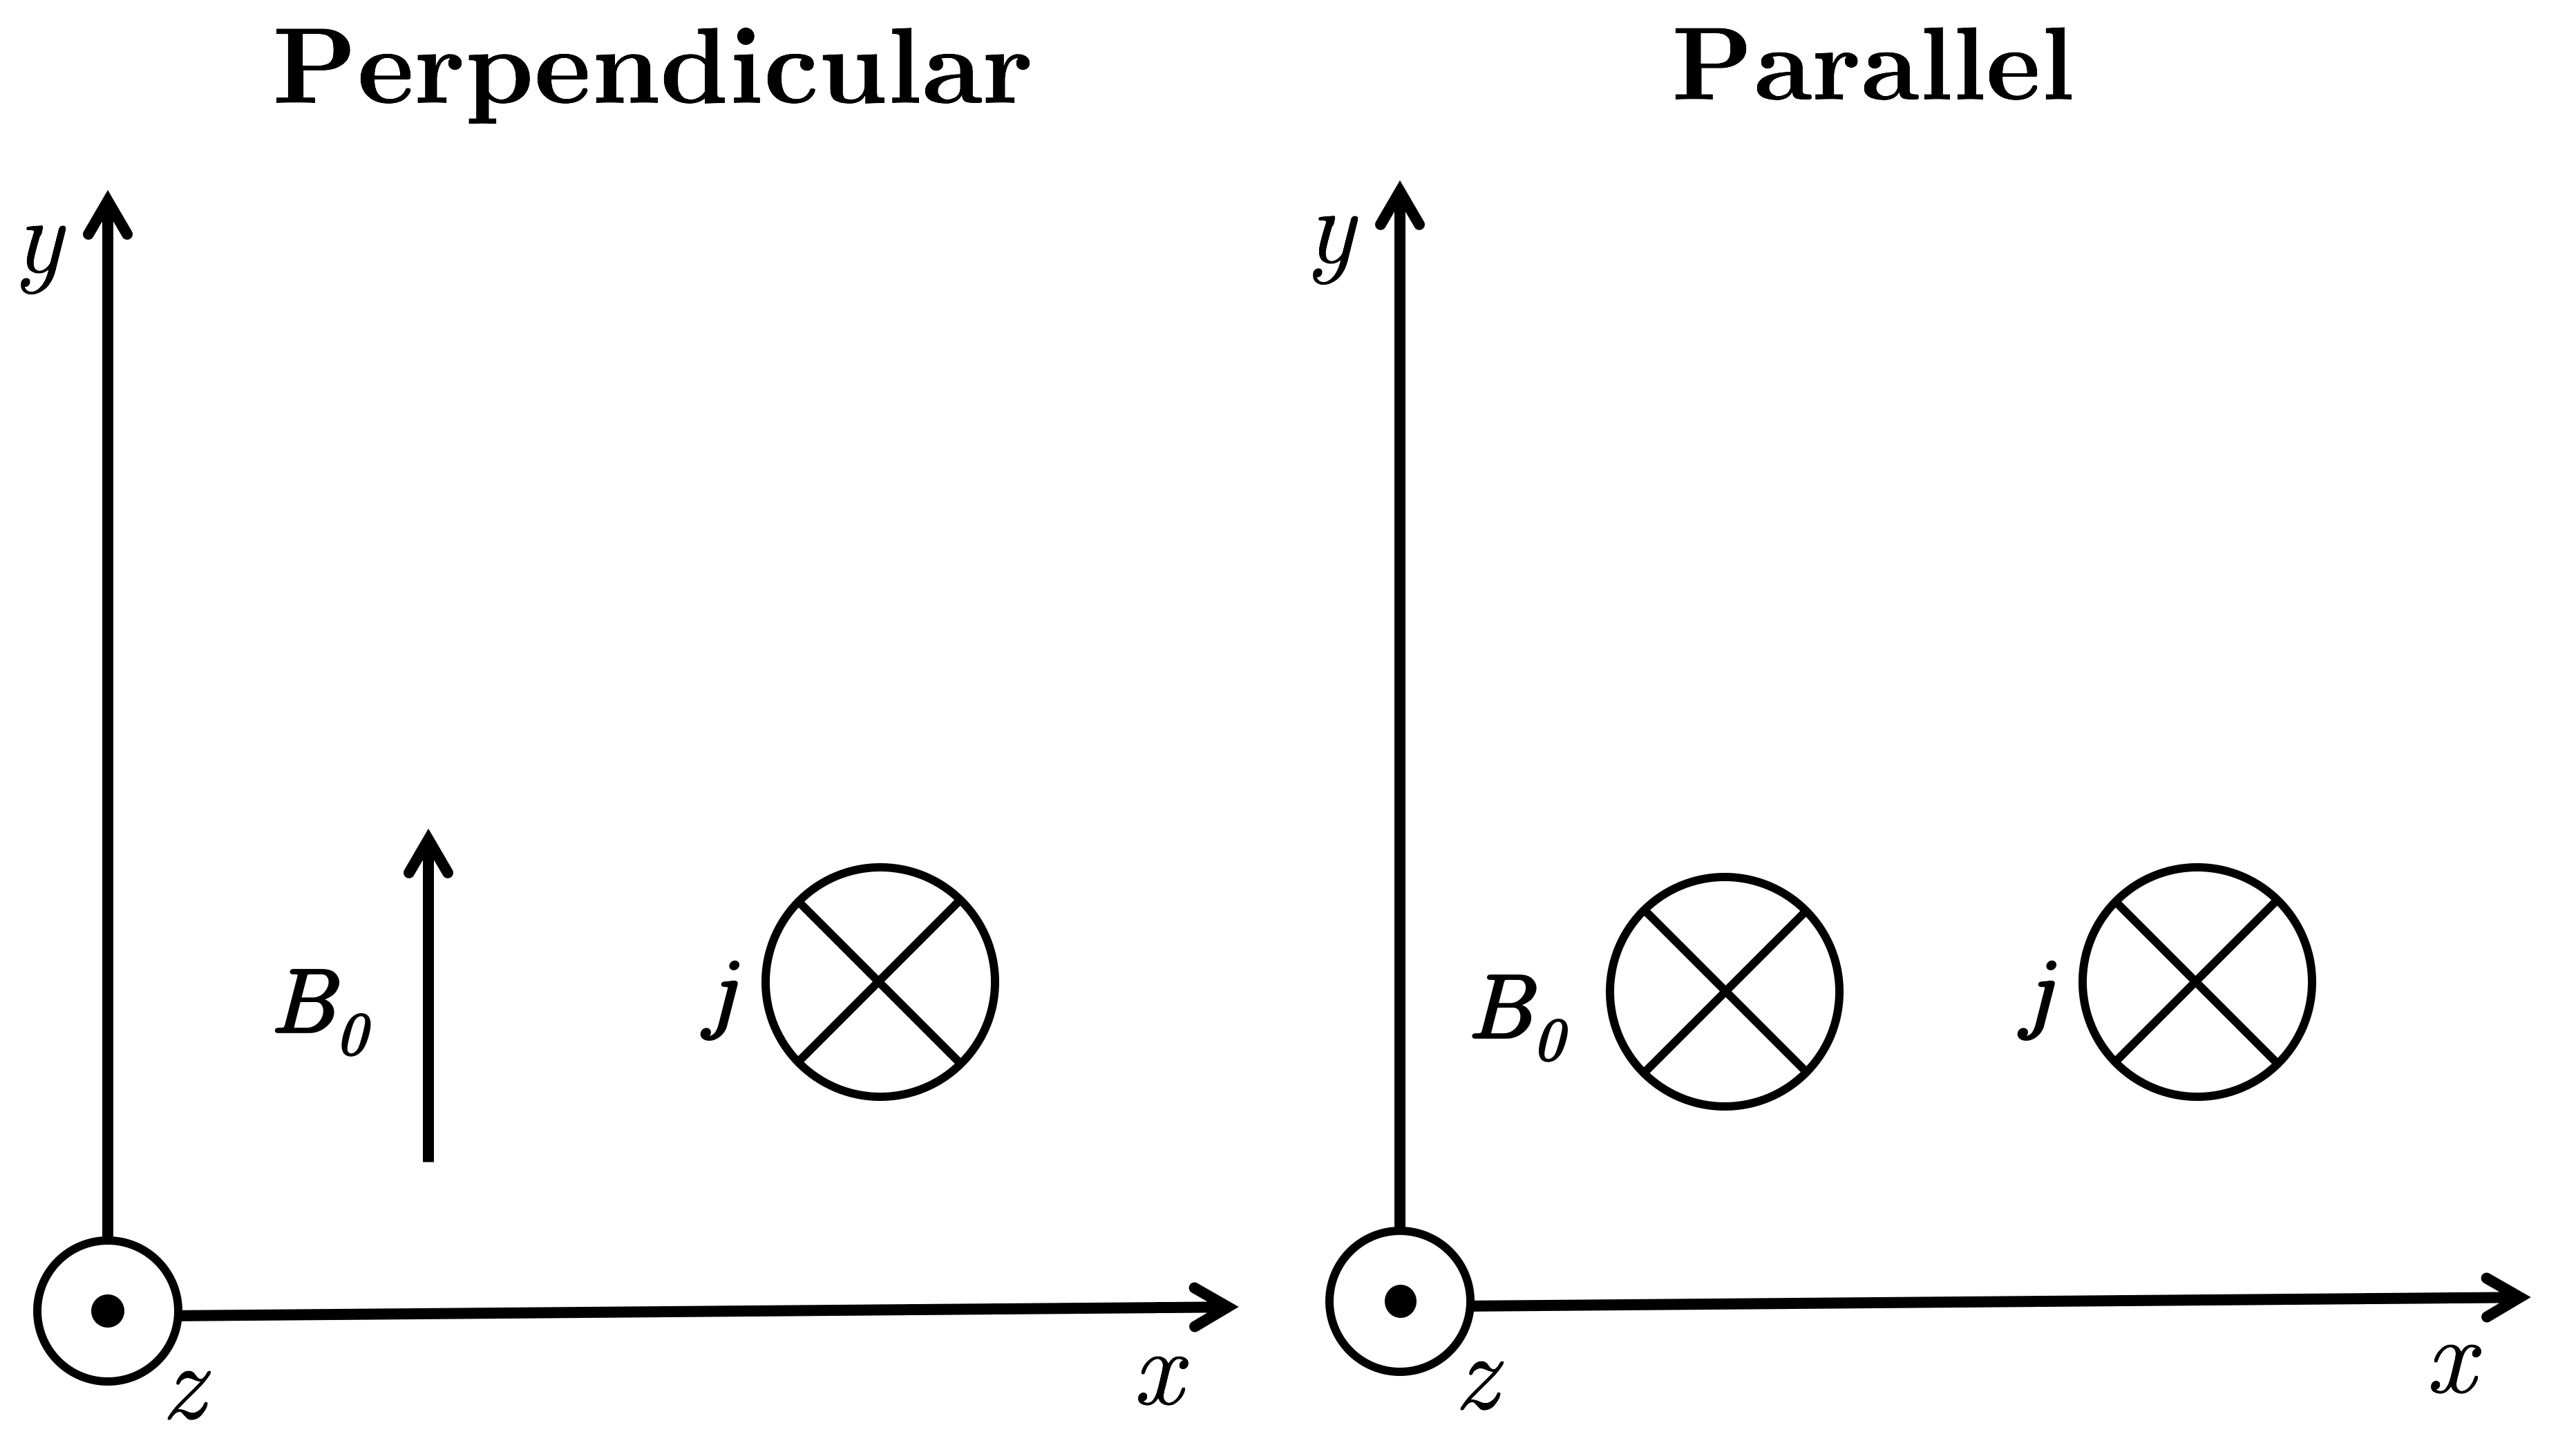
In this study, we build upon the work of Bell (2004, 2005) and Riquelme & Spitkovsky (2010, hereafter RS10), among others, by examining the linear and non-linear behaviour of the NRH instability in the case of CR currents perpendicular and parallel111Note that RS10 refer to the perpendicular and parallel configurations of the general, oblique NRH instability (Bell 2005) as the cosmic-ray current driven (CRCD) and perpendicular current driven (PCDI) instabilities. to the initial magnetic field. The initial setup of the current and magnetic field for the two configurations is shown in Fig 1 and is discussed further in section 3. The paper is structured as follows. First, in section 2 we review the linear theory behind the NRH and give the dispersion relations for parallel and perpendicular configurations. In section 3, we present our 2D and 3D MHD simulations and examine the growth of the instability in both cases. We also compare the results to earlier work on the NRH instability. In section 4, we introduce some simple models for the turbulence in order to elucidate the plasma physics, which we use to explore the cause of the transition to the non-linear regime and provide a summary of the main physical aspects of the NRH instability. We discuss the overall implications of our work for CR acceleration in section 5, before concluding in section 6. We use SI units such that equations include , but adopt natural dimensionless units (i.e. ) for our simulations.
2 Linear Theory
In ideal MHD, a fluid is described by the magnetic field, , the density, , the pressure, , and the local plasma velocity, . To define our problem, we also introduce a CR current, , which is carried by CRs with number density and charge . This CR current induces an opposite return current of magnitude in the plasma; the turbulence is then driven by a force. For quasineutrality, the background plasma must also carry a charge density . The velocity associated with the CR current depends on the geometry of the shock and the manner in which the CRs drift in the vicinity of the shock front. The parallel shock case is described by Bell (2004, 2005), and focuses on the upstream restframe, in which the CRs have a drift velocity equal to the shock speed, , giving . In this study, we also focus on both the downstream and upstream regions in a perpendicular shock; the application of the simulations to the actual shock regions is described in section 5. In both the upstream and downstream regions, CRs drift perpendicular to both the shock normal and the magnetic field with a velocity , such that . CR currents are expected to exist both sides of a perpendicular shock boundary (Bell et al. 2011). A schematic showing the relative CR current and magnetic field configurations for both parallel and perpendicular shocks is shown in Fig. 1.
In both parallel and perpendicular cases, we assume that the size of the MHD box is much smaller than the CR Larmor radius, and we can thus treat the CRs using a constant current density . This means the basic MHD formalism is the same regardless of geometry and allows a completely general dispersion relation to be derived. We thus write down the normal MHD equations in the upstream rest frame, but with an extra term in the momentum equation to include the interaction of the CR current with the plasma:
| (2) | ||||
These are the equations solved in our MHD simulations presented in the next section. Although the electric force term, , can be important at low CR energies, it is small when the CR driving the instability have energies much greater than the thermal energies (Bell 2004), so is neglected hereafter (see also section 5.1). If we now separate each physical variable into a homogenous component, , plus a perturbation, , we have , and . The zeroth-order velocity is time-dependent meaning the plasma will, in general, be subject to homogenous acceleration such that
| (3) |
This requires that the simulations are conducted in a non-inertial frame when this acceleration is non-zero (see section 3). The first order MHD equations are
| (4) | ||||
where we also define the sound speed . In the parallel case, the term can be eliminated from the above equations but this is not the case for .
Bell (2004) showed that a strong instability is driven by the terms in the above equations. The dispersion relation governing the growth of this instability can be derived by solving for in the equations 4, before searching for wave-like solutions with growth rate . This gives (Bell 2005)
| (5) |
where , is the wavenumber, is the Alfvén speed, is the sound speed and hats denote unit vectors. Up to this point the analysis is general and independent of the orientation of and . Rather than treat the general, oblique NRH instability we now consider two cases: (i) the case when and are parallel, and (ii) the case when and are perpendicular. In both these cases, the fastest growth occurs in modes with wavevector parallel to , so we focus on these wavenumbers to derive the dispersion relations.
In the parallel case (), the dispersion relation then reduces to (Bell 2005)
| (6) |
Here, the two solutions are sound waves parallel to , and Alfvén-like transverse modes modulated by the magnetic tension. These transverse modes are purely growing if ; for larger the Alfvén term starts to dominate and the modes are oscillatory (Bell 2004). At small the wavelength becomes comparable to the Larmor radius of the CRs, meaning they spiral along field lines and are inefficient in driving waves. It can be shown that the maximum growth rate occurs at wavenumber , which means the maximum growth rate is then
| (7) |
as found by Bell (2004). In the perpendicular case, the dispersion relation differs and is given by
| (8) |
as also found by RS10. Here, the solutions are either Alfvén waves, or compressional modes modulated by magnetic tension, magnetic pressure and thermal pressure. The same maximum growth rate can be recovered by assuming that the sound speed is equal to the Alfvén speed, which is reasonable provided the sound speed is close to the typical turbulent velocity (RS10). In this limit the maximum growth rate is again given by equation 7. The growth rate will actually decrease if increases beyond ; in other words, thermal pressure can play a crucial role.
The dispersion relations and MHD equations show that there are two crucial differences between the and limits. The first is the term in the momentum equation, which is non-zero when ; it follows that, in the perpendicular case, any physics that affects the density contrast in the plasma will also affect growth of the instability. This includes forces operating along the axis parallel to . The second is the form of the dispersion relation; the presence of a term in the non-Alfvénic solution indicates that thermal pressure can also limit the growth rate, as can magnetic tension in the field lines. Even in the cold plasma limit (), magnetic pressure gradients along the -axis can affect the growth of the instability. Furthermore, the turbulent motion induced in the plasma from the term will lead to small-scale shocks that quickly increase the pressure far beyond its initial value. This is explored further in our MHD simulations in section 3.
3 MHD simulations in 2D and 3D
To study the linear and non-linear behaviour of the instability, we conduct MHD simulations using the code mh3d (Lucek & Bell 1996, 1997, 2000; Bell & Lucek 2001; Bell 2004). mh3d is a 3-dimensional, Eulerian ideal MHD code that treats CRs as described in section 2, so that they are not collisionally connected to the plasma and only influence the dynamics through the return current that they induce, present in the MHD equations as . The magnitude of is constant and we adopt the convention of always orienting it along the negative axis in our simulations, as shown in Fig. 1. The energy equation is adiabatic, with , though we include viscous heating such that kinetic energy can be converted to thermal energy in shocks. We have also adapted the code so it can be used in 2D, so as to reproduce the results of RS10 and see if considering the problem in 3D significantly affects the behaviour of the plasma. In 3D, the code is parallelised using OpenMPI (Gabriel et al. 2004) in slices along the direction, whereas in 2D it is parallelised in slices along the direction.
3.1 Simulation setup
The plasma is initialised with a uniform magnetic field of strength oriented in either the or direction, which correspond to the and situations, respectively. The plasma starts off at rest with a uniform density, , and pressure, , and is placed in a non-inertial frame moving at velocity . The boundary conditions are periodic, as in Bell (2004) and RS10. The magnetic field in the fluid is perturbed by taking the curl of a random number vector potential, then normalising the amplitude of the fluctuations to . The normalisation constraints are in 3D and in 2D, where is the total number of grid cells. This ensures that the initial and components of the field have equal average magnitudes in 2D and 3D, but the initial magnetic energy density, , and total magnitude, , do not. However, our overall results are fairly insensitive to the starting value of due to the rapid growth of the instability.
It is clear from the above MHD equations that, for a given random number seed and initial distribution of perturbation wavenumbers, , the physical evolution of the instability is governed only by the relative orientation of and , and by the relative values of the scalars , , , and . The values of these quantities for our fiducial models are shown in Table 1; they are based on the simulations presented by Bell (2004). We specify whether the run in question was carried out in 2D or 3D and give the grid size in each case. We adopt a grid spacing of and a minimum density, , to prevent and the time step, , tending to zero. We have tested the sensitivity of our results to the adopted values of , and and verified that neither the inferred growth rate nor the general character of the instability is affected. Our simulations also reproduce behaviour found using both fixed-current PIC (RS10) and relativistic MHD (Beresnyak & Li 2014) approaches, thereby independently verifying our results.
| Run | 2D/3D? | Configuration | Box Size | ||
|---|---|---|---|---|---|
| run2D | 2D | 1 | 0.1 | ||
| run3Da | 3D | 1 | 0.1 | ||
| run3Db | 3D | 1 | 0.1 |
3.2 Simulation results
Fig. 2 shows the magnetic field strength in an slice as a function of time, from the 2D and 3D simulations. We find that the magnetic field grows exponentially from its initial seed value in both cases. Although there is a uniform density at first, the perturbed force immediately causes density fluctuations to emerge. This can be seen in the slices of density shown, again for 2D and 3D, in Fig. 3, and is also the reason for the small initial decrease in magnetic field strength. The force then causes differential acceleration across the grid, with the result that overdense regions lag behind underdense regions. The enhances the density fluctuations and drives the instability. Loops of high density and high magnetic field then expand exponentially, enveloping other loops and causing both the scale size and energy associated with the turbulence to grow.
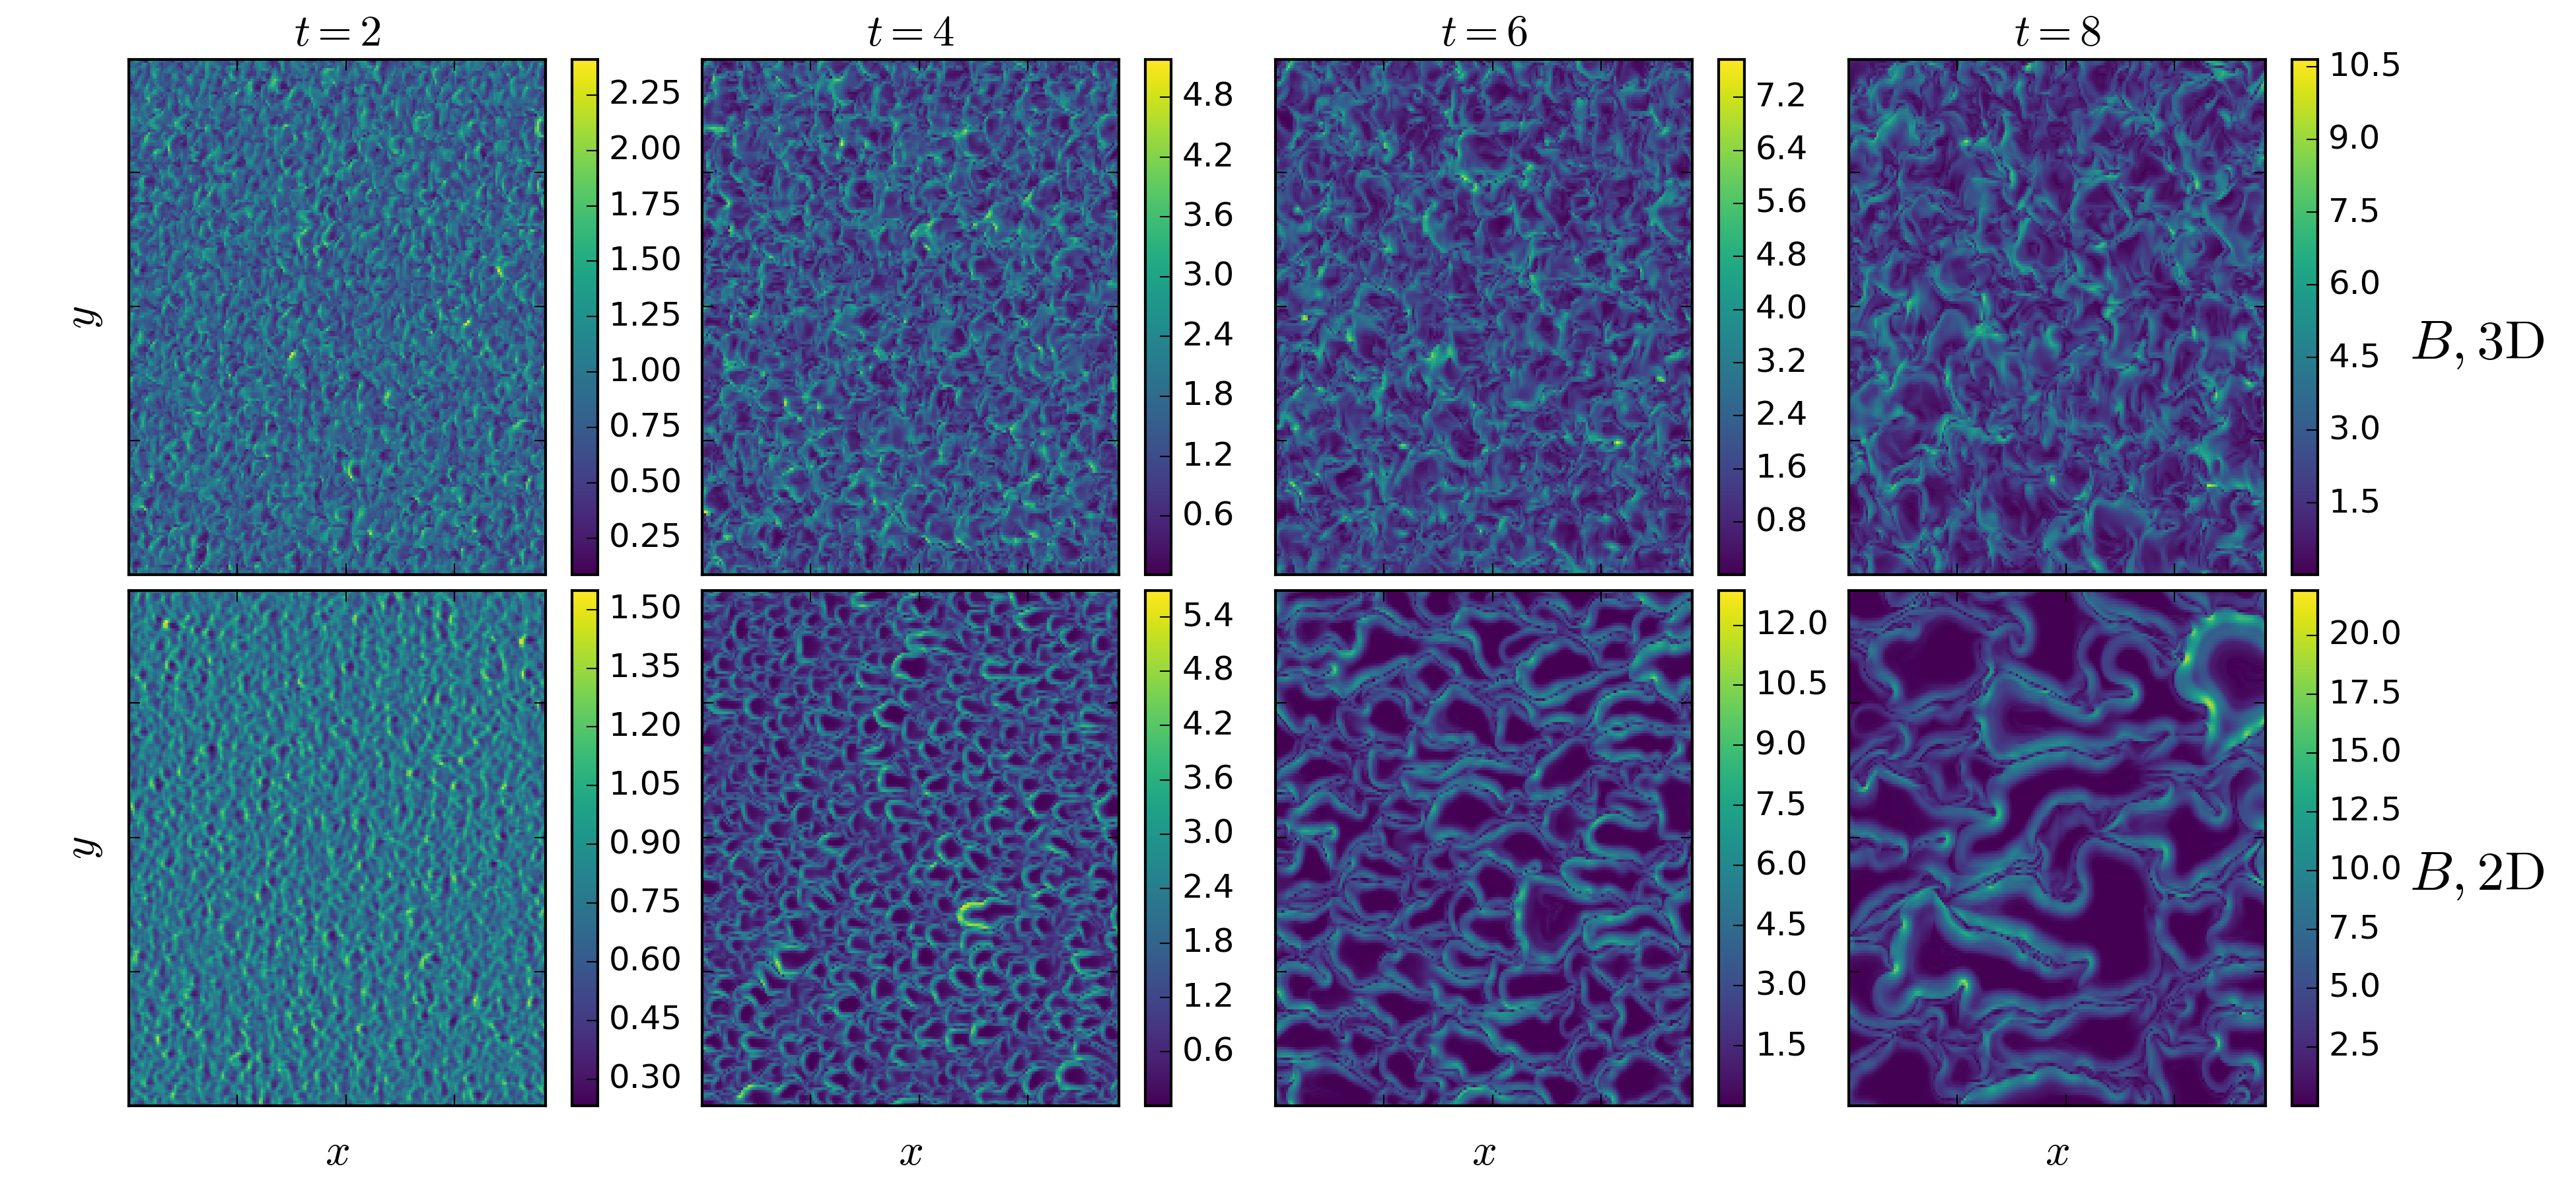
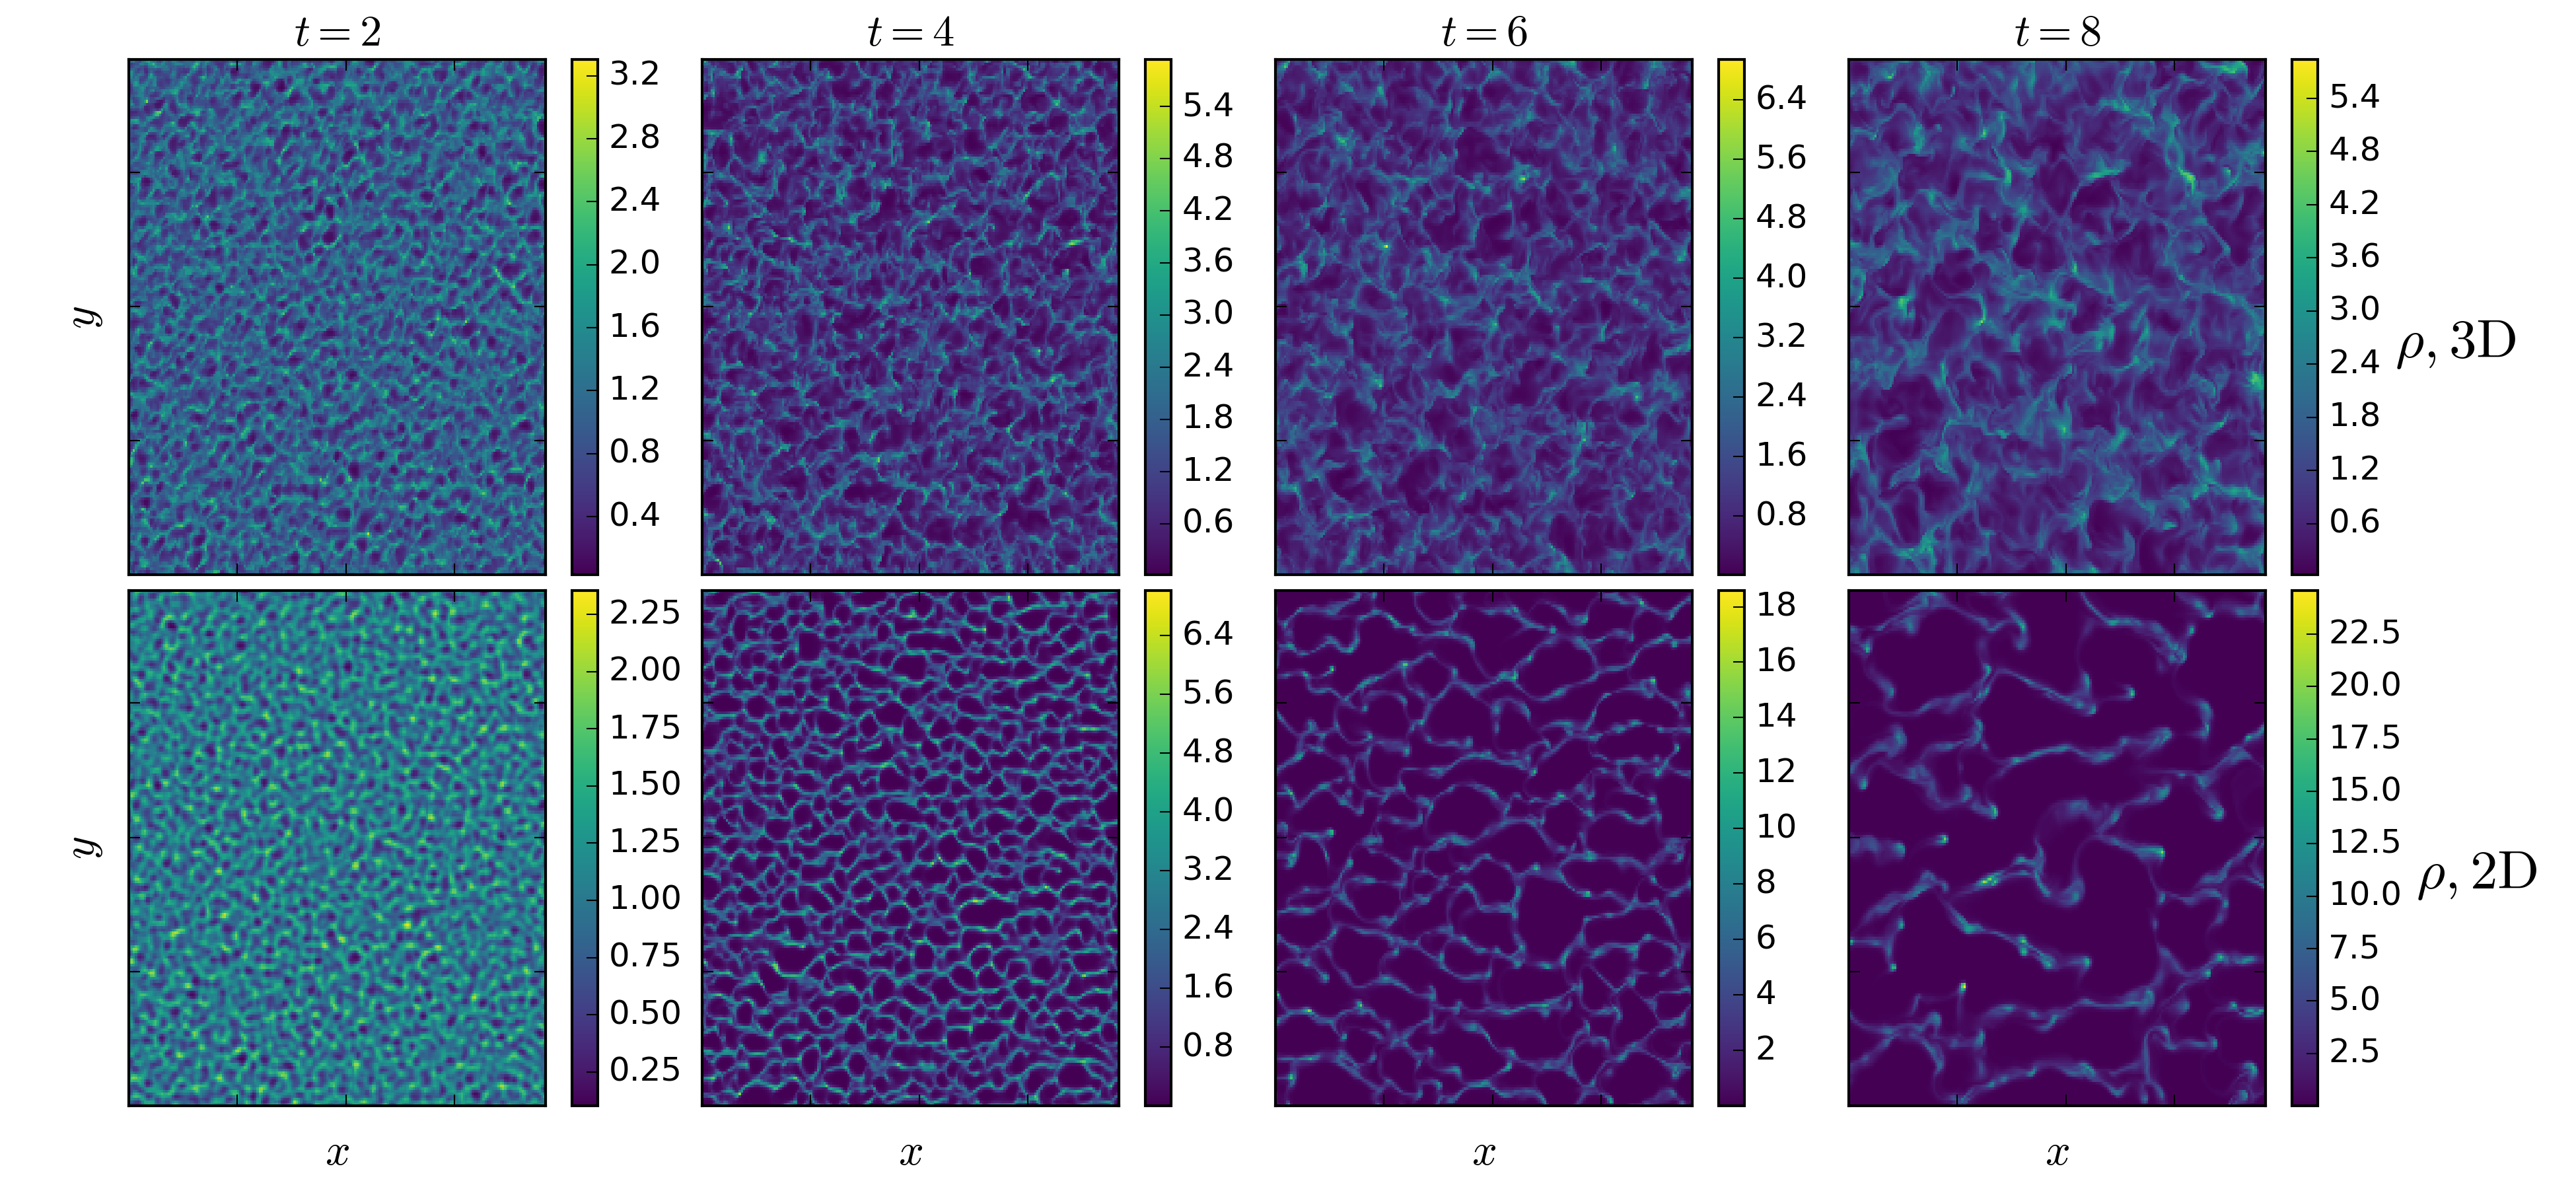
In 2D, our simulations mirror the behaviour found by RS10. We observe a similar anisotropy to the turbulence, which can be understood in terms of the first-order momentum equation (equations 4; see also fig. 2 of RS10). The force acts to stretch out field lines along the axis, so larger values of tend to enhance the anisotropy seen in Fig. 2. In contrast, the force acts to stretch the loops of magnetic field in all directions. Thus, in general, the anisotropy to the turbulence increases with the ratio of to ; the more ordered the field, the more there is a preferred direction to the turbulence. As the perturbed field grows, the structure becomes more loop-like, with a series of low-density bubbles and high-density filaments. The magnetic field lines are compressed near the edges of the expanding bubbles and the magnetic field is strongest in these locations. In 3D, the structure is similar to 2D at early times. However, even in the linear regime clear differences can be seen, namely that the density contrast is smaller in the 3D case and the distinction between bubbles and filaments is less pronounced. This is because pressure forces acting along the -axis cause the low-density bubbles to be filled in, decreasing the density contrast in between the bubbles and filaments. Furthermore, in 3D modes with wavenumber components in the -direction can also contribute to the growth of the instability.
| Field | Stage | (theory) | (2D) | (3D) |
|---|---|---|---|---|
| Linear | 0.44 | 0.45 | ||
| Non-linear | - | 0.08 | 0.07 | |
| Linear | - | 0.46 | ||
| Non-linear | - | - | 0.07 |
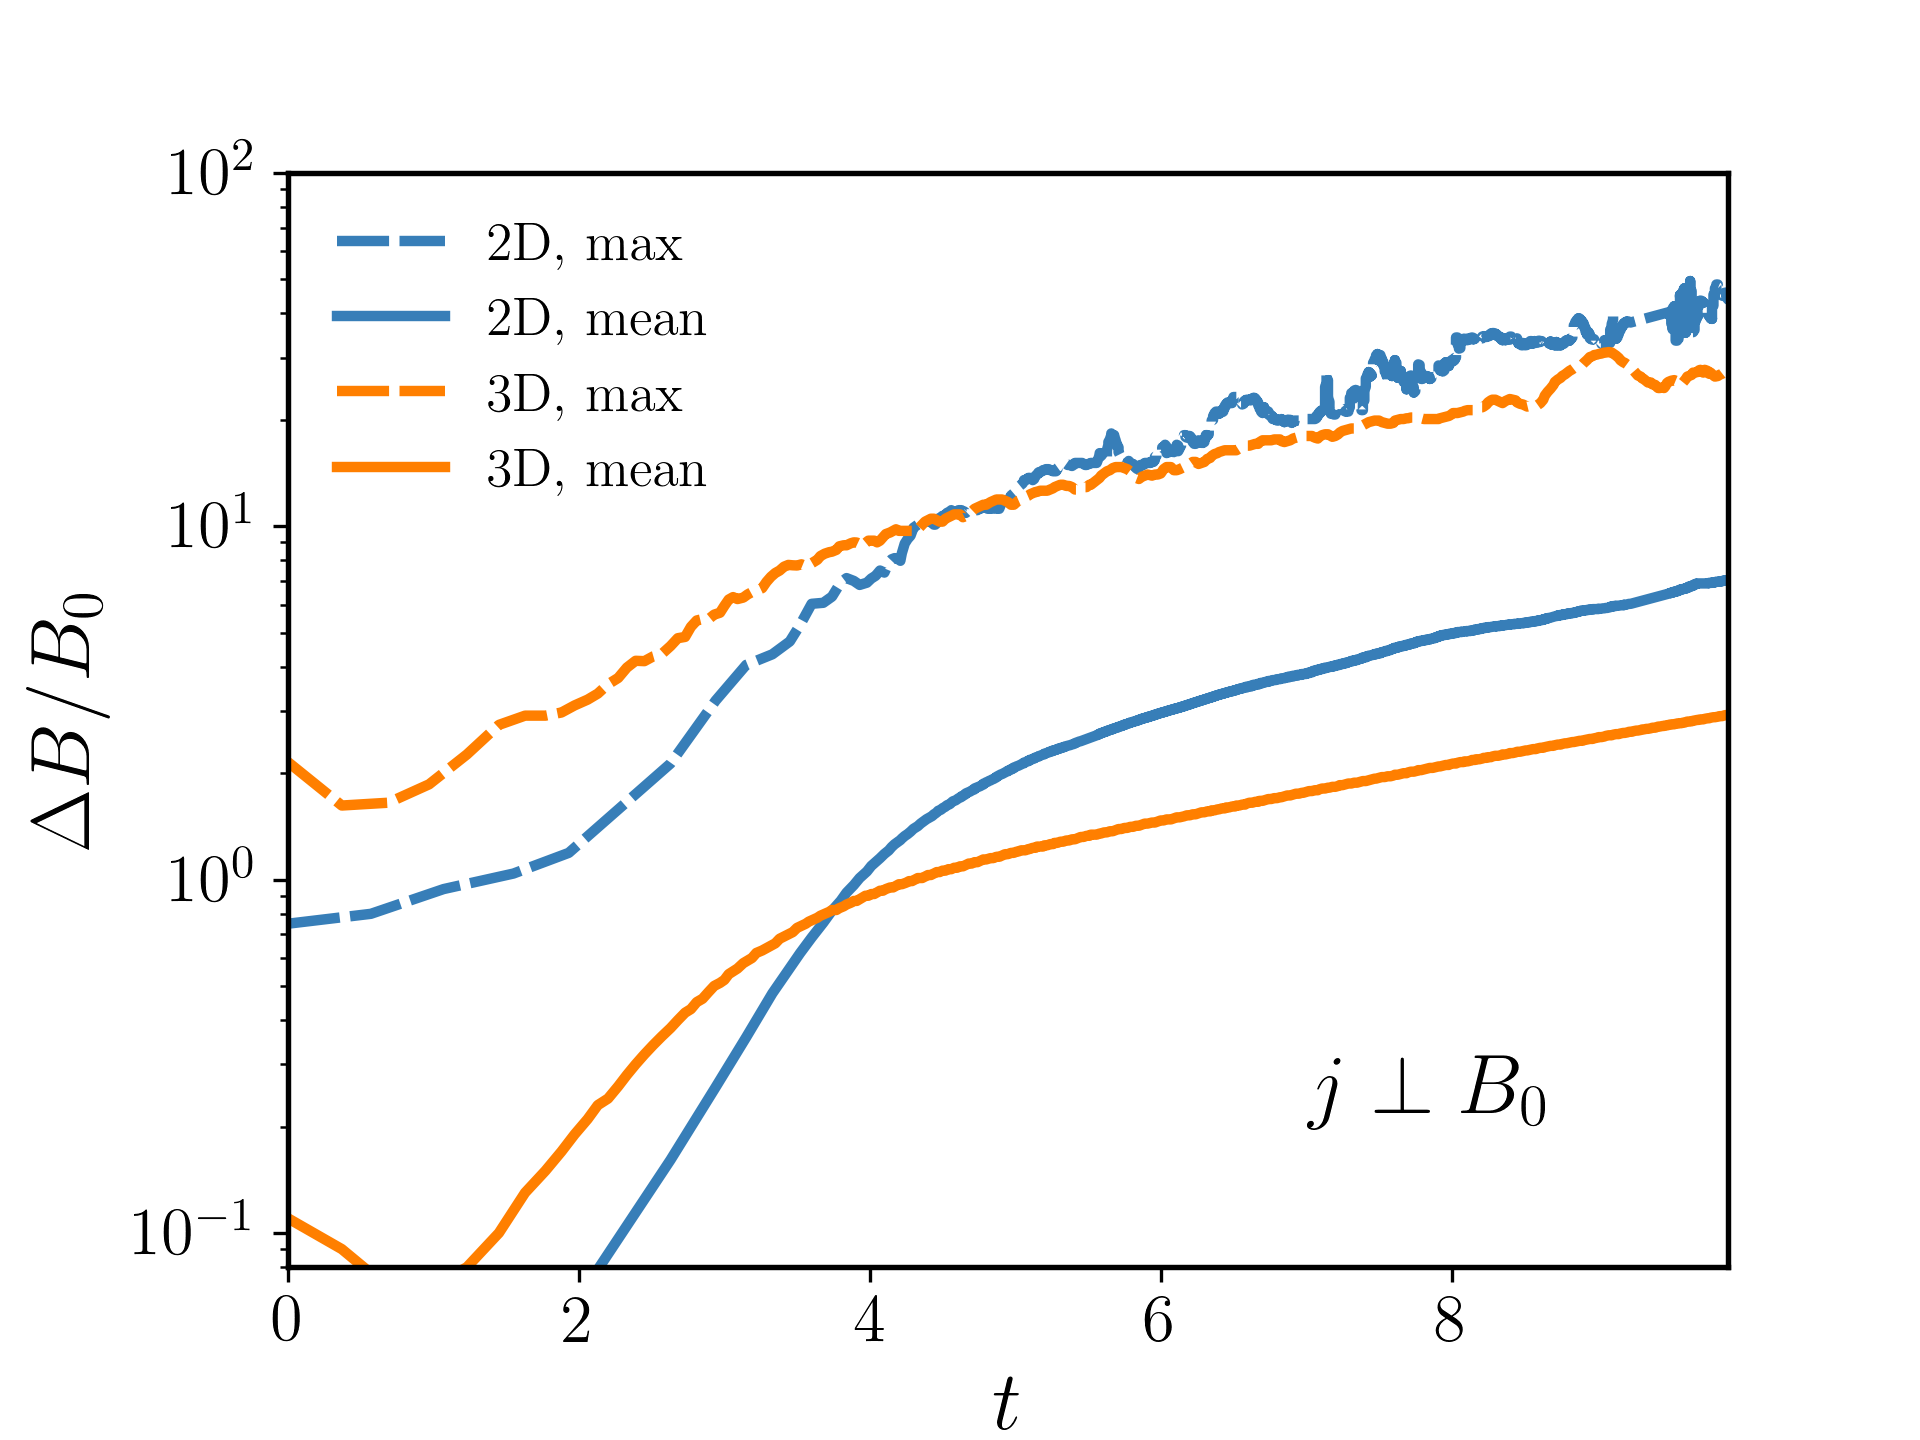
Fig. 4 shows the evolution of the mean and maximum magnetic field amplification factors, which we define as
| (9) |
and
| (10) |
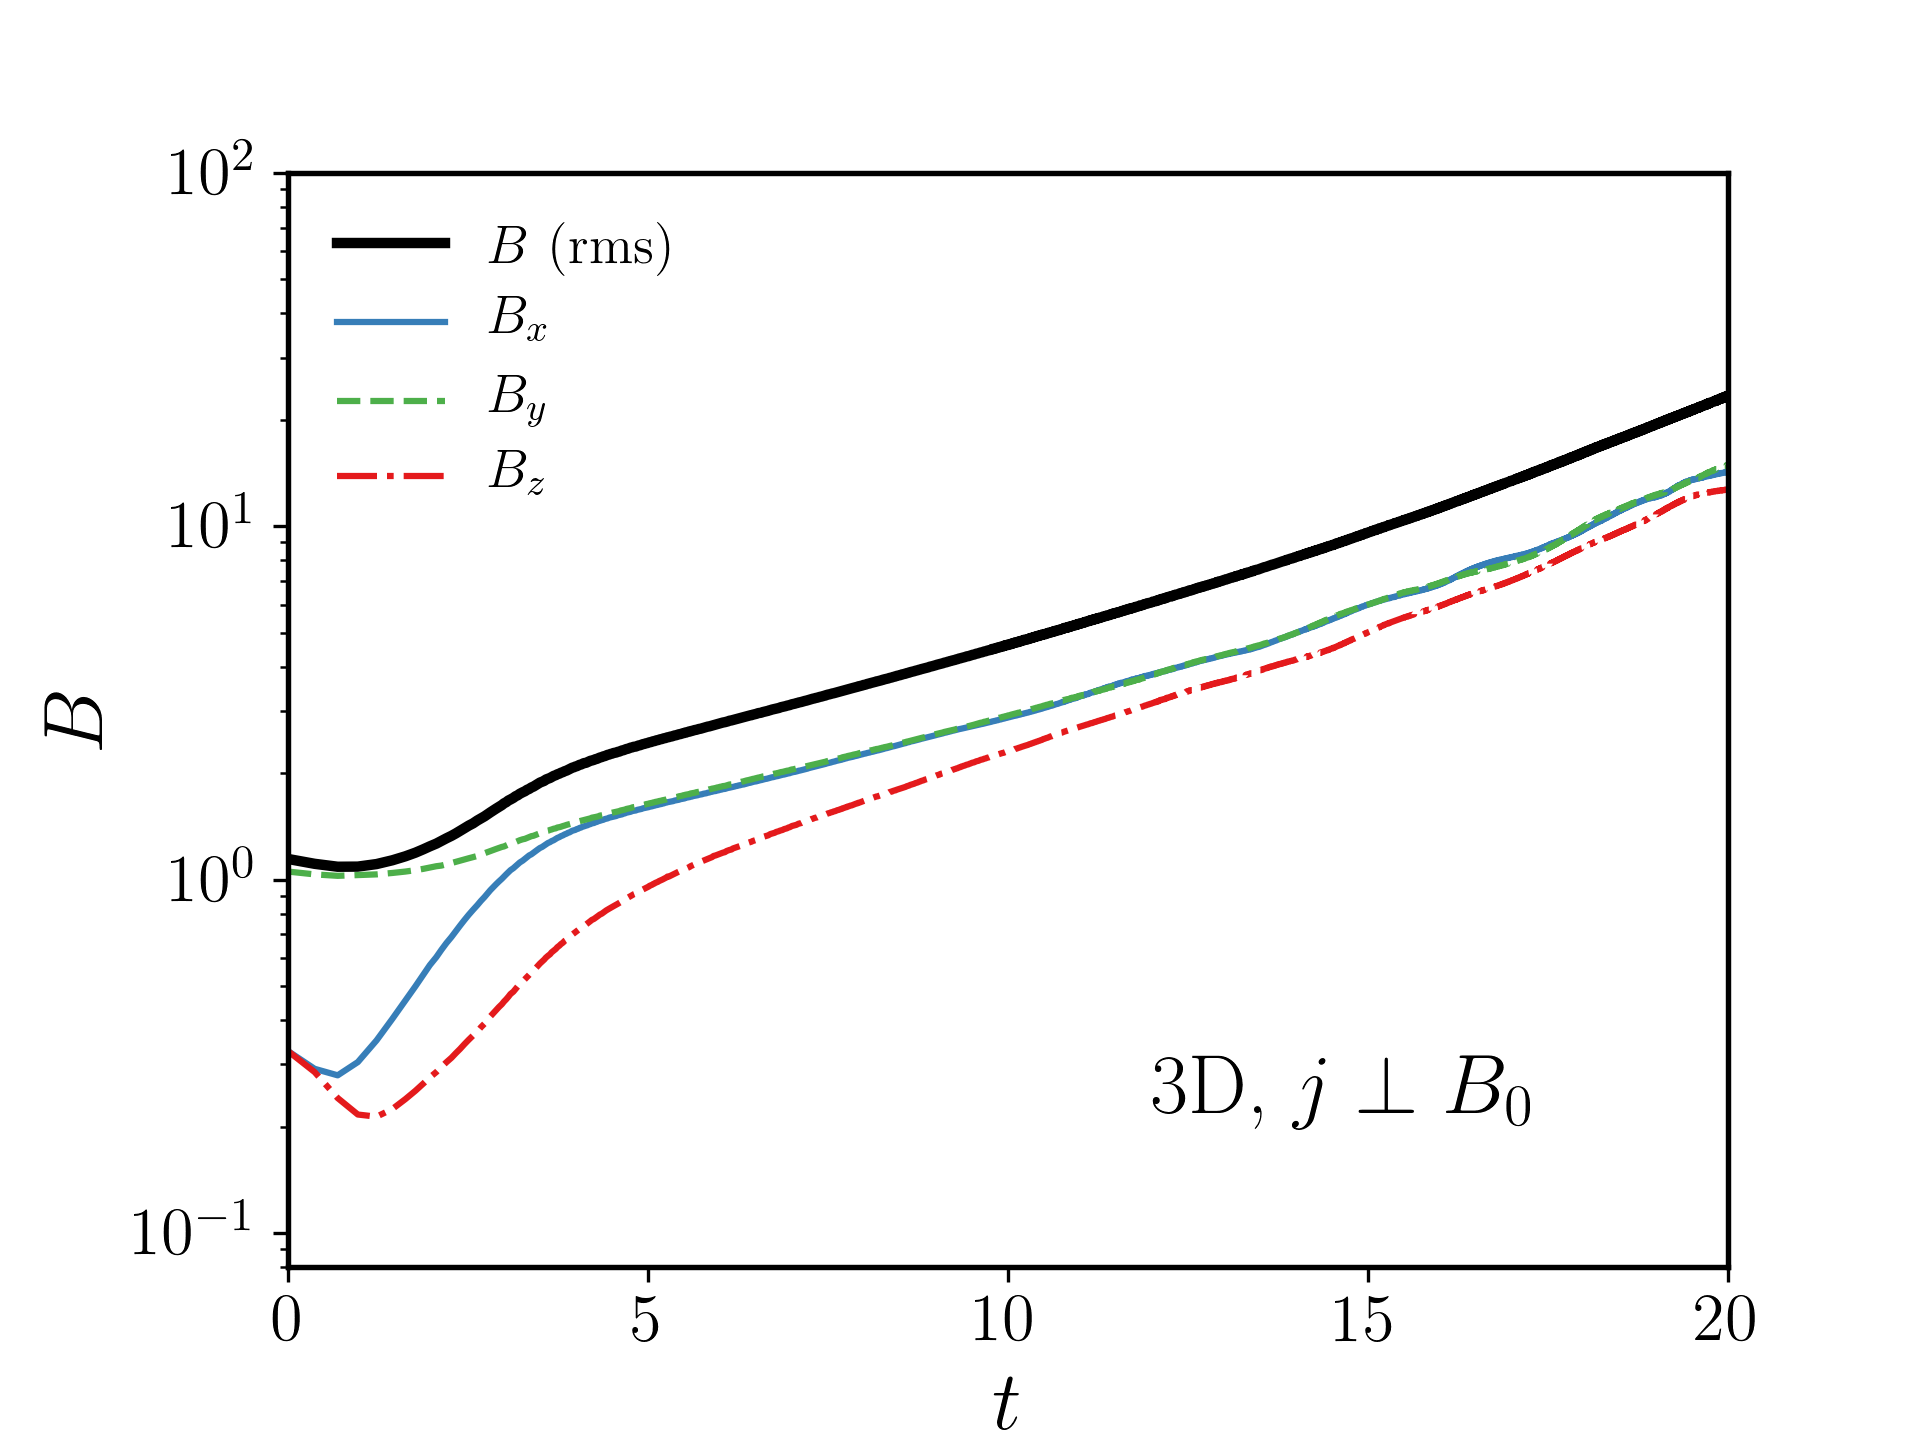
respectively, where the sum is over all cells, is a constant and is the maximum field strength in the simulation box at time . The magnetic field grows exponentially in the linear and non-linear regimes in both the 2D and 3D simulations, and the growth rate is reduced by a similar factor once the instability becomes non-linear. The linear and non-linear growth rates, and , derived from an exponential fit in the two clearly delineated regimes, are given in Table 2. The thermal and kinetic energy density in the plasma also grow exponentially, as shown in Figs. 5 and 6 where we show mean values of the various energy densities in the plasma over time, as well as the overall change in mean internal energy density, . We also show the magnetic field strength over time for the 3D simulation in Fig. 7, as well as the rms values of the components along each axis of the simulation box. Amplification continues to late times, with , and the , and components converge to similar values.
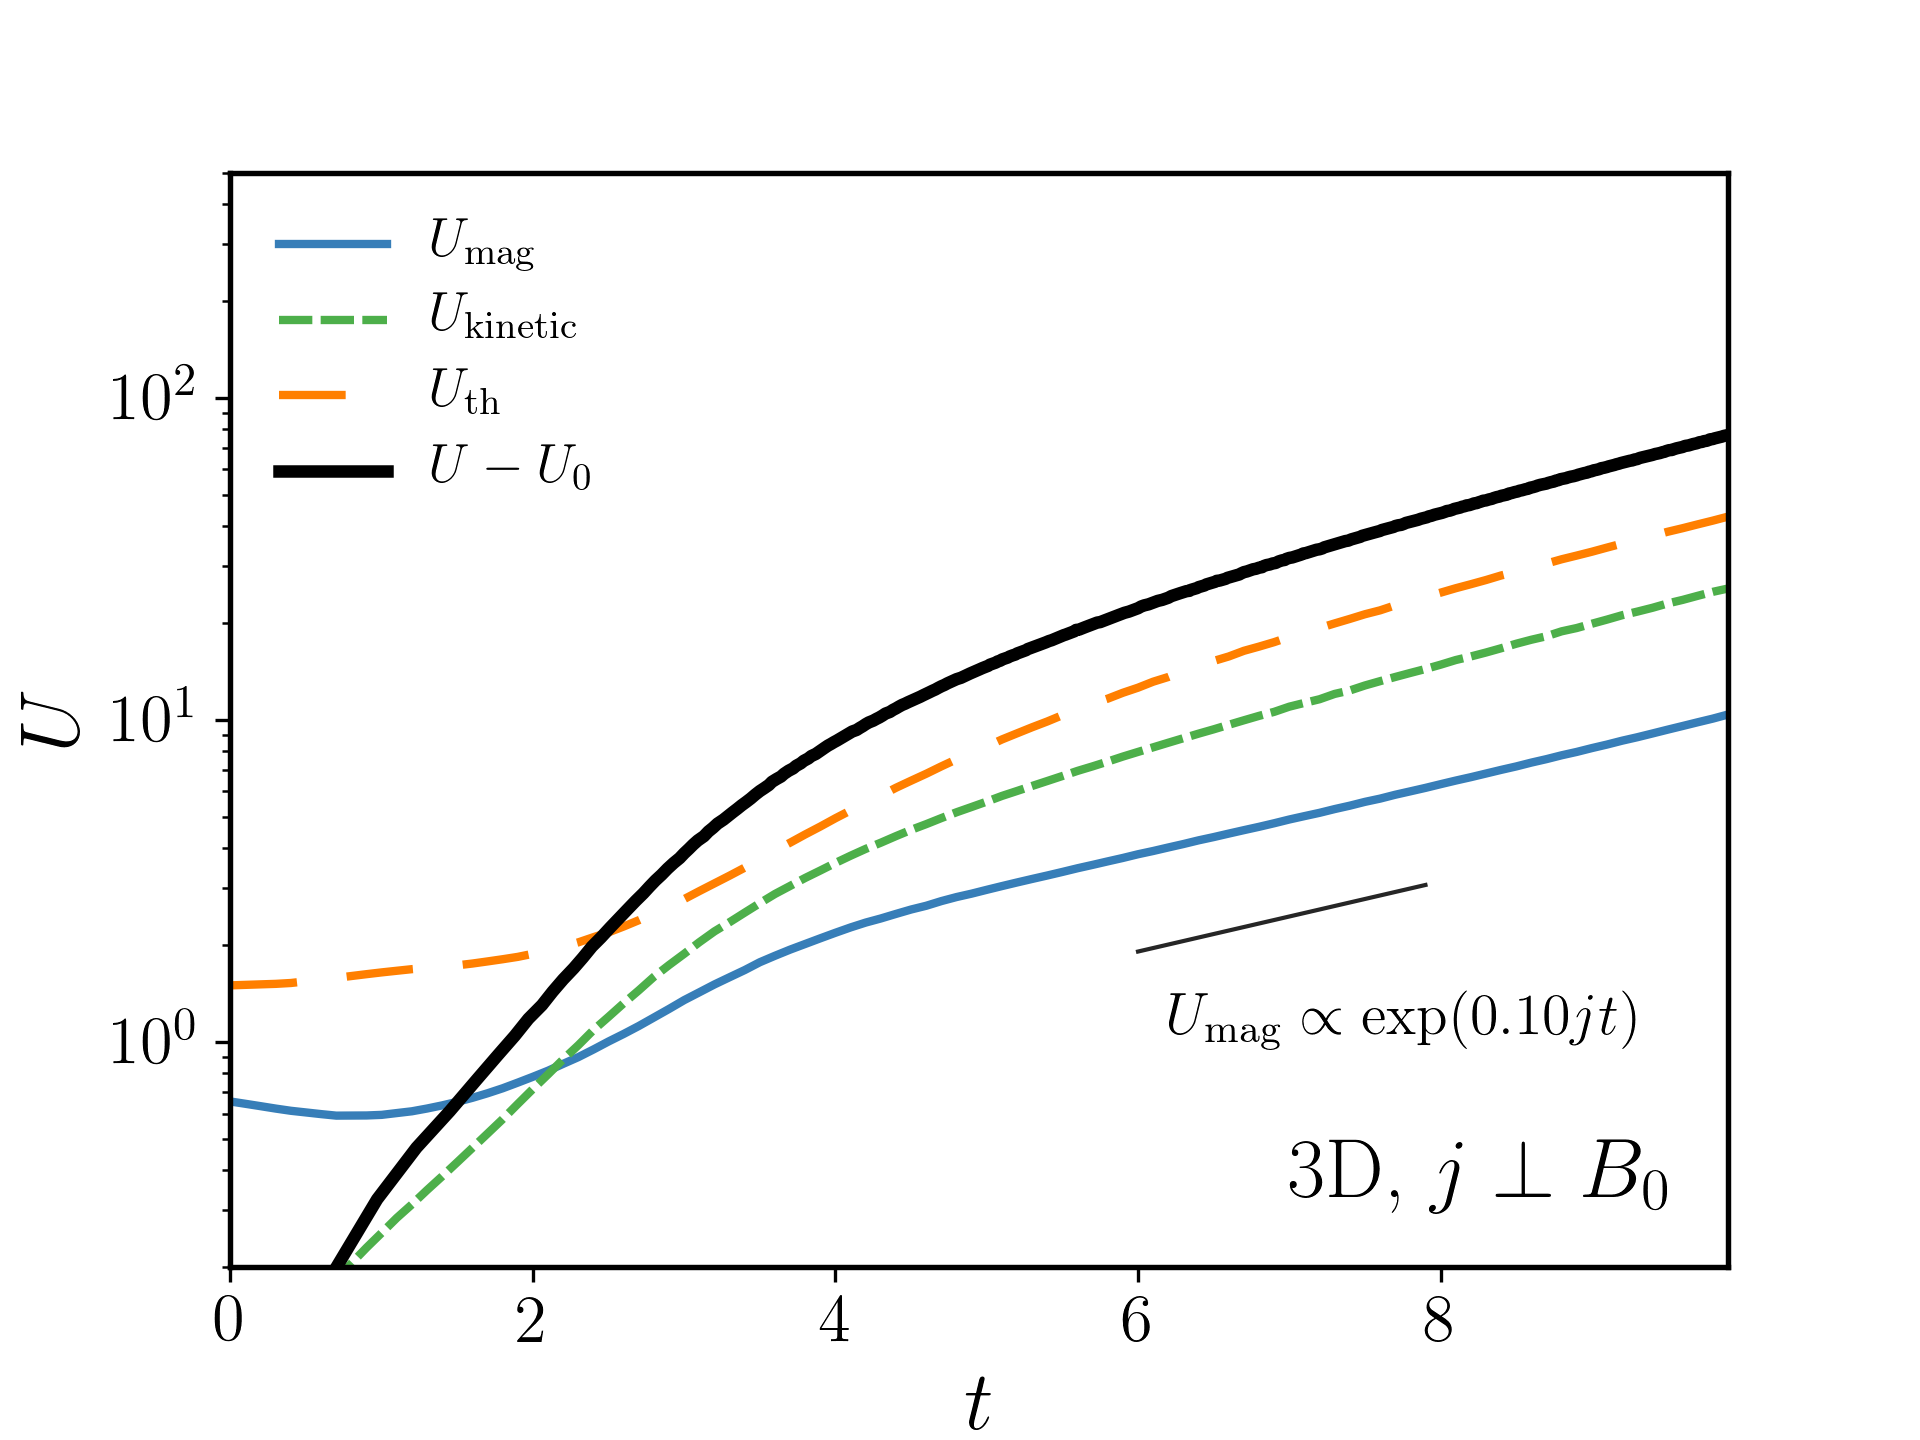
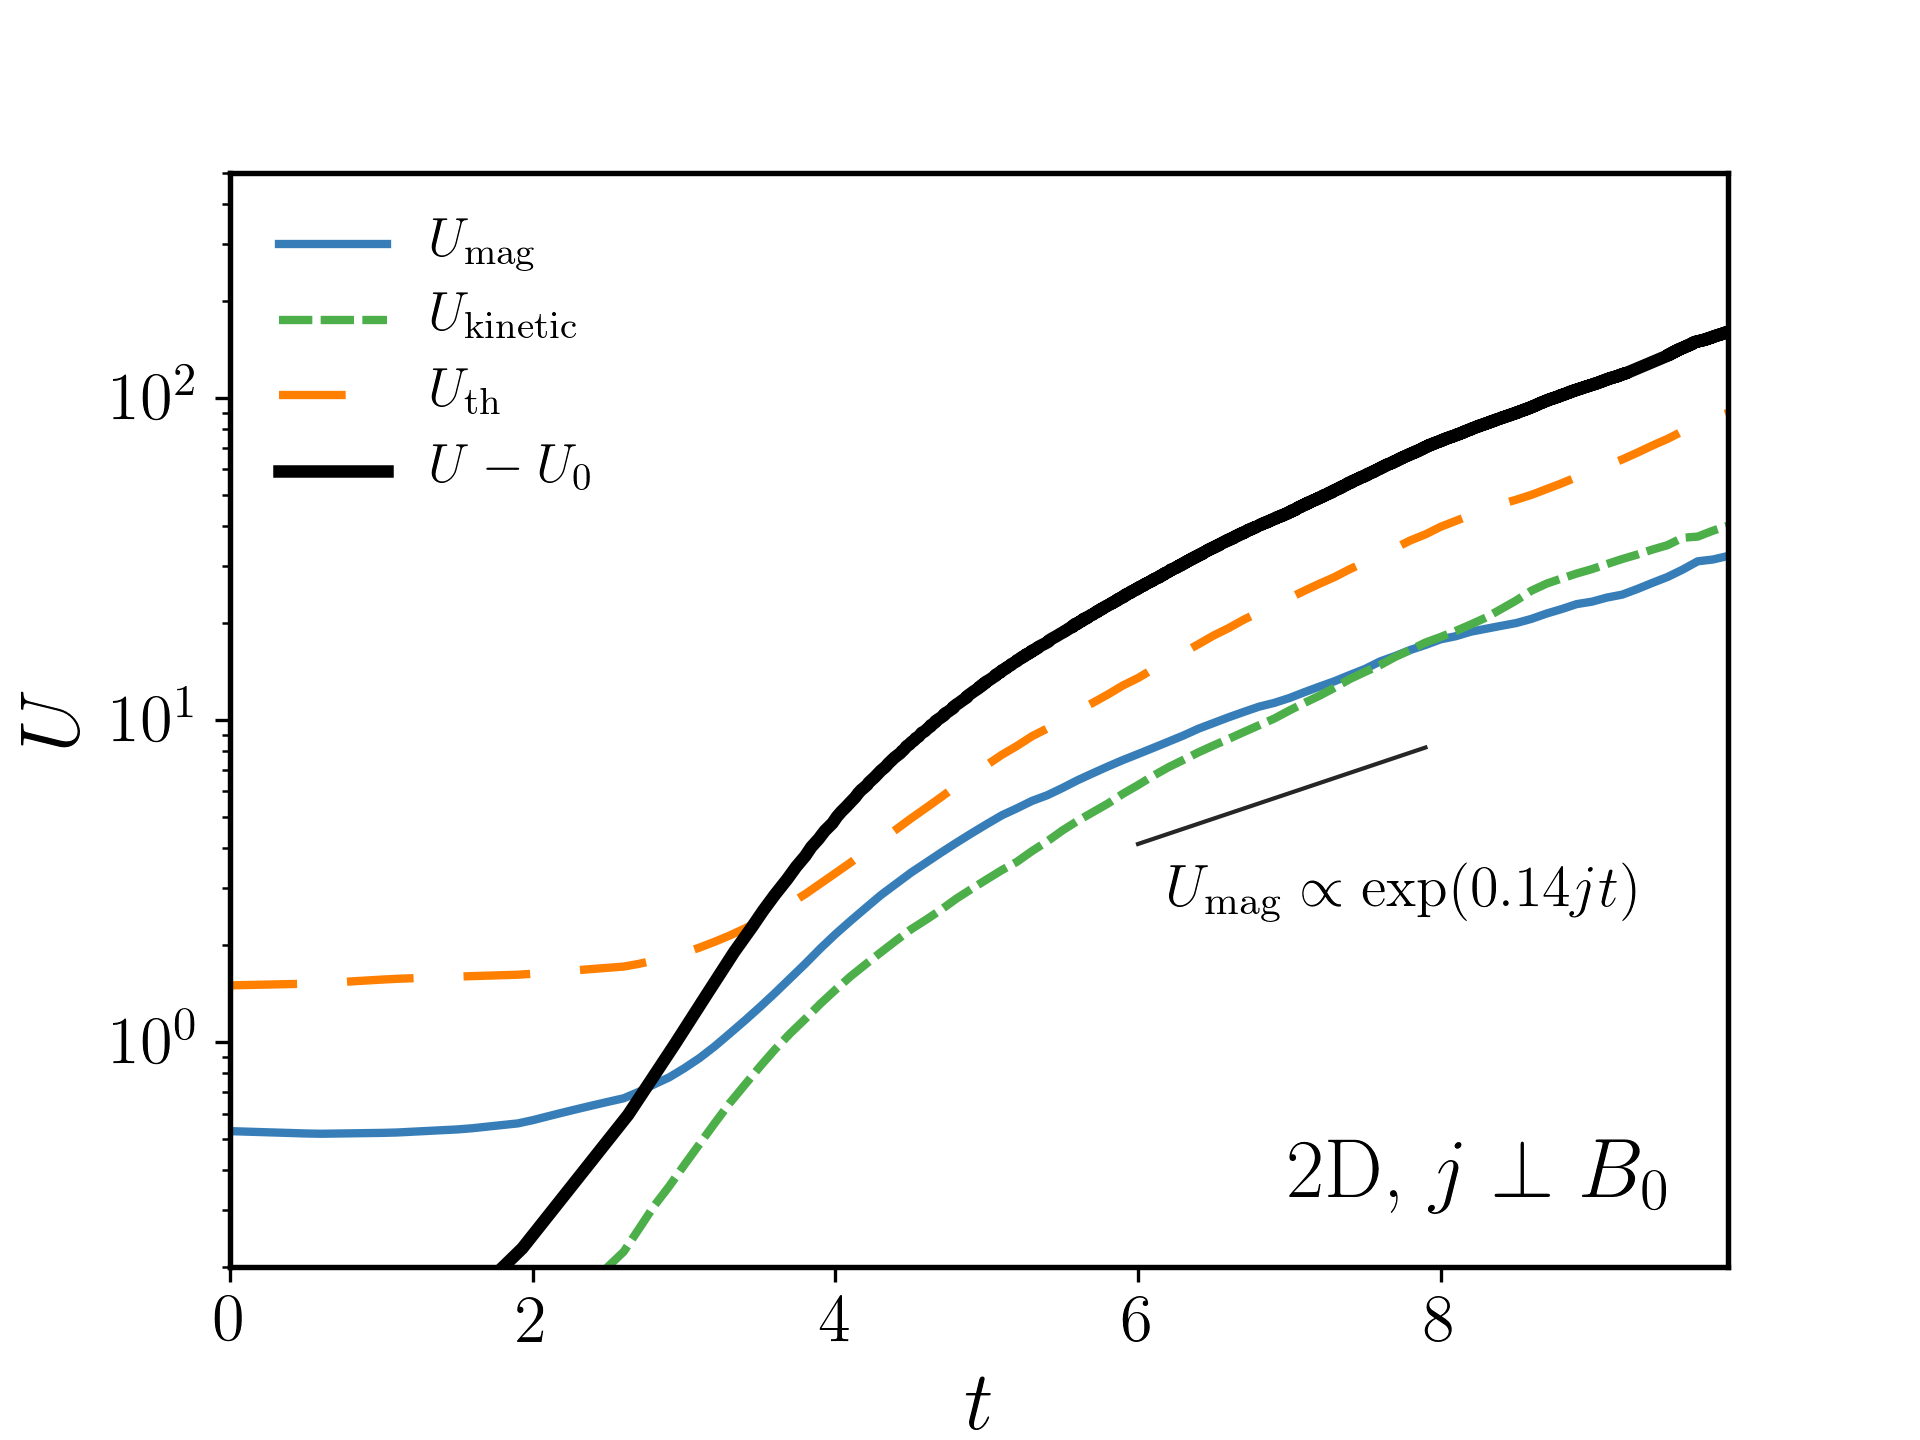
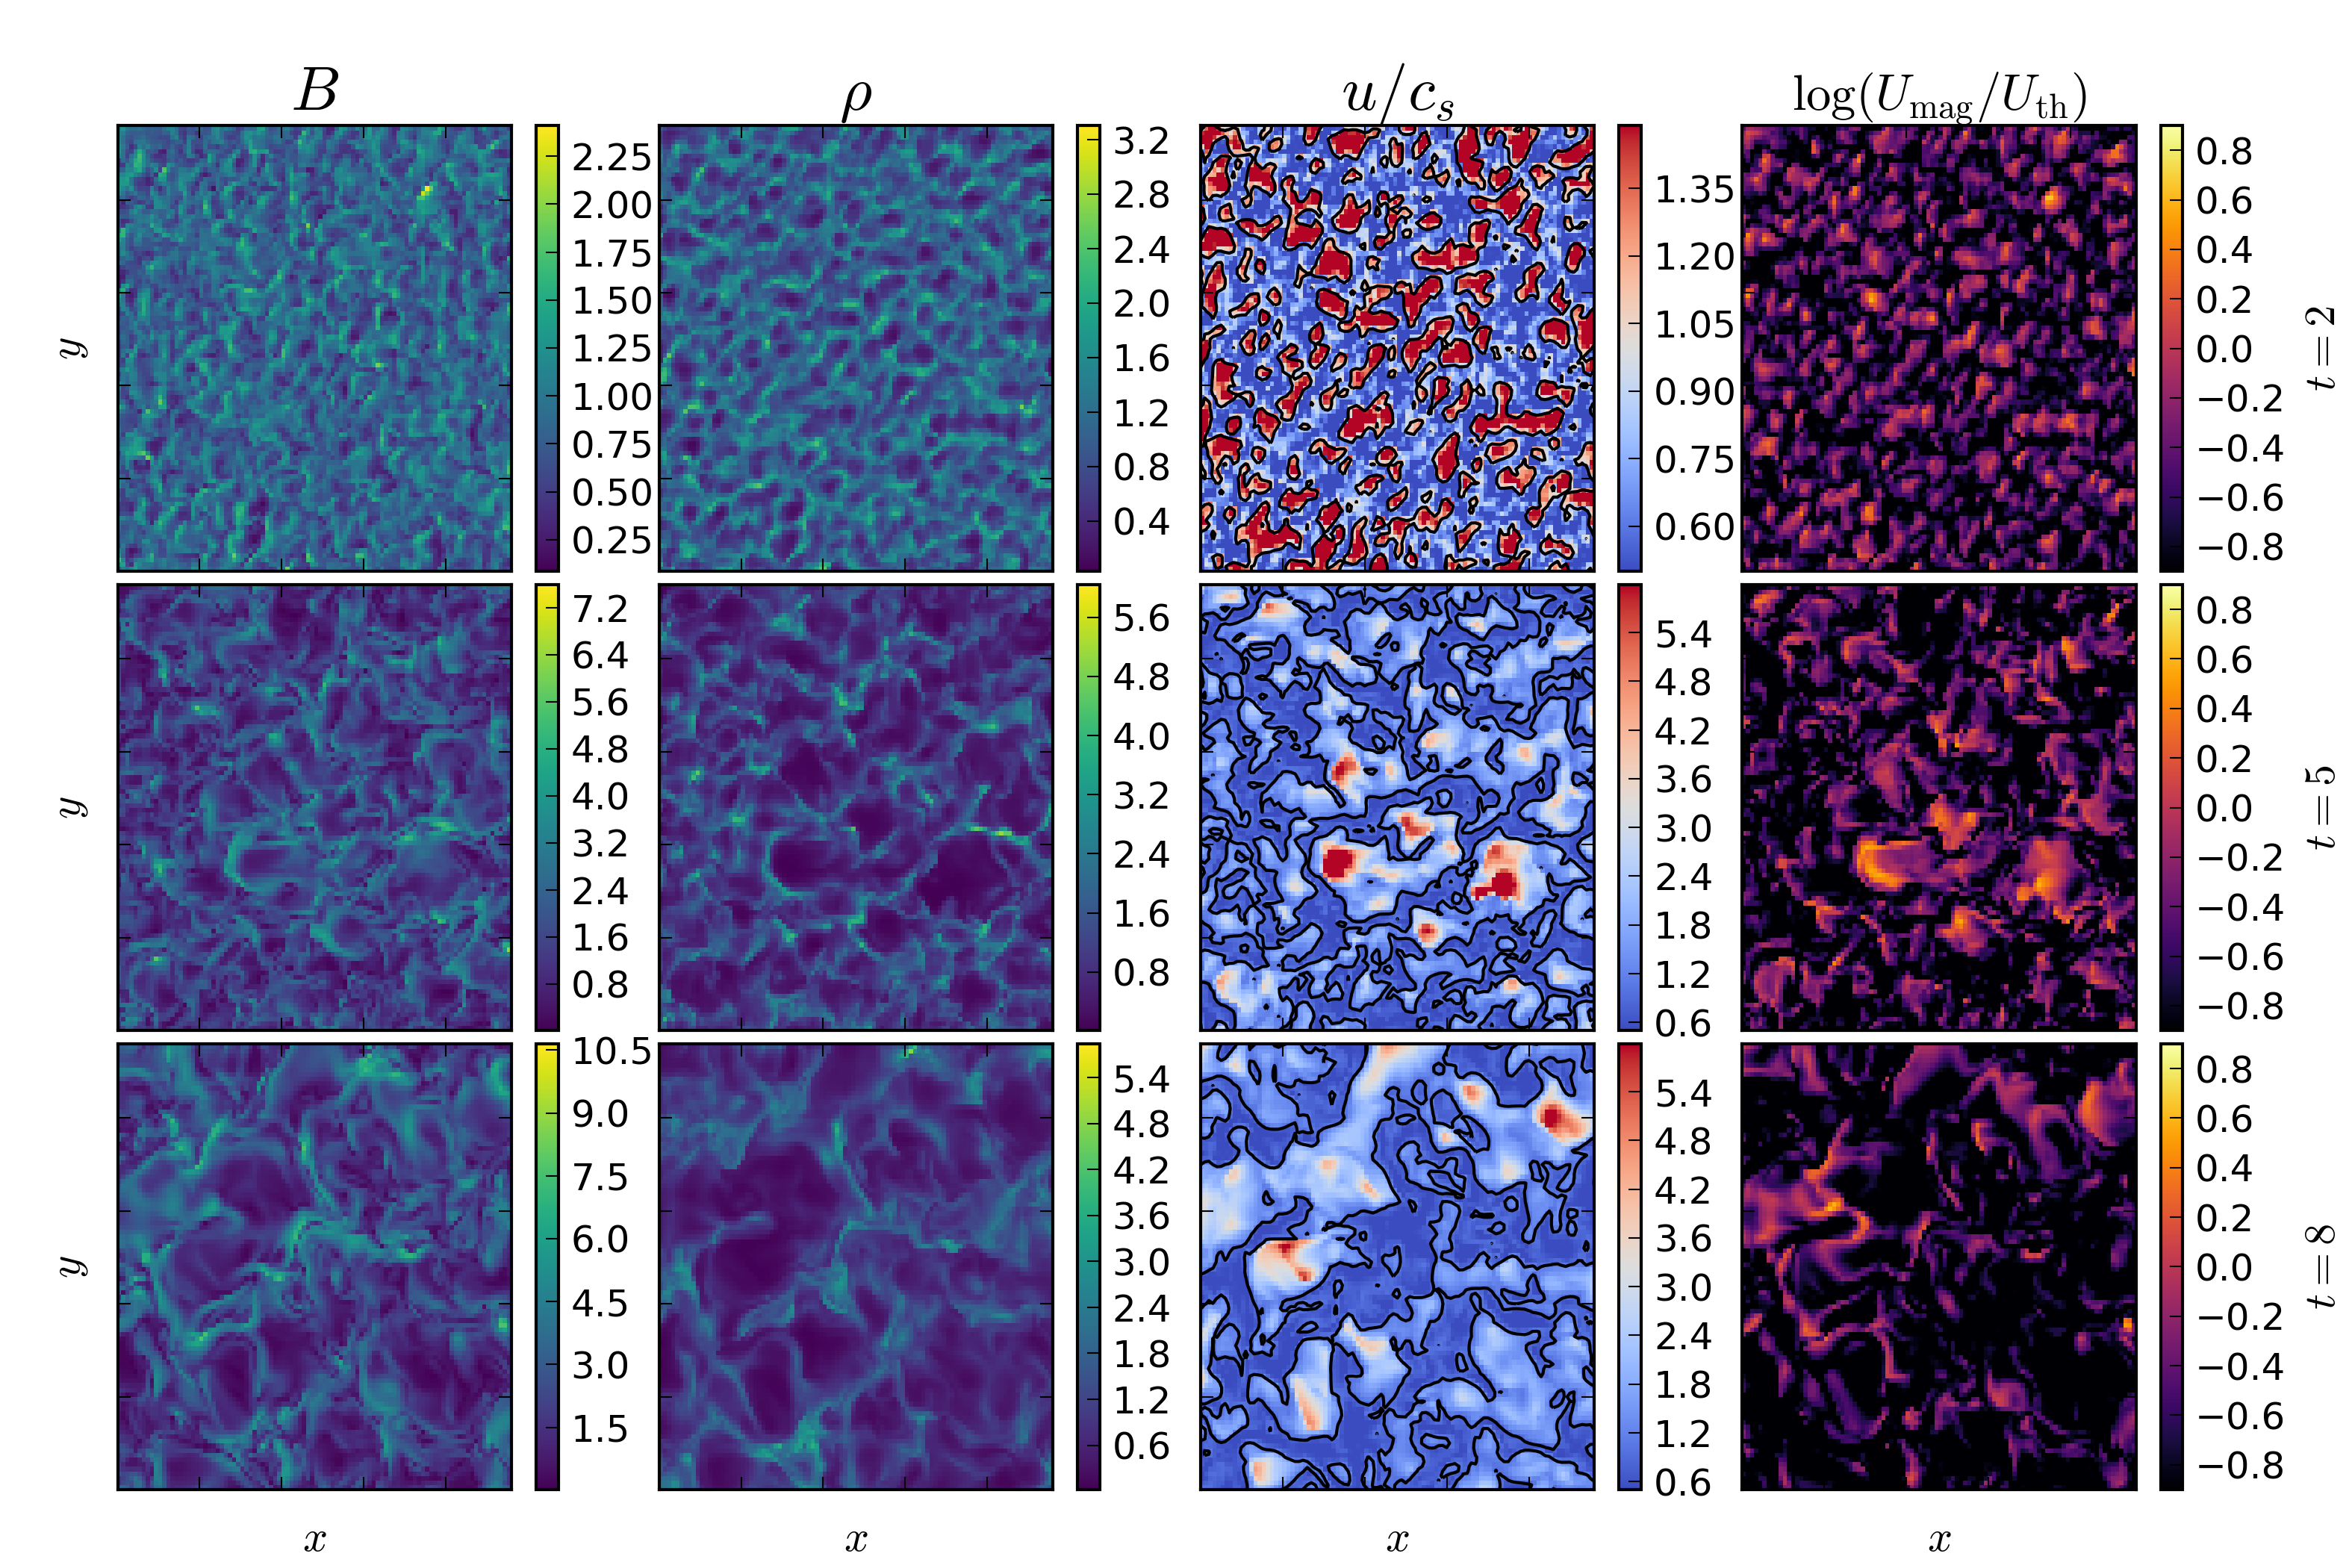
We show some of the physical aspects of the fiducial 3D perpendicular simulation in more detail in Fig. 8. We pick times that correspond roughly to before, during and after the linear to non-linear transition. The B-field and density are shown for reference, whilst the right-hand panels depict the ratio of plasma speed to sound speed and the logarithm of the ratio of the magnetic energy density to the thermal energy density. These plots reveal some key properties of the plasma. First, it is clear from Fig. 8 that, broadly speaking, the flow is supersonic in the low density voids, and subsonic in high density filaments. This leads to a series of small-scale shocks, which heat the plasma and cause the rapid increase in thermal energy shown in Fig. 5. The thermal energy rises slightly later in the 2D case. The magnetic field lines are compressed near the edges of the voids and the magnetic energy dominates over thermal energy. However, in the regions of highest density, thermal energy is dominant; this is important in limiting the growth of the instability in the non-linear regime (see section 4.3).
3.3 Comparison to the parallel case
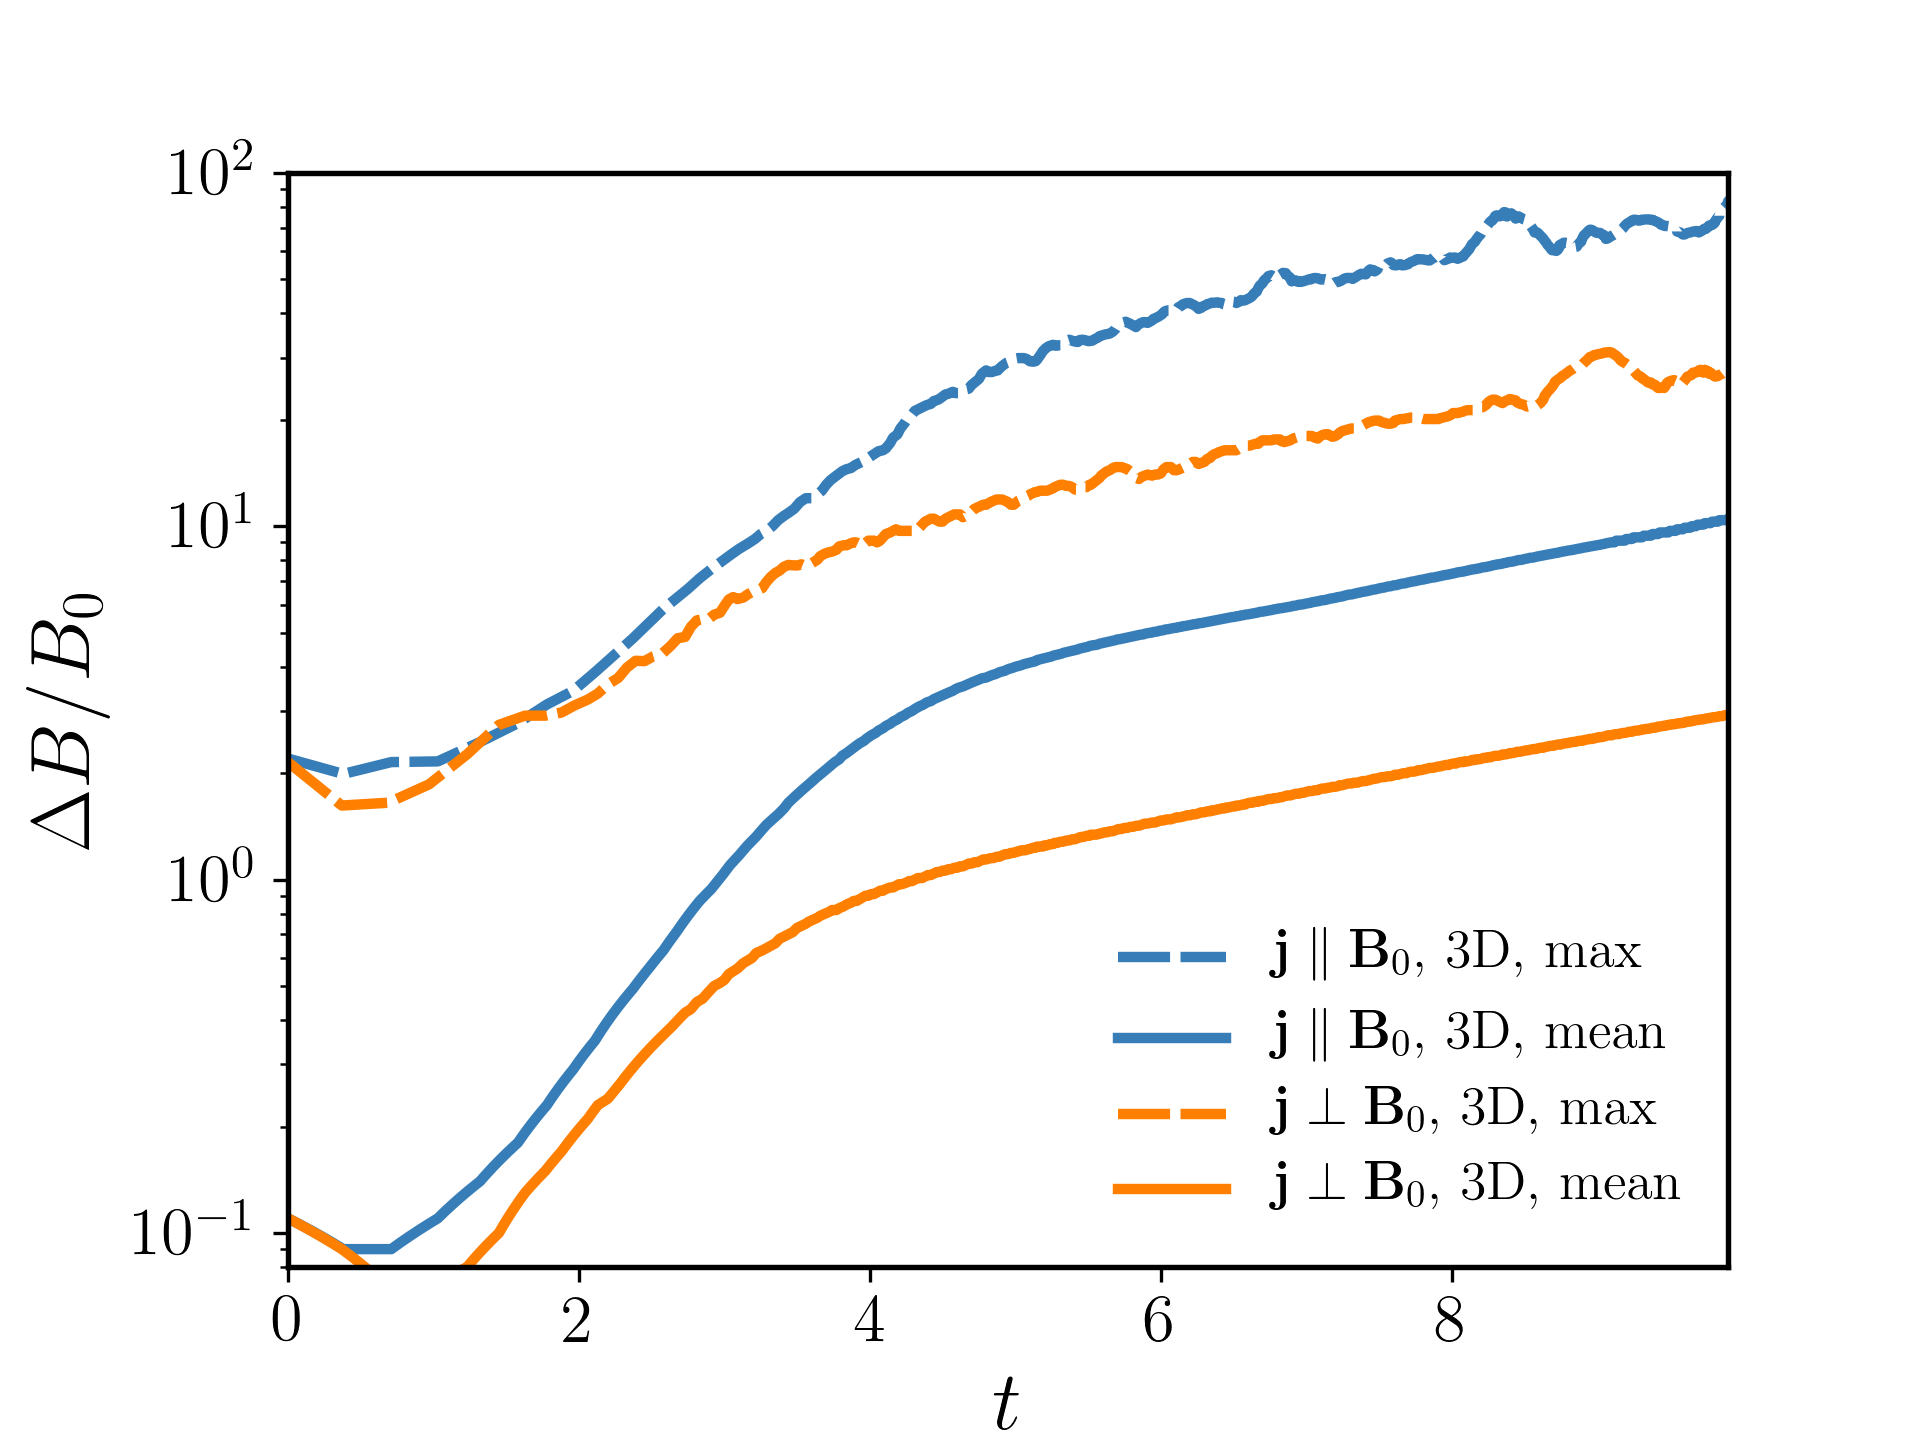
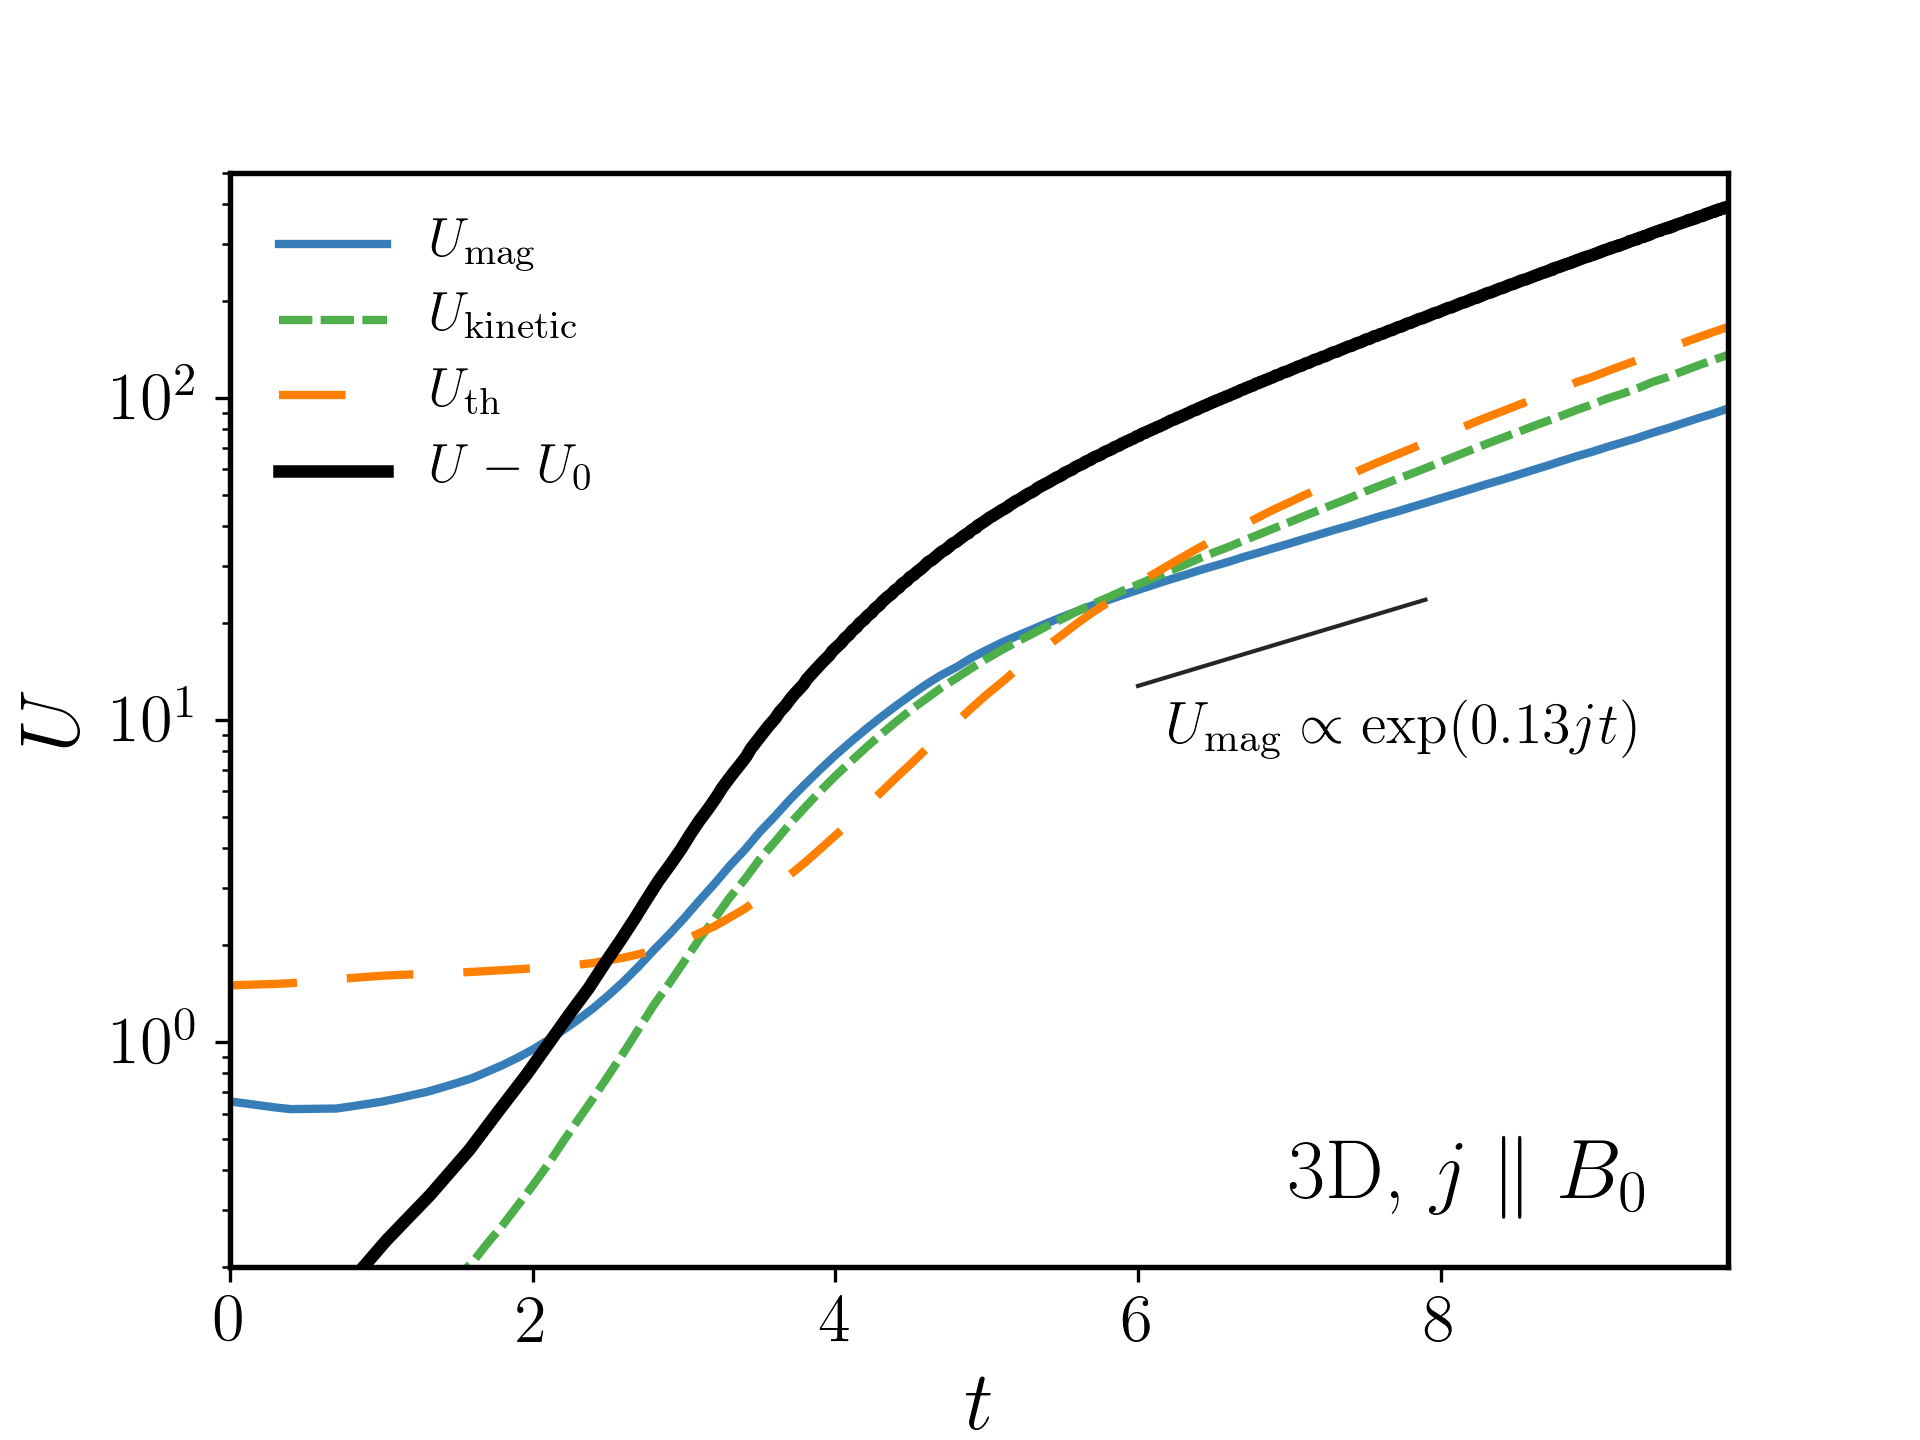
The case in which a current parallel to drives the instability has been studied extensively in the literature (Bell 2004, 2005; Zirakashvili & Ptuskin 2008; Niemiec et al. 2008; Riquelme & Spitkovsky 2009; Stroman et al. 2009; Beresnyak & Li 2014). It is therefore instructive to compare the two physical pictures. The magnetic field amplification factor in the parallel and perpendicular cases is compared in Fig. 9, while Fig. 10 shows the evolution of the kinetic, thermal and magnetic energy densities in the parallel configuration. We recover a very similar growth rate in the non-linear regime to that reported by Beresnyak & Li (2014) using an independent (relativistic) MHD code.
The growth rates (i.e. the slopes in Fig. 9) are very similar in both the parallel and perpendicular cases. This is expected in the linear regime from the derived dispersion relations; at the maximally growing wavenumber, , the value of is identical for and if , whilst for small . At late times, it is also unsurprising that the growth rates are similar, as here and the magnetic field does not retain its initial preferred direction. This can be seen in Fig. 11, which shows the magnetic field strength and density in both the and planes at both early and late times for the 3D perpendicular and parallel simulations. At early times, the turbulence exhibits a toroidal structure in which the typical scale-length in the plane is larger than the typical scale-length in the -direction. The width of the filaments at the edge of the tori is noticeably larger in the parallel geometry and there are a number of ‘hot spots’ of strong magnetic field. At late non-linear times, both the anisotropy and toroidal structures have largely disappeared; the turbulence has a similar structure in all directions regardless of the initial -field configuration. This behaviour can only be reproduced in 3D simulations, and can also be seen in Fig. 7, where the different rms fields in each direction converge to the same value at late times.
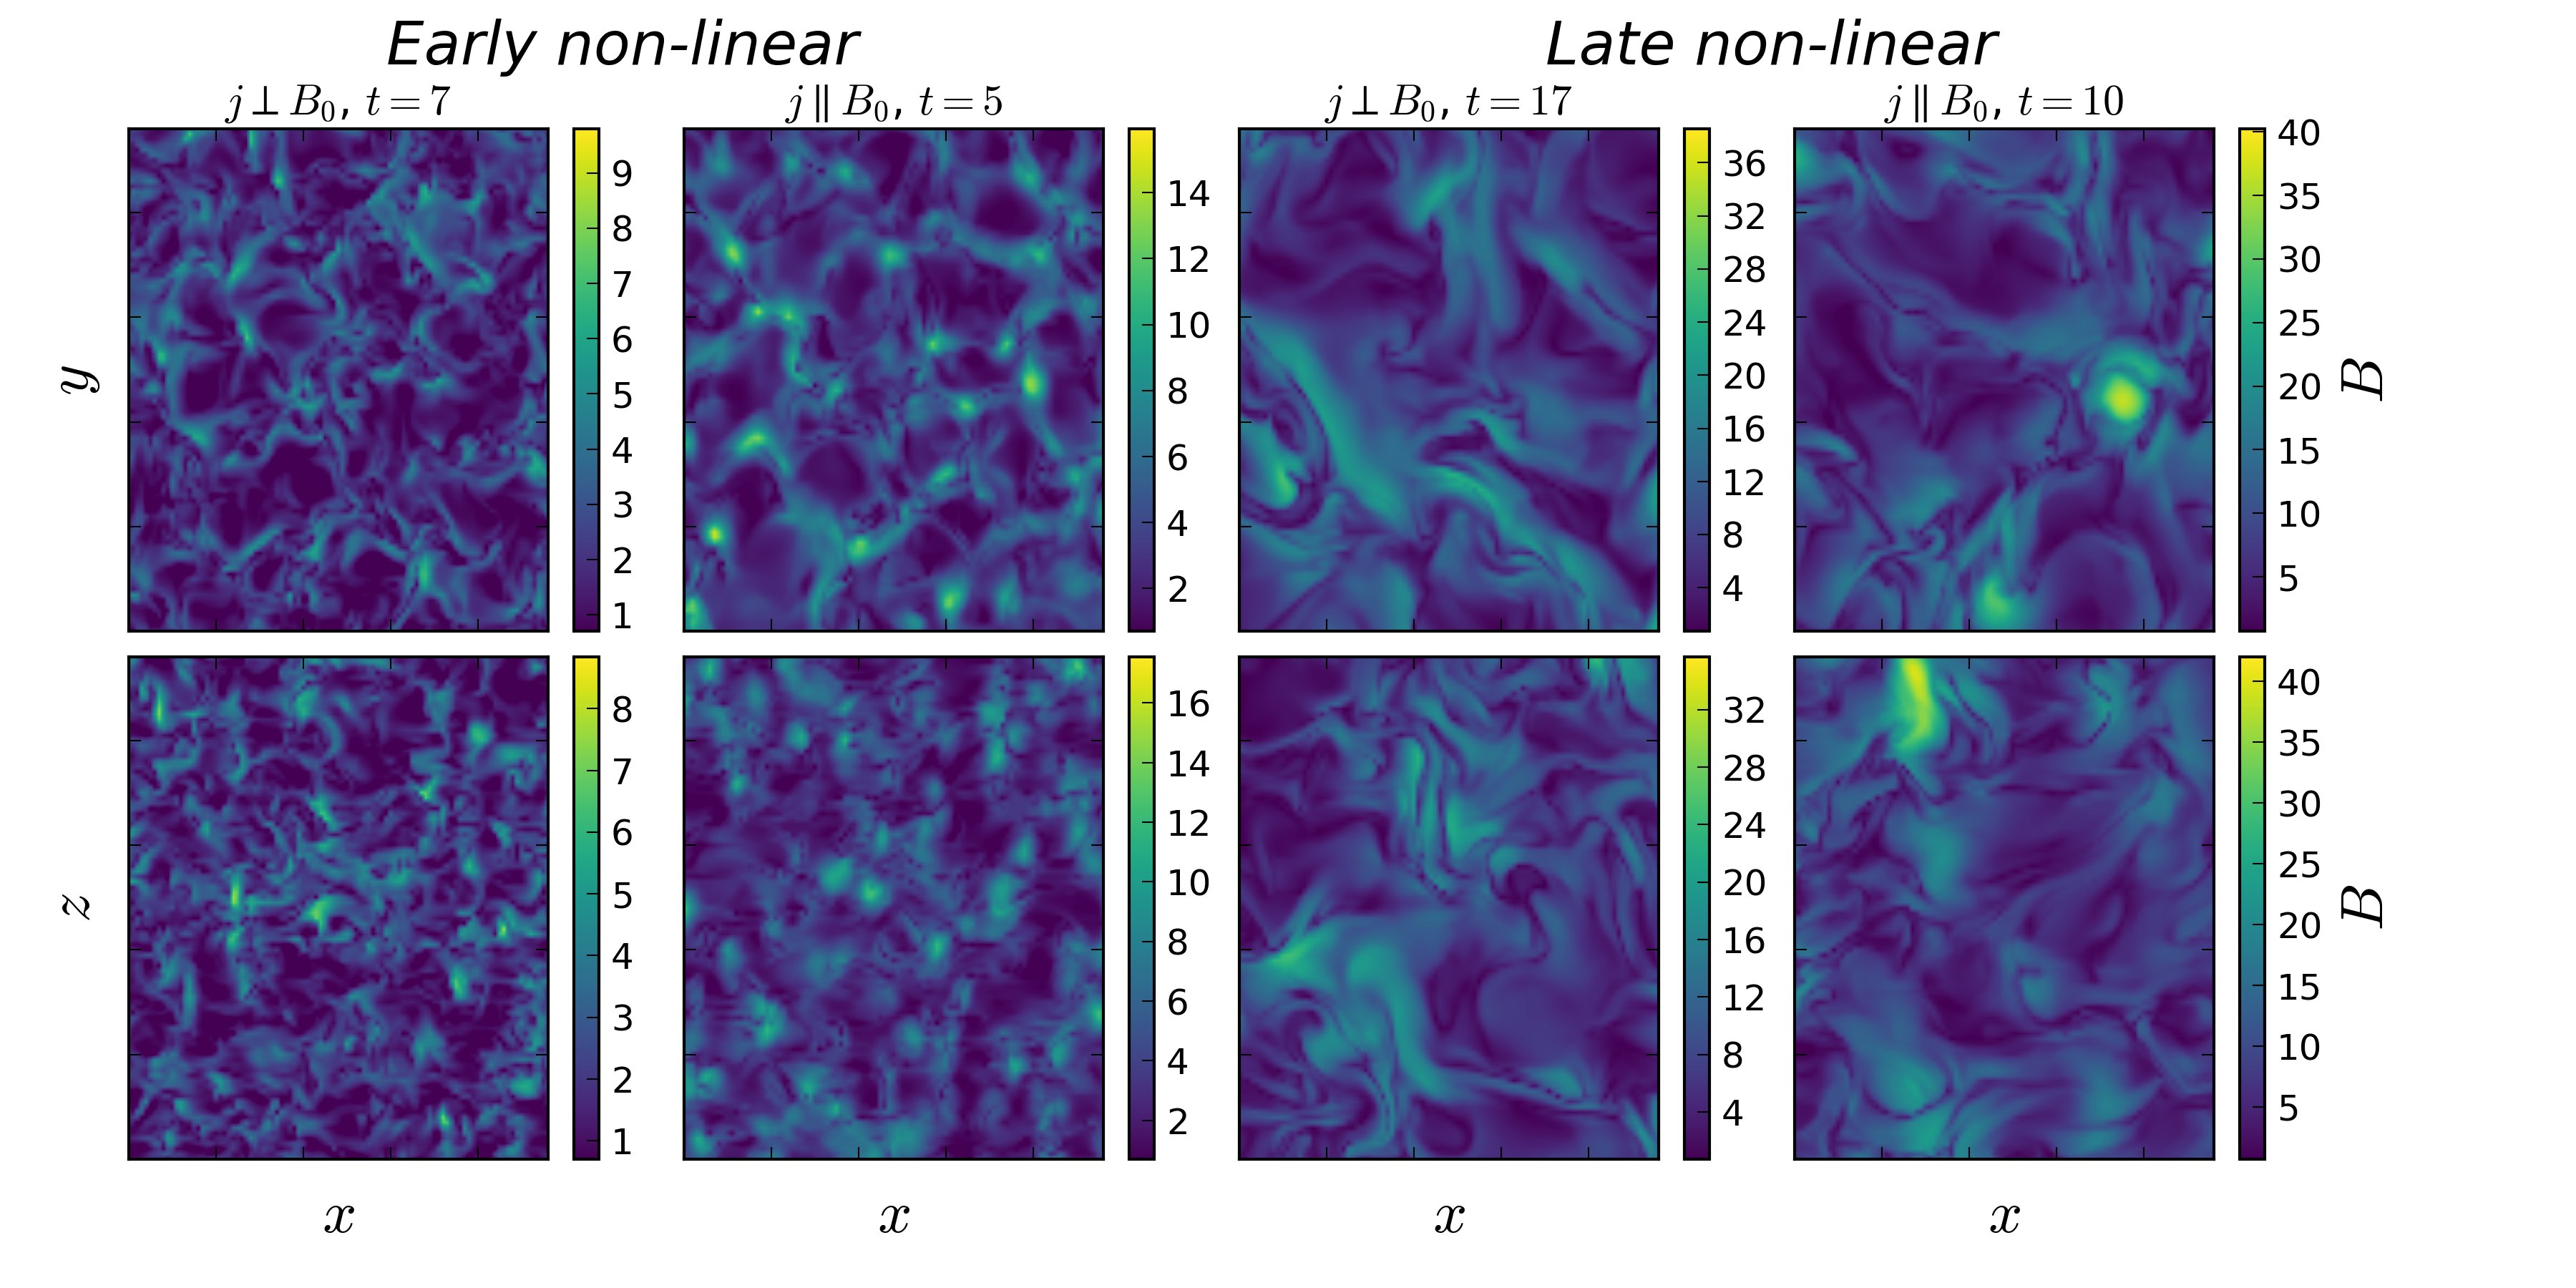
Given the similarities in actual growth rates and late-time structure, the most important difference between the two configurations is thus the value of at which the growth rate is reduced from to . This transition happens at a lower magnetic field strength in the perpendicular case. We discuss the reasons for this in section 4.3, then explore the astrophysical and observational consequences in section 5.2.
4 Discussion
We have so far demonstrated a few key properties of the perpendicular NRH instability in 3D and studied its character; importantly, we have shown that while the density and B-field structure are different in 2D and 3D, the instability continues to grow exponentially in both cases. We also identified some key differences between both the perpendicular and parallel instabilities and 2D and 3D simulations. In this section, we introduce some conceptual models designed to elucidate the physics governing these differences – as well as the similarities.
4.1 Rayleigh-Taylor-like description
Although the perpendicular NRH instability is inherently 3D and non-linear, a simple, 2D analytical picture can nonetheless prove informative. Here, we apply a non-linear analysis of the Rayleigh-Taylor (RT) instability (Ott 1972) to the perpendicular NRH instability. Ott (1972) found an exact, closed form solution for RT growth in a thin layer.
In RT, the problem involves a layer of fluid at which is supported against gravity () by a massless fluid at pressure in . In , there exists another massless fluid at pressure . Following Ott (1972), we treat the problem in 2D and consider a surface element of the layer at , with length and mass , where is the surface density. and is the width in the -direction. We perturb the system at . The force equation in this system is then
| (11) |
where and are unit vectors. In the NRH case, we replace the pressure gradient with a force and associate the layer of fluid with a magnetic field line. We consider a non-inertial frame with the equilibrium condition that a psuedo-gravity of magnitude balances the homogenous acceleration, . We orient gravity along the direction as in the simulations, such that is in the -direction and is into the page along . In this case, the equation of motion becomes
| (12) |
where is the thickness of the fluid layer associated with the field line. Remembering that and imposing mass conservation, we can now separate into and and divide through by to obtain
| (13) |
| (14) |
where we know . These equations allow the solution , , as required, which is the equilibrium boundary condition. There exists a special case of the solutions to these equations in which the modes are purely growing such that, for a specific wavenumber we have
| (15) |
| (16) |
We can now write the growth rate as
| (17) |
which is the characteristic growth rate found by Bell (2004) and obtained from the dispersion relations in section 2.
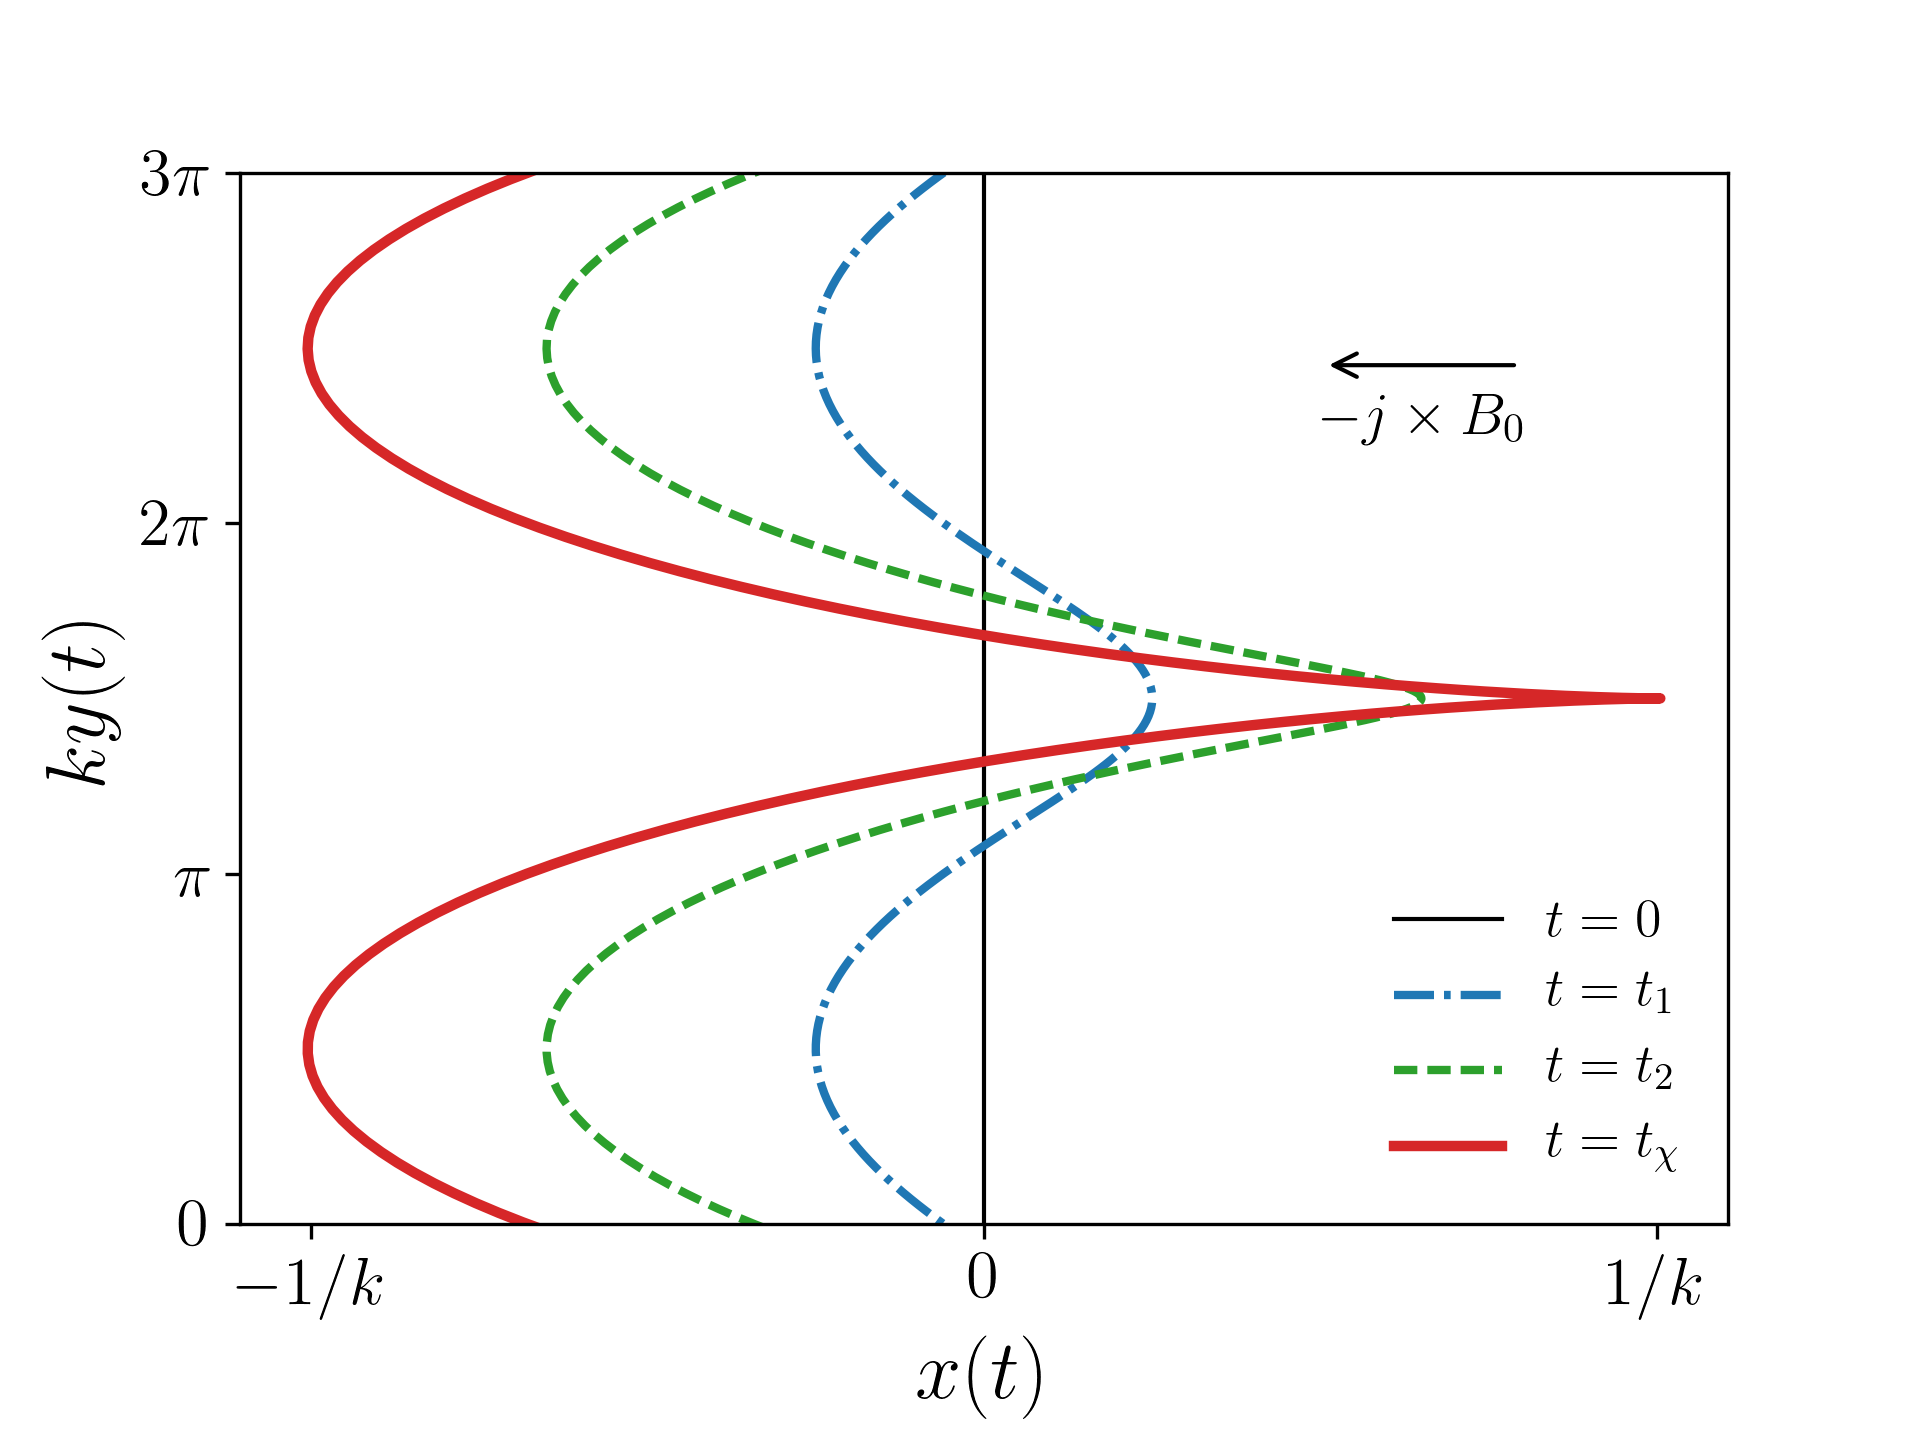
For a given mode of wavelength , the growth continues at this rate until the energy-containing scale is comparable to . The result of all this is that one finds that the functional form of and is a cycloid evolving with time, as shown in Fig. 12 for arbitrary parameter values. Fig. 12 is deliberately shown with the same orientation as the simulations so a direct comparison can be made. Early on, the field line is well described by a sinusoid. After a given time, the instability has grown so that the sinusoid is distorted, giving the classical RT ‘bubbles and spikes’ structure – these are then analogous to the voids and filaments in our simulations. The instability grows exponentially because mass is displaced sideways out of the bubbles, which in turn increases the acceleration. Eventually, at , the cycloid is so distorted that the pressure in the spikes limits the instability; at this point, the model of differential acceleration due to density variations breaks down and we must construct an alternative treatment.
4.2 Expanding loop model
Milosavljević & Nakar (2006) considered an analytical model for the perpendicular NRH instability which the turbulence consists of a series of expanding loops. Similar models have been constructed by Bell (2004, 2005, for the parallel case) and RS10. The growing modes are transverse in the parallel configuration, but compressional in the perpendicular configuration. Loops in the plane are initially formed on the scale of the growing modes, , but expand so that they extend to a radius at time . Flux-freezing means that is constant. Ignoring other forces, the equation of motion is
| (18) |
with the result that . In reality, the expanding loops eventually have their growth limited by a ram-pressure-like term, which will act on the cross-sectional area of the loop, where is the thickness in the direction. This will happen at some critical value of , which is geometry-dependent. The non-linear behaviour can then be thought of as a competition between the growth of the loops due to the force and an external ram pressure acting on the loop. Under this assumption, the equation of motion becomes
| (19) |
where, in general, . The value of at which the transition to the non-linear regime occurs will therefore depend on the point at which this ram pressure becomes important, which will occur once the loop has expanded to some critical radius, which we discuss in the next section.
4.3 Transition to non-linear growth
The transition to the non-linear regime occurs when the non-linear terms in equation 4 become comparable to the linear ones. As the loops of magnetic field expand, they compress the plasma into dense filaments. After a time, the thermal pressure in these filaments becomes comparable to the force causing their expansion and the thermal pressure starts to limit the growth of the instability. In general, this transition occurs at a time such that the perturbed field, . We find in 3D and in 2D. This contrasts with the value of for the parallel case found here and by Bell (2004) and Beresnyak & Li (2014), noting that the turnover will occur around in energy units.
The transition to the non-linear regime can be understood in terms of the models described in sections 4.1 and 4.2. The key aspect of the instability that affects the value of is the typical size of the loops when the ram pressure term becomes important. The geometry of the instability is critical here; in the perpendicular case, the modes are compressional and (for ) is in the plane of the loops. As a result, the limiting scale is roughly . This also follows from the RT analysis of section 4.1. However, in the parallel case the loop expansion is transverse to the direction of , and we can instead think of the critical scale as a ‘transverse coherence length’ , which has no knowledge of . The fastest growing modes have parallel to , so the spatial variations perpendicular to are small and . As such the different in values of can be attributed to the ratio .
4.4 A summary of the NRH instability in multiple geometries
Since the original discovery papers by Lucek & Bell (2000) and Bell (2004), there have been a series of valuable contributions which have helped to expand our understanding of the physics and astrophysical significance of the NRH instability (e.g. Bell 2005; Zirakashvili & Ptuskin 2008; Niemiec et al. 2008; Stroman et al. 2009; Riquelme & Spitkovsky 2009, 2010; Rogachevskii et al. 2012; Beresnyak & Li 2014). Informed by our new results and this previous work, we briefly summarise what we consider the main physical characteristics of the instability.
The NRH instability can be broadly separated into three geometries (parallel, 2D perpendicular and 3D perpendicular) and three time regimes (linear, early non-linear and late non-linear). For a given set of initial physical conditions, the geometry is determined by the alignment of and , as well as the number of dimensions considered, while the regime is just determined by the time . The linear behaviour of the instabilities can be derived from the same, general, dispersion relation and MHD equations, so the instabilities can be thought of as variants of the same, generally oblique, instability. However, there are clear differences in behaviour, and the actual forces driving and limiting the instability are slightly different in each case. For clarity, we summarise the behaviour of the instability within each geometry and regime here, with the aid of the RT and loop models discussed above which show that the growth will be exponential if increases in the loop.
-
•
Linear parallel geometry: The instability does not enhance density fluctuations, so is roughly constant. However, is the perturbed field and so increases in proportion with the amplitude, leading to exponential growth.
-
•
Early non-linear parallel geometry: If we assume a cylindrical loop geometry in which is constant, then we have and a continuing exponential growth.
-
•
Linear perpendicular geometry: Rayleigh-Taylor-like exponential growth – differential sideways acceleration enhances density fluctuations, which in turn increases the acceleration of the loops. Similar behaviour in 2D and 3D, but the transition to the non-linear regime occurs at different times.
-
•
Early non-linear perpendicular geometry, 2D: The mass displacement into ‘spikes’ or ‘filaments’ of high density continues, creating large voids (bubbles) of low density. Bubbles still expand exponentially but are limited by the pressure from spikes.
-
•
Early non-linear perpendicular geometry, 3D: As in 2D, but pressure induces movement along the axis and allows infilling of the bubbles. This causes the in to increase and means that the point at which ram pressure and become comparable occurs sooner, resulting in a lower value of .
-
•
Late-time non-linear behaviour: At late times, all geometries converge to similar behaviours; loop expansion limited by ram pressure. The amplified field is far greater than the initial field, and there is no preferred direction to the turbulence. Growth rates are similar, and we always have .
5 Overall implications for CR acceleration
Although SNRs are widely thought to accelerate CRs up to the knee in the CR energy spectrum, the origin of the highest energy CRs is still unknown. We therefore explore the timescales and maximum field strength associated with the NRH instability (with both parallel and perpendicular configurations), and examine whether they satisfy the requirements for efficient CR acceleration to high energies. The general principles behind this discussion will be described in more detail by Bell et al. (in preparation), although there the discussion will be focussed on highly relativistic shocks.
5.1 Maximum magnetic field strength
In our simulations, the magnetic field keeps growing as , where . There is no mechanism to saturate the instability in our ideal MHD approach. In reality, our treatment breaks down once the size of the turbulence becomes comparable to the Larmor radius of the CRs driving the instability. At that point the CRs start to move along field lines and kinetic effects become important, preventing further amplification. The highest energy CRs are responsible for driving the largest scale turbulence and thus set the maximum magnetic field strength, . These CRs, with Larmor radius and energy , drive the instability provided that , which is the condition for the CRs to exert a force that overcomes the tension in the magnetic field lines on a scale . The energy density of the CRs, is related to the CR current by . Since , we then obtain
| (20) |
for the saturated magnetic field strength (Bell 2004). This equation is very similar to that derived from equipartition arguments, but the above limit will apply at lower values of in general; this is because (i) generally , and (ii) any steepening in the CR energy spectrum will mean the bulk of the energy is contained in CRs that cannot drive turbulence on the largest scales.
RS10 also showed that a number of other factors can influence the saturation point of the instability. One of these is charge separation in the plasma, something which is not dealt with in our approach. Adopting , RS10 show that, as the negatively charged loops expand, this focuses CR particles into the voids between the loops and induces an electric field in the loops themselves, which opposes the force and limits their expansion. The focusing of CR charge into the voids between loops was also found by Bell (2005) and Reville & Bell (2013). This electric field comes from the term in the MHD equations, and thus relies on using an appropriate value for , where is the number density of ions in the plasma. A conservative upper limit on this value can be obtained by assuming energy equipartition; for ions at GeV energies and CRs at TeV energies this gives
| (21) |
where and are typical energies of the ions in the plasma and the CRs driving the instability. This number is an overestimate if anything and decreases with CR energy. On small scales and for injection problems, the low energy CRs are important in driving the instability and charge separation has an effect, but at late times the highest energy CRs are important. We therefore do not expect charge separation to have an effect in growing the turbulence to large scales at late times, where the CR energies are very high and . This is the important regime for UHECR acceleration. Based on this, we argue that the magnetic field strength continues to grow until the scale of the turbulence reaches the Larmor radius of the CRs driving the instability and the saturation is set by equation 20. In a real astrophysical situation, dynamical timescales start to affect this conjecture.
5.2 Amplification timescale
The amplification timescale is important for a number of reasons and in different astrophysical systems; in general, it must be shorter than the various dynamical timescales so that CRs in the vicinity of the shock can be efficiently scattered. In SNRs, one obvious consideration is that the amplification timescale must be significantly smaller than the age of the SNR; this is known as the Lagage & Cesarsky (1983a, b) limit. Furthermore, in the upstream region it is necessary that the amplification in a given volume of plasma occurs before the shock overtakes it (Bell et al. 2013b).
Since the parameters of our simulations are chosen to give a maximum growth rate roughly equal to , the time taken for amplification by a factor 100 is approximately given by (Bell 2004; Bell et al. 2013b)
| (22) |
where is the normalised time at which amplification by a factor of 100 has occurred; Bell et al. (2013b) adopted for the parallel case. The fact that the transition to the non-linear regime occurs at in perpendicular shocks instead results in an increased value of (which can be inferred from Fig. 7). The location of this transition point (see section 4.3) is therefore important in estimating the amplification timescale. It is notable that the transition occurs at different values of in each of the 3D perpendicular, 3D parallel and 2D perpendicular cases, emphasising the need for a 3D treatment of each configuration. The general arguments presented by Bell (2004) are unaffected by the increased value of ; however, it does suggest that the maximum CR energy attainable in perpendicular shocks in SNRs may be lower by a factor compared to parallel shocks (see Bell 2004, equation 27).
5.2.1 Radio hotspots
In perpendicular shocks, the NRH instability must amplify the magnetic field to G in the time in which the downstream plasma travels a distance , where is the Larmor radius of a CR with energy spiralling in the unamplified field. This constraint, that , can be applied to the hotspots of radio galaxies if the shock there is perpendicular. Here, we follow Araudo et al. (2016) and Araudo et al. (in preparation), and assume that the magnetic field responsible for scattering the synchrotron electrons is amplified by the NRH instability. If we consider the downstream region of a jet hotspot, with initial ordered field and number density , we can derive a lower limit on the acceleration efficiency of the CRs driving the instability. This acceleration efficiency is defined as . The current in this region is given by
| (23) |
where is the energy density of the CRs driving the instability on this scale. In order to accelerate particles up to an energy , the mean free path of these particles must be less than their Larmor radius (Bell 2004; Kirk & Reville 2010; Sironi et al. 2013). This condition is satisfied when the turbulence scale size is greater than . Assuming that turbulence grows to the Larmor radius, , of the driving CRs gives . If we now adopt some canonical values with a shock velocity of , and set the CR drift velocity and plasma drift velocities to and respectively, we obtain
| (24) |
where we have also introduced an additional correction factor to account for the increased value of , and adopted the same jet density, as Araudo et al. (2016). Blandford & Eichler (1987) estimate an acceleration efficiency of a few per cent in SNRs, but the actual value is likely much higher, at tens of per cent, since the particle acceleration is a self-regulating process. Regardless, our lower limit is below even the more conservative value. This suggests that the NRH instability can amplify magnetic fields in perpendicular shocks to the required values on a short enough timescale, such that . Future observational efforts will help to constrain these values further, but the fact that numbers comparable to those observed are obtained even for this reduced growth rate suggests that the picture of particle acceleration is at least consistent and that the values adopted by Araudo et al. (2016) are reasonable.
5.2.2 Further implications
Our work has more general implications for a number of areas where perpendicular shocks are likely important in accelerating particles. In SNRs, both perpendicular and parallel shocks are thought to accelerate non-thermal electrons (e.g. West et al. 2017), and differences in amplification timescales between the two can be applied to models of the synchrotron emission. Differences in growth rate turnovers may actually help to say something about the magnetic field orientation in particle acceleration sites (if the NRH instability is responsible). This could prove interesting in radio galaxies, where magnetic field orientations are difficult to constrain, yet enter calculations of the scattering efficiency across the shock (Reynolds 1996; Croston et al. 2009). Furthermore, the fact that turnover to the non-linear growth rate occurs earlier in perpendicular shocks has implications for models of CR acceleration, particularly in relativistic shocks such as those seen in GRBs (e.g. Panaitescu & Kumar 2002; Yost et al. 2003; Milosavljević & Nakar 2006) and radio galaxies (e.g. Laing & Bridle 2002), where the pre-existing fields are quasi-perpendicular. The application of the NRH instability to relativistic shocks will be discussed in detail by Bell et al. (in preparation).
6 Conclusions
We have studied the NRH instability, in which a force from a return current acting in opposition to the CR current produces purely growing modes of plasma turbulence, amplifying the magnetic field. Our results confirm those of Bell (2004) and RS10, in that we find the perpendicular NRH instability causes exponential growth of the magnetic field strength and energy density in the plasma. Our main conclusions are as follows.
-
1.
Our 3D simulations exhibit a different plasma structure relative to the 2D simulations, as thermal and magnetic pressure terms along the axis cause a decreased density contrast.
-
2.
Despite these differences, the instability continues to grow exponentially in 3D and the non-linear growth rate is very similar ().
-
3.
At late times, the 3D perpendicular simulation shows similarities in structure to the parallel case; in general, the late-time behaviour is characterised by having no preferred direction to the turbulence, a result only observable in 3D simulations.
-
4.
A Rayleigh-Taylor-like analysis can be applied to the perpendicular NRH instability and used to describe the linear and early non-linear regimes.
-
5.
The transition to the non-linear regime is governed by thermal pressure and occurs at a different values of in each of the geometries. This value, denoted , depends on the critical scale at which pressure terms become in important; this is roughly a mode wavelength when but a larger ‘transverse coherence length’ when .
-
6.
For , The thermal pressure is fairly insensitive to the initial pressure condition as small scale shocks emerge due to the force, rapidly heating the plasma. The rapid growth of thermal pressure – which is isotropic – means there is no physical limit that is well produced by the 2D simulation.
-
7.
Our 2D MHD simulations reproduce the behaviour found by RS10 in terms of the structure and growth rate of the perpendicular NRH instability.
-
8.
We find that the 3D simulation does not saturate in even our longest and largest simulations. In an astrophysical situation, we argue that the maximum magnetic field strength will be set by either the consideration that the scale of the turbulence cannot grow beyond the Larmor radius of the CRs driving the instability, or the limiting dynamical timescale.
The NRH instability thus remains a promising candidate for amplifying magnetic fields to the magnitudes required to explain the observed non-thermal emission and CR energy spectrum. Our work also indicates that it can operate regardless of the magnetic field orientation relative to the cosmic ray current. However, further 3D treatments of the instability are needed to study its behaviour in further detail.
Acknowledgements
We would like to thank John Kirk, Will Potter, Alex Schekochihin and Andrey Beresnyak for useful discussions. This work is supported by the Science and Technology Facilities Council under grants ST/K00106X/1 and ST/N000919/1. We thank the referee, Prof. Luke Drury, for his constructive comments. We would like to acknowledge the use of the University of Oxford Advanced Research Computing (ARC) facility in carrying out this work (http://dx.doi.org/10.5281/zenodo.22558). Simulations were conducted using mh3d version 2.0.0. Figures are produced using the matplotlib 2.0 plotting library (Hunter 2007; Droettboom et al. 2017).
References
- Allen et al. (1997) Allen G. E., et al., 1997, ApJ, 487, L97
- Araudo et al. (2015) Araudo A. T., Bell A. R., Blundell K. M., 2015, ApJ, 806, 243
- Araudo et al. (2016) Araudo A. T., Bell A. R., Crilly A., Blundell K. M., 2016, MNRAS, 460, 3554
- Araudo et al. (2017) Araudo A. T., Bell A. R., Blundell K. M., Matthews J. H., 2017, in preparation
- Axford (1994) Axford W. I., 1994, ApJS, 90, 937
- Axford et al. (1977) Axford W. I., Leer E., Skadron G., 1977, International Cosmic Ray Conference, 11, 132
- Ballet (2006) Ballet J., 2006, Advances in Space Research, 37, 1902
- Bell (1978) Bell A. R., 1978, MNRAS, 182, 147
- Bell (2004) Bell A. R., 2004, MNRAS, 353, 550
- Bell (2005) Bell A. R., 2005, MNRAS, 358, 181
- Bell & Lucek (2001) Bell A. R., Lucek S. G., 2001, MNRAS, 321, 433
- Bell et al. (2011) Bell A. R., Schure K. M., Reville B., 2011, MNRAS, 418, 1208
- Bell et al. (2013a) Bell A. R., Schure K. M., Reville B., Giacinti G., 2013a, MNRAS, 431, 415
- Bell et al. (2013b) Bell A. R., Schure K. M., Reville B., Giacinti G., 2013b, MNRAS, 431, 415
- Bell et al. (2017) Bell A. R., Araudo A. T., Matthews J. H., Blundell K. M., 2017, in preparation
- Beresnyak & Li (2014) Beresnyak A., Li H., 2014, ApJ, 788, 107
- Berezhko & Völk (2004) Berezhko E. G., Völk H. J., 2004, A&A, 419, L27
- Berezhko et al. (2003) Berezhko E. G., Ksenofontov L. T., Völk H. J., 2003, A&A, 412, L11
- Blandford & Eichler (1987) Blandford R., Eichler D., 1987, Phys. Rep., 154, 1
- Blandford & Ostriker (1978) Blandford R. D., Ostriker J. P., 1978, ApJ, 221, L29
- Buckley et al. (1998) Buckley J. H., et al., 1998, A&A, 329, 639
- Burgess (1987) Burgess D., 1987, J. Geophys. Res., 92, 1119
- Bykov et al. (2011) Bykov A. M., Osipov S. M., Ellison D. C., 2011, MNRAS, 410, 39
- Caprioli et al. (2015) Caprioli D., Pop A.-R., Spitkovsky A., 2015, ApJ, 798, L28
- Cassam-Chenaï et al. (2007) Cassam-Chenaï G., Hughes J. P., Ballet J., Decourchelle A., 2007, ApJ, 665, 315
- Croston et al. (2009) Croston J. H., et al., 2009, MNRAS, 395, 1999
- Droettboom et al. (2017) Droettboom M., et al., 2017, matplotlib/matplotlib: v2.0.0, doi:10.5281/zenodo.248351
- Drury & Falle (1986) Drury L. O., Falle S. A. E. G., 1986, MNRAS, 223, 353
- Eichler (1979) Eichler D., 1979, ApJ, 229, 419
- Gabriel et al. (2004) Gabriel E., et al., 2004, in Proceedings, 11th European PVM/MPI Users’ Group Meeting. Budapest, Hungary, pp 97–104
- Giacalone (2005) Giacalone J., 2005, ApJ, 624, 765
- Giacalone & Jokipii (2007) Giacalone J., Jokipii J. R., 2007, ApJ, 663, L41
- Hillas (1984) Hillas A. M., 1984, ARA&A, 22, 425
- Hughes et al. (2000) Hughes J. P., Rakowski C. E., Burrows D. N., Slane P. O., 2000, ApJ, 528, L109
- Hunter (2007) Hunter J. D., 2007, Computing In Science & Engineering, 9, 90
- Huntington et al. (2015) Huntington C. M., et al., 2015, Nature Physics, 11, 173
- Kirk & Reville (2010) Kirk J. G., Reville B., 2010, ApJ, 710, L16
- Krymskii (1977) Krymskii G. F., 1977, Soviet Physics Doklady, 22, 327
- Kulsrud & Pearce (1969) Kulsrud R., Pearce W. P., 1969, ApJ, 156, 445
- Lagage & Cesarsky (1983a) Lagage P. O., Cesarsky C. J., 1983a, A&A, 118, 223
- Lagage & Cesarsky (1983b) Lagage P. O., Cesarsky C. J., 1983b, A&A, 125, 249
- Laing & Bridle (2002) Laing R. A., Bridle A. H., 2002, MNRAS, 336, 328
- Lemoine & Pelletier (2010) Lemoine M., Pelletier G., 2010, MNRAS, 402, 321
- Lerche (1967) Lerche I., 1967, ApJ, 147, 689
- Long et al. (2003) Long K. S., Reynolds S. P., Raymond J. C., Winkler P. F., Dyer K. K., Petre R., 2003, ApJ, 586, 1162
- Lucek & Bell (1996) Lucek S. G., Bell A. R., 1996, MNRAS, 281, 245
- Lucek & Bell (1997) Lucek S. G., Bell A. R., 1997, MNRAS, 290, 327
- Lucek & Bell (2000) Lucek S. G., Bell A. R., 2000, MNRAS, 314, 65
- Malkov & Voelk (1995) Malkov M. A., Voelk H. J., 1995, A&A, 300, 605
- Martins et al. (2009) Martins S. F., Fonseca R. A., Silva L. O., Mori W. B., 2009, ApJ, 695, L189
- Milosavljević & Nakar (2006) Milosavljević M., Nakar E., 2006, ApJ, 651, 979
- Mizuno et al. (2014) Mizuno Y., Pohl M., Niemiec J., Zhang B., Nishikawa K.-I., Hardee P. E., 2014, MNRAS, 439, 3490
- Niemiec et al. (2008) Niemiec J., Pohl M., Stroman T., Nishikawa K.-I., 2008, ApJ, 684, 1174
- Ott (1972) Ott E., 1972, Physical Review Letters, 29, 1429
- Panaitescu & Kumar (2002) Panaitescu A., Kumar P., 2002, ApJ, 571, 779
- Reville & Bell (2012a) Reville B., Bell A. R., 2012a, MNRAS, 419, 2433
- Reville & Bell (2012b) Reville B., Bell A. R., 2012b, MNRAS, 419, 2433
- Reville & Bell (2013) Reville B., Bell A. R., 2013, MNRAS, 430, 2873
- Reville & Bell (2014) Reville B., Bell A. R., 2014, MNRAS, 439, 2050
- Reville et al. (2008) Reville B., O’Sullivan S., Duffy P., Kirk J. G., 2008, MNRAS, 386, 509
- Reynolds (1996) Reynolds S. P., 1996, ApJ, 459, L13
- Riquelme & Spitkovsky (2009) Riquelme M. A., Spitkovsky A., 2009, ApJ, 694, 626
- Riquelme & Spitkovsky (2010) Riquelme M. A., Spitkovsky A., 2010, ApJ, 717, 1054
- Rogachevskii et al. (2012) Rogachevskii I., Kleeorin N., Brandenburg A., Eichler D., 2012, ApJ, 753, 6
- Ruyer et al. (2016) Ruyer C., Gremillet L., Bonnaud G., Riconda C., 2016, Phys. Rev. Lett., 117, 065001
- Schure & Bell (2011) Schure K. M., Bell A. R., 2011, MNRAS, 418, 782
- Sironi & Spitkovsky (2011) Sironi L., Spitkovsky A., 2011, ApJ, 726, 75
- Sironi et al. (2013) Sironi L., Spitkovsky A., Arons J., 2013, ApJ, 771, 54
- Skilling (1975a) Skilling J., 1975a, MNRAS, 172, 557
- Skilling (1975b) Skilling J., 1975b, MNRAS, 173, 245
- Skilling (1975c) Skilling J., 1975c, MNRAS, 173, 255
- Spitkovsky (2008) Spitkovsky A., 2008, ApJ, 682, L5
- Stage et al. (2006) Stage M. D., Allen G. E., Houck J. C., Davis J. E., 2006, Nature Physics, 2, 614
- Stroman et al. (2009) Stroman T., Pohl M., Niemiec J., 2009, ApJ, 706, 38
- Tanimori et al. (1998) Tanimori T., et al., 1998, ApJ, 497, L25
- Uchiyama et al. (2007) Uchiyama Y., Aharonian F. A., Tanaka T., Takahashi T., Maeda Y., 2007, Nature, 449, 576
- Vink & Laming (2003) Vink J., Laming J. M., 2003, ApJ, 584, 758
- Völk et al. (2005) Völk H. J., Berezhko E. G., Ksenofontov L. T., 2005, A&A, 433, 229
- Weibel (1959) Weibel E. S., 1959, Physical Review Letters, 2, 83
- Wentzel (1974) Wentzel D. G., 1974, ARA&A, 12, 71
- West et al. (2017) West J. L., Safi-Harb S., Ferrand G., 2017, A&A, 597, A121
- Yost et al. (2003) Yost S. A., Harrison F. A., Sari R., Frail D. A., 2003, ApJ, 597, 459
- Zirakashvili & Ptuskin (2008) Zirakashvili V. N., Ptuskin V. S., 2008, ApJ, 678, 939