Local segregation versus irradiation effects in high-entropy alloys:
Steady-state conditions in a driven system
Abstract
We study order transitions and defect formation in a model high-entropy alloy (CuNiCoFe) under ion irradiation by means of molecular dynamics simulations.
Using a hybrid Monte-Carlo/molecular dynamics scheme a model alloy is generated which is thermodynamically stabilized by configurational entropy at elevated temperatures, but partly decomposes at lower temperatures by copper precipation. Both the high-entropy and the multiphase sample are then subjected to simulated particle irradiation. The damage accumulation is analyzed and compared to an elemental Ni reference system.
The results reveal that the high-entropy alloy—independent of the initial configuration—installs a certain fraction of short-range order even under particle irradiation. Moreover, the results provide evidence that defect accumulation is reduced in the high-entropy alloy. This is because the reduced mobility of point defects leads to a steady state of defect creation and annihilation. The lattice defects generated by irradiation are shown to act as sinks for Cu segregation.
This article may be downloaded for personal use only. Any other use requires prior permission of the author and AIP Publishing. The following article appeared in J. Appl. Phys. 122, 105106 (2017) and may be found at https://doi.org/10.1063/1.4990950.
I Introduction
High-entropy alloys (HEAs) constitute a relatively new class of materials, which have recently attracted considerable attention in the field of high-performance materials Wang, Guo, and Liu (2014). They consist of at least four to five principal elements occuring in an equimolar or near equimolar ratio, such that their fractions do not drop below 5 or exceed 35 Ye et al. (2016); Otto et al. (2013); Pickering and Jones (2016). HEAs owe their name mainly to the large contribution of configurational entropy to the Gibbs free energy. It is supposed that the influence of the entropy stabilizes random solid solutions even at lower temperatures Tasan et al. (2014); Yeh (2013). However, mixing enthalpies and the atomic size mismatches between the components decisively contribute to the phase selection criterion at lower temperatures Pickering and Jones (2016) and the formation of secondary phases can often not be completely avoided Widom et al. (2014).
The interest in high-entropy alloys is mostly triggered by their outstanding mechanical properties, making them alternatives for certain superalloys or metallic glasses Ye et al. (2016); Pickering and Jones (2016); Tsai and Yeh (2014); Liu et al. (2014); Xie et al. (2014); Tian et al. (2013a); Kao, Yeh, and Chin (2008); Haglund et al. (2015); Tian et al. (2013b); Guo et al. (2013); Ng et al. (2014). However, high-entropy alloys are not only characterized by a large configurational entropy, but also by high atomic-level stresses arising from local lattice distortions due to atomic size differences Egami et al. (2014). It has been reported that structural and chemical disorder affect both defect kinetics and heat dissipation, which is of particular interest in the context of radiation resistant materials Zhang et al. (2015). Recent molecular dynamics (MD) simulations revealed that defect concentrations can be significantly reduced during irradiation in equiatomic multicomponent alloys as compared to elemental metals Granberg et al. (2016, 2017). This advantageous robustness against radiation damage can be ascribed to a reduced defect mobility and consequently a smaller growth rate of defect clusters Granberg et al. (2016, 2017); Yang et al. (2016). Additionally, chemical disorder decreases thermal conductivity, which is also assumed to prevent the formation of large defect clusters by facilitating defect annihilation Egami et al. (2014); Zhang et al. (2015); Ullah et al. (2016). If, on the other hand, a HEA has a tendency towards multiphase formation at lower temperatures, particle irradiation can also drive the system into thermodynamic equilibrium and lead to precipitiation Yang et al. (2016). Thus, in irradiated high-entropy alloys there is a delicate interplay of thermodynamic driving forces due to configurational entropy, mixing/demixing tendencies, and irradiation-induced far-from-equilibrium conditions.
The objective of the present study is to address this issue in a model four-component CuNiCoFe alloy in thermodynamic equilibrium and under particle irradiation, as well as to study the transition from a single phase HEA to multiphase or so-called compositionally complex alloy. Using a hybrid simulation scheme consisting of alternating Monte-Carlo (MC) and MD steps, we start by generating a model alloy which is truly stabilized by configurational entropy at elevated temperatures. We then show that this structure decomposes at lower temperatures by precipation of small copper clusters. Both the high-entropy and the partly decomposed sample are then subjected to a series of 1,500 recoil events and the damage accumulation is analyzed and compared to elemental Ni as reference system. Moreover, we show that segregation effects occur at irradiation-induced defects, promoting the formation of precipitates.
II Methods
II.1 Interatomic potential
We chose a CuNiCoFe alloy as a model system for HEAs with a tendency for Cu segregation at low temperatures. The embedded atom method Foiles, Baskes, and Daw (1986) (EAM) was used to describe interatomic interactions in the multicomponent system. Parametrizations for the elemental interactions were taken from Zhou et al Zhou, Johnson, and Wadley (2004). The missing cross terms were created using the potential generator from the same authors, which is based on a single element mixture procedure Zhou, Johnson, and Wadley (2004). Because of the ferromagnetic elements, magnetism and magnetic transitions could influence the evolution of chemical ordering. EAM potentials cannot explicitly capture these effects and include the magnetic energy contributions only implicitly. For this reason, our system can only serve as a model for nonmagnetic HEAs or HEAs without magnetic transitions. In order to nonetheless ensure the reliability of the potential, we validated it against reference data in Appendix A.
II.2 Equilibrium simulations
Initially, atoms were distributed randomly on a regular FCC lattice of about sites, such that an equimolar configuration was obtained. We applied 3-dimensional periodic boundary conditions and the initial lattice constant was approximated according to Vegard’s law Jacob, Raj, and Rannesh (2007). After the construction of the initial structure, we minimized its free energy with a mixed MC/MD procedure, carried out using the open source code lammps Plimpton (1995). For the MC steps, we used the variance-constrained semi-grand-canonical (VC-SGC) ensemble Sadigh et al. (2012). This ensemble is based on the semi-grand-canonical ensemble with an added constraint on the overall composition. Thus, it resembles a canonical ensemble, but allows Gaussian variations of the concentration, the extent of which is controlled by the parameter . We chose a value of in our simulations. The VC-SGC ensemble allows simulations inside miscibility gaps and has a performance advantage over the canonical ensemble, which cannot be parallelized easily Sadigh et al. (2012). The miscibility is controlled via the chemical potential differences. The chemical potential differences with regard to copper were determined as , , and as described in Ref. Brink, Koch, and Albe, 2016. The values at hand lead to a miscible CuNiCoFe system at 800 K.
The MC/MD simulations were performed at different target temperatures , with MC trial moves followed by 20 MD steps. For the MD steps, we used a timestep of 1 fs, as well as a Nosé–Hover thermostat and a Parinello–Rahman barostat at temperature and ambient pressure. In total, the simulations were run for MD steps (including MC cycles), after which the potential energy was definitely converged.
II.3 Irradiation simulations
We simulated irradiation of the structures using the approach introduced in Ref. Granberg et al., 2016 with the parcas MD code Nordlund . Simulations were started from either pure Ni, a CuNiCoFe cell with random element distribution, or the equilibrated sample from the MC/MD run at 400 K. After equilibration at room temperature to zero pressure, the simulation cell size was fixed and a series of subsequent 5 keV recoils was initiated in the cell. The recoils were performed by assigning a velocity vector with a magnitude corresponding to the recoil energy and a random direction to the atom closest to the center of the simulation cell. Each recoil was simulated for 30 ps, which was sufficient to cool the cell back down to ambient temperature by Berendsen temperature scaling Berendsen et al. (1984) in a thin layer at the simulation box boundaries. After this, all atom coordinates were shifted by a displacement vector with components randomly selected in the interval , where is the cell size in each of the 3 dimensions . After the shift, atoms outside the boundaries were wrapped back into the cell according to the periodic boundary conditions. This procedure ensures homogeneous irradiation of the entire simulation cell. Experimentally, this is comparable, e.g., to prolonged neutron or high-energy ion irradiation of a segment inside the material.
The irradiation simulations used the same interatomic potential as the MC/MD simulations, except that for small interatomic separations (well below the equilibrium nearest-neighbor distance) the potentials are smoothly joint to the universal repulsive Ziegler–Biersack–Littmark (ZBL) interatomic potential Ziegler, Biersack, and Littmark (1985). The ZBL-96 electronic stopping Ziegler (1996) was applied on all atoms with kinetic energies higher than 1 eV. Monitoring of the simulations showed that about 20 of the initial recoil energy was lost to electronic stopping, i.e., the nuclear deposited damage energy per recoil is about 4 keV. The total deposited nuclear energy was extracted by summing up the damage energies and then used to calculate the displacements-per-atom (dpa) value, a standard unit for radiation damage exposure ASTM Standard E693-94 (1994); Nordlund et al. (2015). This irradiation simulation approach has previously been demonstrated to lead to a good agreement with experiments on other HEAs Granberg et al. (2016); Zhang et al. (2017).
II.4 Analysis of short-range order and lattice defects
In order to quantify the chemical ordering, we used the Warren–Cowley short-range order (SRO) parameters and adapted to a multicomponent alloy Cowley (1950)
| (1) |
where the subscript refers to the coordination sphere, describes the conditional probability of an atom of type being adjacent to an atom of type , and is the concentration of atom type . A Warren–Cowley parameter of zero represents the case of an ideal solid solution with no tendency for clustering. Ordered structures (attractive SRO) can be assumed if is positive, while negative values reflect preferences for segregation (repulsive SRO). We calculated the SRO parameters for the equilibrium structures as a time average over 20 snapshots taken during 2000 simulation steps. Those snapshots were minimized prior to analysis to remove thermal fluctuations and to obtain the 0 K ground-state values. For the irradiated cells, the SRO analysis was performed in the same manner, except that averaging was only performed where noted.
We used the open source application ovito Stukowski (2010) for the analysis and visualization of simulation results: Atomic volumes were calculated by Voronoi tesselation of minimized samples Voronoï (1908a, b, 1909); Brostow et al. (1998), defective atoms were marked by common neighbor analysis (CNA) with an adaptive cutoff Honeycutt and Andersen (1987); Stukowski (2012), and dislocation lines were identified using the dislocation extraction algorithm (DXA) Stukowski, Bulatov, and Arsenlis (2012). Additionally, we also performed a Wigner–Seitz cell defect analysis Nordlund et al. (1998a). This analysis constructs the space-filling Wigner–Seitz cells of the perfect underlying FCC lattice, labeling empty cells as vacancies and doubly-filled ones as interstitials. Since this analysis is space-filling, it gives a definite determination of whether a defect region is of vacancy or interstitial type (complex defects may involve both, but then the difference in the number of vacancies vs. interstitials of the same cluster determines its character Nordlund and Gao (1999)). The supplemental information provided by this analysis helps to identify point defects, which cannot be treated by DXA.
III Results and Discussion
III.1 CuNiCoFe in thermodynamic equilibrium
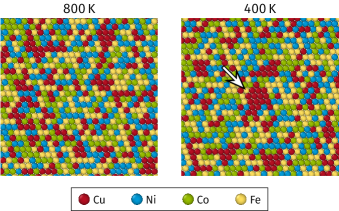
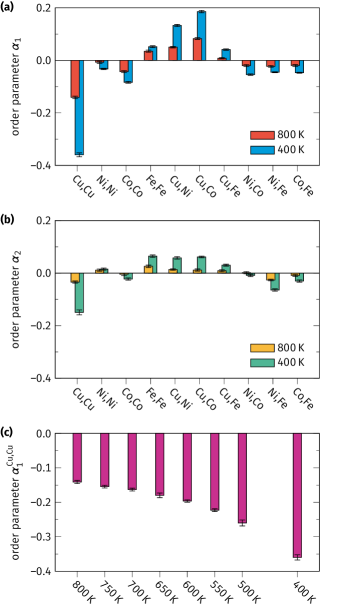
Figure 1 shows the final structures after equilibration in the VC-SGC ensemble at 800 K (left) and at 400 K (right). The configurations differ slightly in their atomic arrangement. Whereas Cu (red atom type) appears to be randomly distributed at 800 K, it tends to form small clusters in the structure at 400 K, indicated by the white arrow. The Warren–Cowley parameters at both temperatures are shown in Fig. 2. All values more or less deviate from the ideal solid solution in either the positive or negative direction. This behavior is most pronounced for Cu. On average we find a Warren–Cowley parameter for Cu–Cu of for the first neighbor shell at 800 K, indicating a slight tendency to form small Cu clusters (positive ). Accordingly, all other values are positive. Except for Fe–Fe interactions, all remaining parameters are slightly negative, indicating miscibility of Ni, Co, and Fe. The parameter exhibits no strong indication for medium-range ordering at 800 K.
If we repeat the analysis in the same sample equilibrated at 400 K, we see that the ordering tendencies become more distinct and extend into the second neighbor shell. Although the Warren–Cowley parameters for non-Cu pairs also change in magnitude, they still indicate an approximately random solid solution of Co, Ni, and Fe without any remarkable clustering. This can also be inferred from the snapshots in Figure 1. Figure 2c further shows that the Cu segregation tendencies increase non-linearly with decreasing temperature. Note that we do not observe any structural phase transitions, such as a transition from an FCC to a BCC lattice or even amporphization.
These results may be interpreted as follows: The contribution of the configurational entropy at 400 K is insufficient to compete against the enthalpy of mixing. Since the composition of the system is fixed, it will demix by locally forming copper-rich clusters. The formation of two separate solid solution phases (Cu-rich and Cu-depleted) has already been confirmed experimentally by Otto et al. Otto et al. (2013) The observed decomposition is more pronounced than in the present simulation, which may either be due to the different composition in the experiment (CoCrFeMnCu), or the higher solubility of Cu in the EAM potential (see appendix). The authors found that the Cu segregation is driven by positive binary mixing enthalpies between copper and the remaining components Otto et al. (2013). Thus, when decreasing the temperature in experiment, there is a competition between the increasing thermodynamic driving force for decomposition and the decreasing diffusivity within the system. For this reason, HEAs often represent kinetically trapped metastable configurations at lower temperatures and local segregation occurs as an ageing phenomenon.
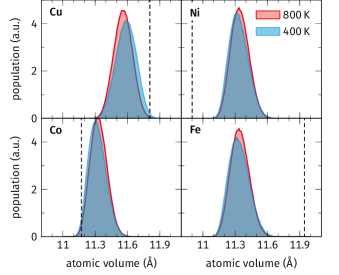
When comparing the atomic volumes as a function of the atom type (see Fig. 3), it can be seen that Cu has slightly larger values than Co, Ni, or Fe. Both Ni and Co possess higher atomic volumes in the multicomponent system than in their elemental state. In contrast, Cu and Fe exhibit smaller atomic volumes compared to their pure structures. At 400 K, the system starts demixing into a ternary Co, Ni, and Fe solid solution and into a copper-rich phase. The copper atoms expand slightly, while the ternary solid solution becomes slightly denser. This brings Cu, Co, and Ni closer to their preferred atomic volume. Only Fe deviates from this trend, but exhibits a positive Warren–Cowley parameter, indicating a preference for unlike neighbors. This changed chemical environment may influence the equilibrium volume.
In summary, these observations suggest that the small scale decomposition is driven largely by the mixing enthalpy at low temperatures, but additionally enhanced by atomic size effects.
III.2 Irradiation
Thus far, we studied the thermodynamic stability of a CuNiCoFe solid solution. In section III.1, we demonstrated by means of hybrid MC/MD simulations that CuNiCoFe exhibits a tendency for decomposition at lower temperatures (400 K). These results suggest that in this case a random distribution is only stabilized by kinetic inhibition. In the following, we will therefore discuss the effect of cascade events on the evolution of the chemical order, focusing on the question, if the energy that is released during recoil events enables the decomposition of Cu. We irradiate both the equilibrated, partially segregated sample obtained by MC/MD simulation at 400 K (“initially segregated”), and a sample with completely random element distribution (“initially random”). Additionally, we investigate the structural damage due to irradiation by comparison with a Ni sample.
III.2.1 Lattice defects
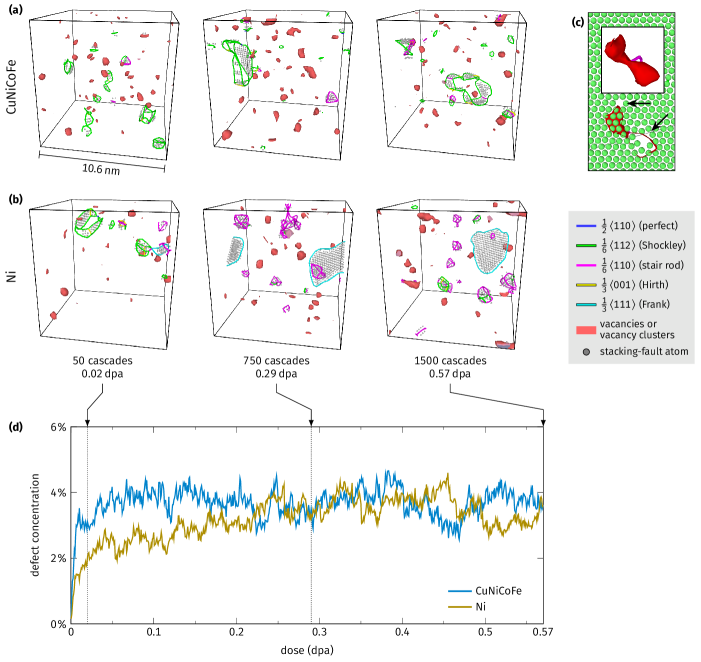
Earlier work comparing irradiation damage in elemental metals and disordered alloys suggests that the FCC structure is retained throughout irradiation with recoils Granberg et al. (2016). Figure 4(a) shows that this is also the case for the initially segregated HEA sample (equilibrated with MC/MD at 400 K). Since the structural damage in the initially random HEA is similar, we omit this sample from the discussion at hand. For comparison, Figure 4(b) shows a pure Ni reference sample which underwent the same irradiation treatment. Most irradiation damage in these samples manifests itself by the formation of dislocation loops, stacking-fault tetrahedra,
and single vacancies or vacancy clusters. Vacancy clusters and extended defect agglomerates cannot be identified by the DXA and are indicated by red defect meshes. A visualization of atom positions in Fig. 4c reveals that these regions are dominantly characterized by vacant lattice sites.
The nature of these regions has also been confirmed by a Wigner–Seitz cell defect analysis, which shows that the positions of the distorted regions
generally coincide with vacancy-type defect clusters (see videos cascade-CuNiCoFe.avi and cascade-Ni.avi in the supplementary material).
These vacancy-type defects are homogeneously distributed within the structure.
The irradiation process and therefore the formation and evolution of defects can be divided into three stages. Figures 4a and b visualize one representative configuration for each of the three stages. Figure 4d depicts the defect concentration as a function of the irradiation dose. Initially, the HEA shows a higher defect accumulation than the pure Ni system, which could be caused by higher atomic level stresses within the multicomponent system. This results in a reduced defect formation energy and thus increased number of defectsEgami et al. (2014). In turn, pure Ni exhibits a higher recombination rate due to an increased point defect mobility Zhang et al. (2015); Ullah et al. (2016), which means that fewer defects are created per recoil event. During the first cascades, mainly point defects occur in both structures, while the concentration of dislocation-network-like structures is still small.
In the second stage, with an increase of irradiation damage, the defect concentration in pure Ni increases and reaches the same magnitude as in the high-entropy structure.
It can be seen that apart from vacancies and stacking-fault tetrahedra, a rather large and stable dislocation loop is formed by the agglomeration of small defects during successive cascades.
In general, the rate of defect annihilation depends on both the size and the spatial distribution of the defects. Small defects can be annihilated if they are hit by a single recoil event, while larger defect structures are not engulfed completely and are therefore more stable. Furthermore, the agglomeration of defects in Ni leads to their localization, while the small defects in the HEA are more homogeneously distributed. This means that the probability of a cascade randomly hitting a defect is higher in the HEA and a steady state of annihilation and creation is reached (see video cascade-CuNiCoFe.avi in the supplementary material). A small number of stacking-fault tetrahedra appear, but seem to be unstable. Additionally, we can observe the formation of complex networks of partial dislocations. Because of the large amount of dislocation junctions, these networks must be sessile. Thus, large movements of these networks must again be a series of annihilation and creation events, and they are therefore also unstable against irradiation.
In Ni, the defects are assimilated into larger structures, such as sessile Frank dislocation loops, before they can be destroyed by the next cascade (see the video cascade-Ni.avi in the supplementary material, starting at 0:40; defect close to the center of the box). As such, Ni possesses a higher volume fraction of undisturbed lattice in which the net defect creation rate is always positive. Additionally, in contrast to the HEA, the stacking-fault tetrahedra are numerous.
In the final stage, we also observe a saturation of the defect concentration in pure Ni, while maintaining the steady state in the alloy system. The development of a steady state in the elemental structure is contrary to earlier publications Granberg et al. (2017), where a continuous growth of defect networks has been detected. The reason for a reduced growth rate of defect concentrations in Ni is a simulation size effect Levo et al. (2017), since the earlier simulation used larger simulation cells compared to the current work.
In order to examine the stability of the lattice defects in the absence of irradiation, an MD simulation at 800 K for 1 ns was performed for the initially segregated HEA. The results reveal neither large movement nor creation or dissolution of a significant number of defects, which indicates that the defects are stable and sessile even at elevated temperatures (see video reanneal-irradiated-CuNiCoFe.avi in the supplementary material).
III.2.2 Chemical order
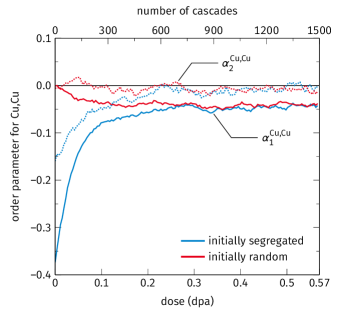
In the following we analyze whether high energy recoils are able to initiate local segregation processes, or if the SRO remains more or less constant after every subsequent cascade. Again, we use the Warren-Cowley parameters for the first and second neighbor shell to quantify the extent of atomic clustering. Figure 5 shows for two cells: the HEA with initially random atom distribution, and the HEA after MC/MD at 400 K which shows segregation tendencies for Cu. The analysis is limited to atoms in perfect FCC environments and therefore excludes atoms in defective sites introduced by the irradiation. Order parameters for pairs other than Cu–Cu are plotted in Fig. S1 in the supplementary material. We find that the order parameter , although exhibiting initial partial segregation in the structure pre-ordered by MC/MD, eventually converges to small negative values. The initially random structure converges to the same value. Mid-range order is always disturbed by irradiation: the parameter converges to zero in both cases. This shows that the cascade has two counteracting effects: Firstly, it locally activates the thermodynamically preferrable segregation of Cu. Secondly, it concurrently randomizes the element distribution. The resulting steady state is reached after approximately cascades.
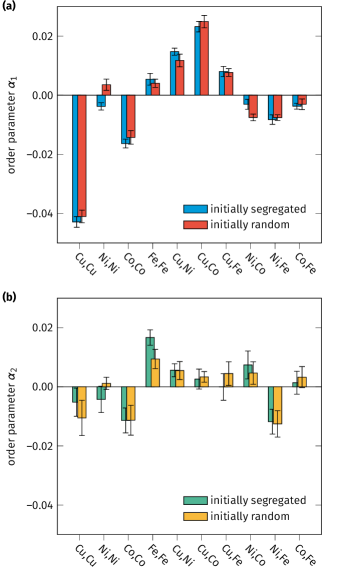
Figure 6 shows the comparison of the Warren-Cowley parameters for all pairs in the CuNiCoFe alloy for both structures (pre-ordered and fully random) after the full irradiation dose. Comparing these results to those in Fig. 2 (note the scale difference in the axes), we observe that the absolute values of both parameters and are reduced by roughly one order of magnitude due to the irradiation. Importantly, after irradiation all pairs have practically the same parameters regardless of the initial state. We also note that the values are consistently smaller than the , indicating that the ordering effects under irradiation are limited to the nearest-neighbor shell.
Based on this analysis, we conclude that while collisional cascades provide activation energy for demixing, the system is dynamically driven to a mostly random steady state, independent of the initial chemical order.
IV Post-Irradiation effects
| element | composition after irradiation | composition after subsequent MC/MD |
|---|---|---|
| Cu | ||
| Ni | ||
| Co | ||
| Fe |
Thermodynamic equilibration of a four-component CuNiCoFe alloy with a perfect FCC lattice showed a segregation tendency for Cu atoms. From the results of Sec. III.1 we can assume that there is not only a chemical but also a sterical driving force for Cu to segregate from the solid solution into small clusters. We already concluded that the growth of Cu clusters is accompanied by an increasing Cu atomic volume. Nevertheless, thus far, we mainly concentrated on the thermodynamics of the defect-free system. Therefore, we again ran hybrid MC/MD simulations in the VC-SGC ensemble. However, this time, the irradiated sample with pre-existing defects was taken as a starting configuration. Table 1 lists the composition inside the lattice defects. Obviously, defect sites that offer excess volume serve as sinks for Cu atoms and even enhance the amount of segregated Cu after equilibration. In this regard, the presence of defects enhances the driving force for local decomposition. Within the defects, we can find a Cu proportion which is approximately 50 . In contrast, during the irradiation the distribution of Cu atoms does not alter significantly. In Fig. 7 we visualized the atoms located within the defect structure before (left) and after (right) the equilibration. Copper atoms are displayed with a red color, while all others are shown in gray. Figures 7c and d highlight two defects separately. From these illustrations we draw the conclusion that Cu preferentially segregates on, e.g., the edges of stacking-fault tetrahedra rather than in the stacking faults themselves. The reason lies in the higher local excess volume of these sites (cf. Fig. 3).
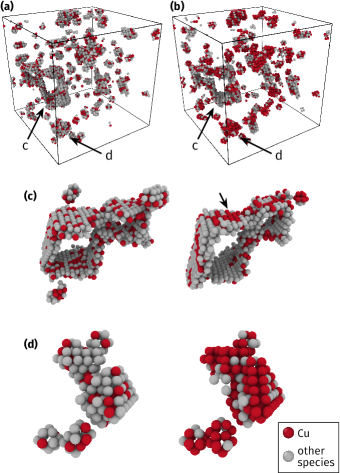
In conclusion, all results suggest that the mixing enthalpy of Cu is the decisive factor for phase stability in this case, exceeding the total entropy with decreasing temperature. The limited segregation tendencies of the perfect crystal are surpassed in the presence of defects, which act as sinks for copper.
V Conclusion
Using a model CuNiCoFe HEA with a tendency for copper segregation, we observe that the system reaches a steady state of defect concentration and of chemical order under irradiation, irrespective of the initial structure. In contrast to pure metals, irradiation leads to less mobile point defects and therefore a larger number of isolated defects instead of recombination or agglomeration. While, e.g., Ni increases its defect concentration continuously with increasing irradiation dose due to the agglomeration of defects in larger, more stable structures, the HEA quickly reaches a steady state of defect creation and annihilation. Irradiation provides the thermal activation for demixing of copper, but at the same time re-randomizes the elemental distribution. The resulting steady state of chemical order is close to a random solid solution, but still shows traces of local precipitation. Furthermore, our simulations reveal that various lattice defects act as sinks for copper, most likely since the copper atoms are the largest species and the defects provide excess volume. This clustering of copper at defects is also suppressed during irradiation for the reasons enumerated above. Together, these effects explain the high irradiation resistance of HEAs.
Supplementary material
See supplementary material for videos of the irradiation simulations, a figure of the detailed evolution of SRO during irradiation, and additional data for the verification of the EAM potential.
Acknowledgements.
The authors gratefully acknowledge travel grants through the PPP Finland program of the Deutscher Akademischer Austauschdienst (DAAD) and K.A. acknowledges financial support by the Deutsche Forschungsgemeinschaft (DFG) through project Grant No. STU 611/2-1. Computing time was made available by the Technische Universität Darmstadt on the Lichtenberg cluster and the IT Center for Science, CSC, Finland.| Cu (FCC) | Ni (FCC) | Co (FCC) | Co (HCP) | Fe (FCC) | Fe (BCC) | |||||||||||||
|---|---|---|---|---|---|---|---|---|---|---|---|---|---|---|---|---|---|---|
| Pot. | Ref. | Pot. | Ref. | Pot. | Ref. | Pot. | Ref. | Pot. | Ref. | Pot. | Ref. | |||||||
| (Å) | 3.615 | 3.615 | Lide (2003) | 3.520 | 3.524 | Lide (2003) | 3.549 | 3.545 | Lide (2003) | 2.501 | 2.507 | Lide (2003) | 3.628 | 3.647 | Lide (2003) | 2.866 | 2.867 | Lide (2003) |
| (Å) | 4.076 | 4.069 | Lide (2003) | |||||||||||||||
| 1.630 | 1.623 | Lide (2003) | ||||||||||||||||
| (eV/at.) | Kittel (2005) | Kittel (2005) | 111There are considerably different absolute values reported in literature. We assumed a difference of eV/atom to the HCP structure, while literature reports differences from eV/atom to eV/atom.,Cardellini and Mazzone (1993); de la Peña O’Shea et al. (2010) | Kittel (2005) | Müller, Erhart, and Albe (2007) | Kittel (2005) | ||||||||||||
| (GPa) | 170 | 168 | Lide (2003) | 246 | 248 | Lide (2003) | 213 | 225 | Gump et al. (1999) | 263 | 307 | Lide (2003) | 107 | 154 | Zarestky and Stassis (1987) | 229 | 226 | Lide (2003) |
| (GPa) | 122 | 122 | Lide (2003) | 147 | 155 | Lide (2003) | 157 | 160 | Gump et al. (1999) | 158 | 165 | Lide (2003) | 98 | 122 | Zarestky and Stassis (1987) | 136 | 140 | Lide (2003) |
| (GPa) | 124 | 103 | Lide (2003) | |||||||||||||||
| (GPa) | 363 | 358 | Lide (2003) | |||||||||||||||
| (GPa) | 76 | 76 | Lide (2003) | 125 | 124 | Lide (2003) | 99 | 92 | Gump et al. (1999) | 65 | 76 | Lide (2003) | 80 | 77 | Zarestky and Stassis (1987) | 117 | 116 | Lide (2003) |
| (mJ/m2) | 22 | 36–49 | Ogata, Li, and Yip (2002); Jin et al. (2008); Zimmerman, Gao, and Abraham (2000) | 97 | 133–183 | Jin et al. (2008); Zimmerman, Gao, and Abraham (2000) | ||||||||||||
| (mJ/m2) | 110 | 95–210 | 222Value for Ref. Ogata, Li, and Yip, 2002 computed by numeric integration of the stress data.,Ogata, Li, and Yip (2002); Jin et al. (2008); Zimmerman, Gao, and Abraham (2000) | 251 | 258 | Jin et al. (2008) | 174 | |||||||||||
| (GPa) | 2.3 | 2.2 | Ogata, Li, and Yip (2002) | 5.1 | 3.7 | |||||||||||||
| (mJ/m2) | 23 | 99 | ||||||||||||||||
| (mJ/m2) | 121 | 143 | Jin et al. (2008) | 298 | 186 | Jin et al. (2008) | 159 | |||||||||||
| (K) | 1175 | 1357 | Chakrabarti et al. (1991, 1994) | 1513 | 1728 | Chakrabarti et al. (1991, 1994) | 1756 | 1768 | Nishizawa and Ishida (1984) | 2044 | 1811 | Swartzendruber, Itkin, and Alcock (1991) | ||||||
Appendix A Validation of the EAM potential
We used an EAM potential by Zhou et al. Zhou, Johnson, and Wadley (2004) for the Cu-Ni-Co-Fe system. This potential was tested for HEAs under driven conditions: Thin-film growth by sputtering yields comparable structures to experiment and the BCC to FCC transition is reproduced correctly Xie et al. (2013, 2014). Furthermore, damage accumulation during irradiation agrees with data obtained by Rutherford backscattering spectrometry Zhang et al. (2017).
We performed additional validation of the potential by comparing the properties of the elements and of binary mixtures to reference values. In a first step, we produced FCC lattices of Cu, Ni, Co, and Fe, as well as HCP Co and BCC Fe. These were minimized to obtain the 0 K ground state values of the lattice constants and and the cohesive energy . The comparison to literature values in Table 2 reveals a good match. We then obtained the stiffness tensor using Hooke’s law by calculating the stress tensors for finite deformations of the box at 1% strain. Apart from HCP cobalt, which does not occur in our samples, and FCC iron, which is too soft, the reference values are reproduced quite well. Using the procedure described in Ref. Ogata, Li, and Yip, 2002, we calculated the stacking fault energy , the unstable stacking fault energy , and the critical shear stress for a stacking fault. While literature data contains large uncertainties and variations, the general trend of available data agrees with the predictions of the potential. As far as reference data is available, the same is true for the twinning faults, which we calculated using the method described in Ref. Tadmor and Hai, 2003. The negative values for the stacking and twinning faults in Co are of course the result of the lower energy of the stable HCP structure.
Furthermore, we calculated the elastic constants of those binary alloys, for which reference data is available, i.e., in the Fe–Co–Ni system. The results are presented in Table S.1 in the supplementary material. Since the cross terms of the potential are obtained through a mixing procedure, the results match the expectations from the properties of the elements: The elastic constants match well, except for alloys containing FCC iron or HCP cobalt, which are too soft. To additionally determine the melting points of the elements and some miscible alloys, liquid–solid interface simulations were carried out Ercolessi et al. (1993). A simulation cell of 2000 atoms was relaxed with the correct crystal structure and lattice constant, without pressure control. An equally sized box was molten and cooled down to the desired temperature, with pressure control in the direction. The two boxes where then combined in the direction, and were let to relax with pressure control in all directions. Below the melting point, the cell will solidify and the volume of the cell will decrease, while the opposite will happen above the melting point. Due to the chosen temperature stepping, an error of around 25 K is expected. The results are presented in Table S.2 in the supplementary material and show that the melting points slightly deviate from the reference values, but capture the features of the phase diagrams: For the pure elements the deviation of the melting point is below 15% of the absolute value. The melting point of HCP cobalt agrees with the literature value within the expected error of the simulation. The melting points of the different binary subsystems studied are all within 10% of the expected value. We point out that a good description of the melting points is particularly important for the irradiation simulations, since several previous studies show that the outcome of molecular dynamics of collision cascades depends directly on the melting point Nordlund et al. (1998b); Nordlund, Henriksson, and Keinonen (2001).
In a next step, random solid solutions of all binary subsystems on FCC lattices were prepared. Additionally, if the binary alloy contained Fe or Co, BCC or HCP lattices, respectivley, were created. Different molar fractions of each alloy and lattice type were minimized to obtain the mixing enthalpy
| (2) |
where , , , and are the molar fractions and enthalpies of the constituents A and B, and where is the total enthalpy of the alloy. We included mixing enthalpy curves of all binary subsystems with respect to the concentration into Figs. S.2–S.7 in the supplementary material and compared them to literature values. We additionally compared our results to data from the thermo-calc software and database The ; Andersson et al. (2002). In most cases the EAM potential correctly describes the trend observed in literature. However, it should be noted that even different literature values do not completely agree and that there is a large spread for some systems.
| (Å) | |||
| Pot. | Ref. | ||
| 3.536 | 3.526 | Coles (1956); Clarke and Spooner (1971) | |
| 3.591 | 3.564 | Coles (1956); Clarke and Spooner (1971) | |
| 3.643 | 3.609 | Coles (1956); Clarke and Spooner (1971) | |
| 3.568 | 3.551 | Predel (1993) | |
| 3.607 | 3.577 | Predel (1993) | |
| 3.636 | 3.668 | Predel (1993) | |
| 3.646 | 3.674 | Predel (1993) | |
| (BCC) | 2.890 | 2.890 | Klement (1965) |
| 3.648 | 3.616 | Klement (1965) | |
| 3.555 | 3.539 | Nishizawa et al. (1983) | |
| 3.554 | 3.538 | Nishizawa et al. (1983) | |
| 3.548 | 3.533 | Nishizawa et al. (1983) | |
| 3.548 | 3.533 | Nishizawa et al. (1983) | |
| 3.541 | 3.528 | Nishizawa et al. (1983) | |
| (BCC) | 2.869 | 2.867 | Swartzendruber, Itkin, and Alcock (1991) |
| 3.594 | 3.595 | Swartzendruber, Itkin, and Alcock (1991) | |
| 3.584 | 3.590 | Swartzendruber, Itkin, and Alcock (1991) | |
| 3.582 | 3.587 | Swartzendruber, Itkin, and Alcock (1991) | |
| 3.552 | 3.552 | Swartzendruber, Itkin, and Alcock (1991) | |
| (BCC) | 2.869 | 2.861 | Ellis and Greiner (1941) |
| 2.857 | 2.860 | Ellis and Greiner (1941) | |
In order to get a clearer picture, we investigated the miscibility gaps of the binary subsystems. For this, equimolar alloys on FCC lattices were equilibrated in the semi-grand-canonical ensemble without variance constraint. By systematically varying , final compositions ranging over the whole phase diagram were obtained. The simulations were performed at 300 K and 800 K. The concentration as a function of the chemical potential difference can be used to identify miscibility gaps in a binary subsystem: Given a dense mesh of values, miscibility gaps appear as discontinuities in the curves. Performing this analysis and comparing it to reference data showed that the potential is mostly able to reproduced phase diagram features, even though the miscibility is generally a bit too high. In the Co-containing systems, this method will not find the HCP phase, since the simulation setup was always initiated from an FCC structure. Due to the difference in unit cell shape, the simulation suppresses the transition to HCP. We omit this investigation, since the HEA remains in the FCC structure in all conditions. The curves and a more detailed discussion of all binary subsystems can be found in Figs. S.8–S.13 in the supplementary material.
Finally, the lattice constants of the binary systems were calculated from these simulations by time averaging the simulation cell volume of the different binary systems at 300 K. The data is shown in Table 3 and is in good agreement with experimental data. This confirms that the cross terms of the potential correctly predict the atomic volumes in alloys.
All in all, the potential performs reasonably well, reproducing the correct stable phases, densities, stiffnesses, and melting points. The limited data for stacking fault and twinning-fault energies suggests that lattice defects should be correctly reproduced. The main weakness of the potential is that the solubility of the alloys is too high in some cases, meaning that the tendencies for copper precipitation may be underestimated in the present work.
References
- Wang, Guo, and Liu (2014) Z. Wang, S. Guo, and C. T. Liu, JOM 66, 1966 (2014).
- Ye et al. (2016) Y. F. Ye, Q. Wang, J. Lu, C. T. Liu, and Y. Yang, Mater. Today 19, 349 (2016).
- Otto et al. (2013) F. Otto, Y. Yang, H. Bei, and E. P. George, Acta Mater. 61, 2628 (2013).
- Pickering and Jones (2016) E. J. Pickering and N. G. Jones, Int. Mater. Rev. 61, 183 (2016).
- Tasan et al. (2014) C. C. Tasan, Y. Deng, K. G. Pradeep, M. J. Yao, H. Springer, and D. Raabe, JOM 66, 1993 (2014).
- Yeh (2013) J.-W. Yeh, JOM 65, 1759 (2013).
- Widom et al. (2014) M. Widom, W. P. Huhn, S. Maiti, and W. Steurer, Metall. Mater. Trans. A 45, 196 (2014).
- Tsai and Yeh (2014) M.-H. Tsai and J.-W. Yeh, Mater. Res. Lett. 2, 107 (2014).
- Liu et al. (2014) W. H. Liu, Y. Wu, J. Y. He, Y. Zhang, C. T. Liu, and Z. P. Lu, JOM 66, 1973 (2014).
- Xie et al. (2014) L. Xie, P. Brault, J.-M. Bauchire, A.-L. Thomann, and L. Bedra, J. Phys. D: Appl. Phys. 47, 224004 (2014).
- Tian et al. (2013a) F. Tian, L. K. Varga, N. Chen, L. Delczeg, and L. Vitos, Phys. Rev. B 87, 075144 (2013a).
- Kao, Yeh, and Chin (2008) S.-W. Kao, J.-W. Yeh, and T.-S. Chin, J. Phys: Condens. Matter 20, 145214 (2008).
- Haglund et al. (2015) A. Haglund, M. Koehler, D. Catoor, E. P. George, and V. Keppens, Intermetallics 58, 62 (2015).
- Tian et al. (2013b) F. Tian, L. Delczeg, N. Chen, L. K. Varga, J. Shen, and L. Vitos, Phys. Rev. B 88, 085128 (2013b).
- Guo et al. (2013) S. Guo, Q. Hu, C. Ng, and C. T. Liu, Intermetallics 41, 96 (2013).
- Ng et al. (2014) C. Ng, J. Luan, Q. Wang, S. Shi, and C. Liu, J. Alloys Compd. 584, 530 (2014).
- Egami et al. (2014) T. Egami, W. Guo, P. D. Rack, and T. Nagase, Metall. Mater. Trans. A 45, 180 (2014).
- Zhang et al. (2015) Y. Zhang, G. M. Stocks, K. Jin, C. Lu, H. Bei, B. C. Sales, L. Wang, L. K. Béland, R. E. Stoller, G. D. Samolyuk, M. Caro, A. Caro, and W. J. Weber, Nat. Commun. 6, 8736 (2015).
- Granberg et al. (2016) F. Granberg, K. Nordlund, M. W. Ullah, K. Jin, C. Lu, H. Bei, L. M. Wang, F. Djurabekova, W. J. Weber, and Y. Zhang, Phys. Rev. Lett. 116, 135504 (2016).
- Granberg et al. (2017) F. Granberg, F. Djurabekova, E. Levo, and K. Nordlund, Nucl. Inst. Meth. Phys. Res. Sec. B. 393, 114 (2017).
- Yang et al. (2016) T. Yang, S. Xia, S. Liu, C. Wang, S. Liu, Y. Fang, Y. Zhang, J. Xue, S. Yan, and Y. Wang, Sci. Rep. 6, 32146 (2016).
- Ullah et al. (2016) M. W. Ullah, D. S. Aidhy, Y. Zhang, and W. J. Weber, Acta Mater. 109, 17 (2016).
- Foiles, Baskes, and Daw (1986) S. M. Foiles, M. I. Baskes, and M. S. Daw, Phys. Rev. B 33, 7983 (1986).
- Zhou, Johnson, and Wadley (2004) X. W. Zhou, R. A. Johnson, and H. N. G. Wadley, Phys. Rev. B 69, 144113 (2004).
- Jacob, Raj, and Rannesh (2007) K. T. Jacob, S. Raj, and L. Rannesh, Int. J. Mater. Res. 98, 776 (2007).
- Plimpton (1995) S. Plimpton, J. Comp. Phys. 117, 1 (1995), http://lammps.sandia.gov/.
- Sadigh et al. (2012) B. Sadigh, P. Erhart, A. Stukowski, A. Caro, E. Martinez, and L. Zepeda-Ruiz, Phys. Rev. B 85, 184203 (2012).
- Brink, Koch, and Albe (2016) T. Brink, L. Koch, and K. Albe, Phys. Rev. B 94, 224203 (2016).
- (29) K. Nordlund, parcas computer code (2016). The main principles of the molecular dynamics algorithms are presented in Refs. Nordlund et al., 1998a; Ghaly, Nordlund, and Averback, 1999. The adaptive time step and electronic stopping algorithms are the same as in Ref. Nordlund, 1995. The 2016 version of the code is published in the online supplementary material to Ref. Granberg et al., 2016.
- Berendsen et al. (1984) H. J. C. Berendsen, J. P. M. Postma, W. F. van Gunsteren, A. DiNola, and J. R. Haak, J. Chem. Phys. 81, 3684 (1984).
- Ziegler, Biersack, and Littmark (1985) J. F. Ziegler, J. P. Biersack, and U. Littmark, The Stopping and Range of Ions in Matter (Pergamon, New York, 1985).
- Ziegler (1996) J. F. Ziegler, (1996), SRIM-96 computer code, private communication.
- ASTM Standard E693-94 (1994) ASTM Standard E693-94, “Standard practice for characterising neutron exposure in iron and low alloy steels in terms of displacements per atom (dpa),” (1994).
- Nordlund et al. (2015) K. Nordlund, S. J. Zinkle, T. Suzudo, R. S. Averback, A. Meinander, F. Granberg, L. Malerba, R. Stoller, F. Banhart, B. Weber, F. Willaime, S. Dudarev, and D. Simeone, Primary radiation damage in materials: Review of current understanding and proposed new standard displacement damage model to incorporate in-cascade mixing and defect production efficiency effects (OECD Nuclear Energy Agency, Paris, France, 2015) available online at https://www.oecd-nea.org/science/docs/2015/nsc-doc2015-9.pdf.
- Zhang et al. (2017) S. Zhang, K. Nordlund, F. Djurabekova, F. Granberg, Y. Zhang, and T. S. Wang, Mater. Res. Lett. (2017), 10.1080/21663831.2017.1311284.
- Cowley (1950) J. M. Cowley, Phys. Rev. 77, 669 (1950).
- Stukowski (2010) A. Stukowski, Model. Simul. Mater. Sci. Eng. 18, 015012 (2010), http://ovito.org/.
- Voronoï (1908a) G. Voronoï, J. Reine Angew. Math. 133, 97 (1908a).
- Voronoï (1908b) G. Voronoï, J. Reine Angew. Math. 134, 198 (1908b).
- Voronoï (1909) G. Voronoï, J. Reine Angew. Math. 136, 67 (1909).
- Brostow et al. (1998) W. Brostow, M. Chybicki, R. Laskowski, and J. Rybicki, Phys. Rev. B 57, 13448 (1998).
- Honeycutt and Andersen (1987) J. D. Honeycutt and H. C. Andersen, J. Phys. Chem. 91, 4950 (1987).
- Stukowski (2012) A. Stukowski, Model. Simul. Mater. Sci. Eng. 20, 045021 (2012).
- Stukowski, Bulatov, and Arsenlis (2012) A. Stukowski, V. V. Bulatov, and A. Arsenlis, Model. Simul. Mater. Sci. Eng. 20, 085007 (2012).
- Nordlund et al. (1998a) K. Nordlund, M. Ghaly, R. S. Averback, M. Caturla, T. Diaz de la Rubia, and J. Tarus, Phys. Rev. B 57, 7556 (1998a).
- Nordlund and Gao (1999) K. Nordlund and F. Gao, Appl. Phys. Lett. 74, 2720 (1999).
- Levo et al. (2017) E. Levo, F. Granberg, C. Fridlund, K. Nordlund, and F. Djurabekova, J. Nucl. Mater. (2017), 10.1016/j.jnucmat.2017.04.023.
- Lide (2003) D. R. Lide, ed., CRC Handbook of Chemistry and Physics, 84th ed. (CRC Press, Boca Raton, Florida, USA, 2003).
- Kittel (2005) C. Kittel, Introduction to Solid State Physics, 8th ed. (John Wiley & Sons, Inc., 2005).
- Cardellini and Mazzone (1993) F. Cardellini and G. Mazzone, Philos. Mag. A 67, 1289 (1993).
- de la Peña O’Shea et al. (2010) V. A. de la Peña O’Shea, I. de P. R. Moreira, A. Roldán, and F. Illas, J. Chem. Phys. 133, 024701 (2010).
- Müller, Erhart, and Albe (2007) M. Müller, P. Erhart, and K. Albe, J. Phys.: Condens. Matter 19, 326220 (2007).
- Gump et al. (1999) J. Gump, H. Xia, M. Chirita, R. Sooryakumar, M. A. Tomaz, and G. R. Harp, J. Appl. Phys. 86, 6005 (1999).
- Zarestky and Stassis (1987) J. Zarestky and C. Stassis, Phys. Rev. B 35, 4500 (1987).
- Ogata, Li, and Yip (2002) S. Ogata, J. Li, and S. Yip, Science 298, 807 (2002).
- Jin et al. (2008) Z.-H. Jin, P. Gumbsch, K. Albe, E. Ma, K. Lu, H. Gleiter, and H. Hahn, Acta Mater. 56, 1126 (2008).
- Zimmerman, Gao, and Abraham (2000) J. A. Zimmerman, H. Gao, and F. F. Abraham, Model. Simul. Mater. Sci. Eng. 8, 103 (2000).
- Chakrabarti et al. (1991) D. J. Chakrabarti, D. E. Laughlin, S. W. Chen, and Y. A. Chang, “Phase diagrams of binary nickel alloys,” (ASM, Metals Park, OH, USA, 1991) Chap. Cu–Ni (Copper–Nickel), pp. 85–95.
- Chakrabarti et al. (1994) D. J. Chakrabarti, D. E. Laughlin, S. W. Chen, and Y. A. Chang, “Phase diagrams of binary copper alloys,” (ASM International, Materials Park, OH, USA, 1994) Chap. Cu–Ni (Copper–Nickel), pp. 266–270.
- Nishizawa and Ishida (1984) T. Nishizawa and K. Ishida, Bull. Alloy Phase Diagrams 5, 161 (1984).
- Swartzendruber, Itkin, and Alcock (1991) L. J. Swartzendruber, V. P. Itkin, and C. B. Alcock, J. Phase Equilib. 12, 288 (1991).
- Xie et al. (2013) L. Xie, P. Brault, A.-L. Thomann, and J.-M. Bauchire, Appl. Surf. Sci. 285, Part B, 810 (2013).
- Tadmor and Hai (2003) E. B. Tadmor and S. Hai, J. Mech. Phys. Solids 51, 765 (2003).
- Ercolessi et al. (1993) F. Ercolessi, O. Tomagnini, S. Iarlori, and E. Tosatti, “Nanosources and manipulation of atoms under high fields and temperatures: Applications,” (Kluwer, Dordrecht, Netherlands, 1993) Chap. Molecular dynamics simulations of metal surfaces, pp. 185–205.
- Nordlund et al. (1998b) K. Nordlund, L. Wei, Y. Zhong, and R. S. Averback, Phys. Rev. B 57, 13965 (1998b).
- Nordlund, Henriksson, and Keinonen (2001) K. Nordlund, K. O. E. Henriksson, and J. Keinonen, Appl. Phys. Lett. 79, 3624 (2001).
- (67) Thermo-Calc Software, TC Binary Solutions Database, Version 1.0, http://www.thermocalc.com/ (accessed 26 July 2017).
- Andersson et al. (2002) J. O. Andersson, T. Helander, L. Höglund, S. P. F., and B. Sundman, Calphad 26, 273 (2002).
- Coles (1956) B. R. Coles, J. Inst. Met. 84, 346 (1956).
- Clarke and Spooner (1971) J. K. A. Clarke and T. A. Spooner, J. Phys. D Appl. Phys. 4, 1196 (1971).
- Predel (1993) B. Predel, “Landolt–Börnstein – Group IV Physical Chemistry · Volume 5C: Ca-Cd – Co-Zr,” (Springer-Verlag Berlin Heidelberg, 1993) Chap. Co–Cu (Cobalt–Copper).
- Klement (1965) W. Klement, Trans Metall Soc. AIME, Transactions 233, 1180 (1965).
- Nishizawa et al. (1983) T. Nishizawa, S. Hao, M. Hasebe, and K. Ishida, Acta Metall. 31, 1403 (1983).
- Ellis and Greiner (1941) W. Ellis and E. Greiner, Trans. Asm 29, 415 (1941).
- Ghaly, Nordlund, and Averback (1999) M. Ghaly, K. Nordlund, and R. S. Averback, Philos. Mag. A 79, 795 (1999).
- Nordlund (1995) K. Nordlund, Comput. Mater. Sci. 3, 448 (1995).
See pages 1 of supplementary-material.pdf See pages 2 of supplementary-material.pdf See pages 3 of supplementary-material.pdf See pages 4 of supplementary-material.pdf See pages 5 of supplementary-material.pdf See pages 6 of supplementary-material.pdf See pages 7 of supplementary-material.pdf See pages 8 of supplementary-material.pdf See pages 9 of supplementary-material.pdf See pages 10 of supplementary-material.pdf See pages 11 of supplementary-material.pdf See pages 12 of supplementary-material.pdf See pages 13 of supplementary-material.pdf See pages 14 of supplementary-material.pdf See pages 15 of supplementary-material.pdf See pages 16 of supplementary-material.pdf See pages 17 of supplementary-material.pdf