Controlling the topological sector of magnetic solitons in exfoliated Cr1/3NbS2 crystals
Résumé
We investigate manifestations of topological order in monoaxial helimagnet Cr1/3NbS2 by performing transport measurements on ultra-thin crystals. Upon sweeping the magnetic field perpendicularly to the helical axis, crystals thicker than one helix pitch (48 nm) but much thinner than the magnetic domain size (1 m) are found to exhibit sharp and hysteretic resistance jumps. We show that these phenomena originate from transitions between topological sectors with different number of magnetic solitons. This is confirmed by measurements on crystals thinner than 48 nm –in which the topological sector cannot change– that do not exhibit any jump or hysteresis. Our results show the ability to deterministically control the topological sector of finite-size Cr1/3NbS2 and to detect inter-sector transitions by transport measurements.
The properties of many electronic systems are characterized by topological indices that allow all possible states to be grouped into distinct topological sectors Monastyrskiĭ (1993); Volovik (2003); Altland and Simons (2010); Fradkin (2013); Qi and Zhang (2011). Since topological indices assume discrete values, changes in topological sector can only occur through abrupt transitions that can be detected experimentally. Investigating these transitions under controlled conditions and probing properties associated to "topological order", however, is not simple, as it requires the ability to tune the state of the system in a predefined topological sector, i.e. to deterministically set the topological indices of the system by acting on experimental parameters. Here we show that this level of control can be achieved by means of magneto-resistance measurements on mechanically exfoliated crystals of monoaxial chiral helimagnet Cr1/3NbS2.
Our experiments build on earlier work that has established the key properties of Cr1/3NbS2, a layered material consisting of alternating NbS2 and Cr planes (see Fig. 1(a)) Parkin and Friend (1980a, b); Moriya and Miyadai (1982); Miyadai et al. (1983); Yurii (1984); Kousaka et al. (2009); Togawa et al. (2012); Ghimire et al. (2013); Togawa et al. (2013); Chapman et al. (2014); Bornstein et al. (2015); Tsuruta et al. (2016a). At low temperature, the spins on the Cr atoms order ferromagnetically in each plane, forming a helix that winds around the direction perpendicular to the planes (Fig. 1(b), the zero-field helix pitch is 48 nm) Miyadai et al. (1983); Kousaka et al. (2009); Togawa et al. (2012); Ghimire et al. (2013); Togawa et al. (2013). Lorentz microscopy has shown that in-plane magnetic field causes the helix to deform, resulting in a so-called chiral soliton lattice Togawa et al. (2012). The lattice (Fig. 1(b)) consists of narrow regions in which the spins make a complete 2 revolution (the solitons), separated by stretches of ferromagnetically aligned spins, whose extension –which determines the lattice period – increases upon increasing (Fig. 1(c)) Togawa et al. (2012). The observed microscopic evolution of the helix, as well as the detailed magnetic response of bulk crystals, conform quantitatively to a theoretical (one-dimensional) model proposed by Dzyaloshinskii over 50 years ago, comprising Heisenberg and Dzyaloshinskii-Moriya interactions between nearest neighboring spins (besides the Zeeman term in the presence of a magnetic field and a magnetic anisotropy term that forces the spins to point perpendicularly to the helix direction) Dzyaloshinskii (1958); Moriya (1960).
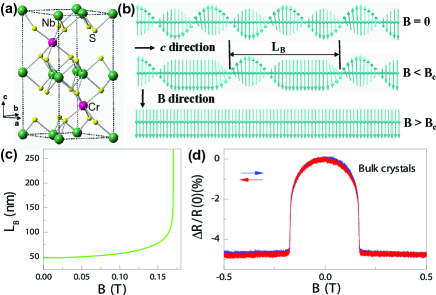
Whenever it is spatially confined, the chiral soliton lattice in Cr1/3NbS2 is predicted to exhibit interesting phenomena Kishine et al. (2014); Tsuruta et al. (2015); Togawa et al. (2015); Tsuruta et al. (2016b). Some of these phenomena have been observed recently in small specimen (10 m in linear dimensions) cut from bulk crystals, in which confinement originates from the presence of magnetic domains extending for approximately 1 m in the helix direction Togawa et al. (2015). Upon increasing , the separation between solitons increases, so that their total number in each finite-size domain decreases. Since the number of solitons corresponds to the total spin winding number that is a topological index, the soliton number can only change through discrete transitions. These transitions have been detected by analyzing Lorentz microscope images Togawa et al. (2015). It was argued that hysteresis and a sequence of jumps present in the magneto-resistance of small specimen, but absent in bulk crystals (see Fig. 1(d)), are a transport manifestation of the changes in soliton number Togawa et al. (2015); Tsuruta et al. (2016b). This conclusion is very interesting, as it implies the ability to probe topological aspects of the magnetic state of Cr1/3NbS2 by monitoring transport properties. Its validity is however unclear because the magneto-resistance jumps could not be directly linked to specific changes in the soliton configuration, and because it was not ruled out that the jumps may originate from domain switching.
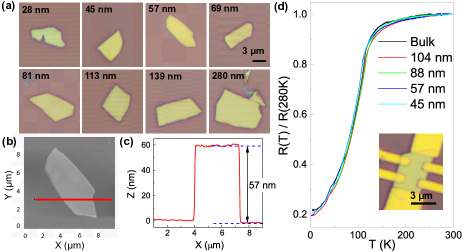
To avoid these problems, we investigate these same phenomena by working with Cr1/3NbS2 crystals much thinner than the magnetic domain size. Fig. 2(a) shows optical microscope images of a selection of crystals having thickness () between 28 and 300 nm, whose surfaces are parallel to the NbS2 and the Cr planes. The magnetic helix is oriented perpendicular to the substrate, so that the crystal thickness determines the number of solitons present at . We produced these crystals, up to 500 times thinner than the specimen studied in Ref. Togawa et al. (2015), by means of mechanical exfoliation, following the same procedure used to extract graphene from graphite. Exfoliation is more difficult for Cr1/3NbS2 because of strong chemical bonds between the Cr and S atoms; nevertheless, atomic force microscope images (see Figs. 2(b-c)) show that the crystal surface is flat and uniform.
Transport through Cr1/3NbS2 crystals as thin as the ones discussed here has not been investigated earlier and it is important to identify which properties depend on thickness and which do not. Fig. 2(d) shows that all exfoliated crystals exhibit the same temperature dependence of the resistance (identical to that of the bulk). A pronounced decrease in resistance starts around K, corresponding to the transition temperature to the helimagnetic state. Since is determined by the strength of the microscopic interactions between nearest neighboring spins (and –in the range investigated here– not by the thickness) this behavior is not surprising Bak and Jensen (1980). Nevertheless, the excellent reproducibility upon varying the thickness is worth commenting, as it indicates the absence of any significant material degradation (not warranted a priori for thin crystals exposed to air during exfoliation and device fabrication).
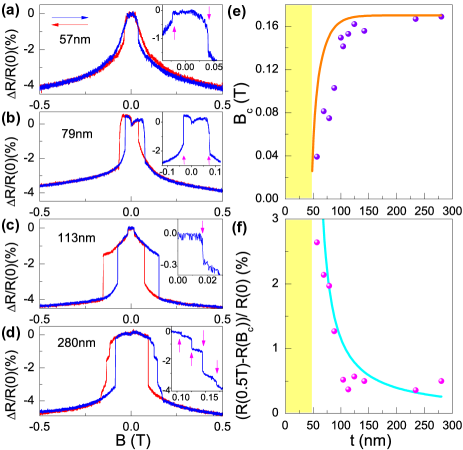
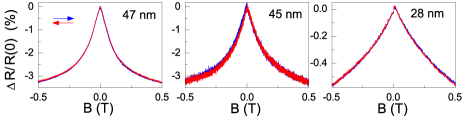
The relative change in resistance upon the application of an in-plane magnetic field, , is shown in Figs. 3(a-d) for several crystals containing one ((a,b); nm and 79 nm respectively), two ((c); nm), and five ((d); nm) complete helix periods at . The behavior is representative of what we observed in more than 10 devices realized with crystal having thickness between approximately 50 and 300 nm, exhibiting common features and systematic trends. For these crystals, hysteresis in the magneto-resistance upon reversing the sweeping direction of the applied field is always present, and is accompanied by sharp jumps. The phenomena cannot originate from magnetic domains, since all crystals are significantly thinner than the domain size Togawa et al. (2015). We find that the number of jumps tends to increase with increasing the crystal thickness, seemingly correlating with the number of complete periods present in the magnetic helix at (determined by where is the helix pitch). For instance, the crystals in Figs. 3(a) and 3(b) contain one full period and exhibit one jump, the crystal with nm (Fig. 3(c)) contains two full periods and exhibits two jumps. The nm crystal contains five full periods at , and four jumps are observed, but the jump at 0.17 T appears to be smeared, suggesting that it may originate from two jumps that are not resolved individually. The magnetic field at which the last jump occurs systematically increases with increasing crystal thickness, as shown in Fig. 3(e). Finally, the total change in the relative magneto-resistance measured after the last jump decreases with increasing thickness (see Fig. 3(f); this same quantity vanishes in bulk crystals).
All the observed trends can be understood in terms of a theoretical model known to properly describe the magnetic state of Cr1/3NbS2 (the model is discussed in several papers and here we only recall the key conceptual aspects; see also Supplemental Material Sup ) Togawa et al. (2012, 2013); Chapman et al. (2014); Bornstein et al. (2015); Tsuruta et al. (2015); Borisov et al. (2009); Kishine et al. (2011). The model enables the spin configuration to be determined through the minimization of the system energy expressed as a functional of the local magnetization. Its validity for Cr1/3NbS2 has been established by direct comparison with Lorentz microscopy experiments and magnetization measurements, which enable the model parameters to be extracted quantitatively Togawa et al. (2012, 2015). The model has also been applied to strained MnSi thin-films Wilson et al. (2013); Karhu et al. (2012) 111Bulk MnSi is not a chiral helical magnet, but MnSi thin-films are in a narrow range of thicknesses, due to strain from the substrate Wilson et al. (2013); Karhu et al. (2012). to interpret magneto-transport data closely related to the ones discussed here. In this context, it was assumed that all changes causing a better aligned spin configuration result in smaller measured resistance Sup .
In this same spirit, we reproduce some of the known results by solving the model numerically as a function of for crystals of different thicknesses, and we use the numerical solutions to illustrate the aspects of the behavior that account for the experimentally observed trends Sup . Fig. 4(a-c) show the lowest energy spin configuration –represented by the component of the spin on the chromium atoms planes– calculated at for crystals having , 2.5 , 5.5 (hosting respectively 1, 2, and 5 complete spin windings). For any given thickness, we calculate the spin configuration that minimizes the energy as the magnetic field is increased. This is done by minimizing the energy in each topological sector separately and comparing the resulting values to determine the absolute minimum. The outcome of this procedure is illustrated in Fig. 4(d) for the crystal. The lowest energy state at contains two magnetic solitons (Fig. 4(b)), but at a sufficiently large in-plane magnetic field the state with one soliton (Fig. 4(e)) becomes energetically favorable. At even larger , the state with no solitons has the lowest energy, and all the spins are aligned, except those in proximity of the surfaces (Fig. 4(f)). Past this field, any further increase in only causes a gradual alignment of these spins. Such a sequence of transitions, with the number of solitons decreasing monotonously upon increasing , is what the model predicts for all values of (not only for ).
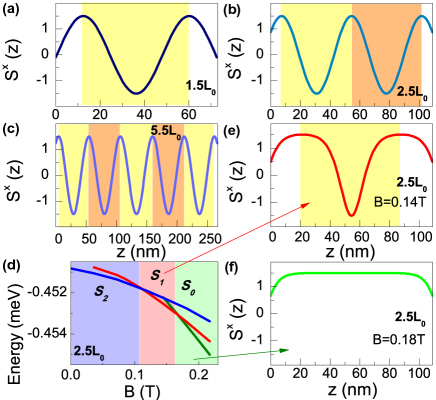
This behavior accounts for all the experimentally observed trends. At each transition the resistance decreases, exhibiting a jump, because in configurations with a smaller number of solitons the spins are on average better aligned to the applied field Sup . Therefore, the total number of jumps in the magneto-resistance equals the number of transition between states with different number of solitons, which can be calculated (and typically corresponds to the largest integer smaller than ). This is indeed in line with the experimental observations. Hysteresis is expected theoretically because configurations with number of solitons differing by one have different parity relative to the center of the crystals, so that whenever the system undergoes a transition, the spin configuration changes abruptly over the entire crystal. As a result, there is an energy barrier between solutions with different number of solitons, so that upon small variation of the system stays in the local minimum even when this is not the lowest energy configuration. The values of at which the transitions occur can be calculated as a function of and compared to the experiments. We focus on the last transition observed upon increasing past (i.e., the transition between the configurations containing 1 and 0 solitons), because this transition is present in all crystals with nm, giving us enough statistics for a meaningful quantitative comparison 222The -values at which the transitions occur depend on thickness that –for exfoliated crystals– cannot be deterministically controlled. This makes it difficult to compare the precise value of magnetic field for which a generic resistance jump is expected to occur with theory. Since devices of all thicknesses exhibit the jump corresponding to the transition to the ferromagnetic state, for this transition it is nevertheless possible to obtain enough data to make a statistically significant comparison.. The data are systematic and the agreement with calculation is very good (see Fig. 3(e)). Finally, the model also explains the trend seen in the magnitude of the magneto-resistance measured upon varying past . In this regime the magneto-resistance decreases because the spins next to the two crystals surfaces (see Fig. 4(f)) align progressively to the applied field as is increased. The gradual decrease in resistance is therefore a surface effect whose magnitude should be expected to decay approximately as and vanish in the bulk. This indeed agrees with the experiments (see Fig. 3(f), and Fig. 1(d) for the behavior of the bulk).
The relevance of these results stem from the fact that, contrary to all earlier work on Cr1/3NbS2 Togawa et al. (2015); Tsuruta et al. (2016b), the crystals investigated here are substantially thinner than the magnetic domain size, so that domain switching can be excluded as possible origin of the phenomena. This and the agreement between observations and theoretically expected trends allow us to conclude that the observed jumps and the hysteresis do originate from transitions between states with different soliton number. The use of exfoliated crystals enables us to obtain further evidence supporting this conclusion, as it allows us to investigate crystals thinner than the helix pitch, a regime that has not been explored so far. No jumps and hysteresis in the magneto-resistance should be expected, because in this regime the soliton number vanishes for all values of , and no topological transition can occur. Fig. 5 shows that this is indeed the case: in all Cr1/3NbS2 crystals thinner than the helix pitch at only a negative magneto-resistance is observed due to the gradual spin alignment upon increasing . No jumps or hysteresis are present. This drastic qualitative difference in behavior observed upon changing the crystal thickness by only a few nanometers is striking. It provides conclusive evidence that in Cr1/3NbS2 the topological sector of the system can be controlled and probed by transport measurements.
In summary, we have performed experiments on very thin exfoliated crystals showing that the number of solitons in Cr1/3NbS2 can be controlled by selecting the appropriate crystal thickness and by acting on the applied field. The experiments further show that changes in the number of solitons manifest themselves in hysteretic magneto-resistance jumps. These results imply that the topological sector of the system can be deterministically controlled and probed by transport measurements.
L.W., D.-K.K., and A.F.M. are indebted to A. Ferreira for continuous technical assistance. N.C., F.M. and A.F.M. acknowledge financial support from the Swiss National Science Foundation. A.F.M. gratefully acknowledges financial support from the EU Graphene Flagship project. L.L. and D.M. acknowledge support from the National Science Foundation under grant No. DMR-1410428. F.L. and W.Z. are supported by LANL through LDRD program. I.M. acknowledges support from Department of Energy, Office of Basic Energy Science, Materials Science and Engineering Division. O.S.O supported by the Laboratory Directed Research and Development Program of Oak Ridge National Laboratory, managed by UT-Battelle, LLC, for the U. S. Department of Energy.
Références
- Monastyrskiĭ (1993) M. I. Monastyrskiĭ, Topology of gauge fields and condensed matter (Plenum Press, New York, 1993).
- Volovik (2003) G. E. Volovik, The universe in a helium droplet, International series of monographs on physics (Clarendon Press ; Oxford University Press, Oxford New York, 2003).
- Altland and Simons (2010) A. Altland and B. Simons, Condensed matter field theory, 2nd ed. (Cambridge University Press, Cambridge ; New York, 2010).
- Fradkin (2013) E. Fradkin, Field theories of condensed matter physics, 2nd ed. (Cambridge University Press, Cambridge, 2013).
- Qi and Zhang (2011) X.-L. Qi and S.-C. Zhang, Rev. Mod. Phys. 83, 1057 (2011).
- Parkin and Friend (1980a) S. S. P. Parkin and R. H. Friend, Phil. Mag. B 41, 65 (1980a).
- Parkin and Friend (1980b) S. S. P. Parkin and R. H. Friend, Physica B+C 99, 219 (1980b).
- Moriya and Miyadai (1982) T. Moriya and T. Miyadai, Solid State Commun. 42, 209 (1982).
- Miyadai et al. (1983) T. Miyadai, K. Kikuchi, H. Kondo, S. Sakka, M. Arai, and Y. Ishikawa, J. Phys. Soc. Jpn. 52, 1394 (1983).
- Yurii (1984) A. I. Yurii, Sov. Phys. Uspekhi 27, 845 (1984).
- Kousaka et al. (2009) Y. Kousaka, Y. Nakao, J. Kishine, M. Akita, K. Inoue, and J. Akimitsu, Nuc. Ins. Met. Phys. Res. Sec. A 600, 250 (2009).
- Togawa et al. (2012) Y. Togawa, T. Koyama, K. Takayanagi, S. Mori, Y. Kousaka, J. Akimitsu, S. Nishihara, K. Inoue, A. S. Ovchinnikov, and J. Kishine, Phys. Rev. Lett. 108, 107202 (2012).
- Ghimire et al. (2013) N. J. Ghimire, M. A. McGuire, D. S. Parker, B. Sipos, S. Tang, J. Q. Yan, B. C. Sales, and D. Mandrus, Phys. Rev. B 87, 104403 (2013).
- Togawa et al. (2013) Y. Togawa, Y. Kousaka, S. Nishihara, K. Inoue, J. Akimitsu, A. S. Ovchinnikov, and J. Kishine, Phys. Rev. Lett. 111, 197204 (2013).
- Chapman et al. (2014) B. J. Chapman, A. C. Bornstein, N. J. Ghimire, D. Mandrus, and M. Lee, Appl. Phys. Lett. 105, 072405 (2014).
- Bornstein et al. (2015) A. C. Bornstein, B. J. Chapman, N. J. Ghimire, D. G. Mandrus, D. S. Parker, and M. Lee, Phys. Rev. B 91, 184401 (2015).
- Tsuruta et al. (2016a) K. Tsuruta, M. Mito, H. Deguchi, J. Kishine, Y. Kousaka, J. Akimitsu, and K. Inoue, Phys. Rev. B 93, 104402 (2016a).
- Dzyaloshinskii (1958) I. E. Dzyaloshinskii, J. Phys. Chem. Solids 4, 241 (1958).
- Moriya (1960) T. Moriya, Phys. Rev. 120, 91 (1960).
- Kishine et al. (2014) J. Kishine, I. G. Bostrem, A. S. Ovchinnikov, and V. E. Sinitsyn, Phys. Rev. B 89, 014419 (2014).
- Tsuruta et al. (2015) K. Tsuruta, M. Mito, Y. Kousaka, J. Akimitsu, J. Kishine, Y. Togawa, H. Ohsumi, and K. Inoue, J. Phys. Soc. Jpn. 85, 013707 (2015).
- Togawa et al. (2015) Y. Togawa, T. Koyama, Y. Nishimori, Y. Matsumoto, S. McVitie, D. McGrouther, R. L. Stamps, Y. Kousaka, J. Akimitsu, S. Nishihara, K. Inoue, I. G. Bostrem, V. E. Sinitsyn, A. S. Ovchinnikov, and J. Kishine, Phys. Rev. B 92, 220412 (2015).
- Tsuruta et al. (2016b) K. Tsuruta, M. Mito, Y. Kousaka, J. Akimitsu, J. Kishine, Y. Togawa, and K. Inoue, J. Appl. Phys. 120, 5 (2016b).
- Bak and Jensen (1980) P. Bak and M. H. Jensen, J. Phys. C 13, L881 (1980).
- (25) See Supplemental Material at [URL will be inserted by publisher] for a detailed description of our model, the values of parameters used for the numerical calculations, and the results.
- Borisov et al. (2009) A. B. Borisov, J. Kishine, I. G. Bostrem, and A. S. Ovchinnikov, Phys. Rev. B 79, 134436 (2009).
- Kishine et al. (2011) J. Kishine, I. V. Proskurin, and A. S. Ovchinnikov, Phys. Rev. Lett. 107, 017205 (2011).
- Wilson et al. (2013) M. N. Wilson, E. A. Karhu, D. P. Lake, A. S. Quigley, S. Meynell, A. N. Bogdanov, H. Fritzsche, U. K. Rößler, and T. L. Monchesky, Phys. Rev. B 88, 214420 (2013).
- Karhu et al. (2012) E. A. Karhu, U. K. Rößler, A. N. Bogdanov, S. Kahwaji, B. J. Kirby, H. Fritzsche, M. D. Robertson, C. F. Majkrzak, and T. L. Monchesky, Phys. Rev. B 85, 094429 (2012).
- Note (1) Bulk MnSi is not a chiral helical magnet, but MnSi thin-films are in a narrow range of thicknesses, due to strain from the substrate Wilson et al. (2013); Karhu et al. (2012).
- Note (2) The -values at which the transitions occur depend on thickness that –for exfoliated crystals– cannot be deterministically controlled. This makes it difficult to compare the precise value of magnetic field for which a generic resistance jump is expected to occur with theory. Since devices of all thicknesses exhibit the jump corresponding to the transition to the ferromagnetic state, for this transition it is nevertheless possible to obtain enough data to make a statistically significant comparison.
Supplemental Materials
I Numerical results
The Cr1/3NbS2 is effectively described by the following microscopic Hamiltonian:
| (1) |
where is the coupling constant of the Dzyaloshinsky-Moriya interaction, corresponds to the magnetocrystalline anisotropy and is the external magnetic field. The ratios and are taken from Ref. [15]. The ferromagnetic coupling constant has been adjusted to , so that the numerical value of the critical field in the thermodynamic limit matches the critical field for the bulk crystal (see Fig.1(d) of the main text).
In the main text we stated that each transition between topological sectors observed upon increasing the in-plane magnetic field leads to a progressively better average alignment of the spin in the field direction. Since such a better alignment results in a lower measured resistance, this explains why the transitions between different topological are accompanied by the jumps in which the resistance value is systematically lowered. Here we use the theoretical model to calculate the evolution of the magnetization upon increasing the magnetic field, to show that the magnetization does indeed increase in "jumps" in correspondence of each transitions from one topological sector to another one with a smaller number of magnetic solitons.
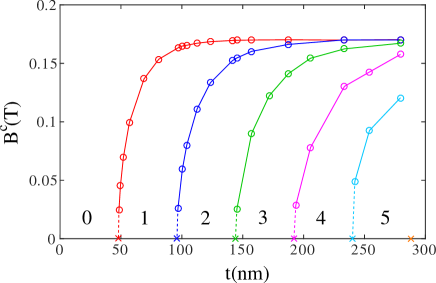
Fig.6 presents the numerical phase diagram of Cr1/3NbS2 as a function of thickness and of applied external magnetic field . For samples of thickness ( is a non-negative integer, nm is the spiral period) there are phase transitions between topological sectors. As expected, all phase boundaries approach the bulk critical field when the thickness is increased. Starting from thicknesses about nm, phases with a small number of solitons are stabilized only in a very narrow interval of magnetic field and will be difficult to detect experimentally (that is why in the main text we focused our quantitative analysis on the last transition, occurring at ).
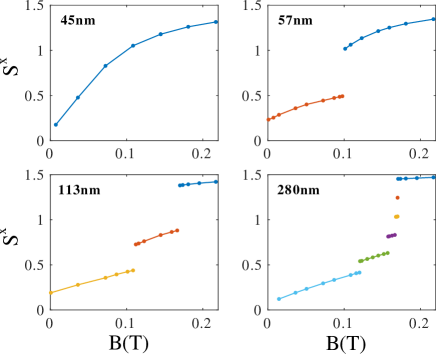
The multiple transitions between topological sectors observed experimentally in the magneto-resistance can be detected numerically by looking at the average magnetization:
| (2) |
as a function of the magnetic field. Fig.7 presents these results for four different chain lengths. They agree qualitatively with the experimental results. As explained above, the jumps in the average magnetization are expected to correspond to the jumps in the magneto-resistance.
II Analytical calculation
The above numerical results can be verified through an analytical calculation based on Hamiltonian (1) by reformulating it in the continuous limit Togawa et al. (2012, 2013); Chapman et al. (2014); Bornstein et al. (2015). Due to strong anisotropy in the direction, the spins are confined to be in the easy plane ( plane), and their configuration can be described by the azimuthal angle . The total energy, therefore, is expressed as a functional of ,
| (3) |
where is the film thickness, is the wave vector of helix structure without external magnetic field, and is the normalized magnitude of external field. Through this energy functional, should satisfy the following Sine-Gordon equation:
| (4) |
and its general solution is expressed as
| (5) |
where is the Jacobi amplitude with modulus . This solution is parametrized by the two quantities and , which should be determined by minimization of total energy with the appropriate boundary condition. Modulus determines the period of the soliton structure through
| (6) |
where is the complete elliptical integral of the first kind, determines the phase shift of the structure. Once the two parameters are specified, the spin configuration is determined. For a bulk system, the parameter does not affect the energy and it has already been found that, to minimize the energy, should satisfy the condition: , where is the complete elliptical integral of the second kind. This condition gives rise to the critical field for bulk system, , corresponding to the value of T obtained by numerical calculation.
For a finite system, there is no particular reason to assume any preference in the plane on the boundary, and therefore a free boundary condition is expected. The energy functional can be explicitly written down as a function of thickness , parameter and
| (7) |
with
| (8) |
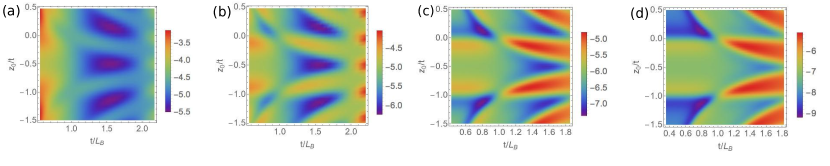
where we simply write . and are the incomplete elliptic integral of the first and second kind, respectively. The conditions on to minimize energy (7) are found to be as: or . Even though the condition on parameter cannot be written down explicitly, energy functional form (7) enables us much more easily to determine the numerical value of that minimizes the total energy (1). We will not repeat the results calculated based on (7), that are in perfect agreement with numerical calculation. We just plot the energy as a function of and for different values of external field and vividly demonstrate the topological transition from one kind of soliton structure to another, as in Fig. 8.