Detection of interstellar ortho- with SOFIA
Abstract
We report on the detection of the ground-state rotational line of ortho- at 1.477 THz (m) using the German REceiver for Astronomy at Terahertz frequencies (GREAT) onboard the Stratospheric Observatory For Infrared Astronomy (SOFIA). The line is seen in absorption against far-infrared continuum from the protostellar binary IRAS 16293-2422 in Ophiuchus. The para- line at 691.7 GHz was not detected with the APEX telescope toward this position. These observations complement our previous detections of para- and ortho- using SOFIA and APEX. By modeling chemistry and radiative transfer in the dense core surrounding the protostars, we find that the ortho- and para- absorption features mainly originate in the cool ( K) outer envelope of the core. In contrast, the ortho- emission from the core is significantly absorbed by the ambient molecular cloud. Analyses of the combined and data result in an age estimate of yr for the core, with an uncertainty of yr. The core material has probably been pre-processed for another years in conditions corresponding to those in the ambient molecular cloud. The inferred time scale is more than ten times the age of the embedded protobinary. The and ions have large and nearly equal total (ortho+para) fractional abundances of in the outer envelope. This confirms the central role of in the deuterium chemistry in cool, dense gas, and adds support to the prediction of chemistry models that also should be abundant in these conditions.
1 Introduction
The deuterated variants of the ion are believed to be the most important agents of deuterium fractionation in cool ( K) interstellar clouds (Millar et al., 1989). Deuteration driven by should be particularly efficient in cold, dense cores. Firstly, substitution of H by D is favored in cold gas because it lowers the zero-point vibrational energy of a molecule. Secondly, and its isotopologs are predicted to be enhanced greatly in conditions where common molecules like CO and N2 freeze onto dust grains (Dalgarno & Lepp 1984; Caselli et al. 2003; Roberts et al. 2003; Walmsley et al. 2004; Roberts et al. 2004). These chemistry models predict that gas with a large degree of CO depletion can have abundances of and similar to that of , and that can become the most abundant molecular ion. The detection of multiply deuterated species in dense cores supports strongly these ideas (Millar, 2005). On the other hand, it has proven difficult to determine observationally the total abundances of deuterated isotopologs of .
| Species | Transition | Frequency | Reference | ||
|---|---|---|---|---|---|
| () | (GHz) | (K) | (s-1) | ||
| para- | 1370.1 | 65.8 | a,c | ||
| ortho- | 372.4 | 104.3 | b,c | ||
| ortho- | 1476.6 | 70.9 | a,c | ||
| para- | 691.7 | 83.4 | b,c |
The asymmetric isotopologs and have permanent electric dipole moments. Their ground-state rotational transitions lie at submillimeter and far-infrared wavelengths. Like molecular hydrogen, and exist as ortho and para modifications, depending on the symmetries of the nuclear spin functions of the two protons or deuterons. The lowest rotational transitions of the four species are listed in Table 1. While ortho- has been observed in several dense clouds (e.g., Caselli et al. 2008; Pillai et al. 2012), para- has only been detected once so far (Brünken et al., 2014). The para modification of has been previously detected toward two starless cores (Vastel et al. 2004; Parise et al. 2011), whereas the previous search for ortho- with Herschel/HIFI was unsuccessful (Vastel et al., 2012). In addition to astrochemical interest, observations of and can also be used to determine the time-scales of the earliest phases of star-formation. This is made possible by the fact that both the fractional abundances and the ortho/para ratios of these ions are closely linked to o/p-, which is supposed to be 3 at the formation on grains, but to decrease continually, albeit slowly, in cold gas through proton exchange reactions (Walmsley et al. 2004; Pagani et al. 2011).
In this paper we report on the observations of ortho- and para- rotational ground-state lines towards IRAS 16293-2422, hereafter IRAS16293, a dense core in Ophiuchus hosting a protobinary (Wootten 1989; Jørgensen et al. 2016). Besides providing the first detection of interestellar ortho-, these observations complement our previous observations of ortho- and para- toward IRAS16293 (Brünken et al., 2014), which allowed the determination of the o/p- and the total abundance in the core’s envelope. We used these quantities in conjunction with chemical models to infer that the dense core has been chemically processed for at least one million years. The inclusion of ortho- and para- to the observed species permits testing of this estimate, and puts also our understanding of deuterium chemistry to the proof.
The paper is organized as follows. In Section 2, we describe the new observations of the ortho- and para-lines of . The physical and chemical model used for the interpretation of the observed spectra is described in Section 3. The results of the modeling and the comparison with the observations are discussed in detail in Section 4, followed by a general discussion and conclusions in Section 5.
2 Observations
2.1 SOFIA
We observed the ortho- ground-state transition at 1476.6 GHz (m) toward the protostellar binary embedded in IRAS16293 using the upgraded far-infrared receiver upGREAT (Heyminck et al. 2012; Risacher et al. 2016)111The latest developments are described at www3.mpifr-bonn.mpg.de/div/submmtech onboard SOFIA (Young et al., 2012). The measurement was made on 2015 May 22, during one of the commissioning flights of upGREAT, which started from Palmdale, California. The target position was R.A. , Dec. (J2000), lying south of the component A of the protobinary. The same position was observed in para- by Brünken et al. (2014). With this choice, based on the Herschel m map, we wanted to maximise the continuum signal. We used the GREAT L1b channel (1.42-1.52 THz) with the FFTS4G backend, which has a bandwidth of 4 GHz and a channel spacing of 283 kHz (58 m s-1). For the sky subtraction, the instrument was operated in the double beam-switch mode. The chopping frequency was 1 Hz, and the chop amplitude was which provided a total beam throw of in a horizontal direction. The on-source integration time was 25 min. The average system temperature was K. The forward and main beam efficiencies for the L1 channel of GREAT are 0.97 and 0.64, respectively. The half-power beam width (HPBW) of the 2.5-m SOFIA telescope is at 1476.6 GHz.
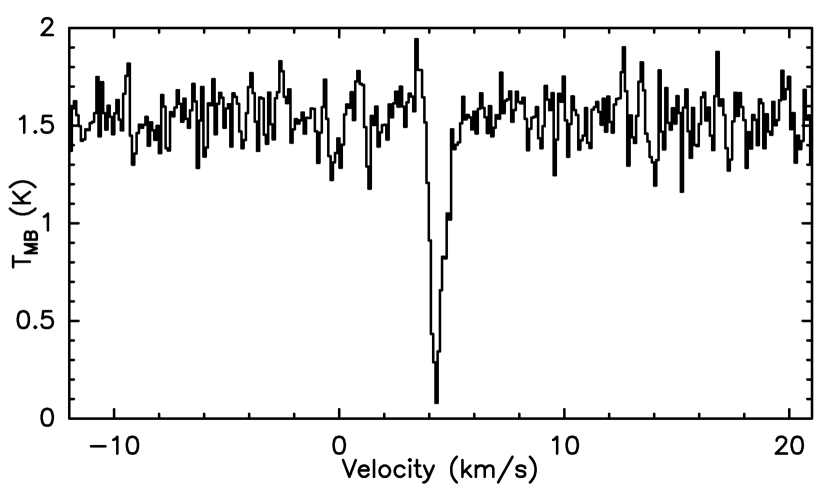
The GREAT receiver admits two sidebands, while the absorption feature appears in only one of them. We calibrated the absorption spectrum and the continuum separately, and combined these afterwards so that the correct intensity scale is recovered. In the continuum calibration, the contribution from both sidebands was taken into account. The derived continuum level is K on the Rayleigh-Jeans temperature scale, which corresponds to 960 Jy beam-1. This constant continuum level was added to the absorption spectra to get a final spectrum. The calibrated ortho- spectrum is shown in Figure 1. The continuum from the protostellar core is almost completely absorbed in the line center.
2.2 APEX
The para- ground-state line at 691.7 GHz () was observed using the CHAMP+ array receiver (Kasemann et al., 2006) on Atacama Pathfinder Experiment 12 meter diameter submillimeter telescope (APEX) (Güsten et al., 2006). The receiver has seven pixels in the waveband covering the target line. The footprint consists of a central pixel surrounded by a hexagonal pattern. The pixels are separated by about , with the central pixel pointed at the protostar IRAS 16293A, R.A. , Dec. (J2000). The center position lies off from the position observed with SOFIA. This separation caused by a mistake is small compared to the SOFIA beam. The beamwidth of APEX is at 691.7 GHz, and the main beam efficiency is 0.47. The observations were made on 2013 August 4, in excellent conditions (PWV 0.35 mm). The observing mode was wobbler switching with a beam throw of . The total on-source integration time was 40 min at a system temperature of 1170 K. The CHAMP+ Array FFTS with a velocity resolution of 0.3175 km s-1 was used as the backend. We reached an rms noise of 0.10 K on the scale in the central pixel. No line was detected in any of the pixels. The continuum level was measured to be K, which corresponds to Jy beam-1.
3 Modeling
3.1 Physical model
The protostellar core IRAS16293 has been studied extensively. The object lies in the northwestern part of the dark cloud Lynds 1689, which is part of the Ophiuchi molecular cloud complex. The distance to the Oph cloud is approximately 120 pc (Loinard et al. 2008; Lombardi et al. 2008). The overall structure of the cloud surrounding IRAS16293 and its companion, the starless core “I16293E” (Stark et al., 2004), is illustrated in Figure 2, which shows the dust colour temperature () and the column density () maps of a region centered on IRAS16293. These maps cover the high-column density part of the region called L1689-NorthWest by Nutter et al. (2006). The and maps are derived from far-infrared images observed by Herschel (Pilbratt et al., 2010). Contours of the 850 m emission map from the SCUBA-2 survey of Pattle et al. (2015) are superposed on the map.
The Herschel/SPIRE images were extracted from the pipeline-reduced images of the Ophiuchus complex made in the course of the Herschel Gould Belt Survey (André et al., 2010). The data are downloaded from the Herschel Science Archive (HSA)222www.cosmos.esa.int/web/herschel/science-archive. We calculated the and distributions using only the three SPIRE (Griffin et al., 2010) bands at m, m, and m, for which the pipeline reduction includes zero-level corrections based on comparison with the Planck satellite data. A modified blackbody function with the dust emissivity spectral index was fitted to each pixel after smoothing the m and m images to the resolution of the m image (), and resampling all images to the same grid. For the dust emissivity coefficient per unit mass of gas, we adopted the value from Hildebrand (1983), cm2g-1.
The core IRAS16293 is visible as a roundish peak on the column density and the 850 m surface brightness maps shown in Figure 2. The general consensus on the structure of IRAS16293 is that it harbors a double Class 0 protostar, IRAS16293A and IRAS16293B with a separation of about 600 AU, surrounded by a massive envelope () with steeply decreasing temperature and density distributions (e.g., Wootten 1989; Loren et al. 1990; Stark et al. 2004; Jørgensen et al. 2005; Crimier et al. 2010; Jørgensen et al. 2016).
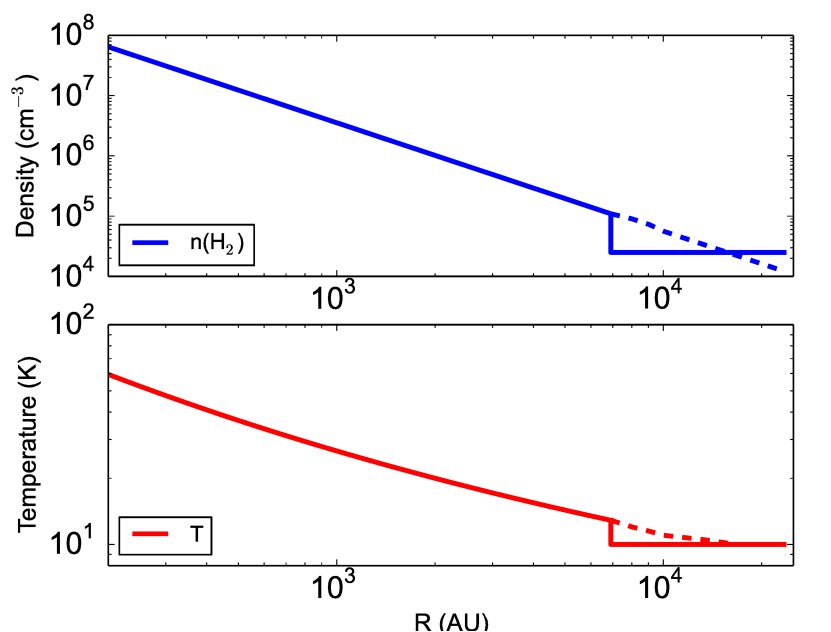
We adopt the frequently used physical model of IRAS16293, derived by Crimier et al. (2010), where the radial density distribution of the protostellar envelope is described by a power law, , between the central cavity (27 AU) and the outer edge (6900 AU), corresponding to at the distance 120 pc. The model is not accurate in the center of the core, but describes well the structure seen with a single-dish telescope. The heating of the inner envelope is dominated by the central protostars for which Crimier et al. derived a bolometric luminosity of . The density and the kinetic temperature distributions of the model are plotted in Figure 3. The gas kinetic temperature and the dust temperature are assumed to be equal in the core envelope.
Two models for the ambient molecular cloud were tested. Firstly, we assumed that the core is surrounded by a homogeneous cloud with physical conditions considered to be typical for a dark cloud. In Brünken et al. (2014), the temperature and density of the ambient cloud were fixed to cm-3 and K. Here we start with these values, but also explore the ranges K and cm-3. In the second ambient cloud model, the Crimier et al. density and temperature distributions are extrapolated to larger distances from the center of the core. The outer boundary of the ambient cloud model is determined by the assumption that this component causes a visual extinction of to the outer edge of the dense core. The cloud constructed in this way extends to a distance of approximately 24000 AU () from the core center. For the homogeneous dark cloud model, the distances range from 15000 AU () to 38000 AU (), depending on the density. The chosen value for the external extinction, , is arbitrary but possible, as the column density around the core is of the order of cm-2.
The near side of the ambient cloud can be identified with the “foreground cloud” invoked in recent Herschel/HIFI absorption line studies (Coutens et al. 2012; Coutens et al. 2013; Bottinelli et al. 2014). In accordance with these studies, we assume in the spectral line modeling that the foreground component can have a different LSR velocity than the dense core, which gives rise to asymmetric absorption profiles as observed in our SOFIA spectra of ortho- and para-.
3.2 Chemistry model
The chemical abundances in different parts of IRAS16293 and the ambient cloud were calculated using a chemistry model containing reaction sets for both gas-phase and grain surface chemistry. The code is described in detail in Sipilä et al. (2015a) and in Sipilä et al. (2015b). The chemistry model distinguishes between the different nuclear spin states of light hydrogen molecules, nitrogen hydrides, water, and their deuterated forms. The reaction rate coefficients for the isotopic system, which is most relevant for the present study, are adopted from Hugo et al. (2009). For dissociative recombination reactions of and its deuterated forms with electrons we used the rate coefficients presented in Pagani et al. (2009). In the present work we use the KIDA gas-phase network (Wakelam et al., 2015) as the basis upon which the deuterium and spin-state chemistry is added with the prescriptions detailed in Sipilä et al. (2015a) and Sipilä et al. (2015b).
The method of calculation is similar to that described in Brünken et al. (2014). The physical model is divided into concentric shells where the density and temperature are assumed to be constant. Chemical evolution is calculated separately in each shell. The model is pseudo-time dependent, i.e., we follow the chemical evolution assuming that the protostellar envelope and the ambient cloud are static.
We use different assumptions about initial chemical composition of the cloud. In one of the models, we assume that the gas is initially atomic, with the exceptions of hydrogen and deuterium, which are completely bound to and HD. We also calculated a series of models, for which the initial composition depends on the processing time in conditions corresponding to the outskirts of the ambient cloud ( cm-3, K). For the elemental abundances, we have adopted the set of low-metal elemental abundances labelled EA1 in Wakelam & Herbst (2008). We have fixed the cosmic-ray ionization rate to s-1, the grain radius to m, and the initial ortho/para- to , corresponding to a spin temperature of K.
3.3 Simulation of spectral lines
The abundance distributions extracted from the chemistry model are used, together with the density, temperature, and velocity profiles of the core, as input for predicting observable spectral line profiles. Our radiative transfer calculations include the emission and absorption by dust, and the effect of dust emission on the line excitation. We use programs described in Juvela (1997) and Juvela (2005). The input parameters of the physical model are the cloud density structure, the luminosity of the central protostar, the intensity of the interstellar radiation field (ISRF), and the dust opacity spectrum. We adopted the dust opacity model of Ossenkopf & Henning (1994) for dust grains with thin ice coatings processed at the density . The spectrum of the unattenuated interstellar radiation field (ISRF) was taken from Black (1994). The program produces a high angular resolution spectral map of the source model, including the dust continuum. For comparison with observations, the map is smoothed to a given resolution. The excitation of the rotational transitions of and in collisions with para- and ortho- are calculated using the state-to-state rate coefficients from Hugo et al. (2009). The hyperfine patterns of the lines are adopted from Jensen et al. (1997). These are, however, overwhelmed by the Doppler broadening.
4 Results
4.1 Abundance distributions
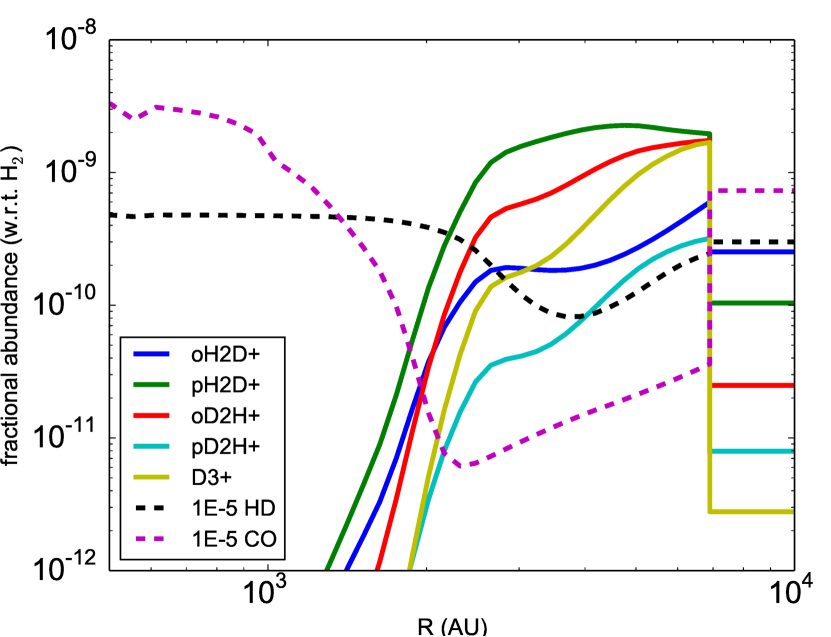
The abundances of deuterated ions can become significant only in cool, shielded parts of the core envelope and the ambient dark cloud. This is illustrated in Figure 4, which shows the radial abundance distributions of the deuterated forms of at an advanced stage ( yr) of the simulation that has been started from an atomic initial composition (except for and HD). Also shown are the fractional CO and HD abundances. Here we have used the same ambient cloud model as Brünken et al. (2014) with cm-3 and K. The highest fractional abundances of and () are found in the outer layers of the core envelope at radii AU. The inner boundary marks the distance where the temperature decreases below 20 K, making CO desorption inefficent. There is an abrupt change in the abundances of , , and at the outer edge of the core because of the density drop; the chemical evolution is slower in the ambient cloud. The abundances of deuterated ions fall steeply near the extreme outer boundary of the ambient cloud (, not shown). This decrease is caused by active CO production and a high ortho- abundance close to the surface of the cloud. Ultimately, CO is photodissociated in the outermost layers with .
We next examine the chemical evolution of the coolest part ( AU, K) of the envelope. The average abundances of ortho- and para- and as functions of time using two different initial gas compositions are shown in Figure 5. Also shown are the abundances of , HD, and ortho-. The fractional abundances are column density-weighted averages, , over the mentioned layers of the envelope.
The initial composition influences the evolution of the ortho- abundance. When starting the simulation from unprocessed abundances (we call this simulation “a”), the ortho- abundance decreases substantially after an early peak at yr (see Figure 5 a). On the other hand, if the chemistry is first allowed to evolve for yr (Figure 5 b; we call this simulation “b”), or any time of that order in dark cloud conditions, the ortho- abundance remains high until the late stages of chemical evolution. The difference is related to a slower depletion of HD and a faster decrease of o/p- in simulation b as compared with simulation a. This in turn can be attributed to a higher abundance in the beginning of simulation b. In the presence of HD, the ion is efficiently deuterated, and all its isotopologs contribute strongly to the ortho-para conversion of . The decrease of o/p- further enhances deuterium fractionation. Individual deuterium atoms are not deposited in , or molecules for long, but they are released by dissociative recombinations with electrons. The abundance of D atoms in the gas phase and on grains is, therefore, higher in simulation b than in simulation a. This is reflected in the replenishment of HD from grains. In simulation b, the rate of HD formation on grains is higher than in simulation a until very late stages. To summarize, our interpretation is that the distribution of deuterium between many different gas- and solid-phase species in the beginning of simulation b helps to sustain high HD and abundances longer than in simulation a, where all deuterium is initially bound to HD.
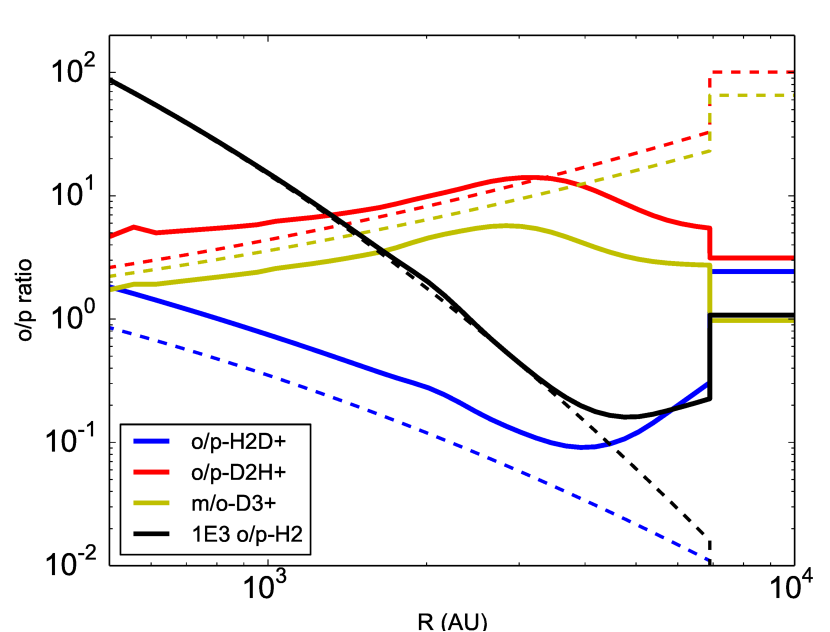
The radial distributions of the o/p ratios of , , and , and the meta/ortho (m/o) ratio of 333The ion has three permutation symmetry species in : (“ortho”, with nuclear spins or ), (“meta”, ), and (“para”, ). The statistical weights (the numbers of possible nuclear spin states belonging to these species) are 16, 10, and 1 for ortho, meta, and para, respectively. are shown in Figure 6. The ratios correspond to the time yr in the simulation presented in Figure 5 (a), where the initial gas composition is mainly atomic. The dashed curves show the spin ratios in thermal equilibrium. These are calculated from the partition functions, for example o/p-. At low temperatures, the equilibrium ratios can be approximated by o/p-, o/p-, o/p-, and m/o- (Flower et al. 2004; Hugo et al. 2009). The modeled ortho/para ratios experience both radial and temporal changes. In the dense and warm inner parts, o/p- is thermalized, and also o/p-, o/p-, and m/o- follow their thermal ratios (the perceptible offset of o/p- from the thermal ratio is discussed in Section 4.3). In the cool, outer envelope the spin ratios deviate clearly from their thermal values. In the outermost layers with K ( AU), all the plotted spin ratios are suprathermal, i.e., the species with the higher ground-state energies, ortho-, ortho-, para-, and ortho-, have clearly larger abundances than expected from thermal equilibrium. The deviations in o/p- and o/p- from thermal ratios become smaller as time advances. For o/p- and m/o-, no substantial changes occur after yr in this model. The spin ratio plot for simulation b (not shown) is very similar to that shown in Figure 6 except that the o/p ratios of and follow the thermal ratios up to larger distances from the core center than in simulation a.
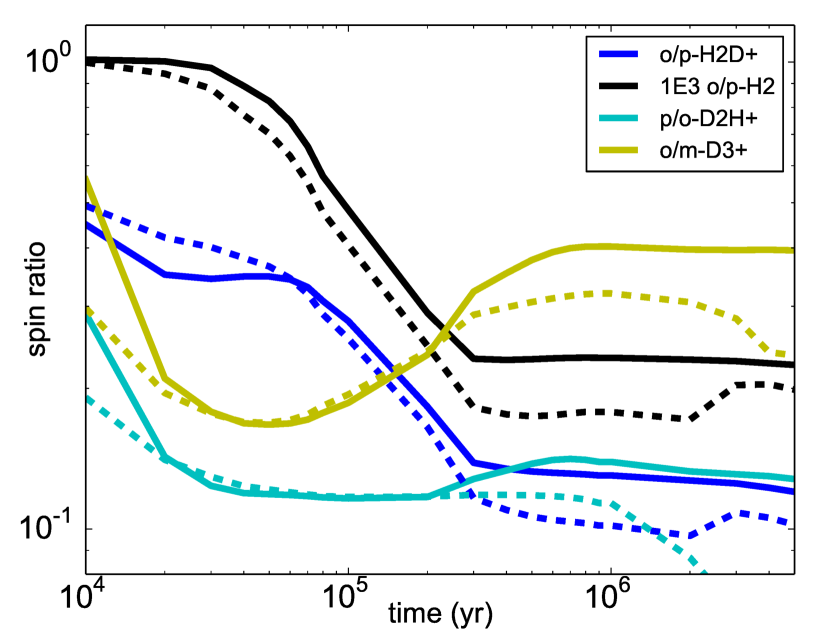
The time evolution of the averaged ortho/para ratios of , , , and the ortho/meta (o/m) ratio of are presented in Figure 7. The averages are column density ratios calculated over the outer envelope, AU. The figure shows the abundance ratios of the higher energy modification to the lower energy modification for all molecules. The predicted ratios from simulation a, starting from atomic abundances, are shown with solid lines, and the ratios from simulation b, which starts from re-processed abundances, are shown with dashed lines. In simulation b, the ortho/para ratios of and decrease more steeply and reach lower values than in simulation a. Correspondingly, p/o- and o/m- in simulation b are lower at late times as compared to simulation a. In both simulations, o/p- correlates closely with o/p-. As discussed in Brünken et al. (2014), this correlation is established by proton exchange reactions between (ortho or para) and (ortho or para). The o/p- ratio as a function of o/p- can be calculated to a great accuracy from the analytical formula given in Brünken et al. (2014). At advanced stages of the simulation, the dominant reaction is
| (1) |
In this case the mentioned formula can be simplified to o/p- o/p-.
The temporal evolution patterns of p/o- and o/m- resemble each other, but show no obvious correlation with o/p-. The lowest energy spin modifications, meta- and ortho- are coupled by the reaction . The forward reaction is the principal pathway to meta-, and the reverse reaction can only decompose to because of symmetry rules. Besides the fractionation reactions, the spin states of and are influenced by spin conversion reactions with HD: , (Flower et al. 2004; Flower et al. 2006; Hugo et al. 2009; Sipilä et al. 2010).
4.2 Simulated spectra
We calculated the spectral line profiles of the ortho and para modifications of and at different times, using the cloud models described in Section 3.1. The evolution of chemical abundances in the model clouds were calculated using different initial gas compositions, determined by the duration of the preceding “dark cloud” stage. The following durations of the initial dark cloud stage were tested: , , , , and yr. The dense core plus ambient cloud evolution was followed up to yr. The cloud models differ by the ambient cloud parameters, and in terms of how the transition from the dense core to the ambient cloud occurs (see Figure 3). The purpose of the calculations was to find a physical model that at a certain stage could reproduce the observed and spectra. The appropriateness of the model and the timing was controlled with the help of diagrams showing the time-dependence of the integrated emission/absorption line intensity. The method is explained in Appendix A.
Typical of almost all simulations is that the ortho- and para- absorption features are weak in the beginning but grow stronger with time. This is opposite to the behavior of the ortho- emission line which generally diminishes in intensity (but in most cases remains overly strong compared with the observed line, see below). However, the ortho- absorption line weakens again and the ortho- emission line typically gets stronger toward the end of the simulation. The weakening of the ortho- absorption is caused by the depletion of HD in the outer envelope. The opposite tendency of ortho- emission is related to a redistribution of the ortho- abundance discussed below. The para- emission/absorption features are always weak compared to the noise level of the observed spectrum.
As discussed in Section 4.1, the abundance grows larger when the dense core stage starts from pre-processed gas (Figure 5). The best overall agreement between simulations and the observations is generally found when the initial dark cloud stage has lasted yr, and the duration of the subsequent dense core stage is another yr. This time corresponds to a minimum in the ortho- emission line intensity and a maximum in the ortho- absorption. Lengthening the initial stage increases the minimum intensity of the ortho- line. On the other hand, using initially atomic abundances or initial processing times of yr results in an overly weak ortho- absorption feature at any time of the simulation. While the para- absorption continually deepens until the end of the simulation, the ortho- absorption weakens at very late times. In the simulation continuing from an initial stage of yr, this weakening becomes significant at yr.
The strenghtening of ortho- is caused by an increase in the ortho- abundance deeper in the envelope at radii AU where the temperature is K and the density is cm-3. The effect is seen at late times yr, and its occurrence depends on the initial gas composition. The creeping of ortho- into the inner parts of the envelope is favoured when abundance is high in the beginning of the dense core simulation, meaning an initial stage duration of at least yr (see also Figure 11 in the Appendix).
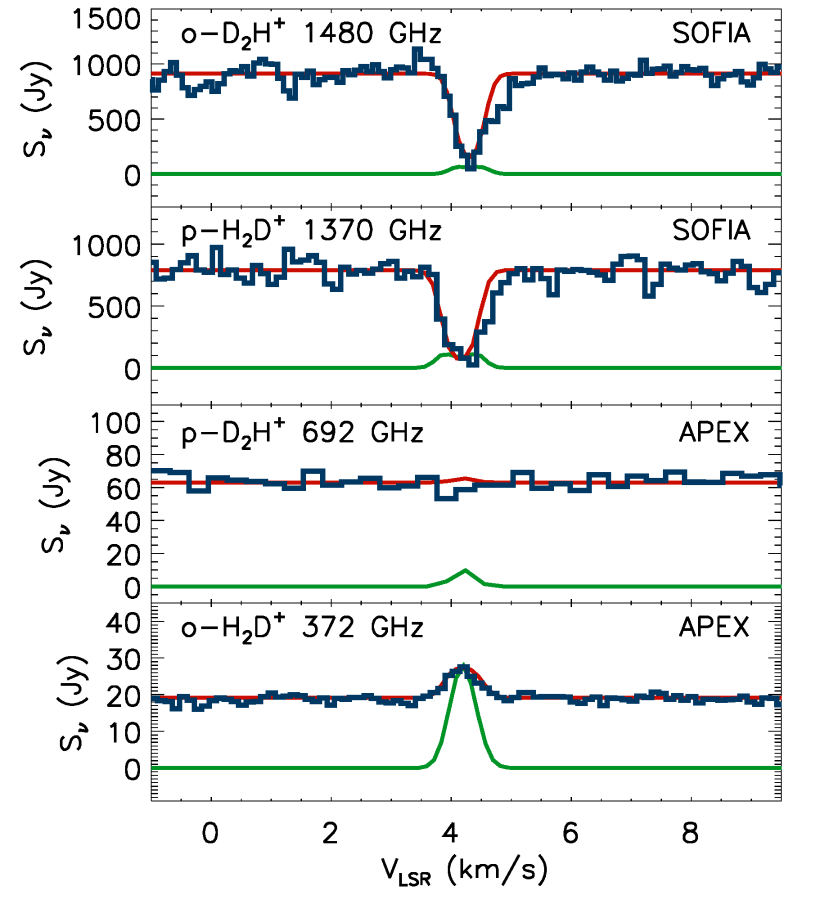
The ortho-, para-, ortho-, and para- spectra calculated from the cloud model of Brünken et al. (2014) are shown in Figure 8, together with the observed spectra. The spectra are presented on the flux density scale. The physical model consists of the Crimier et al. core model surrounded by a homogeneous dark cloud with cm-3, K. No velocity shift between the core and the ambient cloud is assumed. The model gives rather good predictions for the height of the ortho- peak and the depths of the valleys in ortho- and para- spectra. On the other hand, it cannot reproduce the integrated intensities and the asymmetric shapes of the absorption spectra.
There is a hint of blue-shifted emission in the observed ortho- spectrum. In view of several artefacts on this side of the spectrum, we cannot be sure that this feature originates in the target source. Blue-shifted emission should be attributed to infalling gas on the far-side of the envelope. According to the present model, ortho- does not show such a feature because of a very low abundance within the infall-radius ( AU).
More pronounced are the red-shifted shoulders observed in both ortho- and para- absorption line profiles. These can best be reproduced by assuming that the near side of the ambient cloud falls toward the core at a speed of . We still assume that the ambient cloud is homogeneous, but vary the temperature in the range K and the density in the range cm-3.
It turns out that the ambient cloud needs to be a little denser than in the Brünken et al. (2014) model in order to obtain noticeable red-shifted absorption in the ortho- line. On the other hand, the intensity of the ortho- line increases strongly above cm-3. The temperature needs to be well below 14 K in order to cause sufficient absorption in the ortho- and ortho- lines. The ambient cloud parameters of the best-fit model are K, cm-3. The predicted spectra at the time yr are shown in Figure 9.
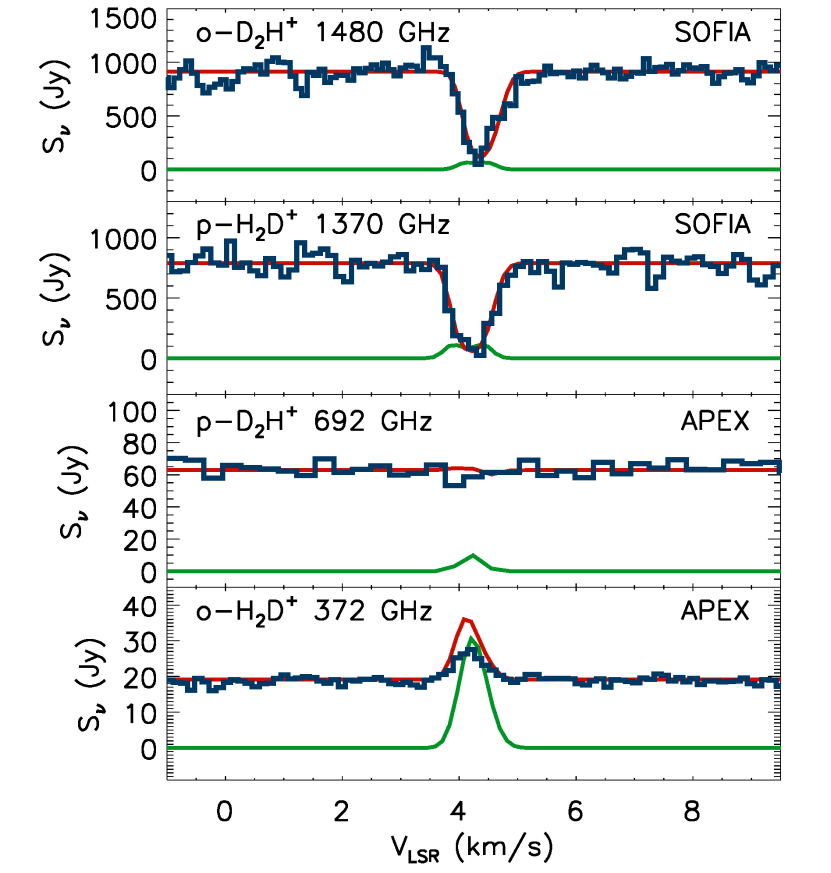
While the agreement between the observed and modeled absorption lines of ortho- and para- has improved with respect to the model of Brünken et al. (2014), the model used for Figure 9 overpredicts the intensity of the ortho- emission line by a factor of . Because of the velocity shift, the foreground cloud absorbs less ortho- emission from the core as compared with the completely static model.
The situation with ortho- becomes even worse when using the extended Crimier et al. (2010) core model, where the density and temperature distributions are continuous. The best-fit spectra are shown in Appendix B. In this model, there is less low-density cold gas serving as an absorbing layer as compared with the homogeneous ambient cloud model. On the other hand, the model can quite well reproduce the two absorption lines.
4.3 Adjusting the ortho-para conversion of
Inspection of Figure 6 reveals that o/p- lies a constant factor of above the thermal value when o/p- is thermalized. This is contrary to intuition and pointed us to the fact that the rate coefficients used in the simulation lead to an overestimate of o/p-. The possible overestimate could contribute to the overly bright ortho- line produced by the present simulations. A similar tendency of over-predicting ortho- emission with the same chemistry model was observed in a study of the starless core H-MM1 (Harju et al., 2017).
For reaction (1) and other reactions between the isotopologs of and , we have adopted the ground state-to-species rate coefficients given in Table VIII of Hugo et al. (2009). The and parameters in the Arrhenius-Kooij expressions for the rate coefficients presented in this table were fitted in the temperature range K. Pagani et al. (2013) have extended the fits to the range K. The anomalous o/p- ratio is seen also at temperatures for which the original fit is valid.
In the reaction set used, the ratio of the forward and backward reactions (1) is , whereas according to statistical mechanics, the equilibrium constant of this reaction,
| (2) |
can be approximated by at low temperatures (see, e.g., Eq. 61 in Hugo et al. 2009). The use of ground state-to-species coefficients omits in particular “backward” reactions involving ortho- in the first excited rotational level, , which lies approximately 18 K above the ground level (). The transition gives rise to the 372 GHz emission line observed here. The critical density of this transition, cm-3 at 15 K, is exceeded in the core model except for the outermost shells, so it seems appropriate to include the contribution of the level to the reaction rate. This inclusion brings the backward rate coefficient, , close to the thermal value. Because reaction (1) mainly determines o/p-, the factor 2.25 in the ratio in the adopted reaction set explains the suprathermal o/p- in the inner part of the envelope ( AU). The situation is likely to be different for the “forward” reaction. The first excited level of para-, lying K above the ground state, is not easily excited in the cool outer layers of the cloud. The critical density of the transition is cm-3.
We tested the effect of increasing the rate coefficient of the backward reaction (1) so that obtains the value given by Eq. 2. As expected, the ortho- abundance decreases, and the o/p- ratio follows closely the thermal ratio in the inner parts of the core after this change.
4.4 Applying the modified rate coefficient
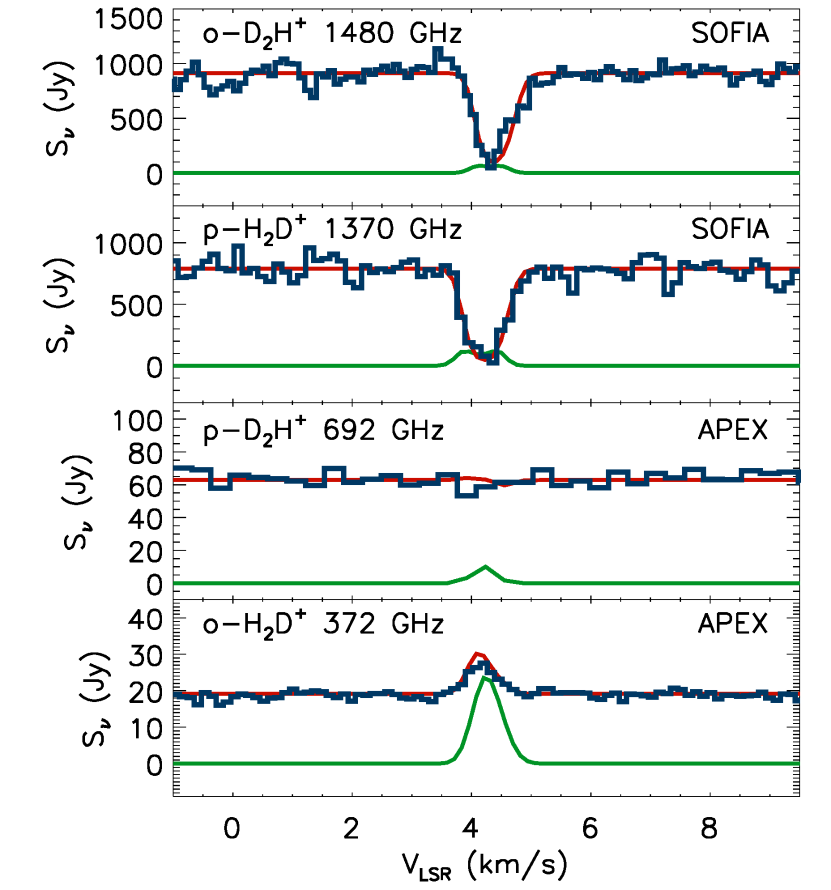
Spectra predicted using abundances from the modified chemistry model in the core (but keeping to the original ground state-to-species coefficients in the low-density ambient cloud) are shown in Figure 10. This figure presents the best-fit spectra from the homogeneous ambient cloud with cm-3 and K. The simulation time is again yr. The corresponding model spectra from the extended Crimier et al. core model are shown in Appendix B. For both physical models the agreement with the observed ortho- line has improved, but the homogeneous ambient cloud model gives a clearly better fit.
Reaction (1) is probably one of the most important cases in which ground state-to-species coefficients can deviate from the species-to-species coefficients, when the gas density is high enough. Figure 6 suggests furthermore that this effect needs to be taken into account in reactions determining the o/m- ratio. In the present paper, we do not follow up this matter, but intend to do so in a future study (Sipilä et al., in preparation).
We conclude this section by listing in Table 4.4 the average fractional abundances of the observed molecules according to the models used to produce the spectra shown in Figs. 10. We give separately the average abundances in the outer envelope ( AU) and in the homogenous foreground dark cloud (extending to AU). For the extended Crimier et al. power-law model, the abundances are averages over the range AU. The abundances in the core ( AU) are calculated using the modified coefficient for reaction (1). Also given in this table, in columns 4, 5, and 7, are the fractional abundances and their uncertainties derived using the observed spectra and the physical models assuming that the abundances are constant in the regions where the observed emission/absorption is likely to originate, and zero elsewhere (that is, within the radial distance AU from the center).
According to the Crimier et al. core plus ambient dark cloud model, the average fractional ortho- and para- abundances are higher in the outer envelope than in the ambient cloud. Column densities give, however, a better idea of which component dominates the absorption features. The ratios of the beam-averaged column densities are for ortho- and for para- in favor of the core according to this model. As suggested by the simulated spectra shown in Figure 10, the situation is opposite for ortho-: the beam-averaged column density in the ambient cloud is three times higher than that in the core.
| Species | Crimier + ambient dark cloud | Extended Crimier | ||||
|---|---|---|---|---|---|---|
| Chemistry model | Constant X | Chemistry model | Constant X | |||
| Envelope | Ambient | Envelope | Ambient | |||
| (1) | (2) | (3) | (4) | (5) | (6) | (7) |
| ortho- | ||||||
| para- | ||||||
| para- | ||||||
| ortho- | ||||||
5 Discussion and conclusions
The deepest absorption features of ortho- and para- toward IRAS16293 are found at a LSR velocity of . This velocity agrees with the velocities of the previously observed absorption features in the spectra of D2CO (Loinard et al., 2000), HDO (Stark et al. 2004; Coutens et al. 2012), and D2O (Vastel et al. 2010; Coutens et al. 2013). In these previous studies the most prominent absorption has been attributed to the cold outer envelope of the protostellar core. This idea is supported by the present modeling results which indicate that most of ortho- and para- absorption occurs in the relatively dense outer envelope. The ortho- and para- spectra are very different from the spectra of deuterated water, for example, which show toward the same position broad emission from the in-falling warm inner core, in addition to the absorption dip at (Coutens et al., 2012).
The origin of the ortho- emission is less clear because this line is likely to be substantially self-absorbed in the ambient cloud. The contribution of the ambient or “foreground” cloud (Coutens et al., 2013) can be partially separated thanks to a line-of-sight velocity gradient which gives rise to asymmetric ortho- and para- absorption profiles. The velocity shift between the foreground cloud and the core was not taken into account in Brünken et al. (2014). This made the modeled ortho- emission lines generally weaker than in the present calculations. To serve as an absorbing component, the foreground cloud must have a moderate density of the order of cm-3, and to develop a high ortho- abundance of at this density, the cloud must be cold. Our spectral line simulations give the best agreement with the observed lines when the kinetic temperature of the foreground cloud is K and the density is cm-3. These numbers are not far from the estimates Menten et al. (1987) obtained for the temperature and the density of the ambient cloud using the inversion lines of : K, cm-3.
The ortho- abundance in the cool outer envelope of IRAS16293 is similar to that derived for para-. As these two species are found to be dominant forms over the variants para- and ortho-, respectively, the conclusion is that the total abundances of and are approximately equal. This agrees with what is expected for deuterium chemistry in cool, CO-depleted gas since the pioneering modeling works of Roberts et al. (2003) and Walmsley et al. (2004). The mentioned studies predict furthermore that in these conditions also should be very abundant, perhaps the most abundant of the isotopologues. This is because all three reactions in the sequence , , are exothermic by about 200 K and should proceed rapidly in cold gas. In the present model, becomes the most abundant ion in the coolest parts of the outer envelope ( AU), but there are no large differences between the fractional abundances of , , , and H+ there.
The symmetric ions and are spectroscopically identifiable through their rovibrational transitions in the infrared. Since the first interstellar detection by Geballe & Oka (1996), absorption lines have been detected both in diffuse and dense interstellar gas in front of strong infrared sources (e.g., Goto et al. 2014). The ion has not yet been detected. As discussed by Oka (2013), the difficulty is to find a cold and dense region with a high degree of deuterium fractionation that obscures a luminous infrared source. The other problem is that the fundamental rovibrational lines of lie at wavelengths where the atmosphere is opaque. The predicted maximum column density of the most abundant, meta () spin modification of in the envelope of IRAS 16293 is approximately . Using Table 3 of Flower et al. (2004), based on spectroscopic data presented by Ramanlal & Tennyson (2004), one finds that the quoted column density corresponds to a peak optical thickness of of the ground-state absorption line of meta- at 5.3 m micron. The assumption here is that the line width is 1 . (The meta and ortho appellations of in Flower et al. (2004) are interchanged with respect to the nomenclature adopted here.) Despite significant optical thickness, the line cannot be detected toward IRAS16293 because of the very weak continuum at 5.3 m. The source is not detected in the IRAC bands of the Spitzer Space Telescope; the Band 3 (5.7 m) surface brightness at this position is approximately 0.1 mJy. The line is currently accessible to the Echelon-Cross-Echelle Spectrograph (EXES)444www.sofia.usra.edu/science/instruments/exes onboard SOFIA. Despite the difficulties mentioned above, it seems worth while to attempt detection toward a luminous embedded Young Stellar Object, if there is reason to believe that the meta- column density in the foreground gas is of the order of cm-2 or more.
The spin ratios of the isotopologs are predicted to exhibit overall radial gradients in the envelope of IRAS16293 because of a steep gradient in the kinetic temperature. The lower energy nuclear spin modifications, ortho- and para-, should be strongly favored in the cool outer envelope. The non-thermal o/p- ratio causes, however, that also o/p- and o/p- deviate from their thermal equilibrium values there (Figure 6). As discussed in Brünken et al. (2014), and above in Section 4.1, o/p- correlates closely to o/p-, which thermalizes quickly at temperatures above 20 K (at radii AU in the present source model), but hardly ever reaches thermal equilibrium in cold gas. The thermalization of o/p- in warm gas occurs efficiently in proton exchange reactions with (e.g., Crabtree et al. 2011). At low temperatures prevailing in the outer envelope, o/p- approaches slowly the thermal value through reactions with and its isotopologs. This process is still slower in the ambient cloud, which likewise is cool but has an order of magnitude lower density. In this component, ortho-para conversion reactions are slow compared to the replenishment of from grains. Consequently, the o/p- ratio is clearly suprathermal, and so is o/p-.
The o/p- ratio depends indirectly on o/p-. For ortho-, the principal formation and destruction pathways are the following fractionation reactions in the left-to-right direction:
| (3) | |||||
| (4) |
The forward reactions are strongly exothermic when the products are in their lowest energy states. Right-to-left reactions are, however, relatively fast in the presence of ortho-. Consequently, ortho- is destroyed in the backward reaction (3) and, to a lesser extent, created in the reverse reaction (4), but significantly only if is in the ortho form. In contrast, the higher-energy para- is efficiently destroyed also by para- through the reverse reaction (3). The net effect is that o/p- shows a weak anti-correlation with o/p- (Figure 6). However, no simple formula relating o/p- to o/p- in a wide range of physical conditions can be presented.
The spin ratios are in general predicted to approach slowly the thermal values. In the cool outer parts of the envelope, AU, this tendency is clear for o/p- which is driven by o/p-, whereas o/p- remains nearly constant in the time interval yr (Figure 7). This suggests that the o/p- ratio is not as trustworthy as a chemical clock as o/p-.
The gas we are probing with and makes up the outer envelope of the core which has only recently, probably a few times years ago, formed the Class 0 protostellar system IRAS16293 A/B. While the interior parts of the core within a few 100 AU are strongly influenced by the newly born stars (e.g. Jørgensen et al. 2016), the outer envelope is likely to represent material accumulated during the pre-stellar stage. Based on the ortho/para- abundance ratio in this component, Brünken et al. (2014) concluded that the current star formation activity in IRAS16293 was preceded by a period of very slow contraction; the best agreement with the observed para- and ortho- lines was reached with a model where the chemical age of the core was , and this stage was preceded by yr of ambient cloud evolution.
The combination of the observations with the previous data, and the refinement of the cloud model to include the small velocity difference between the core and the ambient cloud, impose a change with respect to our previous age estimate. The ortho- abundance in the outer envelope reaches a maximum somewhere between and yr, depending on the initial abundances, and decreases again at very late times when the total deuterium abundance in the gas phase starts to diminish because of accretion onto grains. In contrast, the average ortho- abundance in the core has a minimum close to the ortho- maximum. In our previous model presented in Brünken et al. (2014), the late-time brightening of ortho- line was hidden by absorption in the ambient cloud. The brightening is caused by an increase in the ortho- abundance in the luke-warm ( K) layers of the envelope at radii AU, while at the same time the ortho- abundance continues to decrease in the cool outer parts. The late-time increase in the inner envelope does not happen to other species considered here, and it does not happen to ortho- either, if the dense core simulation is started from “fresh” gas, that is, when the duration of the initial stage is less than yr. In this case, however, the ortho- absorption never reaches the observed level (see Figure 11). We note that the modification of the rate coefficient of reaction (1) to take into account ortho- ions in the first excited rotational level (Section 4.3) does not affect the timing of the ortho- minimum nor the other time-scales derived here.
The diverging temporal behaviors of ortho- and ortho-, combined with the continuous increase in the para- abundance with time, put tighter constraints on the chemical age than the o/p- ratio alone. Using the physical model of Crimier et al. (2010) for the IRAS16293 core, and varying the ambient cloud conditions within a reasonable range agreeing with previous observations, the observed and spectra can be best reproduced when the dense core age is yr and the ambient cloud is twice as old, yr. These age estimates based on chemical evolution in a static dense core are still long compared to the age of the embedded protostars, and support the general conlusion of Brünken et al. (2014) that the current star formation activity in IRAS16293 has been preceded by a long pre-stellar phase. The age of the core is comparable with the average prestellar core lifetime in Ophiuchus and in two other nearby clouds estimated by Enoch et al. (2008). Based on the approximately equal numbers of starless cores and embedded protostars, and the total duration of the embedded (Class 0 and I) protostar stage of Myr (Evans et al., 2009), they obtain an average prestellar lifetime of yr. Enoch et al. (2008) estimate this value to be uncertain by a factor of 2 in either direction. The chemical age of IRAS16293 derived here is likely to be a lower limit. In a more realistic model, where the core gradually reaches its present density, the increase in the o/p- ratio and the decrease in the o/p- ratio would proceed more slowly than in the model we are using, and probably also the resulting age estimate would need to be adjusted upwards.
The authors thank the anonymous referee for raising questions that helped to improve this paper. Stratospheric Observatory for Infrared Astronomy (SOFIA) is jointly operated by the Universities Space Research Association, Inc. (USRA), under NASA contract NAS2-97001, and the Deutsches SOFIA Institut (DSI) under DLR contract 50 OK 0901 to the University of Stuttgart. GREAT is a development by the Max Planck Institut für Radioastronomie (MPIfR) and the KOSMA/Universität zu Köln, in cooperation with the MPI für Sonnensystemforschung and the DLR Institut für Planetenforschung. The Atacama Pathfinder Experiment, APEX, is a collaboration between the MPIfR, the Onsala Space Observatory (OSO), and the European Southern Observatory (ESO). J.H. thanks the Max-Planck Institut for Extraterrestrial Physics for generous support. J.H. and M.J. acknowledge financial support from the Academy of Finland grant 258769. P.C. acknowledges support from the European Research Council (ERC; project PALs 320620). The Cologne and Bonn groups were supported by the Deutsche Forschungsgemeinschaft through SFB 956.
Appendix A Determining the best-fit model and time
We monitored the influence of the physical parameters and the initial abundances on the predicted spectral line intensities using diagrams such as those presented in Figure 11, which show the continuum-subtracted integrated line intensities of ortho-, para-, para-, and ortho- as functions of time. For para- and ortho-, a decreasing curve in the diagram means deepening absorption and an increasing abundance. The predicted spectra agree approximately with the observations if all the four curves simultaneously pass or come close to the center lines of the horizontal bars representing the observed integrated intensities. In the parameter space probed here, such cases are exclusively found when the initial stage duration is yr, and when the ambient cloud densities and temperatures are in narrow ranges of cm-3 and K, respectively. To illustrate the effect of the initial abundances, we show in Figure 11 the results for simulations starting from the times yr (a) and yr (b) of the dark cloud stage. The ambient cloud density is cm-3 and the temperature is 10 K. These models use the modified rate coefficient of reaction (1). Otherwise the ortho- intensity would not reach a sufficiently low level in simulation (b).
As suggested by the diagrams, the simulated spectra agree best with the observations at the time yr. The predicted spectra from this time are shown in Figure 10. There is however, considerable uncertainty in the timing. All the spectra in the time interval yr, corresponding the time when all the curves of Figure 11 are inside the hatched areas, agree reasonably well with the observations.
Appendix B Predicted spectra for continuous density and temperature distributions
The best-fit spectra from the extended core model of Crimier et al. (2010) are shown Figure 12. The density and temperature distributions of the ambient cloud are shown with dashed lines in Figure 3. The near-side of the ambient cloud is assumed to move at a velocity of with respect to the core. The simulation time is yr (dark cloud + dense core). The spectra corresponding to the abundances calculated using the original ground state-to-species rate coefficients are shown on the left (a) and those using the modified backward rate of reaction (1) are shown on the right (b).
References
- Amano & Hirao (2005) Amano, T., & Hirao, T. 2005, JMoSp, 233, 7
- André et al. (2010) André, P., Men’shchikov, A., Bontemps, S., et al. 2010, A&A, 518, L102
- Asvany et al. (2008) Asvany, O., Ricken, O., Müller, H. S. P., et al. 2008, PhRvL, 100, 233004
- Black (1994) Black, J. H. 1994, in ASPC, Vol. 58, The First Symposium on the Infrared Cirrus and Diffuse Interstellar Clouds, ed. R. M. Cutri & W. B. Latter, 355
- Bottinelli et al. (2014) Bottinelli, S., Wakelam, V., Caux, E., et al. 2014, MNRAS, 441, 1964
- Brünken et al. (2014) Brünken, S., Sipilä, O., Chambers, E. T., et al. 2014, Natur, 516, 219
- Caselli et al. (2003) Caselli, P., van der Tak, F. F. S., Ceccarelli, C., & Bacmann, A. 2003, A&A, 403, L37
- Caselli et al. (2008) Caselli, P., Vastel, C., Ceccarelli, C., et al. 2008, A&A, 492, 703
- Coutens et al. (2012) Coutens, A., Vastel, C., Caux, E., et al. 2012, A&A, 539, A132
- Coutens et al. (2013) Coutens, A., Vastel, C., Cazaux, S., et al. 2013, A&A, 553, A75
- Crabtree et al. (2011) Crabtree, K. N., Indriolo, N., Kreckel, H., Tom, B. A., & McCall, B. J. 2011, ApJ, 729, 15
- Crimier et al. (2010) Crimier, N., Ceccarelli, C., Maret, S., et al. 2010, A&A, 519, A65
- Dalgarno & Lepp (1984) Dalgarno, A., & Lepp, S. 1984, ApJ, 287, L47
- Enoch et al. (2008) Enoch, M. L., Evans, II, N. J., Sargent, A. I., et al. 2008, ApJ, 684, 1240
- Evans et al. (2009) Evans, II, N. J., Dunham, M. M., Jørgensen, J. K., et al. 2009, ApJS, 181, 321
- Flower et al. (2004) Flower, D. R., Pineau des Forêts, G., & Walmsley, C. M. 2004, A&A, 427, 887
- Flower et al. (2006) Flower, D. R., Pineau Des Forêts, G., & Walmsley, C. M. 2006, A&A, 449, 621
- Geballe & Oka (1996) Geballe, T. R., & Oka, T. 1996, Natur, 384, 334
- Goto et al. (2014) Goto, M., Geballe, T. R., Indriolo, N., et al. 2014, ApJ, 786, 96
- Griffin et al. (2010) Griffin, M. J., Abergel, A., Abreu, A., et al. 2010, A&A, 518, L3
- Güsten et al. (2006) Güsten, R., Nyman, L. Å., Schilke, P., et al. 2006, A&A, 454, L13
- Harju et al. (2017) Harju, J., Daniel, F., Sipilä, O., et al. 2017, A&A, 600, A61
- Heyminck et al. (2012) Heyminck, S., Graf, U. U., Güsten, R., et al. 2012, A&A, 542, L1
- Hildebrand (1983) Hildebrand, R. H. 1983, QJRAS, 24, 267
- Hugo et al. (2009) Hugo, E., Asvany, O., & Schlemmer, S. 2009, J. Chem. Phys., 130, 164302
- Jensen et al. (1997) Jensen, P., Paidarova, I., Spirko, V., & Sauer, S. P. A. 1997, MolPh, 91, 319
- Jørgensen et al. (2005) Jørgensen, J. K., Lahuis, F., Schöier, F. L., et al. 2005, ApJ, 631, L77
- Jørgensen et al. (2016) Jørgensen, J. K., van der Wiel, M. H. D., Coutens, A., et al. 2016, A&A, 595, A117
- Jusko et al. (2017) Jusko, P., Töpfer, M., Müller, H. S. P., et al. 2017, JMoSp, 332, 33
- Juvela (1997) Juvela, M. 1997, A&A, 322, 943
- Juvela (2005) —. 2005, A&A, 440, 531
- Kasemann et al. (2006) Kasemann, C., Güsten, R., Heyminck, S., et al. 2006, in Proc. SPIE, Vol. 6275, Society of Photo-Optical Instrumentation Engineers (SPIE) Conference Series, 62750N
- Loinard et al. (2000) Loinard, L., Castets, A., Ceccarelli, C., et al. 2000, A&A, 359, 1169
- Loinard et al. (2008) Loinard, L., Torres, R. M., Mioduszewski, A. J., & Rodríguez, L. F. 2008, ApJ, 675, L29
- Lombardi et al. (2008) Lombardi, M., Lada, C. J., & Alves, J. 2008, A&A, 480, 785
- Loren et al. (1990) Loren, R. B., Wootten, A., & Wilking, B. A. 1990, ApJ, 365, 269
- Menten et al. (1987) Menten, K. M., Serabyn, E., Guesten, R., & Wilson, T. L. 1987, A&A, 177, L57
- Millar (2005) Millar, T. J. 2005, A&G, 46, 2.29
- Millar et al. (1989) Millar, T. J., Bennett, A., & Herbst, E. 1989, ApJ, 340, 906
- Nutter et al. (2006) Nutter, D., Ward-Thompson, D., & André, P. 2006, MNRAS, 368, 1833
- Oka (2013) Oka, T. 2013, ChRv, 113, 8738
- Ossenkopf & Henning (1994) Ossenkopf, V., & Henning, T. 1994, A&A, 291, 943
- Pagani et al. (2013) Pagani, L., Lesaffre, P., Jorfi, M., et al. 2013, A&A, 551, A38
- Pagani et al. (2011) Pagani, L., Roueff, E., & Lesaffre, P. 2011, ApJ, 739, L35
- Pagani et al. (2009) Pagani, L., Vastel, C., Hugo, E., et al. 2009, A&A, 494, 623
- Parise et al. (2011) Parise, B., Belloche, A., Du, F., Güsten, R., & Menten, K. M. 2011, A&A, 526, A31
- Pattle et al. (2015) Pattle, K., Ward-Thompson, D., Kirk, J. M., et al. 2015, MNRAS, 450, 1094
- Pilbratt et al. (2010) Pilbratt, G. L., Riedinger, J. R., Passvogel, T., et al. 2010, A&A, 518, L1
- Pillai et al. (2012) Pillai, T., Caselli, P., Kauffmann, J., et al. 2012, ApJ, 751, 135
- Ramanlal & Tennyson (2004) Ramanlal, J., & Tennyson, J. 2004, MNRAS, 354, 161
- Risacher et al. (2016) Risacher, C., Güsten, R., Stutzki, J., et al. 2016, A&A, 595, A34
- Roberts et al. (2003) Roberts, H., Herbst, E., & Millar, T. J. 2003, ApJ, 591, L41
- Roberts et al. (2004) —. 2004, A&A, 424, 905
- Sipilä et al. (2015a) Sipilä, O., Caselli, P., & Harju, J. 2015a, A&A, 578, A55
- Sipilä et al. (2015b) Sipilä, O., Harju, J., Caselli, P., & Schlemmer, S. 2015b, A&A, 581, A122
- Sipilä et al. (2010) Sipilä, O., Hugo, E., Harju, J., et al. 2010, A&A, 509, A98
- Stark et al. (2004) Stark, R., Sandell, G., Beck, S. C., et al. 2004, ApJ, 608, 341
- Vastel et al. (2004) Vastel, C., Phillips, T. G., & Yoshida, H. 2004, ApJ, 606, L127
- Vastel et al. (2010) Vastel, C., Ceccarelli, C., Caux, E., et al. 2010, A&A, 521, L31
- Vastel et al. (2012) Vastel, C., Caselli, P., Ceccarelli, C., et al. 2012, A&A, 547, A33
- Wakelam & Herbst (2008) Wakelam, V., & Herbst, E. 2008, ApJ, 680, 371
- Wakelam et al. (2015) Wakelam, V., Loison, J.-C., Herbst, E., et al. 2015, ApJS, 217, 20
- Walmsley et al. (2004) Walmsley, C. M., Flower, D. R., & Pineau des Forêts, G. 2004, A&A, 418, 1035
- Wootten (1989) Wootten, A. 1989, ApJ, 337, 858
- Young et al. (2012) Young, E. T., Becklin, E. E., Marcum, P. M., et al. 2012, ApJ, 749, L17