Mid-infrared frequency comb generation with silicon nitride nano-photonic waveguides
Abstract
Mid-infrared optical frequency combs are of significant interest for molecular spectroscopy due to the large absorption of molecular vibrational modes on one hand, and the ability to implement superior comb-based spectroscopic modalities with increased speed, sensitivity and precision on the other hand. Substantial advances in mid-infrared frequency comb generation have been made in recent years based on nonlinear frequency conversion, microresonator Kerr frequency combs, quantum cascade lasers and mode locking regimes. Here we demonstrate a simple, yet effective method for the direct generation of mid-infrared optical frequency combs in the region from , i.e. covering a large fraction of the functional group region, directly from a conventional and compact erbium-fiber-based femtosecond laser in the telecommunication band (i.e. ). The wavelength conversion is based on dispersive wave generation within the supercontinuum process in large-cross-section and dispersion-engineered silicon nitride () waveguides. The long-wavelength dispersive wave, with its position lithographically determined, performs as a mid-infrared frequency comb, whose coherence is demonstrated via optical heterodyne measurements. Such a simple and versatile approach to mid-infrared frequency comb generation is suitable for spectroscopic applications in the first mid-infrared atmospheric window. Moreover, the compactness and simplicity of the approach have the potential to realize compact dual-comb spectrometers. The generated combs have a fine teeth-spacing, making them also suitable for gas phase analysis.
I Introduction
Mid-infrared (Mid-IR) optical frequency combs Schliesser et al. (2012) are of significant interest for molecular spectroscopy, due to the fact that many molecules have strong vibrational transitions in this spectral region. In addition, optical frequency combs can constitute superior spectroscopic modalities, such as dual-comb spectroscopy Lee et al. (2001); Schiller (2002); Keilmann et al. (2004); Schliesser et al. (2005); Yasui et al. (2005); Coddington et al. (2008); Giaccari et al. (2008); Coddington et al. (2010); Bernhardt et al. (2010); Zhang et al. (2013); Ideguchi et al. (2014); Villares et al. (2014); Coddington et al. (2016); Millot et al. (2016); Suh et al. (2016); Yu et al. (2016a); Link et al. (2017) which enables rapid, broadband and precise analysis, or ultra-sensitive cavity-enhanced spectroscopy Thorpe et al. (2006); Bernhardt et al. (2010); Bjork et al. (2016). Triggered by a significant number of applications such as pharmaceutical, environmental or medical breath analysis Manolis (1983); Miekisch et al. (2004); McCurdy et al. (2007); Thorpe et al. (2008); Wang and Sahay (2009); Wojtas et al. (2014), mid-IR spectroscopy has attracted substantial attention in the past decade. A variety of methods have been developed to generate mid-IR frequency combs Schliesser et al. (2012), such as nonlinear frequency conversion including both optical parametric oscillators (OPOs) Adler et al. (2009); Leindecker et al. (2011, 2012); Vodopyanov et al. (2011); Petrov (2012); Jin et al. (2014) and difference frequency generation (DFG) Keilmann and Amarie (2012); Ruehl et al. (2012); Cruz et al. (2015), phase-locked states in quantum cascade lasers Hugi et al. (2012), microresonator based Kerr frequency combs Wang et al. (2013); Griffith et al. (2015); Luke et al. (2015); Yu et al. (2016b) or using mid-IR mode-locked lasers Sorokin et al. (2007); Vasilyev et al. (2014, 2016).
Moreover, recent work has also highlighted the potential to generate mid-IR optical frequency combs from coherent supercontinuum process in nano-photonic waveguides Lee et al. (2014); Kuyken et al. (2015). Supercontinuum generation (SCG) is an effective method of producing ultra-broadband spectra from mode-locked pulsed lasers, which has been well studied in photonic crystal fibers Dudley et al. (2006). For sufficiently short pulses and in a short interaction length, the spectrum can be coherent, thereby preserving the comb structure of the seed laser, which subsequently enables the carrier-envelope phase stabilization via self-referencing Jones et al. (2000); Cundiff and Ye (2003). When applying this process in chip-based nano-photonic waveguides, the pulse energy can be substantially reduced owing to the large Kerr nonlinearity and tight confinement. Today, nano-photonic waveguide-based SCG has been extensively studied in the visible and near-infrared (near-IR), particularly those made from silicon and silicon nitride () Halir et al. (2012); Epping et al. (2015); Zhao et al. (2015); Boggio et al. (2016); Liu et al. (2016); Porcel et al. (2017), and has enabled carrier-envelope frequency detection Mayer et al. (2015); Yoon Oh et al. (2017); Hickstein et al. (2017), full phase stabilization of frequency combs Carlson et al. (2017a, b), as well as offset-free frequency comb generation by DFG Mayer et al. (2016). Yet, accessing the mid-IR region and generating coherent frequency combs remain a challenge. While mid-IR frequency comb generation from coherent SCG has been reported in silicon waveguides Kuyken et al. (2015), it required using pump lasers placed at the onset of the mid-IR () to avoid silicon two-photon absorptions (TPA). For accessing the mid-IR, dispersion engineering actually plays a key role in extending the long wavelength portion of the supercontinuum Lau et al. (2014). Soliton induced dispersive wave generation is the mechanism Akhmediev and Karlsson (1995) that can induce a coherent and efficient light conversion over a large frequency span, and facilitate ultra-broadband SCG beyond the self-phase modulation (SPM) regime. In this context, the emergence of a zero dispersion wavelength at the longer wavelength side to the pump source is necessarily required Frosz et al. (2005); Lee et al. (2014); Lau et al. (2014), which however is also challenged by the fact that the waveguide dispersion has to counterbalance strong and anomalous material dispersion, implying an operation approaching the waveguide cut-off region. Although the cut-off is not present for fully clad waveguides, the loss of confinement towards the mid-IR causes the cladding absorption to become relevant.
Here we show that by using nano-photonic waveguides these challenges can be overcome. We demonstrate the ability to synthesize mid-IR frequency combs directly from an erbium-fiber based femtosecond laser at in the telecommunication band (telecom-band), based on mid-IR dispersive wave emission. waveguide is known for its large band-gap and absence of TPA in the telecom-band, as well as large effective nonlinearity and wide transparency window ranging from the visible to the mid-IR () Moss et al. (2013). We developed a dedicated large-cross-section waveguide that supports both mid-IR wave confinement and flexible dispersion engineering. We demonstrate that the generated mid-IR comb inherits the high level of phase coherence from the pump laser, and with a lithographic control such a comb can cover up to , thereby covering the functional group region including common single-bond vibrational modes such as , , and .
II Setup and principle
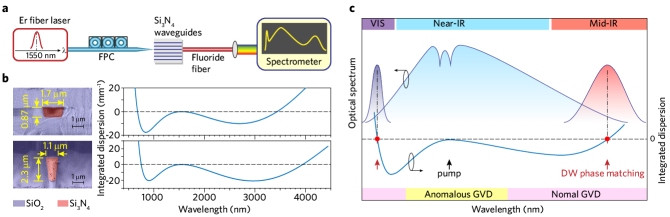
The experimental setup is shown in Fig. 1(a). The pump source is a compact mode-locked, erbium-fiber based femtosecond laser (ELMO, Menlo Systems GmbH) that emits a pulse train with a repetition rate of . The laser pulse duration (full width at half maximum, FWHM) is , average power , pulse energy . The laser is connected to a fiber polarization controller (FPC) and coupled into the chip via a lensed fiber, and with inverse tapers at both input and output sides of the waveguide. The insertion loss is . It is noted that the pump pulse duration is broadened to before the lensed fiber, as measured by an autocorrelator, due to the dispersive effect induced by the FPC. Approximately, a pulse energy of is launched into the waveguide. The waveguide output is then collected by a multimode fluoride fiber (NA ). The spectra are recorded with two grating-based optical spectrum analyzers (OSAs) covering the wavelength range from , and with a Fourier-transform infrared (FTIR) spectrometer resolving wavelengths up to .
We investigated two classes of waveguides, see Fig. 1(b), both are fabricated using the photonic Damascene process Pfeiffer et al. (2016) which allows for a deposited layer as thick as . While the first class of waveguides has a core height of , the second class has a much larger waveguide cross-section making use of the conformal deposition of in LPCVD (cf. Method). This leads to a core height as large as while the core width is limited to (i.e twice the deposition thickness). The waveguide length is .
The design of the waveguide is mainly reflected on lithographic control of the core width. By reaching a compromise between mid-IR wave confinement and dispersion engineering, the waveguide would enable both the soliton regime on the pump pulse and the mid-IR dispersive wave generation. Physically, the soliton regime requires anomalous group velocity dispersion (GVD) in the waveguide such that soliton pulses are supported as a result of the balance between the dispersion and the nonlinearity. For coherent SCG, the waveguide is designed for the nonlinear effect to be stronger than the dispersion effect on the pump pulse, namely a dispersion length exceeding the nonlinearity length, i.e. (, is the pump pulse duration, is the GVD, , is the effective nonlinearity, is the material nonlinear refractive index, is the nonlinear effective mode area, is the peak power of the pump pulse). This enables a soliton number () greater than unity such that, during the pulse propagation, soliton self-compression occurs and the spectrum is broadened via SPM Agrawal (2013). Theoretically, the first compression point , corresponding to the first occurrence of the SCG, is scaled by the soliton number (), whereas the compression factor revealing the capability of SPM-induced broadening is ( is the pulse duration at the first compression point) Chen and Kelley (2002).
SPM is a coherent nonlinear mechanism when the soliton number is relatively low, typically . Therefore, the determination of the soliton number () indicates a trade-off between the spectral coherence and the bandwidth of the supercontinuum. In addition to SPM, higher-order dispersion will induce perturbations to the soliton dynamics, in particular leading to the dispersive wave generation that can further extend the bandwidth of the soliton-based supercontinuum. This enables octave-spanning SCG while maintaining a high level of coherence. In waveguides, coherent SCG in combination with dispersive wave generation can be implemented within a distance of a few millimeters when having a pump of femtosecond pulses with kilo-watt peak power Epping et al. (2015); Zhao et al. (2015); Mayer et al. (2015, 2016); Liu et al. (2016); Porcel et al. (2017); Carlson2017NIST. Importantly, the phase matching condition between the dispersive wave (at a frequency ) and the dispersionless soliton pulse (centered at frequency and having a group velocity ) is:
| (1) |
where is the propagation constant of the wave propagating in the waveguide. Since the nonlinear contribution to the soliton phase () is negligible compared to , equation (1) can be rewritten to express the phase mismatch between the dispersive wave and the soliton as:
| (2) | ||||
| (3) |
which is equivalent to the integrated dispersion (defined as ) in the waveguide. In addition, has a negligible Raman effect compared to silica (as recently measured Karpov et al. (2016)), which explains the absence of Raman-induced soliton fission as well as the Raman self-frequency shift in the SCG. Based on a full knowledge of material properties (e.g. the refractive index of and the Kerr nonlinearity) and a precise lithographic control of the geometry in the nano-fabrication, the waveguide dispersion as well as the nonlinear effective mode area can be simulated by a finite element method (COMSOL).
Profiles of the integrated dispersion corresponding to both classes of waveguides are shown in Fig. 1(b), in which a dispersive wave phase matching point can be found in the mid-IR range. In particular, with a large flexibility of dispersion engineering enabled in large-cross-section waveguides, such phase matching is further extended to . Therefore, mid-IR dispersive wave generation is expected in such waveguides, as schematically indicated in Fig. 1(c).
III Mid-infrared frequency comb based on dispersive wave generation
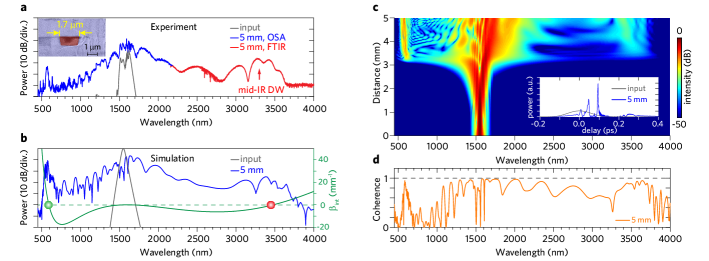
The first experiment is carried out in a set of waveguides with a height of (identical to the thickness of the deposited layer) and with a waveguide width of , where octave-spanning supercontinua are observed. In particular, in the waveguide with the width of , the spectrum covers more than two octaves, see Fig. 2 (a), spanning from the visible () to the mid-IR (), and containing two dispersive waves at both edges of the spectrum. Light propagates in the mode.
A numerical simulation based on the nonlinear Schrödinger equation (NLSE) could reproduce the supercontinuum with a high level of agreement, see Fig. 2 (b), which further provides an insight into soliton dynamics during the propagation. First, the first compression point is around where dispersive waves start to be emitted, see Fig. 2 (c), which matches with experimental observations of visible green light scattered off the waveguide at the corresponding position. To simulate a close-to-realistic pump source, we pre-chirped the pulse at the input to match a comparable duration. This leads to almost no broadening in the beginning stage of the propagation. As a consequence, the first compression point occurs at a longer propagation distance than what is estimated. Second, the wavelengths of both visible and mid-IR dispersive waves match well with experimental observations. The phase matching condition is confirmed at these wavelengths by the waveguide dispersion simulation. With dispersive waves on both wavelength sides of the pump pulse, the soliton recoil effect is mutually compensated, resulting in negligible spectral shift of the soliton. Moreover, ripples on the spectrum can be understood as the result of the soliton fission effect by which the input pulse is split into several solitons that lead to a spectral interference. The number of split solitons is determined by the soliton number . With a low soliton number, the soliton-fission-induced incoherence is weak. Therefore, the supercontinuum with soliton-seeded dispersive waves is likely to inherit the high coherence of the mode-locked pump laser. In simulations, the degree of first-order coherence can be evaluated via Dudley and Coen (2002):
| (4) |
where and are the envelopes of supercontinua from two independent simulations with randomly generated noise, equivalent to one photon per mode. An averaged modulus of considering 50 runs of the simulation indicates that the presented spectrum is robust to the noise, see Fig. 2 (d).
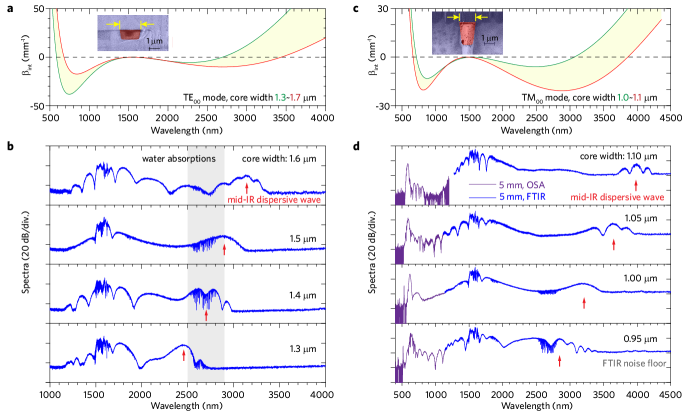
Moreover, comparing supercontinua from waveguides with different widths, we observed the tuning of the mid-IR dispersive wave, see Fig. 3(a,b), as the phase-matching wavelength is modified. Interestingly, in our waveguides, we notice a double benefit from increasing the waveguide width. First, the enlarged cross section favors light guiding at longer wavelengths in mid-IR. Second, the dispersive wave is generated further in the mid-IR as well. However, this set of waveguides shows weak confinement at around , mostly limited by the height ()– a feature dictated by the deposition process. It is also noted that the measured supercontinuum features water absorption lines in the range of , which is attributed to occur within the FTIR, see Fig. 3(b).
To achieve mid-IR dispersive wave generation at even longer wavelengths, we turn to large-cross-section waveguides which have a height of and a width of . Such waveguides then enable wave confinement for longer wavelengths and a larger flexibility of dispersion engineering, compared to the first class. The simulated dispersion profile indicates that in such waveguides the dispersive wave phase matching wavelength can be tuned over the wavelength range , see Fig. 3 (c), which covers the functional group region. Indeed, when pumping with the telecom-band femtosecond laser, we observed ultra-broadband SCG in combination with mid-IR dispersive wave generation in this range, see Fig. 3 (d). Apart from the mid-IR dispersive wave, the wavelength of the visible dispersive wave (generated simultaneously in the waveguide) is slightly changed, as indicated by the phase matching condition. Raised by two dispersive waves, the supercontinuum in the large-cross-section waveguides can span up to three octaves. In spite of a conversion efficiency from the pump to the mid-IR dispersive wave that decreases when the latter red-shifts, the low soliton number configuration should lead to a high coherence degree over most of the generated supercontinua.
IV Coherence measurement of the Mid-infrared frequency comb
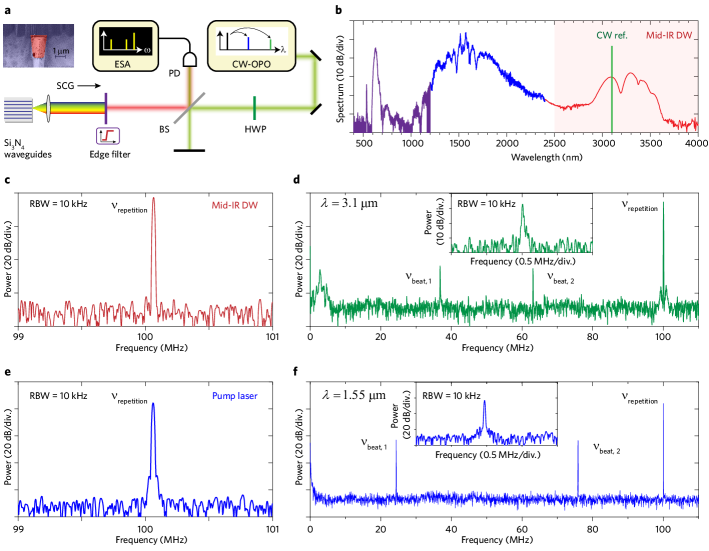
Ideally, the mid-IR dispersive wave would perform as a frequency comb that inherits the coherence from the pump source. However, it is critical to confirm the coherence, which can be lost due to a variety of processes. Here, we experimentally investigate the phase coherence of such mid-IR frequency combs generated in our waveguides by beatnote measurements with a narrow-linewidth continuous wave (CW). Such a characterization technique for assessing comb coherence properties is known as an alternative Cundiff and Ye (2003); Gohle et al. (2005); Wang et al. (2013); Burghoff et al. (2014); Kuyken et al. (2015) to that involving the interferometer Udem et al. (2002); Cundiff and Ye (2003). In the characterization, the mid-IR wave packet of the supercontinuum is filtered by a long-pass edge-filter (wavelength at ). We subsequently both measure the repetition beatnote of the filtered mid-IR frequency comb alone, and beat it with a tunable CW-OPO (Argos Aculight, , linewidth ), on a fast IR detector (Vigo, PVMI-4TE-8), see Fig. 4(a) for a sketch of the setup.
Figure 4(b) shows one optical spectrum of the supercontinuum used for the mid-IR coherence measurement, which is generated in a waveguide with the cross-section of . Such a supercontinuum contains a mid-IR wave packet that is well separated from the spectral contents in the visible and the near-IR, spanning from , and maintains its spectral envelope after the edge-filter. The overall power in the mid-IR is . The repetition beatnote of such a mid-IR frequency comb is shown in Fig. 4(c), under a resolution bandwidth of , where a narrow-linewidth beat signal is observed indicating the repetition frequency () of the comb. The signal-to-noise (SNR) ratio is above and the short-term linewidth is . The heterodyne beatnote between the mid-IR frequency comb and the CW-OPO, at the wavelength of , is shown in 4(d), where within a span of three isolated beatnotes are observed. The strongest beat signal at again corresponds to the repetition frequency, while the other two beatnotes correspond to the beat signal generated by the CW-OPO and the two spectrally closest lines of the mid-IR frequency comb. Such CW-beatnotes have a SNR ratio above and a linewidth below . We also directly characterized the femtosecond seed laser in the telecom-band, in terms of measuring both the repetition beatnote (Fig. 4(e)) and the CW-beatnote (Fig. 4(f)) with a low-noise single-frequency fiber laser (NKT Koheras, linewidth ). Compared with the coherence properties of the seed laser, no noticeable broadening is observed in both types of beatnote for the mid-IR frequency comb, implying a high-level of coherence inherited from the seed laser in the telecom-band to the mid-IR wave packet, via SCG. Our investigation therefore demonstrates a coherent regime of mid-IR frequency comb generation.
V Conclusion
We presented a compact and simple platform for mid-IR optical frequency comb generation which can access the functional group region through dispersive wave generation in the coherent supercontinuum process. This process allows for pumping in the telecom-band where a variety of seed lasers, e.g. erbium-fiber based femtosecond laser, can be accessed. Using large-cross-section nano-photonic waveguides, spectral broadening is governed by both the SPM effect in the soliton self-compression regime, and dispersive wave formation in both the visible and the mid-IR range, resulting in an overall bandwidth spanning up to three octaves. In particular, the high-level phase coherence can be transferred from the seed laser to the dispersive wave in the mid-IR. The ability to achieve a mid-IR optical frequency comb directly from a telecom-band femtosecond laser with a chip-based nano-photonic waveguide has several promising applications. In contrast to other approaches, based on OPO or DFG for example, the present approach can be very cost effective and compact, and can be readily extended for dual-comb spectroscopy Lee et al. (2001); Schiller (2002); Keilmann et al. (2004); Schliesser et al. (2005); Yasui et al. (2005).
Acknowledgements.
This publication was supported by Contract W31P4Q-16-1-0002 (SCOUT) from the Defense Advanced Research Projects Agency (DARPA), Defense Sciences Office (DSO). This material is based upon work supported by the Air Force Office of Scientific Research, Air Force Material Command, USAF under Award No. FA9550-15-1-0099. H.G. acknowledges support by funding from the European Union’s Horizon 2020 research and innovation programme under Marie Sklodowska-Curie IF grant agreement No. 709249. A.B., D.G. and C.S.B. acknowledge support from the European Research Council under grant agreement ERC-2012- StG 306630-MATISSE. All samples were fabricated and grown in the Center of MicroNanoTechnology (CMi) at EPFL.Methods
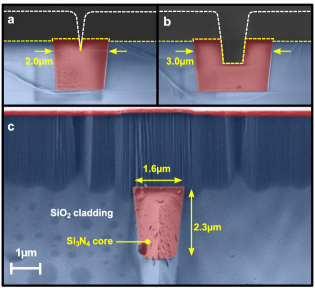
Large-size waveguides beyond cracking limitation — The fabrication of large-size waveguides is challenging as the tensile stress in layers by LPCVD can lead to cracks when the layer thickness is increased. In practice, the maximum crack-free film thickness for our process was found to be . Here we achieve the fabrication of a large-size waveguides with a height as large as using the photonic Damascene process. Importantly, we make use of the high surface mobility provided by the dichlorosilane (SiH2Cl2) and ammonia (NH3) chemistry during LPCVD. This allows a high conformality when depositing the film onto the pre-structured substrate. The result is shown in Fig. 5 on cross sections of filled trenches with different widths. In the panels (a) and (b), the cross sections were imaged after the planarization step, included in the photonic Damascene process flow. The dashed white line indicates the cross section of the film right after deposition. From Fig. 5 (b) it can be seen that the preform (blue) is conformally filled with (red), i.e. deposition rates for layers growing from the bottom and from the sides are identical. As the trench width approaches less than 2-times the film thickness (i.e. ), the gap begins to close, as shown in Fig. 5 (a). This enables us to fabricate waveguides with a height of and a maximum width of . No voids were observed in such large-size waveguides. There is a slightly slanted sidewall angle of . An example of such a waveguide with a width of is shown in Fig. 5 (c).
References
- Schliesser et al. (2012) A. Schliesser, N. Picqué, and T. W. Hänsch, Nature Photon. 6, 440 (2012).
- Lee et al. (2001) S.-J. Lee, B. Widiyatmoko, M. Kourogi, and M. Ohtsu, Jpn. J. Appl. Phys 40, L878 (2001).
- Schiller (2002) S. Schiller, Opt. Lett. 27, 766 (2002).
- Keilmann et al. (2004) F. Keilmann, C. Gohle, and R. Holzwarth, Opt. Lett. 29, 1542 (2004).
- Schliesser et al. (2005) A. Schliesser, M. Brehm, F. Keilmann, and D. van der Weide, Opt. Express 13, 9029 (2005).
- Yasui et al. (2005) T. Yasui, E. Saneyoshi, and T. Araki, Appl. Phys. Lett. 87, 061101 (2005).
- Coddington et al. (2008) I. Coddington, W. C. Swann, and N. R. Newbury, Phys. Rev. Lett. 100, 013902 (2008).
- Giaccari et al. (2008) P. Giaccari, J.-D. Deschênes, P. Saucier, J. Genest, and P. Tremblay, Opt. Express 16, 4347 (2008).
- Coddington et al. (2010) I. Coddington, W. Swann, and N. Newbury, Phys. Rev. A 82, 043817 (2010).
- Bernhardt et al. (2010) B. Bernhardt, A. Ozawa, P. Jacquet, M. Jacquey, Y. Kobayashi, T. Udem, R. Holzwarth, G. Guelachvili, T. W. Hänsch, and N. Picqué, Nature Photon. 4, 55 (2010).
- Zhang et al. (2013) Z. Zhang, T. Gardiner, and D. T. Reid, Opt. Lett. 38, 3148 (2013).
- Ideguchi et al. (2014) T. Ideguchi, A. Poisson, G. Guelachvili, N. Picqué, and T. W. Hänsch, Nature Commun. 5, 3375 (2014).
- Villares et al. (2014) G. Villares, A. Hugi, S. Blaser, and J. Faist, Nature communications 5, 5192 (2014).
- Coddington et al. (2016) I. Coddington, N. Newbury, and W. Swann, Optica 3, 414 (2016).
- Millot et al. (2016) G. Millot, S. Pitois, M. Yan, T. Hovhannisyan, A. Bendahmane, T. W. Hänsch, and N. Picqué, Nature Photon. 10, 27 (2016).
- Suh et al. (2016) M.-G. Suh, Q.-F. Yang, K. Y. Yang, X. Yi, and K. J. Vahala, Science 354, 600 (2016).
- Yu et al. (2016a) M. Yu, Y. Okawachi, A. G. Griffith, N. Picqué, M. Lipson, and A. L. Gaeta, arXiv:1610.01121 (2016a).
- Link et al. (2017) S. Link, D. Maas, D. Waldburger, and U. Keller, Science , eaam7424 (2017).
- Thorpe et al. (2006) M. J. Thorpe, K. D. Moll, R. J. Jones, B. Safdi, and J. Ye, Science 311, 1595 (2006).
- Bjork et al. (2016) B. J. Bjork, T. Q. Bui, O. H. Heckl, P. B. Changala, B. Spaun, P. Heu, D. Follman, C. Deutsch, G. D. Cole, M. Aspelmeyer, et al., Science 354, 444 (2016).
- Manolis (1983) A. Manolis, Clin. Chem. 29, 5 (1983).
- Miekisch et al. (2004) W. Miekisch, J. K. Schubert, and G. F. Noeldge-Schomburg, Clin. Chim. Acta 347, 25 (2004).
- McCurdy et al. (2007) M. R. McCurdy, Y. Bakhirkin, G. Wysocki, R. Lewicki, and F. K. Tittel, J. Breath Res. 1, 014001 (2007).
- Thorpe et al. (2008) M. J. Thorpe, D. Balslev-Clausen, M. S. Kirchner, and J. Ye, Opt. Express 16, 2387 (2008).
- Wang and Sahay (2009) C. Wang and P. Sahay, Sensors 9, 8230 (2009).
- Wojtas et al. (2014) J. Wojtas, F. Tittel, T. Stacewicz, Z. Bielecki, R. Lewicki, J. Mikolajczyk, M. Nowakowski, D. Szabra, P. Stefanski, and J. Tarka, Int. J. Thermophys 35, 2215 (2014).
- Adler et al. (2009) F. Adler, K. C. Cossel, M. J. Thorpe, I. Hartl, M. E. Fermann, and J. Ye, Opt. Lett. 34, 1330 (2009).
- Leindecker et al. (2011) N. Leindecker, A. Marandi, R. L. Byer, and K. L. Vodopyanov, Opt. Express 19, 6296 (2011).
- Leindecker et al. (2012) N. Leindecker, A. Marandi, R. L. Byer, K. L. Vodopyanov, J. Jiang, I. Hartl, M. Fermann, and P. G. Schunemann, Opt. Express 20, 7046 (2012).
- Vodopyanov et al. (2011) K. Vodopyanov, E. Sorokin, I. Sorokina, and P. Schunemann, Optics letters 36, 2275 (2011).
- Petrov (2012) V. Petrov, Opt. Mater. 34, 536 (2012).
- Jin et al. (2014) Y. Jin, S. M. Cristescu, F. J. Harren, and J. Mandon, Opt. Lett. 39, 3270 (2014).
- Keilmann and Amarie (2012) F. Keilmann and S. Amarie, Journal of Infrared, Millimeter, and Terahertz Waves 33, 479 (2012).
- Ruehl et al. (2012) A. Ruehl, A. Gambetta, I. Hartl, M. E. Fermann, K. S. Eikema, and M. Marangoni, Optics letters 37, 2232 (2012).
- Cruz et al. (2015) F. C. Cruz, D. L. Maser, T. Johnson, G. Ycas, A. Klose, F. R. Giorgetta, I. Coddington, and S. A. Diddams, Opt. Express 23, 26814 (2015).
- Hugi et al. (2012) A. Hugi, G. Villares, S. Blaser, H. Liu, and J. Faist, Nature 492, 229 (2012).
- Wang et al. (2013) C. Y. Wang, T. Herr, P. Del’Haye, A. Schliesser, J. Hofer, R. Holzwarth, T. Hänsch, N. Picqué, and T. J. Kippenberg, Nature Commun. 4, 1345 (2013).
- Griffith et al. (2015) A. G. Griffith, R. K. Lau, J. Cardenas, Y. Okawachi, A. Mohanty, R. Fain, Y. H. D. Lee, M. Yu, C. T. Phare, C. B. Poitras, et al., Nature Commun. 6, 6299 (2015).
- Luke et al. (2015) K. Luke, Y. Okawachi, M. R. Lamont, A. L. Gaeta, and M. Lipson, Opt. Lett. 40, 4823 (2015).
- Yu et al. (2016b) M. Yu, Y. Okawachi, A. G. Griffith, M. Lipson, and A. L. Gaeta, Optica 3, 854 (2016b).
- Sorokin et al. (2007) E. Sorokin, I. T. Sorokina, J. Mandon, G. Guelachvili, and N. Picqué, Opt. Express 15, 16540 (2007).
- Vasilyev et al. (2014) S. Vasilyev, M. Mirov, and V. Gapontsev, Opt. Express 22, 5118 (2014).
- Vasilyev et al. (2016) S. Vasilyev, I. Moskalev, M. Mirov, S. Mirov, and V. Gapontsev, Opt. Express 24, 1616 (2016).
- Lee et al. (2014) K. F. Lee, N. Granzow, M. A. Schmidt, W. Chang, L. Wang, Q. Coulombier, J. Troles, N. Leindecker, K. L. Vodopyanov, P. G. Schunemann, et al., Opt. Lett. 39, 2056 (2014).
- Kuyken et al. (2015) B. Kuyken, T. Ideguchi, S. Holzner, M. Yan, T. W. Hänsch, J. Van Campenhout, P. Verheyen, S. Coen, F. Leo, R. Baets, et al., Nature commun. 6, 6310 (2015).
- Dudley et al. (2006) J. M. Dudley, G. Genty, and S. Coen, Rev. Mod. Phys. 78, 1135 (2006).
- Jones et al. (2000) D. J. Jones, S. A. Diddams, J. K. Ranka, A. Stentz, R. S. Windeler, J. L. Hall, and S. T. Cundiff, Science 288, 635 (2000).
- Cundiff and Ye (2003) S. T. Cundiff and J. Ye, Rev. Mod. Phys. 75, 325 (2003).
- Halir et al. (2012) R. Halir, Y. Okawachi, J. S. Levy, M. A. Foster, M. Lipson, and A. L. Gaeta, Opt. Lett. 37, 1685 (2012).
- Epping et al. (2015) J. P. Epping, T. Hellwig, M. Hoekman, R. Mateman, A. Leinse, R. G. Heideman, A. van Rees, P. J. van der Slot, C. J. Lee, C. Fallnich, and K.-J. Boller, Opt. Express 23, 19596 (2015).
- Zhao et al. (2015) H. Zhao, B. Kuyken, S. Clemmen, F. Leo, A. Subramanian, A. Dhakal, P. Helin, S. Severi, E. Brainis, G. Roelkens, and R. Baets, Opt. Lett. 40, 2177 (2015).
- Boggio et al. (2016) J. M. C. Boggio, A. O. Monux, D. Modotto, T. Fremberg, D. Bodenmüller, D. Giannone, M. M. Roth, T. Hansson, S. Wabnitz, E. Silvestre, and L. Zimmermann, J. Opt. Soc. Am. B 33, 2402 (2016).
- Liu et al. (2016) X. Liu, M. Pu, B. Zhou, C. J. Krückel, A. Fülöp, V. Torres-Company, and M. Bache, Opt. Lett. 41, 2719 (2016).
- Porcel et al. (2017) M. A. G. Porcel, F. Schepers, J. P. Epping, T. Hellwig, M. Hoekman, R. G. Heideman, P. J. M. van der Slot, C. J. Lee, R. Schmidt, R. Bratschitsch, C. Fallnich, and K.-J. Boller, Opt. Express 25, 1542 (2017).
- Mayer et al. (2015) A. S. Mayer, A. Klenner, A. R. Johnson, K. Luke, M. R. E. Lamont, Y. Okawachi, M. Lipson, A. L. Gaeta, and U. Keller, Opt. Express 23, 15440 (2015).
- Yoon Oh et al. (2017) D. Yoon Oh, K. Y. Yang, C. Fredrick, G. Ycas, S. A. Diddams, and K. J. Vahala, Nature Commun. 8, 13922 (2017).
- Hickstein et al. (2017) D. D. Hickstein, H. Jung, D. R. Carlson, A. Lind, I. Coddington, K. Srinivasan, G. G. Ycas, D. C. Cole, A. Kowligy, C. Fredrick, et al., arXiv:1704.03908 (2017).
- Carlson et al. (2017a) D. Carlson, D. Hickstein, A. Lind, J. Olson, R. Fox, R. Brown, A. Ludlow, Q. Li, D. Westly, H. Leopardi, et al., arXiv:1702.03269 (2017a).
- Carlson et al. (2017b) D. R. Carlson, D. D. Hickstein, A. Lind, S. Droste, D. Westly, N. Nader, I. Coddington, N. R. Newbury, K. Srinivasan, S. A. Diddams, et al., Opt. Lett. 42, 2314 (2017b).
- Mayer et al. (2016) A. S. Mayer, C. R. Phillips, C. Langrock, A. Klenner, A. R. Johnson, K. Luke, Y. Okawachi, M. Lipson, A. L. Gaeta, M. M. Fejer, and U. Keller, Phys. Rev. Applied 6, 054009 (2016).
- Lau et al. (2014) R. K. W. Lau, M. R. E. Lamont, A. G. Griffith, Y. Okawachi, M. Lipson, and A. L. Gaeta, Opt. Lett. 39, 4518 (2014).
- Akhmediev and Karlsson (1995) N. Akhmediev and M. Karlsson, Phys. Rev. A 51, 2602 (1995).
- Frosz et al. (2005) M. H. Frosz, P. Falk, and O. Bang, Opt. Express 13, 6181 (2005).
- Moss et al. (2013) D. J. Moss, R. Morandotti, A. L. Gaeta, and M. Lipson, Nature Photon. 7, 597 (2013).
- Dudley and Coen (2002) J. M. Dudley and S. Coen, Opt. Lett. 27, 1180 (2002).
- Pfeiffer et al. (2016) M. H. P. Pfeiffer, A. Kordts, V. Brasch, M. Zervas, M. Geiselmann, J. D. Jost, and T. J. Kippenberg, Optica 3, 20 (2016).
- Agrawal (2013) G. Agrawal, Nonlinear Fiber Optics, Academic Press (Academic Press, 2013).
- Chen and Kelley (2002) C.-M. Chen and P. L. Kelley, J. Opt. Soc. Am. B 19, 1961 (2002).
- Karpov et al. (2016) M. Karpov, H. Guo, A. Kordts, V. Brasch, M. H. P. Pfeiffer, M. Zervas, M. Geiselmann, and T. J. Kippenberg, Phys. Rev. Lett. 116, 103902 (2016).
- Gohle et al. (2005) C. Gohle, T. Udem, M. Herrmann, J. Rauschenberger, R. Holzwarth, H. A. Schuessler, F. Krausz, and T. W. Hänsch, Nature 436, 234 (2005).
- Burghoff et al. (2014) D. Burghoff, T.-Y. Kao, N. Han, C. W. I. Chan, X. Cai, Y. Yang, D. J. Hayton, J.-R. Gao, J. L. Reno, and Q. Hu, Nature Photon. 8, 462 (2014).
- Udem et al. (2002) T. Udem, R. Holzwarth, and T. W. Hänsch, Nature 416, 233 (2002).