11email: roquette@fisica.ufmg.br 22institutetext: Univ. Grenoble Alpes, CNRS, IPAG, F-38000 Grenoble, France
33institutetext: INAF - Osservatorio Astronomico di Palermo, Piazza del Parlamento 1, I-90134, Palermo, Italy
Near-Infrared Time-Series Photometry in the Field of Cygnus OB2 Association
Abstract
Context. In the last decades, the early pre main sequence stellar rotational evolution picture has been constrained by studies targetting different regions at a variety of ages with respect to young star formation. Observational studies suggest a dependence of rotation with mass, and for some mass ranges a connection between rotation and the presence of a circumstellar disk. Not still fully explored, though, is the role of environmental conditions on the rotational regulation.
Aims. We investigate the rotational properties of candidate members of the young massive association Cygnus OB2. By evaluating their rotational properties, we address questions regarding the effect of environment properties on PMS rotational evolution.
Methods. We studied JHK-band variability in 5083 candidate members (24 of them are disk-bearing stars). The selection of variable stars was done using Stetson variability index, and period search was performed using Lomb-Scargle periodogram for periods between 0.83-45 days. Period detections were verified by using False Alarme Probability levels, the Saunders statistics, string/rope length method, and visual verification of folded light curves.
Results. We identified 1224 periodic variable stars (24 of the candidate member sample, 8 of the disk-bearing sample, and 28 of the non-disked sample). Monte Carlo simulations were performed in order to evaluate completeness and contamination of the periodic sample, out of which 894 measured periods were considered reliable. Our study was considered reasonably complete for periods between 2 and 30 days.
Conclusions. The general scenario for the rotational evolution of young stars seen in other regions is confirmed by Cygnus OB2 period distributions, with disked stars rotating on average slower than non-disked stars. A mass-rotation dependence was also verified, but as in NGC 6530, very low mass stars () are rotating on average slower than higher mass stars (). We observed an excess of slow rotators among the lower mass population. The disk and mass-rotation connection was also analysed by taking into account the incident UV radiation arising from O stars in the association. Results compatible with the disk-locking scenario were verified for stars with low UV incidence, but no statistical significant relation between rotation and disk presence was verified for stars with high UV incidence suggesting that massive stars can have an important role on regulating the rotation of nearby low mass stars.
Key Words.:
infrared: stars – stars: variables: T Tauri – stars: low-mass – stars: formation – stars: pre main sequence – stars: rotation1 Introduction
The angular momentum (AM) evolution during the early stages of the stellar life is one of the most fundamental questions currently under debate (e.g., Bodenheimer, 1995). If AM conservation was the sole responsible for the early rotational evolution during star contraction towards the zero age main sequence (ZAMS) phase, pre main sequence (PMS) stars should reach their first few Myr with spin rates close to critical values (when the centrifugal forces balance gravity). On the contrary, observations mapping rotational velocities of low mass PMS stars (hereafter T Tauri stars; TTS, Joy, 1945) found that their typical rotational velocities are only a fraction of their critical velocities (e.g. Vogel & Kuhi, 1981; Bouvier et al., 1986). This suggests that there must exist some ongoing physical mechanisms on such stars that counteract the spin-up expected from stellar contraction.
The AM of a forming star is determined by both internal and external physical processes. Internal processes determine how AM is transported in the stellar interior. The most popular scenario assumes that a radiative core and a convective envelope rotate as solid bodies but with different angular velocities (e.g. Gallet & Bouvier, 2013). External processes are responsible for the AM loss from the stellar surface, and models for such processes include the magnetic star-disk interaction (e.g., Ghosh & Lamb, 1979; Matt & Pudritz, 2005), accretion-powered stellar winds (e.g., Matt et al., 2012), and mass ejections (e.g., Conical Winds: Zanni & Ferreira, 2013; Romanova et al., 2009). To constrain the physical models, recent studies have been looking for correlations between stellar rotation rates and parameters like stellar mass, circumstellar disk indicators, X-ray emission, and mass accretion rates.
A controversial issue still in debate is the “disk-locking” process (e.g., Ghosh & Lamb, 1979; Koenigl, 1991), which is based on the observational evidence that accreting stars are on average slower rotators than non-accreting stars. According to the disk-locking scenario, PMS stars still magnetically interacting with their disks would be prevented from spinning-up via star-disk interaction, despite the fact that they are contracting towards the ZAMS. Consequently, they would remain with almost constant rotational velocity during their first few Myr. The disk- locking model can be validated by observing a correlation between existent/absent mass accretion diagnosis and the star’s rotational status as a slow/fast rotator. Studies supporting the disk-locking scenario found that during the first few Myr of their evolution, PMS stars of solar mass (0.4M⊙M1.4M⊙) present a bi-modal period distribution, with disk-bearing stars having typical periods between 3-10 days, while non-disked stars have periods between 1-7 days (e.g. Rebull et al., 2004; Irwin et al., 2008; Rodríguez-Ledesma et al., 2009; Littlefair et al., 2010; Affer et al., 2013; Venuti et al., 2016). Recently, Vasconcelos & Bouvier (2015) used semi-empirical Monte Carlo simulations to investigate the effect of the disk-locking hypothesis on the period distributions of groups of coeval stars. They adopted a model where accreting stars have constant rotational periods (disk-locking), and non-disked stars conserve AM. They applied to the model values of mass accretion rates and disk lifetimes from the literature. They succeeded in reproducing the scenario observed in young clusters of several ages when they started their simulations with a bimodal period distribution at the age of 1 Myr: with disked stars rotating with periods of 86 days, and non-disked stars rotating with periods of 32 days. Nevertheless, disk-locking seems to be less efficient for very low mass stars (Lamm et al., 2005; Bouvier et al., 2014), and Cody & Hillenbrand (2010) found no correlation between disk presence and rotational periods for stars with masses below 0.5M⊙.
Interpreting period distributions in the light of disk-locking models may be a delicate process. Often, conclusions regarding the statistical significance of the differences between the rotational period distributions for classical TTS and weak-lined TTS - commonly seen as supportive of disk-locking scenario - are a controversial. The results reported in some studies are often not verified by other studies, even for the same group of stars. This is because external factors can easily introduce ambiguities in the period distribution interpretation. Among the typical observational biases there are the 1 day aliasing phenomenon introduced by Earth’s rotation in ground-based observations (to be discussed in Section 3.1), sample incompleteness, periodic sample with small statistics numbers, and physical aspects like the fact the rotational scenario is mass dependent, and therefore uncertainties in mass estimation can easily contaminate the results. Another recurrent physical contamination factor is the disk-diagnosis used to identify disk-bearing stars. Several studies (including the present one) used IR excess as indicative of disk presence, and despite being a good diagnosis for a dusty local environment, interpreted as a disk, it does not tell if there is indeed an active accretion process in the disk, and thus whether the star is still magnetically interacting with the disk.
Even with all those caveats, the best way to date to study AM evolution is still to measure rotational periods of groups of coeval stars in open cluster or associations, and then to assemble period distributions for clusters of different ages in an evolutionary sequence. In this direction, thousands of rotational periods of stars in young clusters and associations have been measured during the last decades (for a review see Bouvier et al., 2014). However, the assumption that each group represents a piece of the same time-line assumes that global environmental conditions do not play a significant role in the overall rotational evolution. Notwithstanding, some discrepant observational results for regions with similar age show that environmental conditions may have an important effect in the evolution of AM during the first Myr. Some examples are: the case of CepOB3b region (with age 4 - 5 Myr according to Littlefair et al., 2010), where the authors reported quite different rotational period distributions at very low mass (M0.4M⊙) than Irwin et al. (2008) reported for the similar aged NGC2362; and the case of IC348 and NGC2264 (age 1 - 3 Myr according to Littlefair et al., 2005), where stars of the former cluster were reported to be rotating slower than those of the latter cluster.
It is, therefore, mandatory to build statistically significant samples of stats with measured rotational periods in young regions with similar ages but different environments, in order to improve our understanding of the environmental conditions role in regulating the AM during PMS. In this context, massive young associations such as Cygnus OB2 (CygOB2) are valuable targets for investigating the effects of environment on the AM evolution.
CygOB2 is the closest young massive association to the Sun. Kiminki et al. (2015) recently reviewed its distance by studying four double-lined eclipsing binaries within the association, analysed using both photometry and spectroscopy. They found an average distance of 1.330.06 kpc to the association.
CygOB2 massive population has been investigated by photometric and spectroscopic studies in both optical and infrared bands (e.g. Reddish et al., 1966; Torres-Dodgen et al., 1991; Knödlseder, 2000; Comerón et al., 2002; Hanson, 2003; Drew et al., 2008; Rauw et al., 2015; Wright et al., 2015; Kiminki et al., 2015; Wright et al., 2016), and it is known for harbouring some of the brightest stars in the Galaxy. Some examples of its rich population are: the peculiar B supergiant CygOB212 (Massey & Thompson, 1991), two O3If stars (7 and 22-A from Walborn et al., 2002), and some Wolf-Rayet stars (e.g., WR 142a from Pasquali et al., 2002). There are 169 confirmed OB stars (Wright et al., 2015) among the association members.
Wright et al. (2016), as part of the DANCe (Dynamical Analysis of Nearby Clusters, Bouy et al., 2013) project, used high-precision proper motions of stars in the association to investigate its kinematic and dynamic. They suggested that CygOB2 formed pretty much as it is today: a highly sub-structured, globally unbound association. Beyond its massive population, CygOB2 is also a valuable target for studying the environmental influence on the formation and early evolution of low mass stars (MM⊙), and, in particular, to probe low mass star evolution in the vicinity of massive stars.
In the last decade, CygOB2 low mass population has been the target of several studies (e.g., Vink et al., 2008; Wright & Drake, 2009; Guarcello et al., 2012, 2013; Wright et al., 2014; Guarcello et al., 2015, 2016) and while some massive stars have ages as low as 2 Myr (e.g., Hanson, 2003), the low mass population age ranges mainly between 3 Myr and 5 Myr (Wright et al., 2010). Guarcello et al. (2013) used wide and deep photometry from r band to 24 m to unveil its disk-bearing population, finding 1843 disk-bearing candidates. As result of the Chandra Cygnus OB2 Legacy Survey, Wright et al. (2014) identified 7924 X-ray sources in the direction of the association. Guarcello et al. (2015) found that 5703 of the X-ray sources had optical and/or infrared counterparts. Using the optical and infrared photometry merged by Guarcello et al. (2015), Kashyap (2017) classified 5022 sources as candidate members. Guarcello et al. (2016) recently used the disk-bearing and non-disked candidate members to investigate the dissipation timescale of protoplanetary disks of low mass stars in the vicinity of massive stars. They analysed the spatial variation of the disk fraction across the association, and its correlation with the local ultraviolet radiation and stellar density. They found evidence that disks are more rapidly dissipated in regions with higher stellar density and more intense UV radiation within the association. They also found that disk dissipation due to close encounters is negligible in the association, and that disk dissipation is dominated by photoevaporation.
We used the results of a near-infrared (NIR) photometric variability survey in the direction of the association to address some questions regarding the association’s low mass population. We will present the first results of the survey in two papers. In this first paper we focus on a sample of periodic stars that were listed as candidate members in the literature. As most of periodic variability can be explained by the rotational modulation by spots at the stellar surface, we analyse the periodic sample in the context of angular momentum (AM) evolution for young stars. The general characteristics of the NIR variable sample, and the description of their variable behaviour inside the colour-magnitude and colour-colour diagrams will be presented in the second paper (Roquette et al 2017, in preparation).
The present paper is organized as follows: In Section 2 we outline the observations carried for the present survey, the data processing, and the light curve production, as well as data taken from the literature used to complement the study. In Section 3 we describe the methods applied for time series analysis and periodicity search. In Section 4 we present the results regarding the periodic stars, and in Section 5 we present conclusions and discuss the results inside the general young stellar AM scenario.
2 Analyzed Data
2.1 Observations
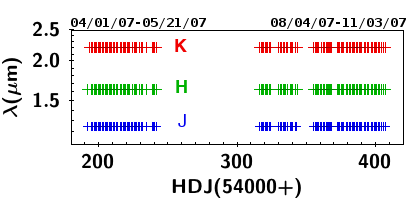
Our observational dataset was obtained with the 3.8m United Kingdom Infra-Red Telescope (UKIRT), at Manua Kea, Hawaii, equipped with the Wide Field Camera (WFCAM Casali et al., 2007), programs U/07A/H16 and U/07B/H60. Our complete dataset is composed by up to 115 nights observed using the J, H and K filter (Hewett et al., 2006). The observations were carried during 2007 in two seasons (Figure 1): The first season comprises 43 observed nights between April 1st, and May 21th; The second season comprises 73 observed nights between August 4th and November 3nd. The two observational seasons span a total of 217 days. The exposures were short, 2 seconds in each filter.
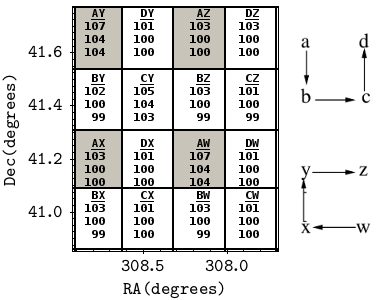
The WFCAM is composed of four 2048 2048 Rockwell Hawaii-II detectors (Casali et al., 2007, hereafter CCDs W, X, Y, and Z). The detectors are spaced with a separation of 94 of each detector’s width, such that four exposures (exposures A, B, C and D) are required in order to image a contiguous area of 0.87 squared degrees. WFCAM’s layout is schematically shown in Figure 2. The observed area was centered on , , which comprises approximately the center of CygOB2 association.
The data were pipeline-reduced and calibrated at the Cambridge Astronomy Survey Unit (CASU; Irwin et al. 2004; Hodgkin et al., 2009), and a source catalogue was provided. The source catalogue is composed by a set of fluxes measured with different aperture radii per source. As we need a single number for the flux in all images (in order to link the objects building consistent light curves), we followed CASU’s documentation and adopted flux number 3, which is a soft-edge aperture of radius. Data calibration was made by CASU’s pipeline using 2MASS sources with extinction-corrected colour 0.0J-K1.0 and signal-to-noise ratio in each filter (Hodgkin et al., 2009).
The images and catalogues were retrieved from the CASU server in January, 2008. Due to WFCAM 4-detectors layout (Figure 2), one night of observation in J, H, and K filters is composed by 443=48 frames/source catalogues. In order to build a light-curve catalogue from the 5640 tables, we created an IDL procedure to read, manipulate, and link sources from the tables provided by CASU. We excluded all sources with the Classification Flag in CASU’s catalogues indicating noise, borderline stellar or saturated objects.
Candidate Member Catalogue:
Our main goal is to determine the variability characteristics of young stellar objects (YSO) that belong to CygOB2 association. We searched the literature for candidate members and used their coordinates to build an input catalogue for cross-matching and merging all CASU tables together in a single multi-band light curve catalogue.
The candidate member catalogues used to compose the input catalogue were:
-
•
The list of disk-bearing stars from Guarcello et al. (2013, , hereafter GDW13), which contains 1843 stars;
- •
Each object from this input catalogue was examined for companions in CASU tables inside a radius of . Every time two objects were found inside this search radius, both objects were excluded in order to avoid contaminations into the light curves, and this selection rule accounts for most objects we could not recover inside our field of view (FOV). The catalogue was built processing region by region (AW, AX, and so on, cf. Figure 2). At the end, the 16 light curve catalogues were merged and objects in the overlapping region between the CCDs were merged into a single identifier.
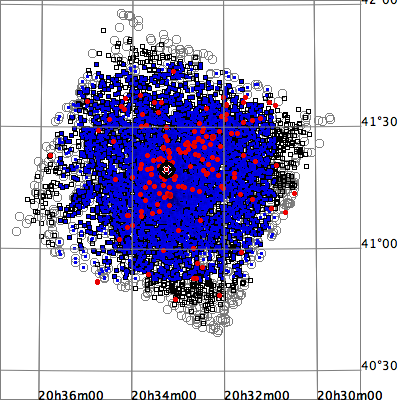
There were 100 OB stars on GDW15 and all those stars were saturated in our images. GDW15 and GDW13 have 403 low mass stars in common, and we recovered 354 of them (87.84). We recovered 1272 (69.02) disk-bearing stars from GDW13 and 4165 (85.63) X-ray sources from GDW15. Our final candidate member light-curve catalogue is composed by 5083 stars. The spatial distribution of those stars is shown in Figure 3.
Control Sample:
We built a control sample including all stars in the three central regions (AW, BZ and CY in Figure 2) regardless of confirmed membership. Non-variable stars selected from the control sample (as described in Section 3.2) were used to estimate limit values of the statistical indexes used for evaluating periodic stars, such as the false alarm probability for peaks in the Lomb/Scargle periodogram as it will be described on Section 3.1. For each region, we choose the best night in K band in terms of seeing, and generated an initial catalogue with the coordinates of all the stars observed on that night. The typical number of detected sources in the central fields was around 25000 for nights with good seeing. For each subsequent night and/or filter exposure for that region, we used a searching radius of 0.75 arcsec for each object already in the catalog. After a complete inspection, the objects in each exposure not matched with the light curve catalogue were added to it as new objects. A human-operator was necessary in the procedure in order to judge parameters and make decisions in how to proceed in case of ambiguities due to: 1- objects in the central fields being too crowded and, causing more than one object to be found inside the 0.75 arcsec radius search; 2- Seeing variations from night to night, causing variations in how many resolved objects were detected from one night to the other. 3- some objects presented proper motion with varying coordinates. 4- spurious objects inside the source catalogue, caused by defects in the data reduction which were not flagged by CASU processing.
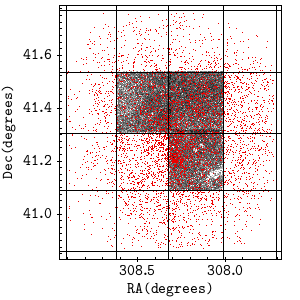
Using this method, we catalogued 42777 objects with more than 10 valid observations in at least one filter. Objects catalogued in the control sample are shown in gray in Figure 4, while objects in the candidate member catalogue are shown as red dots.
Corrected Errors:
After completing the multi-band light curve catalogues, we applied the empirically derived correction presented by Hodgkin et al. (2009) to the pipeline-estimated photometric errors.
| (1) |
where is the correct measured total error, is the pipeline-estimated photometric error, and (=1.082), and (=0.021) were empirically determined by Hodgkin et al. (2009). With this updated error, we confirmed the 2 level of night to night variations estimated by Hodgkin et al. (2009) for UKIRT/WFCAM data pipe-line reduced by the CASU, as can be verified in Figure 5.
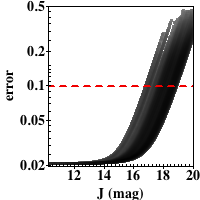
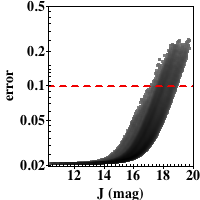
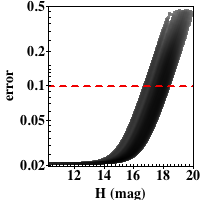
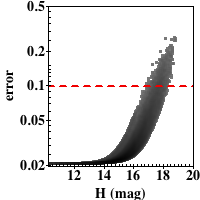
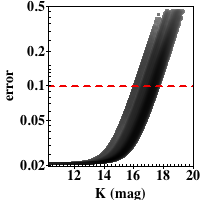
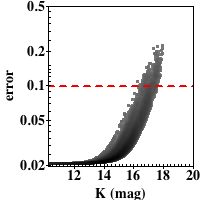
For each light curve, in order to remove individual points with error unusually higher than the light curve’s mean error, we did a two iterations 2-clipping in the error distribution around the mean error. After cleaning the complete candidate member sample, we analysed the outlier points and identified and removed the nights suffering from systematic errors (those for which more than 40 of the valid points in a certain filter). Eight observed nights were removed from the light curves given this criterion. Figure 5 shows the error distribution for each filter after removing these points and nights. To guarantee high quality photometry, we only used data points with error smaller than 0.1 magnitude.
2.2 Data from Literature
GDW13 composed an Optical-Infrared (OIR) catalogue using wide and deep photometry, from r band to 24 m, extracted from the literature. Their OIR catalogue is composed by 328540 sources in the field of CygOB2. The surveys used by the authors to build their catalogue were:
-
GTC/OSIRIS Catalogue (hereafter GDW12; Guarcello et al., 2012). r, i and z bands, 65349 sources. For sources with good photometry, as defined by GDW12, the catalog reaches r = ; for objects at the distance of 1400 pc, and using a 3.5 Myr isochrone (Wright et al., 2010), with the average extinction (from GDW12), this limit corresponds to a 0.16 star (Guarcello et al., 2013).
To select the disk-bearing stars, GDW13 applied several disk-diagnosis techniques to their OIR-catalogue, finding 1843 candidates. They also inferred the evolutionary status of the disked objects by studying their infrared spectral index, =, using Wilking et al. (2001) classification scheme: 8.4 of the disk-bearing stars were class I, 13.1 were flat-spectrum sources, 72.9 were class II sources, 2.3 were pre-transition disks, and 3.3 were transitional disks.
As part of the Chandra Cygnus OB2 Legacy Survey (Wright et al., 2014), a region of 1 square degree was covered using 36 Chandra/ACIS-I overlapping fields, and the authors detected and verified 7924 X-ray point sources in the observed region. GDW15 cross matched those X-ray sources with GDW13 OIR catalogue and found 5703 X-ray sources with OIR counterpart. From the list of X-ray OIR sources, Kashyap (2017) selected 4864 candidate members.
2.3 Completeness Of The Analysed Data
The completeness of the analysed data was estimated based on the drop in the number of detected objects in the magnitude distribution histograms for J, H, and K filters, which are shown in Figure 6 for the control and member candidate samples. For the control sample (left plots), the limit magnitude detected in each band was J 20.2 mag, H19.4 mag, and K19.0 mag. The samples are complete up to magnitudes J 19.2 mag, H17.9 mag, and K16.9 mag. For the candidate member sample (right plots), the limit magnitude detected in each band was J 18.8 mag, H18.2 mag, and K17.4 mag. The samples are complete up to magnitudes J 16.1 mag, H14.9 mag, and K14.3 mag.
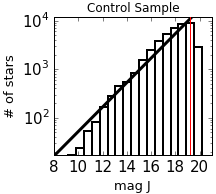
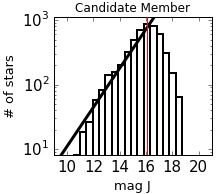
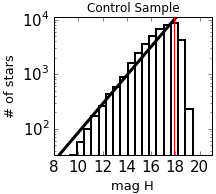
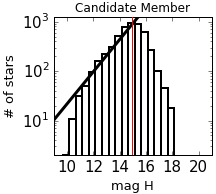
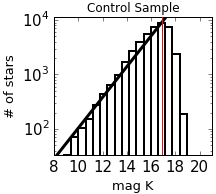
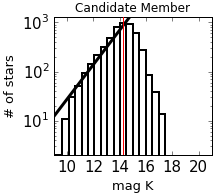
From Figure 6 one can see that the control sample goes deeper than the candidate member sample. This happens due to the lower completeness limits in the studies used to compose the candidate member sample. Also, there can be an incompleteness towards the brighter stars in both samples, but this incompleteness is not thought to interfere on the present work, as at the distance of CygOB2, the brightest stars in our sample would correspond to stars with intermediate mass, and those are out of the mass range of interest in the present work.
3 Time-Series Analysis
Initial variable selection was done using the Stetson Variability Index (Stetson, 1996), defined as:
| (2) |
where is a pair of observations, which has a weight wi, and is the total number of pairs of observations. is defined as the product of the normalized residuals of two observations and that constitute the -th pair, = , and as = when there is only one valid observation (). If one night has valid observations in all J, H and K filters, then there are three pairs of observations for that night. Following Carpenter et al. (2001), if the star has valid J, H, and K, then each pair of observation has weight = (total weight of 2 for the whole set), when there was a missing point, i. e., nonexistent observation in one or two filters, then a weight =1 was assigned. The normalized residuals are defined as:
| (3) |
for a given filter, where is the number of measurements used for determining the mean magnitude, , and is the photometric uncertainty for the measurement .
Designed this way, the Stetson Index sets uncorrelated non-variable stars with values of , and significant variables with . Different authors adopt different Stetson index limits for accounting for low-amplitude variable stars. For example, Carpenter et al. (2001) adopts , and Plavchan et al. (2008) found periodic variables down to . For the purposes of the present work we adopted a selection limit of for variable stars. The distribution of Stetson Variability Index as a function of magnitude H is shown in Figure 7.
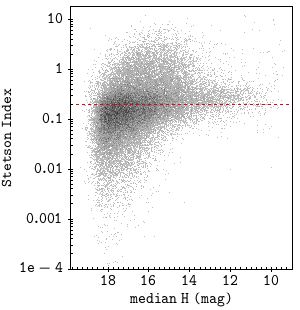
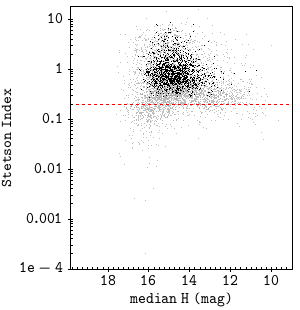
From the candidate member sample, 4079 (80) stars met the Stetson Variability criterion. We did a visual inspection of these candidate variable stars and organized them in morphological classes111 Details on the morphological classification will be present on Roquette (in preparation 2017), but for the purposes of the present study it is worth mentioning that: eclipse-like variables are stars which light curve points are most of the time in a maximum value of bright, but present several dimmings in bright (They may also be periodic). Candidate periodic stars present light curve oscillating between maximum and minimum values. Other variables encompasses all stars with a visibly variable light curves but that did not fit in the previous categories, like stars with long term variability (e.g., stars that are slowly dimming with time), and also stars with a mixed light curve (e.g. long term variability mixed with a short term variability in their light curves). Stars that met the Stetson Index criteria, but presented low amplitude stochastic variability in their light curves were not considered in the study.: eclipse-like variables (110 objects, 2.2 of the total candidate member sample), candidate periodic variables (1679, 33.0), and non-periodic variable stars (1288, 25.3). 1002 stars (20) met the Stetson variability index criteria, but were not considered as variables after light curve visual inspection. In the present study, since we target measurements of rotational periods, we will focus only on the first group. Stars from the candidate periodic sample with confirmed period (Section 3.1) are shown in black in the right panel of Figure 7.
3.1 Period Search
The main technique used for identifying and determining periods was the Lomb Scargle Normalized Periodogram (hereafter LSP Lomb, 1976; Scargle, 1982), a widely used modified version of the classical periodogram based on fast Fourier transforms, that can be applied to unevenly spaced datasets. The LSP algorithm used here was implemented according to Press et al. (1992) and Horne & Baliunas (1986), and it was normalized by the total variance of the data. This normalization guarantees that the power of a certain frequency’s peak in the periodogram, (), is related to the false alarm probability (FAP) for that frequency as
| (4) |
were is the number of independent frequencies used to compose the periodogram.
To apply the LSP algorithm to the sample, an oversampling factor of 260, and a scale factor of 5 for the Nyquist Frequency were used, a choice that sets the lower limit in the period search as 0.83 day and that will be discussed in more details in Section A.1. For evenly spaced data, the higher limit in the frequency search would be given by , were is the time between consecutive data points. For unevenly spaced data, the Nyquist frequency, calculated with being the mean time between two consecutive measurements, gives only a rough estimation for the higher limit in the frequency search (Scholz & Eislöffel, 2004). Since we are dealing with unevenly spaced data, we extended our search over higher frequencies than the limit imposed by the Nyquist frequency (which is around 2 days for our dataset), and potential contamination due this choice will be discussed on Section 3.2. Our dataset is composed of two observational seasons of 45 days and 75 days, respectively. For the lower limit in the frequency search, we adopted the resolution of the smaller season, i.e. . Hence, periods were searched in the interval 0.83-45 days.
The search for periods via LSP consists in studying the highest peaks inside the periodogram, and determining their significance. Judging a certain frequency’s power peak significance can be a tricky task and it is until nowadays one of the main limitations in studies regarding periodic stars. First, there is the 1 day aliasing phenomenon that can be written as:
| (5) |
with integer, and it is caused by the limitations in observation imposed by the Earth’s rotation (cf., Tanner, 1948). Second, we are here dealing with young stars and they typically show irregular variability that may be mixed with the periodic signal. The combination of irregular variability with discrete and uneven sampling may cause the occurrence of spurious periodogram power peaks, that despite being high peaks, are not truly associated to a periodic signal.
Horne & Baliunas (1986) reduced the problem of estimating the FAP (FAPh when referring to their concept of FAP) to the problem of finding the number of independent frequencies adequate to be applied in Equation 4. They used Monte Carlo simulations to generate a large number of data sets with pseudo-Gaussian noise, and different time-samplings. From the simulated data, they estimated for a set of unevenly and non clumped data, as =, where is the number of valid data points. Despite being largely used in the literature, this method for estimating FAPh may not be adequate. As pointed out by Littlefair et al. (2010), FAPh calculations via Monte Carlo simulations with gaussian noise are not reliable, since they can only account for variability due to photometric errors, while often there is also some intrinsic variability characteristic of young stellar objects. Littlefair et al. (2010) propose, as an alternative, to use the light curves themselves as a mean of estimating the height of spurious peaks due their intrinsic variability. When using the light curves themselves, we are accounting for spurious peaks introduced into the periodogram by all factors affecting the dataset, from imperfect photometry to intrinsic variability (Littlefair et al., 2010).
False Alarm Probability from a Control Sample:
When studying the sample of member candidates of CygOB2, we expect to be dealing with a sample of young stars, and possibly with a high fraction of periodic stars. On the contrary, when studying the sample of all objects in CygOB2 FOV, we expect a sample rich in field stars, and a lower fraction of periodic stars. This gives us an alternative method for estimating the FAP, that consists in studying known constant stars in our field of view and estimating the recurrence and typical height of spurious periodogram peaks for them.
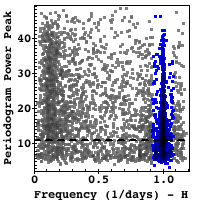
We estimated the FAP by using data from the control sample. LSPs were calculated for all the objects in the sample, and the power of the highest periodogram peak for each object was recorded. A sample of objects with frequency of the highest peak in the range 222We chose this interval based on the frequency vs. periodogram power peak plots in Figure 8: this frequency interval is outside the bulk produced by the 1 day alias, and also outside the bulk of longer periods (lower frequencies)., and Stetson Variability Index smaller than was selected, building this way a constant star sample, composed by 3999, 3077 and 3064 objects in J, H and K filters respectively. The false alarm probability, FAPc, was estimated from the cumulative distribution of the highest periodogram power peak in each filter as the power peak bin that contains the desired percentage of constant stars data. This way, the 0.01 FAPc level for J, H, and K filters were found at the power value 11.11, 10.52 and 10.47 respectively.
In spite of being a more accurate FAP estimator than analytical estimates or Monte Carlos simulations as derived by Horne & Baliunas (1986), FAPc gives only a reference value. Using it alone as a cut for selecting periodic stars may minimize spurious detections, but will not be enough for rejecting all of them. As discussed by Littlefair et al. (2010), very irregular variables and stars with poor rotational phase coverage are two common sources of contaminants in such analysis. Looking for a sample with the least contamination possible, we relied on the comparison of the periodograms in each of the three observed bands, and in two complementary statistical analysis, independent on the LSP.
Automatized Period Search:
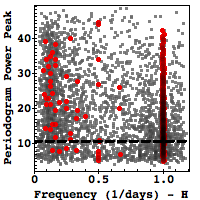
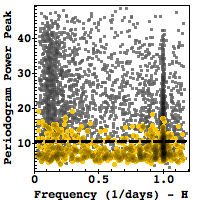
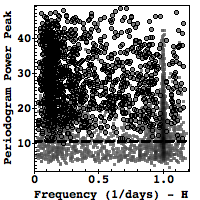
The first test for periodicity was to evaluate the existence of significant peaks in each of the J, H, and K periodograms. In some cases, the same frequency was responsible for the highest peak in all the three periodograms, and thus that frequency was recorded as a possible valid periodic signal. Due to some missing points, to differences in photometric errors and in amplitudes, the same periodic signal sometimes produced different values of power peak for each band. In particular, some missing points may favour the detection of an alias instead of the true period. Therefore, when the highest peak frequency was not the same for each of the three periodograms, we chose the one with the highest power. We then checked in the other two bands periodograms if the same frequency was responsible for one of the three highest peaks. If it was the case, that frequency and its power peak in each filter was recorded. If the same frequency was not found within the three highest peak in each filter’s periodogram, or if its power was smaller than the FAPc of 0.01, the light curve was rejected as periodic. Periodogram Power Peak versus frequency from the selected peaks are shown in Figure 8 for the H-band. All candidate members with valid periodograms are shown as gray dots.
Next, we used the String/Rope length method (Clarke, 2002; Lafler & Kinman, 1965), which is a non-parametric period search method based on Lafler-Kinman statistics (Lafler & Kinman, 1965). For each trial period, the original data is folded in phase and re-ordered for ascending phases, and the String-Length statistics (hereafter SL-statistics) was calculated as the summation of the squares of the differences between the consecutive phases re-ordered measurement values, normalized by the data’s variance. Given the normalization proposed by Clarke (2002), values of SL-statistics will fluctuate around the unity, with periodic stars presenting minimum values. The SL-statistics can be extended to the case of multi-band data, that Clarke (2002) calls the Rope-Length statistics (RL-statistics). In the multi-band case, the SL-statistics of each band is summed and divided by the total number of bands. SL and RL-statistics values can be calculated for a set of trial periods, and used to compose a periodogram. In the present study we do not used SL/RL-statistics for searching for periods, as the two indexes were only evaluated for the periods selected via LSP, and used for checking each period reliability. We chose the limit value for RL-statistics using Monte Carlo simulations with 78000 synthetic periodic light curves built as described in Section 3.2. For each synthetic light curve, RL-statistics was calculated for the true period, and for the two aliases formed around 1 day. From the comparison between the RL-statistics versus amplitude distributions for true period and aliases, we adopted an RL-statistics of 0.8 as a limit between true periods and probable aliases.
The Saunders statistics (S-statistics, Saunders et al., 2006) is a technique that may be used for investigating the aliasing effect of samplings. It is a normalized phase coverage metric and it is defined as the sum of the squares of the distances between two consecutive points in the folded in phase light curve, ordered for ascending phases, normalised by the value of the sum for an ideal spacing of equally spaced observations across the phase space. An uniform phase coverage gives a S-statistics of order unity. Growing irregular phase coverage makes S-statistics increase. The S-statistics is especially good for removing the spurious periods arising from the 1 day-1 natural frequency introduced by the Earth’s rotation (e.g. Littlefair et al., 2010). Monte Carlo simulations were also done in order to obtain a limit value for S-statistics. For each synthetic light curve in the simulated sample, LSP analysis was applied, and the highest peak in the periodogram was recorded. Light curves for which the difference between the LSP period and the input period was smaller than 10 the input period were selected, resulting in a subsample of 64102 synthetic light curves for which S-statistics was calculated. A cumulative distribution was built for this subsample and from the bin from which 99 of the data is contained, we defined the limit value of S-statistics equal to 5 for selecting stars with true period.
The effect of the chosen RL-statistics and S-statistics limit selection are shown in the frequency versus highest periodogram power peak distribution in Figure 8. Even though the filter for S-statistics significantly reduces the 1 day excess in the power peak versus frequency distribution (cf. Figure 8), it is not enough to completely account for such aliasing effect. This conclusion was achieved after visually inspecting some light curves and folded light curves, for stars with detected period very close to 1 day that were not filtered out by S-statistics limits: in their majority, those stars were long term non periodic variables, and not truly periodic stars. To deal with the remaining contamination, a filter for frequencies in the range 0.92-1.08day-1 was added. The choice of this range around 1 day was done based on simulations discussed on Appendix A.1.
The final selection was composed by 1291 stars: 25 eclipse-like, 1256 form candidate periodic variables list, 2 non-periodic variables (stars selected as periodic stars, but with no visible periodic signal in the light curve), and 8 non-variable stars (stars not considered as variable according to the visual selection). Each period was measured as the mean value of the inverse of the frequencies obtained via LSP, for each filter. From that, it follows that the rms error for each band period is . Simulations as described in Section 3.2 were used for estimating the resolution for each filter. For each synthetic periodic light curve, LSP was calculated, and the highest periodogram power peak frequency’s full width at half maximum, FWHM, was estimated. We estimated from the FWHM versus period distributions for each filter, and by propagating the error it follows that the error in the periods are around , which gives a 4.8 hours error for a 10 day period.
3.2 Period Detection Completeness and Reliability
Monte Carlo simulations were ran on synthetic light-curves in order to estimate the efficiency and limitations of the techniques employed in the period search method. We used a modified version of this type of simulation commonly presented in the literature (e.g., Littlefair et al., 2010; Moraux et al., 2013), since we used candidate members for building synthetic light curves, instead of non-members in the field. To build synthetic light curves, “constant” stars were selected from the candidate members catalog as follows: First, stars with Stetson variability index smaller than 0.15, and more than 60 valid observations in each filter were selected. From those, we selected stars classified as non-variable stars during the visual light curve inspection (stars with very small and uncorrelated variability). Finally, for each filter, we analysed the peak to peak (ptp) amplitude versus magnitude distribution: using a bin of size one for magnitudes between 10 and 18, we randomly selected stars in the minimum outlier of the distribution. Whenever possible, two stars were selected per magnitude bin. A total of 39 stars were selected this way, and as they were considered the most constant stars in the candidate member sample, their light curves reflect the fingerprints of the dataset, including the window of observations and the kind of photometric and instrumental error contained on the light curves. Each light curve in this constant stars sample was then used as a template for building synthetic light curves. For each light-curve, the time sampling, magnitude and error values were kept, and a periodic signal with random waveform, period (Pin), amplitude, and phase was added to it. We generated 2000 synthetic light curves per constant star, totalizing 78000 synthetic light curves. Uniform distributions were used to generate the random periods, amplitudes and phases.
From the visual inspection phase in the light curve analysis, it was noticed that even though periodic behaviour was quite often observed, they were usually not perfect sinusoidal signals. This may have direct consequences in the period analysis performed, as certain waveforms may favour the detection of aliases or harmonics in the LSP, instead of the true frequency. In fact, when inserting periodic eclipse-like waveforms in our synthetic light curves, we notice a favouring for the detection of harmonics, instead of the true period. As we already distinguished between eclipse-like and candidate periodic light curves, eclipse-like waveforms will not be included in the completeness analysis. For the simulations purposes, we used single period sine-wave, sawtooth wave, triangle wave, and cycloidal wave as waveforms. The waveform was randomly chosen at the beginning of the creation of each synthetic light curve.


Two series of simulations were performed. The first one considers periods as large as the maximum period searched (45 days, c.f., Section 3.1), and as short as 0.2 days, which is about the minimum rotational periods verified in other young regions (e.g., Irwin et al., 2008; Littlefair et al., 2010; Moraux et al., 2013). It also considers a large range of amplitudes from 0.015-1.5 magnitudes. The second one considers amplitudes in the range 0.015-0.2 mag, and periods in the range 0.2-20.0 days, which considers a more realistic amplitude and period upper limit given that Figures 9 and 13 shows that most of the stars have amplitude smaller than 0.2 magnitudes, and period smaller than 20 days. Random ptp amplitudes were generated for the J filter, and H and K magnitudes were set according to the ratio between the median value for each band periodic star ptp amplitude distribution (gray dashed lines, in Figure 9): , and .
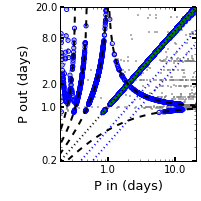
We applied the same analysis and filtering to the synthetic light curves as was done for the candidate member catalog. Both input and output periods were recorded. From the results, two samples were defined: synthetic light curves flagged as periodic were considered as in the “selected”-sample; synthetic light curves were considered as in the “recovered”-sample if the input and output periods were the same, i.e., if the deviation between them was smaller than 10 the input period (). The results for J band in the two samples are shown in the distribution in Figures 10 and 11.
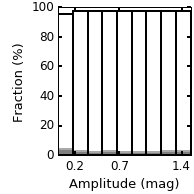
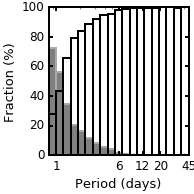
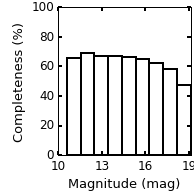
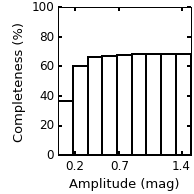
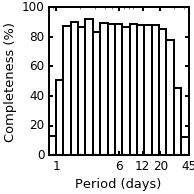
For the completeness analysis, a period in a synthetic light curve was considered successfully recovered if it was present in both selected and recovered samples. The completeness, i.e., successfully recovered periods divided by the number of input periods, for the first series of simulations is presented in Figure 10 (middle, top and bottom plots), where one can see that the completeness decreases slightly for increasing magnitude (plot at the bottom left), going from 69 for magnitudes around 12, to 47 for magnitudes larger than 18. The completeness of the sample is quite uniform, and around 67 for amplitudes between 0.18 and 1.5 mag, having a significant drop between 0.015 and 0.18 magnitudes, reaching only 37. It is also quite uniform, and around 87, for periods between 1.2 and 24 days (bottom plot); but it drops to 12 for periods smaller than 1 day, and to 12 for periods larger than 36 days, which can be explained by strong aliasing factors in the very large, and very small period extremes.
Figure 10 also shows the contamination analysis for the selected-sample. In the top middle and right panels, 100 means the complete selected-sample, empty bars show the percentage of light-curves in this sample with successfully recovered periods per period or amplitude bins, and filled bars show the percentage of light-curves in the selected-sample, but that do not have and, therefore, are contaminants to the sample. We advise the reader to keep in mind what are the samples used to build each histogram in Figure 10 and 11: while the completeness analysis takes into account the total number of periods available to be measured (i.e., every gray dot inside the ); the contamination analysis accounts only for periods which were measured by the process described in the previous section (i.e. blue and gray points inside the ). From the amplitude vs. contamination fraction histogram one can see that the contamination level is quite small for given amplitude, going from a maximum of about 16 for the smallest amplitude bin, and reaching only 5 for the highest amplitude bin. The period vs. contamination fraction histogram shows that the contamination level is insignificant (1) for periods longer than 6 days, and that it increases significantly up to 70 for measured periods shorter than 1 day.
Even though the simulations presented in Figure 10 comprise the whole amplitude,and period ranges measured for our periodic sample, they assume uniform distributions for the ranges considered, which is unrealistic if we consider the real distributions of periods and amplitudes. Only 1 of the periodic sample had measured periods longer than 20 days, and Figure 9 shows that the measured amplitudes are mostly low amplitudes up to 0.2 magnitudes, which corresponds to the first bin of amplitude in Figure 10. Therefore, we ran a second series of simulations, in order to consider in more details a sample dominated by periods shorter than 20 days, and low amplitudes.
The second series of simulations are presented in Figure 11. The completeness vs. amplitude panel shows that the sample’s completeness increases from merely 4 for amplitudes smaller than 0.035 (which is very close to the data’s 2 error level), to 78 for amplitudes larger than 0.18 mag in J filter. The completeness for given period is quite homogeneous, and about 57 for periods larger than 2 days, and as small as about 12 for periods smaller than 2 days. The completeness for given J magnitude bin is quite flat, and about 67 until magnitude 15, but it decreases toward larger magnitudes up to 14 for magnitudes larger than 18. The completeness increase with amplitude, and decrease with magnitude can be explained by the error distributions in Figure 5, since higher amplitudes result in higher signal to noise ratio, while stars with larger magnitudes have larger errors, and therefore smaller signal to noise ratio.
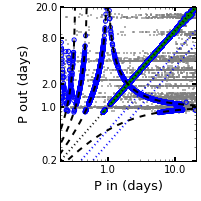
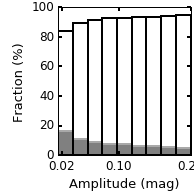
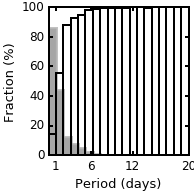
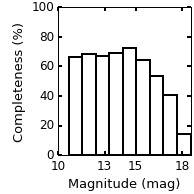
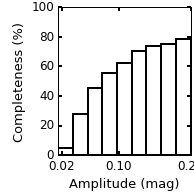
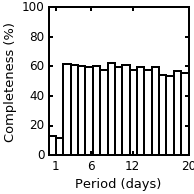
There is a small contamination level as a function of amplitude, which decreases from 16 to 5 with increasing amplitude. From the upper left plot in Figure 11, one can see in the region that there exists some contamination arising from short values aliased towards larger periods. The effect of this contamination can also be seen in the region filled in gray inside the contamination fraction as a function of period plot (upper right): The contamination is very high for period bins up to 2 days, reaching 44 for periods between 1.0 and 2.0 days, and 86 for periods smaller than 1 day. But it decrease to very small values for periods between 2 and 7 days, and it is almost insignificant for periods larger than that. Additional sources of contamination will be discussed in Appendix A.
3.3 Comparison With Periods in the Literature and Binary Stars Contamination
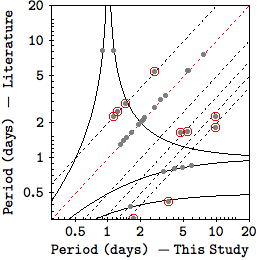
Henderson et al. (2011) observed CygOB2 in two seasons of 19 and 18 nights, with a few observations per night. They presented 121 stars variable in R and I band, 95 of which had measured periods. Within a distance of we found 79 of their variable stars also present in our catalogue: 7 of them were classified by the present study as non-variable stars; 9 were eclipse-like variables; 17 were classified as non-periodic variable stars; and 46 were periodic candidates. Figure 12 shows a comparison between the periods measures by Henderson et al. (2011), and the ones measured in the present study. Both studies measured periods of 32 stars in common, and the same period for 14 of them. Since we are only interested in periodic behaviour that may be reflecting the star’s rotation, all the variables presented by Henderson et al. (2011) as eclipsing binary candidates (10 stars) were excluded from our periodic stars list. Taking out the eclipsing binary candidates from the plot in Figure 12, all remaining stars without equal periods measured in both studies fall on the aliasing paths, and the 8 objects in this situation were also ruled out from our periodic list.
3.4 Visual Light Curve Crosscheck
Finally, we visually crosschecked the folded light curves for periodic stars selected in Section 3.1, and verified if a periodic signal was indeed present on them. We considered as contaminants the stars that were selected as periodic but that did not show a visible periodic signal in the folded light curve. We found 23 (1.8 of the periodic sample ) contaminant stars this way. We also visually checked the light curves for the stars selected as periodic, but classified during de visual inspection as non-variable, and verified that 4 (0.3) of them did not show a periodic signal in the folded light curve, being considered as extra contaminations to the periodic sample.
4 Results
4.1 General Period Distributions
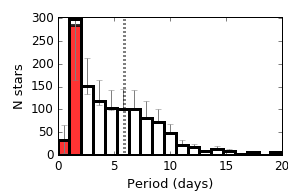
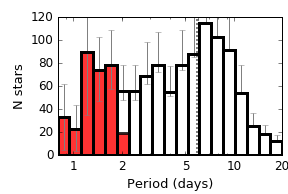
After excluding eclipse-like variables, and possible visually-selected contaminants (see Appendix 3.4), we compiled a final list of 1211 candidate members of CygOB2 with periodic variability and periods between 0.86 and 32.49 days. The period distribution for the 1196 stars with days is shown in Figure 13. Since only 15 stars ( of periodic sample) have periods longer than 20 days, we kept those stars outside the distributions shown in the rest of the paper. Error bars were estimated taking into account the completeness and contamination analysis for periods up to 20 days (Figure 11): upper error bars take into account the sample’s incompleteness for each magnitude bin (Figure 11), and lower error bars take into account the contamination level per magnitude. Even though they were not used in the present results analysis, periods shorter than 2 days are shown in red in the distribution in Figure 13, and also in the following Figures in this Section. While not accounting for the shortest periods, the mean, standard deviation and median values for the general period distribution are ()= 6.67, 4.18, and 5.92 days.
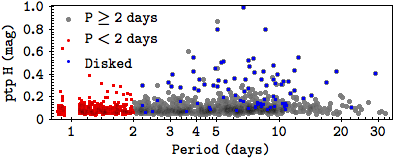
The photometric ptp amplitudes for the H-band are shown as a function of periods in the top panel of Figure 14. The amplitude of 90 of the periodic stars is widely distributed between 0.03 and 0.18 magnitudes; of them exhibit amplitudes between 0.18 and 0.51 magnitudes, and exhibit amplitudes as high as 1 magnitude.
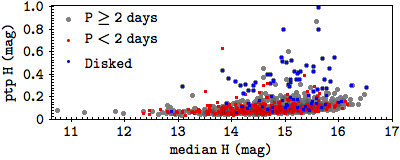
The bottom panel in Figure 14 shows the photometric ptp amplitudes for the H-band as a function of magnitude. The increase of the lower amplitude envelope with magnitude is due to an observational bias related to the dependence of the minimum photometric errors on the magnitude (cf. Figure 5), which makes it increasingly difficult to detect low amplitude variables among fainter stars. On the other hand, the upper envelope of the distribution also shows an increase with amplitude, which can be explained by a larger and/or more uneven spot coverage for fainter (less massive) stars. There are 61 periodic stars outliers in the median H magnitude vs. amplitude distribution, showing higher amplitude than most of the stars with the same brightness. While 46 of the disked stars follow the main distribution, 74 of all the outliers are disked stars. This is consistent with the idea that most of periodicity observed in the light curves for disk-bearing stars arises mainly form two physical mechanisms: the rotational modulation by hot spots, which are expected to show higher variability amplitudes than cold spots (e.g. Carpenter et al., 2001; Scholz et al., 2009), and by circumstellar obscuration, which may be the responsible for the higher amplitudes observed (e.g., AA Tauri stars; Bouvier et al., 2003).
| Id | GDW13 | GDW15 | RA | Dec | Stet | Per | Mass | Av | mJ | eJ | ptpJ | mH | eH | ptpH | mK | eK | ptpK | Classa𝑎aa𝑎aDisk IR evolutionary status from GDW13 attributed by using Wilking et al. (2001) scheme. CL1: Class 1 YSO. CL2: Class 2 YSO. FS: Flat Spectrum. PTD: pre transitional disks. Ha: H emitter according to GDW13 or to Vink et al. (2008). BWE: blue stars with excesses candidate stars with disks, but with optical color bluer than the cluster locus). lowmass : low-mass disk with excesses only in [8.0] and [24]. high-incl: highly inclined disk with excesses only in [8.0] and [24] | Diskb𝑏bb𝑏bDisk presence: 1 if true. |
|---|---|---|---|---|---|---|---|---|---|---|---|---|---|---|---|---|---|---|---|
| (h:m:s) | (d:m:s) | (day) | () | (mag) | (mag) | (mag) | (mag) | (mag) | (mag) | (mag) | (mag) | (mag) | (mag) | ||||||
| CygOB2-0000004 | 1047 | 20:32:04 | +41:14:19 | 0.46 | 8.35 | 0.49 | 4.29 | 16.61 | 0.08 | 0.03 | 15.35 | 0.02 | 0.06 | 14.78 | 0.02 | 0.06 | |||
| CygOB2-0000007 | 1065 | 20:32:05 | +41:17:27 | 0.52 | 2.82 | 0.86 | 5.13 | 15.31 | 0.06 | 0.02 | 14.23 | 0.02 | 0.05 | 13.74 | 0.02 | 0.06 | |||
| CygOB2-0000008 | 1064 | 20:32:05 | +41:12:48 | 0.79 | 3.05 | 0.79 | 2.74 | 15.66 | 0.08 | 0.02 | 14.8 | 0.02 | 0.08 | 14.46 | 0.02 | 0.07 | |||
| CygOB2-0000010 | 1070 | 20:32:05 | +41:15:49 | 0.45 | 2.62 | 0.63 | 5.09 | 15.55 | 0.06 | 0.02 | 14.34 | 0.02 | 0.05 | 13.79 | 0.02 | 0.05 | |||
| CygOB2-0000015 | 1086 | 20:32:06 | +41:06:49 | 0.92 | 10.55 | 0.66 | 5.91 | 17.06 | 0.15 | 0.04 | 15.72 | 0.03 | 0.13 | 15.04 | 0.03 | 0.12 | |||
| CygOB2-0000022 | 1113 | 20:32:07 | +41:16:01 | 1.11 | 2.18 | 0.6 | 5.17 | 15.02 | 0.1 | 0.02 | 13.83 | 0.02 | 0.08 | 13.29 | 0.02 | 0.08 | |||
| CygOB2-0000035 | 1159 | 20:32:10 | +41:07:45 | 0.61 | 7.55 | 0.31 | 4.26 | 16.59 | 0.09 | 0.03 | 15.28 | 0.02 | 0.08 | 14.62 | 0.02 | 0.08 | |||
| CygOB2-0000037 | 5482 | 20:32:11 | +41:18:24 | 1.24 | 7.94 | 0.4 | 4.26 | 17.02 | 0.17 | 0.04 | 15.77 | 0.03 | 0.14 | 15.18 | 0.03 | 0.13 | |||
| CygOB2-0000040 | 5483 | 20:32:11 | +41:07:52 | 0.83 | 7.81 | 0.36 | 4.05 | 17.47 | 0.15 | 0.05 | 16.18 | 0.03 | 0.13 | 15.56 | 0.03 | 0.12 | |||
| CygOB2-0000041 | 1175 | 70438 | 20:32:11 | +41:11:33 | 2.05 | 7.1 | 0.31 | 4.88 | 17.03 | 0.31 | 0.04 | 15.71 | 0.03 | 0.28 | 14.88 | 0.02 | 0.22 | CL2 | 1 |
| CygOB2-0000044 | 1187 | 20:32:12 | +41:18:24 | 0.90 | 4.9 | 0.69 | 4.39 | 15.99 | 0.1 | 0.03 | 14.84 | 0.02 | 0.08 | 14.32 | 0.02 | 0.08 | |||
| CygOB2-0000049 | 1208 | 20:32:12 | +41:16:47 | 0.75 | 7.44 | 0.53 | 4.24 | 17.15 | 0.13 | 0.04 | 15.93 | 0.03 | 0.12 | 15.37 | 0.03 | 0.12 | |||
| CygOB2-0000052 | 1217 | 20:32:13 | +41:11:45 | 0.53 | 19.52 | 0.52 | 4.84 | 15.75 | 0.06 | 0.02 | 14.46 | 0.02 | 0.06 | 13.87 | 0.02 | 0.05 | |||
| CygOB2-0000060 | 1229 | 20:32:14 | +41:16:47 | 0.32 | 5.17 | 0.66 | 3.88 | 15.59 | 0.06 | 0.02 | 14.5 | 0.02 | 0.04 | 14.02 | 0.02 | 0.04 | |||
| CygOB2-0000066 | 1283 | 20:32:16 | +41:15:37 | 1.27 | 5.13 | 0.7 | 4.13 | 15.99 | 0.12 | 0.03 | 14.85 | 0.02 | 0.11 | 14.35 | 0.02 | 0.09 | |||
| CygOB2-0000067 | 1287 | 20:32:16 | +41:18:28 | 1.31 | 9.55 | 0.63 | 3.67 | 16.38 | 0.13 | 0.03 | 15.22 | 0.02 | 0.12 | 14.71 | 0.02 | 0.1 | |||
| CygOB2-0000070 | 5267 | 20:32:16 | +41:07:29 | 2.11 | 5.81 | 0.31 | 4.52 | 17.1 | 0.25 | 0.04 | 15.78 | 0.03 | 0.24 | 15.06 | 0.03 | 0.24 | |||
| CygOB2-0000072 | 1299 | 20:32:16 | +41:14:39 | 1.78 | 7.62 | 0.55 | 5.0 | 16.07 | 0.18 | 0.03 | 14.75 | 0.02 | 0.17 | 14.06 | 0.02 | 0.16 | |||
| CygOB2-0000074 | 1310 | 20:32:17 | +41:18:49 | 0.81 | 6.57 | 0.41 | 3.12 | 17.17 | 0.13 | 0.04 | 16.01 | 0.03 | 0.12 | 15.49 | 0.03 | 0.11 | |||
| CygOB2-0000078 | 5485 | 20:32:17 | +41:15:03 | 0.55 | 7.16 | 0.26 | 3.99 | 16.92 | 0.12 | 0.04 | 15.7 | 0.03 | 0.09 | 15.07 | 0.03 | 0.08 | |||
| CygOB2-0000079 | 1328 | 20:32:17 | +41:17:58 | 2.09 | 2.31 | 0.58 | 4.1 | 15.32 | 0.17 | 0.02 | 14.16 | 0.02 | 0.16 | 13.63 | 0.02 | 0.15 | |||
| CygOB2-0000083 | 1341 | 20:32:18 | +41:14:04 | 0.89 | 5.85 | 0.42 | 4.35 | 16.51 | 0.11 | 0.03 | 15.24 | 0.02 | 0.09 | 14.64 | 0.02 | 0.08 | |||
| CygOB2-0000086 | 5269 | 20:32:19 | +41:05:55 | 1.09 | 6.13 | 0.29 | 4.2 | 17.23 | 0.16 | 0.04 | 15.89 | 0.03 | 0.14 | 15.23 | 0.03 | 0.13 | |||
| CygOB2-0000089 | 1368 | 20:32:20 | +41:12:00 | 0.38 | 4.2 | 0.64 | 3.74 | 15.43 | 0.06 | 0.02 | 14.4 | 0.02 | 0.04 | 13.91 | 0.02 | 0.04 | |||
| CygOB2-0000090 | 5487 | 20:32:20 | +41:13:33 | 1.00 | 3.79 | 17.43 | 0.17 | 0.05 | 16.1 | 0.03 | 0.17 | 15.44 | 0.03 | 0.14 | |||||
| CygOB2-0000092 | 5488 | 20:32:20 | +41:13:31 | 0.79 | 4.45 | 0.17 | 3.66 | 17.35 | 0.17 | 0.05 | 16.0 | 0.03 | 0.13 | 15.34 | 0.03 | 0.11 | |||
| CygOB2-0000093 | 1384 | 20:32:20 | +41:16:54 | 0.51 | 8.88 | 0.31 | 3.52 | 16.53 | 0.07 | 0.03 | 15.27 | 0.02 | 0.07 | 14.69 | 0.02 | 0.06 | |||
| CygOB2-0000102 | 1427 | 20:32:22 | +41:14:47 | 0.70 | 9.02 | 0.52 | 4.09 | 15.76 | 0.08 | 0.02 | 14.48 | 0.02 | 0.06 | 13.92 | 0.02 | 0.06 | |||
| CygOB2-0000121 | 1498 | 20:32:25 | +41:17:45 | 1.01 | 4.23 | 0.58 | 2.99 | 15.46 | 0.1 | 0.02 | 14.37 | 0.02 | 0.08 | 13.88 | 0.02 | 0.07 | |||
| CygOB2-0000126 | 1516 | 20:32:26 | +41:16:44 | 0.45 | 6.16 | 0.61 | 3.31 | 15.61 | 0.05 | 0.02 | 14.5 | 0.02 | 0.04 | 14.0 | 0.02 | 0.05 | |||
| CygOB2-0000131 | 1520 | 20:32:27 | +41:07:17 | 1.18 | 4.63 | 0.47 | 5.5 | 15.74 | 0.11 | 0.02 | 14.28 | 0.02 | 0.09 | 13.53 | 0.02 | 0.07 | |||
| CygOB2-0000134 | 1532 | 20:32:27 | +41:12:01 | 1.05 | 5.32 | 0.75 | 6.21 | 16.0 | 0.12 | 0.03 | 14.73 | 0.02 | 0.1 | 14.1 | 0.02 | 0.08 | |||
| CygOB2-0000142 | 1555 | 20:32:28 | +41:14:39 | 0.56 | 4.09 | 0.68 | 7.16 | 16.45 | 0.09 | 0.03 | 14.85 | 0.02 | 0.07 | 13.98 | 0.02 | 0.06 | |||
| CygOB2-0000143 | 5280 | 20:32:28 | +41:09:00 | 0.80 | 4.96 | 0.46 | 6.12 | 16.85 | 0.14 | 0.04 | 15.39 | 0.02 | 0.11 | 14.65 | 0.02 | 0.09 | |||
| CygOB2-0000156 | 1589 | 20:32:30 | +41:16:51 | 0.48 | 2.17 | 0.57 | 4.91 | 15.4 | 0.05 | 0.02 | 14.23 | 0.02 | 0.05 | 13.67 | 0.02 | 0.05 | |||
| CygOB2-0000163 | 1613 | 20:32:30 | +41:17:45 | 1.13 | 8.05 | 0.8 | 4.12 | 15.82 | 0.12 | 0.02 | 14.74 | 0.02 | 0.1 | 14.26 | 0.02 | 0.08 | |||
| CygOB2-0000165 | 1615 | 20:32:31 | +41:12:19 | 0.94 | 8.27 | 0.63 | 5.93 | 16.76 | 0.13 | 0.03 | 15.4 | 0.02 | 0.11 | 14.76 | 0.02 | 0.09 | |||
| CygOB2-0000176 | 1663 | 20:32:33 | +41:09:59 | 1.00 | 8.34 | 0.44 | 5.1 | 16.69 | 0.14 | 0.03 | 15.33 | 0.02 | 0.11 | 14.66 | 0.02 | 0.09 | |||
| CygOB2-0000178 | 1679 | 20:32:33 | +41:11:33 | 0.92 | 6.69 | 0.69 | 6.84 | 16.85 | 0.14 | 0.04 | 15.4 | 0.02 | 0.11 | 14.7 | 0.02 | 0.09 | |||
| CygOB2-0000183 | 1694 | 20:32:34 | +41:17:19 | 1.00 | 4.64 | 0.39 | 3.76 | 16.35 | 0.12 | 0.03 | 15.17 | 0.02 | 0.11 | 14.6 | 0.02 | 0.09 |
The 894 periodic stars with days are listed in Table 1 which shows their ID inside our variability survey catalogue, their ID in the catalogues presented by GDW13, and GDW15, their coordinates in the present study; Stetson variability Index (Section 3), Period (Section 3.1); Mass, and Av (Section 4.3.1), median J,H, and K magnitudes, their propagated errors, and their ptp amplitude for each band (Section 3); their IR-class according to GDW13 (Section 2 , and 4.2), and a flag indicating the presence of disk, assuming the value 1 for disked stars, and 0 for non disked stars.
4.2 Period Distribution for Disk-Bearing vs. Non-Disked Stars
To further investigate the nature of the period distribution presented in Figure 13, we compared the period distributions of disk-bearing and non-disked stars. Since we do not have reliable mass accretion rate measurements for Cygnus OB2 low mass stars333GDW13 used IPHAS data in order to select H emitters inside the r’-H vs. r’-i’ colour-colour diagram. They identified 52 sources in such diagram, but only one of them was selected as a periodic star., we rely on X-ray emission and IR disk diagnosis in order to distinguish between CTTs and WTTs samples, and investigate the star/disk connection effect in the period distributions. The disked stars in the sample are the disk-bearing stars listed by GDW13. The Non-Disked stars in the sample are the X-ray emitter sources from Wright et al. (2014) classified as members by Kashyap (2017) without IR-excess.
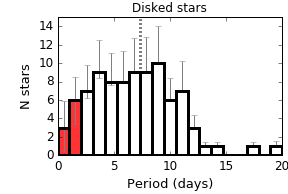
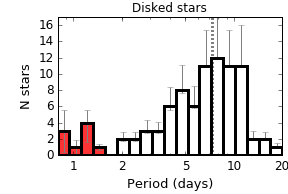
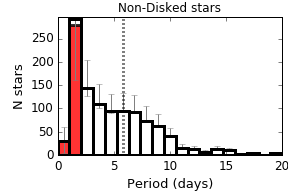
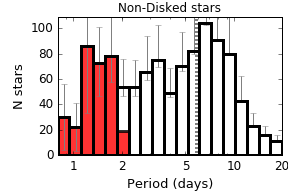
There were 91 disk-bearing periodic stars, 82 of them with days, and 1120 non-disked periodic stars, 812 of them with 444Note that these numbers are slightly different from the numbers presented in Figure 15. This is because the plot in the refereed Figure presents only stars with days, and there are 3 disked and 13 non-disked stars with periods larger than that.. The period distributions for disk-bearing and non-disked stars are shown in Figure 15. The period distributions for disk-bearing and non-disked stars are shown in Figure 15. A visual inspection of the distributions suggests that the two samples exhibit different rotational properties, even without taking into account the bins with days. The disk-bearing stars distribution is quite flat for periods in the range 4-11 days, decreasing for periods smaller than 4 days. The non-disked stars distribution is flat for periods between 4 and 7 days, but it decreases for periods larger than that, with a larger fraction of stars with periods smaller than 4 days.
The mean, standard deviation and median values are ()= 7.87, 4.36, and 7.34 days for disk-bearing stars, and ()= 6.55, 4.14, and 5.80 days for non-disked stars. A visual inspection in the distributions of Figure 15, and a quick look to the statistical values suggest that although both distributions show a large dispersion, disked stars are on average rotating slower than non-disked stars. A Kolmogorov-Smirnov (KS) test555 ks2samp from Python package scipy.stats considering only periods higher than 2 days statistically supports this idea, with a probability of only 0.4 that the two distributions came from the same parent distribution.
4.3 Period Distributions for Given Masses
4.3.1 Mass Estimation
In order to estimate masses for the candidate members it would be necessary the knowledge of individual extinctions, which in turn would require the knowledge of spectral types for the stars. Since there is no available information about the spectral type for the low mass members coming from spectroscopic studies in the literature, individual extinction for candidate members could not be formally determined. An alternative for that is to look for optical counterparts in other surveys, and use optical colours to estimate the reddening of each object. Since colours are not affected by the distance, a distance independent individual can be estimated for each star by using colour-colour diagrams (CCD). This can be done by using a chosen extinction law in order to estimate the displacement of a star in the CCD from an appropriate isochrone with zero extinction, plotted in the same diagram.
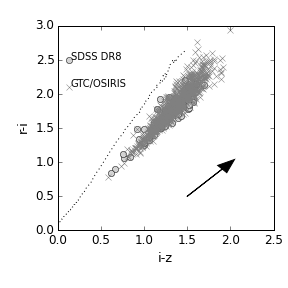
As described in Section 2.2, riz photometry is available from GDW12, who give riz indices for 1086 stars of our periodic sample, with error smaller than 0.2 magnitudes in each filter: 991 from GTC/OSIRIS observations, and 95 from SDSS DR8. Thus, we used the i-z vs. r-i colour-colour diagram in order to estimate individual extinctions. Instead of using a 3.5 Myr Siess et al. (2000) isochrone to estimate , as in GDW12, we used an empirical dwarf sequence from Covey et al. (2007). We adopted relative extinction for riz bands from Schlegel et al. (1998)666 Transformed from u’g’r’i’z’ (USNO 40 in) to ugriz (SDSS 2.5m) according to http://classic.sdss.org/dr7/algorithms/jeg_photometric_eq_dr1.html, where the authors used a =3.1 extinction law from Cardelli et al. (1989) to evaluate relative extinctions. Since both Covey et al. (2007) dwarf sequence, and the riz data used from GDW12 (cf. Section 5.1 of their paper) are in SDSS photometric system, no transformation was required, and this justifies the differences in our method for estimating individual extinctions, and the one used by GDW12. The CCD for riz colours is shown on the bottom plot of Figure 16.
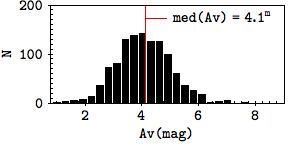
We were able to estimate for 1058 periodic stars, 971 using GTC/OSIRIS data, and 86 using SDSS DR8 data. The distribution of individual extinctions obtained is shown in the top of Figure 16. The median obtained for the periodic sample was 4.1m, which is in good accordance with the 4.33m value obtained by GDW12 for stars in CygOB2 center.
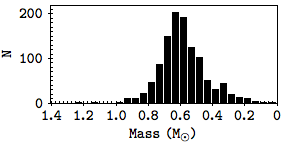
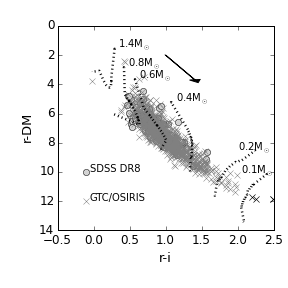
We then used our estimations of individual extinction values and the r-i vs. r CMD to estimate masses. We adopted a distance modulus DM=10.62 (d=1.33kpc Kiminki et al., 2015). For each periodic star with estimated , we de-redden it for the individual , and applied the distance modulus. Masses were then estimated given the position of the de-redden, and distance-corrected star inside the CMD in relation to a grid of PMS semi-empirical isochrones from Bell et al. (2014), with PISA models (Tognelli et al., 2011, 2012) for solar metallicity (=0.013), and ages in the range 0.1-30 Myr. The grid of semi-empirical isochrones was built by using the CMDfit software777CMDfit software, author: Tim Naylor: http://www.astro.ex.ac.uk/people/timn/tau-squared/software.html, and the bolometric corrections applied were calculated by the software’s authors by folding spectra with opacities from BT-Settl (Allard et al., 2011) through the desired filter response and applying empirical corrections from Bell et al. (2014). In our case, we chose the filter responses for SDSS filters (Doi et al., 2010) with an AB zero point. The isochrones used in the grid comprise masses in the range 0.1-8. We estimate masses for 1054 periodic stars. The bottom plot in Figure 17 shows a r-i vs. r CMD for de-redden periodic stars and mass tracks from 0.1 to 1.4. The middle plot in Figure 17 shows a histogram with the distribution of estimated masses for periodic stars. The CMD in Figure 17 also shows a lack of stars with masses larger than 0.9, which is mainly due to the fact that most of the stars with masses larger than that are very close to the saturation limit in our WFCAM/UKIRT observations.
A caveat on using optical colors for estimating masses is that stars with disks may be affected by accretion, scattering, or obscuration of the central star by the inner disk. Only 65 stars in our sample are periodic, have disks and had masses estimated as described in this section. We verified that only 3 of those stars had evolutionary status from GDW13 compatible with some ongoing phenomena that could affect their optical colours: 1 star has H emission, 1 star has colours compatible with scattering, and 1 star has a disk in high inclination. Since they correspond to a very small fraction of our sample, we consider that these effects do not influence our mass estimation.
4.3.2 Period Distributions in Different Mass Ranges
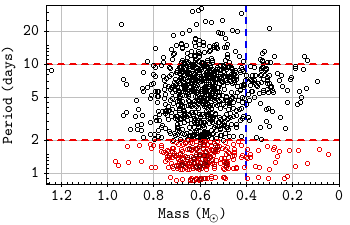
Mass estimations for PMS stars can be extremely model dependent, but for all models, lower effective temperatures correspond to lower mass stars, and thus the sense of variation of rotation with mass is model independent (Herbst et al., 2001). To test a possible mass-rotation connection in our data, we split the periodic sample into two mass bins: (90 stars with days), and (687 stars with days). Histograms showing the period distribution for each of the three mass bins are shown in Figure 19. From the distributions, it is evident that the period distribution for medium, and slower rotators present a mass dependence. The period mean, standard deviation and medium values are: ()= 7.0, 2.9, and 6.9 days for the sample, and ()= 6.5, 4.2, 5.7 days for the sample.
Figure 18 shows the mass vs. rotational period distribution for Cygnus OB2. The blue dashed line marks the limits between the mass bins adopted, and are meant to allow a simple comparison between Figures 18 and 19. Keeping in mind that our data sampling does not allow us to access the complete fast rotators population, a lack of periods in the range 2-5 days can be verified for the mass bin. Both linear and log scaled rotational period distributions are strongly peaked for the lower mass interval, but the peak, around 6.1 days, is more evident in log-scaled distribution. The overall distribution gets broader for the mass bin, which is reflected as an increase in the distribution’s . The peaked distribution verified for lower masses is less evident here, and an increase in the number of faster and intermediate rotators makes the period distribution flatter.
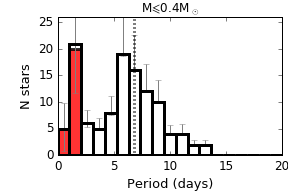
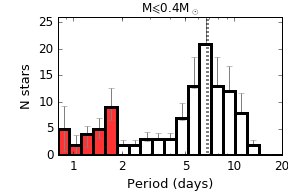
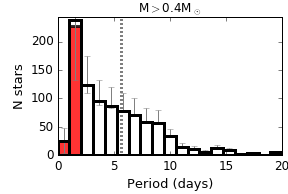
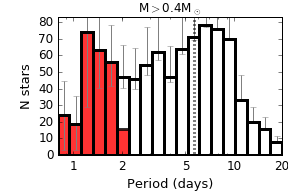
A KS-test gives a probability of that the distributions for and samples came from the same parent population. The results therefore indicate that for the periodic sample analysed here, the lower mass stars are rotating on average slower than higher mass stars.
Since masses derived from CMD are highly model dependent, we verified that our results hold for masses estimated from different models. We repeated the process for estimating masses described in Section 4.3.1 using 3 other models: Baraffe et al. (1998), and Baraffe et al. (2015) with Bell et al. (2014) empirical corrections, and Siess et al. (2000). The first two models result in masses very similar to the ones we adopted. For Siess et al. (2000) model, masses larger than 0.4, PISA models yield masses times larger. For masses bigger than 0.4 PISA and Siess et al. (2000) can be different up to a factor of 2.
We adopted the mass limit of 0.4 because of the following reason: The convective boundary, i.e., the mass under which all the stars will be fully convective even in the MS, is around 0.3 for the model used. On the other hand, all low mass PMS stars are initially fully convective. Gregory et al. (2012) estimated the age at which a PMS star first develops a radiative core for the Pisa models, and according to their estimates a 0.5 star develops its radiative core around 9.3 Myr, and a 0.4 star around 15 Myr. As we discuss in Section 5.2, CygOB low mass stars age estimates are between 2.5 - 6.75 Myr (Wright et al., 2010), but these estimates were based on Siess et al. (2000) models, which, when applied to PMS stars, may result in underestimated ages down to a 1.5-2.0 factor. Accounting for this, we split the sample at 0.4 as a way to guarantee that the lower mass sample will not be contaminated by stars that are no longer fully convective.
We also investigated the effect of other choices of mass limit and concluded that the results hold for different values. Using 0.5 gives results qualitatively similar to 0.4 (lower mass stars rotate slower) and a KS-test yield statistically different samples. When splitting the periodic stars in several mass ranges, the overall result is kept the same: Stars with 0.4 rotate slower than stars in the mass range 0.4 - 0.6 and a KS-test results in 0.05 chance they came from the same parent distribution. The 0.4 - 0.6 and 0.6 - 0.8 samples have very similar rotational properties and can not be distinguished according to a KS-test. When comparing 0.4 - 0.5 sample with 0.5 - 0.8 sample, the former is slower than the later, but according to the KS-test it is not possible to say if they are different, which supports our choice of 0.4 as mass limit for the comparison.
5 Discussion
Given the CygOB2 rich population and the fraction of candidate members with periodic variability, Cygnus OB2 is a valuable target for testing the theory of stellar angular momentum evolution during the PMS.
In this Section we discuss our results in the context of early rotational evolution for low mass stars. It is of utmost importance to keep in mind the limitations of our sample. Since the faster rotators (days) in the sample are strongly contaminated, our discussion is based on a few fast rotators, intermediate and slow rotators. As in Herbst et al. (2002), we based our definition of rotational regimes on values of rotational angular velocity. Given that rotational angular velocity relates to the measured periods as , we called stars with ( days) very slow rotators, 0.5 (days) slow rotators, and stars with (P3.14days) fast rotators. Median rotators are stars rotating with rotational angular velocity in the range 1.
5.1 Does CygOB2 Corroborate the Disk-Locking Scenario?
In Section 4.2 we considered as CTTS the stars listed by GDW13 as disk-bearing stars, and as WTTS, stars selected as candidate members by having X-ray emission from Kashyap (2017), and not listed as disk-bearing stars. A caveat arises from this selection procedure, since it does not guarantee that the disk-bearing stars are still interacting with their disks, nor account for disked stars with inclinations that do not produce IR-excess. Nonetheless, using this criterion the disk-fraction in the full candidate member sample is 24888As reference, the disk-fraction of similarly aged CepOB3b is 33 (Allen et al., 2012), and about 10 among candidate periodic stars. Given that the sample of stars with reliable period measured (with P2 days) contains only 82 stars with disks, the disk fraction in this sample is only 7.5. When looking at the light-curve morphological classification for the non-disked sample: 39.1 of the stars were classified as periodic candidates, 1.1 as eclipse-like, 14.5 as non-periodic variable stars, and 45.3 as non-variable stars. For the disk-bearing stars: 13.8 were periodic candidates, 5.7 were eclipse-like, 59.7 were non-periodic variables, and 10.8 where non-variables. This indicates that data-sampling used here is more efficient for detecting periodicity among non-disked stars, or equivalently, that the sample is biased towards WTTS.
The origin of the bias towards WTTS can be explained by taking into account the different physical mechanisms responsible for variability in CTTS and WTTS. Within WTTS we expect to detect mainly stars with variability caused by cold spots, which are expected to produce a low amplitude JHK variability (typically smaller than one tenth of magnitude), even for large spot coverages (e.g. Carpenter et al., 2001). For the CTTS the variability scenario may be more complicated. Besides the variability caused by the presence of cold spots, the most common sources of variability in CTTS are: obscuration by circumstellar material, accretion driven variability (like the presence of hot spots and variable mass accretion rates), and instabilities in the accretion disk (e.g. Carpenter et al., 2001; Cody et al., 2014; Stauffer et al., 2014; Rice et al., 2015; McGinnis et al., 2015; Sousa et al., 2016; Roquette, 2017). While sometimes a single physical process may dominate the star’s light curve, the existence of several concurrent variability sources is often the case. Adding up common limitation in the datasets, as limited time and wavelength coverage, multiple physical process composing a complex light curve may not be distinguishable. Thus, rotational periods in CTTS are often masked by other variability sources in the light curve.
This bias towards WTTS has been reported by other studies in the literature (e.g., Cohen et al., 2004; Herbst & Mundt, 2005), and it is assumed to be present in all the studies comparing the rotation of CTTS and WTTS. In the present study, a direct consequence of it is that the size of the CTTS sample is much smaller than the size of the WTTS sample. Consequently the results regarding disked stars are less statistically significant. For this reason, we did not compare CTTS and WTTS separating them by mass ranges. Therefore, we could not verify the statistics correlation of rotational periods with disk-diagnosis for restricted mass ranges, in order to test the evidences that disk-locking acts differently in different mass ranges.
Another bias arising from the use of disk diagnosis based on IR-excess is that a correlation of rotation with disk presence diagnosed via IR-excess can be a secondary effect due to dependence of IR-excess on mass suggested by some authors (Littlefair et al., 2005). Hillenbrand et al. (1998) showed that the IR-excess produced by the disk is a function of the disk properties, but also of the star’s mass and radius. The contrast between the disk and the star’s photosphere is larger for higher mass stars, so with lower contrast it is more difficult to detect disks of lower mass stars. In regions where lower mass stars rotate faster than higher mass stars (e.g. NGC 2362 Irwin et al., 2008), lower mass stars with undetected disks can mimic a correlation between fast rotators and non-disked stars. This effect can be minimized by using longer IR wavelengths to identify stars with IR-excess, and Cieza & Baliber (2007) showed that since the photosphere/disk contrast is higher in the mid-IR, disks can be detected even for lower mass stars by using Spitzer/IRAC colours. We discarded the possibility of our sample being affected by such bias. The analysis of rotation as a function of mass bin presented in Section 4.3.2 showed that, contrary to several other young regions studied, lower mass stars in CygOB2 rotate on average slower than higher mass stars. Given that even if disks around some lower mass stars were undetectable within the limits of the Spitzer data used by GDW13 for evaluating disk-bearing stars, the contamination by those stars would introduce slow rotators to the non-disked sample. This would produce a contamination in the sense of occluding the correlation between IR-excess and slow rotators. Hence we rule out the possibility that a correlation between IR-excess and slow rotators in our sample could be mimicked by a secondary effect.
Focusing on the whole list of members with periodic variability in CygOB2 (see Section 4.2), and even though our dataset is only complete for rotators with days, our results corroborate the general idea that the star-disk interaction has some influence in the rotational regulation of young stars. Disked stars in our sample are rotating on average slower than non-disked stars.
Cieza & Baliber (2007) present an alternative way of looking for observational evidences for the disk-locking phenomenon by studying the disk-fraction as a function of period. A plot of disk-fraction per period bin is shown in Figure 20 (left). The black circle shows the central period for each bin, and the bars show the length of each bin. The bins were built considering fast rotators, intermediate rotators, slow rotators, and very slow rotators defined as in the beginning of the present Section. Even though the disk fraction for periodic stars is low (), the top plot of Figure 20 shows that the disk fraction is actually quite dependent on the rotational period, having a maximum value of for stars with rotational periods between 8.4 days, and 12.6 days.
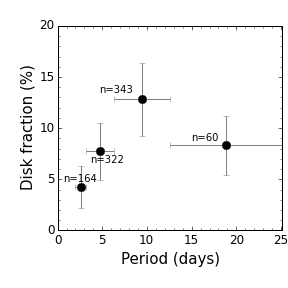
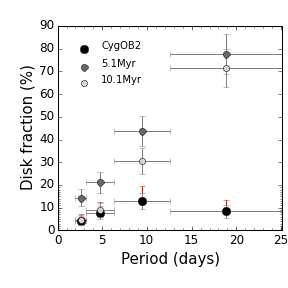
Vasconcelos & Bouvier (2015) investigated the disk fraction variations as a function of period for simulated populations under disk-locking effect with ages between 1.0 Myr and 12.1 Myr. Figure 7 of their paper shows, for a model starting with different period distributions for disked and non-disked stars, that the disk fraction increases with increasing rotational periods at all ages. Their M2 model has, at age 5.1 Myr, a disk fraction varying from 15 to 77 for periods from 2 days to 18 days, and from 5 to 72 at 10.1 Myr. Their results for 5.1 Myr, and 10.1 Myr are shown in the bottom plot in Figure 20, together with the results for our sample. In both plots in Figure 20 vertical bars follow standard errors of a Poisson counting, as the error bars used by Vasconcelos & Bouvier (2015). Results from Guarcello et al. (2016, hereafter GDW16) investigation on the disk-survival in CygOB2 suggest that the environmental feedback on disk evolution for CygOB2 members may be responsible for a decrease of about 20 on the disk fraction. The red vertical error bars in the bottom plot in Figure 20 shows a tentative correction for this effect and adds up 20 of each point’s disk fraction. Remembering that the disked periodic sample is biased due the variability mechanisms acting on disked stars, as described early in the present section, our dataset seems to corroborate the disk-locking results for periods up to 12.6 days, even though the increase of the disk fraction with period occurs in a less accentuate way when compared with Vasconcelos & Bouvier (2015) results. For periods longer than that, i.e. for the slowest rotators bin in the plots of Figure 20, the disk-fraction decreases, what may indicate that our dataset suffers from contamination from field stars.
A possible explanation for the lower disk-fraction compared to the models could be a strong premature disk loss due to the high energy radiation coming from the OB stars in the association, and Figure 20 (top panel) would be showing signatures of a primordial disk-locking with a reduced disk-fraction due to fast disk dissipation in the association. In this case, the disk lifetime distribution in CygOB2 would be very different from the ones used by Vasconcelos & Bouvier (2015), since they assume in their simulations that most stars are born with disks, and suffer from a smooth decrease on disk-fraction with time. Consequently, a comparison with their results would not be possible. Other possible explanations would be that CygOB2 low mass population is a few Myr older than previous thought, or that the environmental conditions in CygOB2 make the disk fraction decrease with time more steeply than considered in Vasconcelos & Bouvier (2015). It seem reasonable that combination of the two effects could explain the differences between CygOB2 data, and simulated data for the fast, slow, and intermediate rotators points in the right Figure 20.
Since Figure 20 suggests that the very slow rotator sample suffers from strong contamination, we re-examine the results in Section 4.2 by removing stars with days from the analysis. By doing so, we found that ()= 7.0, 2.7, and 7.1 days for disked stars, and ()= 5.7, 2.6, and 5.5 days for non-disked stars. A KS-test gives an 0.0001 change that the two distributions came from the same parent distribution, showing that the results from Section 4.2 hold even when excluding the very slow rotators from the analysis.
5.2 CygOB2 Inside the Picture of PMS Rotational Evolution
Figure 21 presents distributions of mass vs. rotational period for several young regions. These regions were selected from the list presented by Bouvier et al. (2014) in their review on the evolution of the AM in young low mass stars. The clusters and associations chosen have ages up to 15 Myr and rotational period samples that are numerous enough to be considered statistically significant. The selected regions are: NGC 6530 (Henderson & Stassun, 2012), with 244 measured periods in the mass range 0.2-2.0 ; Orion Nebulae Cluster (ONC, Irwin & Bouvier, 2009; Rodríguez-Ledesma et al., 2009), with 528 measured periods in the mass range 0.015-1.4; NGC 2264 (Lamm et al., 2005; Affer et al., 2013; Venuti et al., 2016), with about 581 measured periods in the mass range 0.2-3.0; CepOB3b (Littlefair et al., 2010) in the mass range 0.1-1.3, with 460 measured periods; NGC 2362 (Irwin et al., 2008), with 271 measured periods in the mass range 0.1-1.2; and hPer (Moraux et al., 2013), with 586 measured periods in the mass range 0.4-1.4.
The panels in Figure 21 are presented in order of age. For each cluster, we adopted the most recent age estimation available in the literature: NGC 6530 has 2 Myr (Bell et al., 2013), ONC has 2.8-5.2 Myr (Naylor, 2009), NGC 2264 has 2.4-6 Myr (Naylor, 2009), CepOB3b has 6 Myr (Bell et al., 2013), NGC2362 has 9.5-12.6 Myr (Bell et al., 2013), and hPer has 13 Myr (Mayne & Naylor, 2008). Those age estimates partially explain the different rotational scenarios observed in CepOB3b, and NGC 2362 by Littlefair et al. (2010), since the reviewed ages put the two regions in different evolutionary stages.
From the mass vs. period plots in Figure 21 one can see a large spread in period for all ages. The youngest region is NGC6530, and it presents rotational periods widely scattered between 0.5 days and 19 days. The oldest one is hPer, and its distributions, also widely scattered, presents a lower envelope at periods around 0.3 days, and maximum rotational periods around 15 days. While in NGC 6530 only 32 of the sample is composed by fast rotators, for hPer the fast rotators percentage is 56. ONC, NGC 2264, CepOB3b, and NGC 2362 seem to present some transitional properties from the rotational state of NGC6530 to the rotational state of hPer. For some clusters (ONC, CepOB3b, and NGC 2362), the spin up of the distribution’s lower envelope seems to be more efficient for lower mass stars.
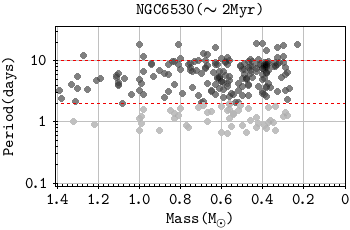
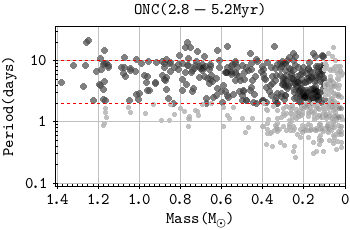
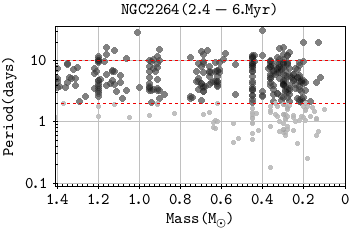
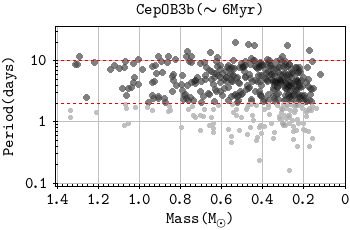
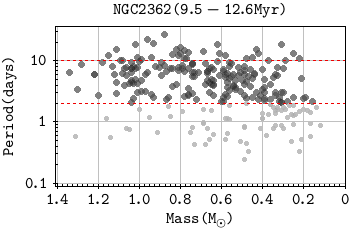
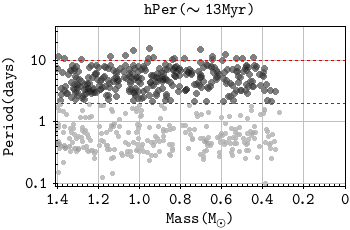
In order to make the comparison between the samples presented in Figure 21, and CygOB2 sample (Figure 22), we filtered each sample for stars with masses larger than 1.4M⊙, and smaller than 0.1M⊙, and periods smaller than 2 days. Stars filtered by this selection rule are shown as light gray circles in the mass vs. period plots in Figure 21. Figure 22 shows the same plot as in Figure 18, but in the same scale as the plots in Figure 21. After filtering each sample, their sizes are: 187 stars in NGC6530 sample; 351 in ONC; 288 in NGC2264; 342 in CepOB3b; 198 in NGC2362; and 309 in hPer. Against 894 stars in CygOB2.
Wright et al. (2010) derived ages between 2.75 and 6.75 Myr for CygOB2 low mass population, with a median value of 3.5 Myr for the center field, and 5 Myr for a northwestern field. For deriving stellar properties, they used Siess et al. (2000) models converted to 2MASS photometric system using Kenyon & Hartmann (1995). Given that the methods used by Mayne & Naylor (2008), Naylor (2009), and Bell et al. (2013) for evaluating stellar parameters result in ages 1.5-2.0 greater than ages estimated by previous methods, we stress that comparisons with other clusters in the literature using CygOB2 age as a parameter must be done with caution. That being said, using the age range as the unique criterion would place CygOB2 somewhere between ONC, and NGC2362.
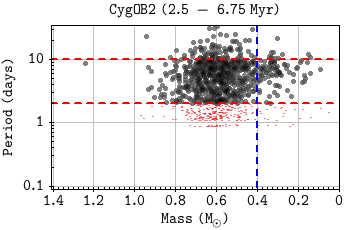
One feature that markedly varies from cluster to cluster in the plots of Figures 21, and 22, is the slope of the distribution’s upper envelope for lower mass stars. Irwin et al. (2008) suggest that this varying slope for masses between 0.1-0.5M⊙ was a result of cluster evolution with age. Following this suggestion, Henderson & Stassun (2012) used such slope as an age proxy, and suggest NGC6530 would be in an earlier evolutionary stage compared to ONC. They argued that this younger age would justify the remarkable differences between the mass vs. period distributions for NGC6530 and other clusters. In special, they found that lower mass stars in NGC6530 are rotating much slower than the higher mass stars, unlike observed in most other young clusters where lower mass stars rotate faster than higher mass stars. The authors argued that given an younger age, the explanation for the opposite sense in the period-mass relationship, would be that the lowest mass stars in the cluster are currently spinning up, and that in a future step of evolution they would end up rotating faster than the higher mass ones.
We found in Section 4.3.2 that lower mass stars in CygOB2 also rotate slower than higher mass stars. Given the much older age of CygOB2, compared to NGC 6530, we argued that the different age of these clusters could not explain the observational results of lower mass stars rotating on average slower than higher mass stars. An alternative explanation to this inverse period-mass relation for lower mass stars would be the role of environment conditions on regulating the stellar AM.
5.3 Are the Mass vs. Periods Relations Sensitive to the Environment?
A mass-rotation connection was first reported for stars in ONC (2.5-5.2 Myr), where Herbst et al. (2001) found that while stars in the cluster with spectral types between M2 and K presented a bi-modal distribution with one peak around fast rotators (2 days), and another around slow rotators (8 days); stars with spectral type later than M2 presented a unimodal distribution with a single peak around fast rotators (2 days). Given the observed differences in the period distribution, and given that the stars with later spectral type were on average faster rotators than the earlier, the authors called attention to a possible mass-rotation connection. Studies for other regions like NGC 2264 (Lamm et al., 2005), and IC 348 (Littlefair et al., 2005) favoured this connection.
A role of the environment in determining the mass-rotation relation has been suggested by Littlefair et al. (2010). They found that even though lower mass stars rotate faster than higher mass stars in CepOB3b, this difference is less strong than in other clusters, since CepOB3b has an excess of slow rotating low mass stars compared to other regions.
As is the case in NGC 6530 (Henderson & Stassun, 2012), lower mass stars in CygOB2 rotate on average slower than higher mass stars (Section 4.3.2) with a median rotational period of 6.9 days for lower mass stars, and 5.7 days for higher mass stars. Since our data is incomplete for fast rotators, we do not have enough information to discuss the existence of bi-modality in the period distributions, but apart from that, the shape of period distributions for different mass ranges presented on Figure 19 shows clear sign of a mass dependence: while period distribution for higher mass stars (M0.4M⊙) is quite flat for periods between 2-9 days, with a long tail towards slower rotators, it is peaked around slow rotators for the lower mass stars () in the sample showing a lack of fast rotators.
Before putting these results in context, we examine the possibility that a bias due to underestimated extinction could affect the results. An underestimated extinction would cause highly extincted higher mass stars to be considered as low mass stars. Since differences in the period distributions for lower and higher mass stars have been repeatedly reported in the literature, including studies for regions with relatively low and homogeneous extinction - as is the case of NGC2264 ( Dahm, 2008), where this contamination effect is probably minimum, higher mass stars mistaken by lower mass stars would bring contamination to the lower mass period sample. In regions where higher mass stars are slower rotators than lower mass stars, this bias would introduce slow rotators to the lower mass period distributions which was initially composed of faster rotators, biasing the distribution towards slower rotators, and masking the differences between the two mass-regime distributions. In the case of higher mass stars rotating on average faster than lower mass stars, this bias would introduce fast rotators to the lower mass stars distribution and the distribution would be biased towards such faster rotators. In both cases, we would expect the period distribution for lower mass stars to be somehow flattened due to the contamination. When comparing CygOB2 Mass vs. Period distributions (Figure 22) with the other regions (Figure 21), one can see that CygOB2 presents a clear lack of fast and intermediate rotators within its lower mass stars, and therefore we ruled out the possibility that the result may be mimicked by a contamination due to higher mass stars with underestimated extinction. A third possibility that remains is that the extinction for the stars in our sample is underestimated as whole, and in this case our observations would not reach lower mass at all, and the whole lower mass bin would actually be composed by higher mass stars with underestimated masses. Since we saw in Section 4.3.2 that a KS-test between the samples with , and returned a probability of only 0.02 that the two samples came from the same parent population, we also excluded the hypothesis that the smaller mass sample could be a sub-sample of higher mass stars with underestimated extinction.
A final caveat on interpreting our results arises from the fact our sample is incomplete for fast rotators with periods under 2 days. To check if the statistical difference between the rotational scenario of different mass regimes holds after removing the faster rotators from the sample, we present in Table 2 the mean, standard deviation, and median values for the period distributions of the young regions presented in Figure 21 for both full, and P2 days samples. We divided each cluster sample in two mass ranges using as a cut. For each cluster, the mass regime that rotates slower on average is stressed in bold. Since hPer sample includes only a few stars with masses , we present the results from this cluster in Table 2, but we did not use it for the present investigation. From Table 2, one can see that filtering the samples for days does not change qualitatively the rotation-mass connection. Nevertheless, for NGC 2264, KS-tests between the samples of higher and lower mass stars without faster rotators than days, changes significantly. The last column of Table 2 shows a KS-test between the lower mass stars from each clusters, with low mass stars in CygOB2, and shows that the lower mass end of CygOB2 Mass vs. Period distribution is dissimilar to all the other clusters considered.
| KS-test ()a𝑎aa𝑎ap-value from KS-test between the samples , and , given in percentage, meaning the probability that the two sample were derived from the same parent distribution.p-value from KS-test between the samples , and , given in percentage, meaning the probability that the two sample were derived from the same parent distribution. | |||||||
| MM⊙ | M0.4M⊙ | between mass ranges | (with CygOB2 | ||||
| (days) | (days) | for MM⊙) | |||||
| Region | All | P2days | All | P2days | All | P2days | P2days |
| CygOB2 | - | (7.0,2.9,6.8) | - | (6.5,4.2,5.7) | - | 0.02 | - |
| NGC6530 | (6.5,4.2,6.8) | (6.4,3.3,5.6) | (5.3,3.7,4.7) | (6.5, 3.4, 5.6) | 1.4 | 2.1 | 0.16 |
| ONC | (3.3,2.8,2.5) | (5.0, 2.7, 4.4) | (5.7,3.9,5.4) | (6.6, 3.6, 6.4) | 10-9 | 0.0001 | 10-9 |
| NGC2264 | (4.6,3.7,3.9) | (6.2, 3.4, 5.2) | (5.4,4.1,4.3) | (6.3, 4.0 5.1) | 0.26 | 74.26 | 0.02 |
| CepOB3b | (4.0,2.7,3.5) | (5.1, 2.5, 4.6) | (4.9,3.5,4.4) | (6.0, 3.2, 5.3) | 1.16 | 1.83 | 10-7 |
| NGC2362 | (3.0,3.2,1.9) | (5.0, 3.8, 3.0) | (5.8,4.4,4.9) | (6.9, 4.1 ,6.1) | 10-8 | 0.072 | 0.002 |
| hPer | (2.0,2.0,1.4)c𝑐cc𝑐cSample composed with only 9 stars.Sample composed with only 9 stars. | (4.2, 1.8, 3.3)d𝑑dd𝑑dfootnotemark: | (3.3,3.0,2.7) | (5.5, 2.5, 5.1) | - | - | - |
The observational results for CygOB2 could be explained if the lower mass stars in the sample were remaining locked to their disks for a longer time than the higher mass stars in the sample (solar- type). One possible reason why the lower mass star could keep their disks for a longer time is if primordial mass segregation occurs, i.e., very low mass stars are more widely distributed than solar-type stars. They would thus lie further away from the ionizing radiation of central OB stars than the more concentrated solar-type stars. They would as well be in lower stellar density regions, thus avoiding disk-disruptive encounters. However, Wright et al. (2014), and Wright et al. (2016) found no signal of mass segregation in the association, and additionally GDW16 showed that close encounters in CygOB2 is not important in regulating disk dissipation, so this explanation may not apply.
The present study shows that, like NGC 6530, CygOB2 presents qualitatively a mass-rotation connection in the opposite sense from other clusters, with lower mass stars rotating on average slower than higher mass stars. We consider that the statistical differences between the distributions from the two regions are due to different rotational ages, since NGC 6530 is about 2 Myr old, and CygOB2 stars have ages ranging from 2.5 to 6.75 Myr. Also due to this age difference between the two regions, we refute the explanation given by Henderson & Stassun (2012) based on youth to explain lower mass stars being slower rotators than higher mass stars in the region, since for CygOB2 this explanation would not apply. Instead, we raise the hypothesis that the environmental influence on regulating the rotation may be a better explanation.
Since both CepOB3b, and CygOB2 are OB associations with similar ages, it would be reasonable to expect they would have similar rotational properties. Even though they both present an excess of slow rotators within their lower mass members, their period distributions are statistically different, and their rotational-mass connection is qualitatively inverse. Those differences could be explained by a smaller concentration of O stars: CygOB2 is a notoriously massive OB association, with more than 160 confirmed OB stars (Wright et al., 2015) within its members, 73 of which are O stars, while CepOB3b is a small association with a massive population composed by only 3 O stars, and 33 B stars (Blaauw et al., 1959; Blaauw, 1964) stars spread over 10 pc (Blaauw, 1964). On the other hand, NGC 6530 is a core cluster of the Sgr OB1 association and it is located in the eastern part of the very bright Lagoon Nebula (Sung et al., 2000). NGC 6530 is also 3-4 times richer in OB stars than ONC (Damiani et al., 2004), whose population has similar age.
5.3.1 Does CygOB2 Massive Population Regulate Low Mass Star Rotation?
OB stars can influence their environment due to their strong UV field. Far ultraviolet (FUV) photons (6eV13.6eV) can dissociate H2 molecules, and extreme ultraviolet (EUV) photons (13.6eV) are capable of ionizing hydrogen atoms. Because of that, regions with intense local UV field can be hostile to the evolution of circumstellar disks, and to the processes of star formation (e.g. Johnstone et al., 1998; Adams et al., 2004; Guarcello et al., 2010, 2016). In special, GDW16 recently found evidences that disks are more rapidly dissipated in regions of CygOB2 with intense local UV.
To test the effect of CygOB2 massive stars on the rotational properties of nearby YSO we investigated how the rotational period distributions vary as a function of local UV field. To estimate local UV fluxes, we used the technique adopted in GDW16 and Guarcello et al. (2007): We propagated the FUV and EUV fluxes emitted by each O star to the position of each periodic stars using 2D projected distances. The effect of using 2D projected distances instead of real distances is discussed on section 3.1 of GDW16, and it was shown by the authors to have very small impact in the analysis.
| Disk-bearing | Non-disked | ||||
|---|---|---|---|---|---|
| FUV | N | N | KS-test | ||
| low UV | 8.2, 4.6, 7.6 | 43 | 6.5, 4.0, 5.6 | 343 | 0.1 |
| high UV | 7.2, 3.6, 7.1 | 29 | 6.6, 4.3, 6.0 | 469 | 57 |
| Disk-bearing | Non-disked | ||||
|---|---|---|---|---|---|
| EUV | N | N | KS-test | ||
| low UV | 8.2, 4.5, 7.6 | 56 | 6.4, 4.1, 5.5 | 406 | 0.01 |
| high UV | 7.1, 3.8, 6.2 | 26 | 6.7, 4.2, 6.2 | 406 | 81 |
The UV flux emitted by each of the 73 O stars, and 3 Wolf-Rayet (WR) stars in CygOB2 was estimated by GDW16 (Table 1 in their study). Their estimates for FUV flux is presented in terms of Habing flux G0=erg/cm2/s999For reference: The average UV flux in the spectra range 912-2000Å in the solar neighborhood is 1.7G0 (Habing, 1968), and their EUV fluxes 101010number of ionizing photons with Å per second per cm2. are in photons/s/cm2. A map for incident FUV and EUV fluxes for CygOB2 candidate member stars was presented by the authors in their Figure 3. Using their estimates for the O stars UV flux, we calculated the incident UV flux at the position of each periodic star. As in GDW16, B stars are omitted because their census is still incomplete and their contribution to the whole UV field in the association is negligible compared to the O and WR stars.
Using the FUV and EUV local fluxes, we define as regions with low UV incidence star positions where or photons/s/cm2, and regions with high UV incidence star positions where or photons/s/cm2 111111We also tested more extreme values as , and photons/s/cm2 and verified that they produce the same results qualitatively. . . Disk fraction as a function of rotational period plots for stars in regions with high and low UV incidence are shown in Figure 23. From the plots, one can see that the maximum disk fraction goes from 21 for slow rotators stars in low FUV incidence regions, to 7.3 for slow rotators in high FUV incidence regions; and from 20.3 for slow rotators in low EUV incidence regions, to 7.1 for intermediate rotators in high EUV incidence regions. Figure 23 suggest that high incident UV does yield faster disk dissipation, even though it does not change qualitatively the trend of increasing disk fraction for longer periods.
While GDW16 results suggest that regions with high UV incident fields can rapidly erode disks, our results suggest that this can directly influence disk-rotation connection. Table 3 shows the values for each period sample for disk-bearing and non-disked stars in each UV incidence sample. The number of stars in each sample, and a KS-test between samples of disk-bearing and non-disked stars are also included in the Table. From the table one can see that while the disk-bearing and non-disked stars samples are different for regions with low UV incidence (a KS-test gives 0.1 probability they came from the same parent distribution for FUV samples, and 0.01 probability for EUV sample), in regions with high UV incidence a disk-rotation connection can not be verified and results from KS-test does not discard the possibility that disk-bearing and non-disked period distributions came from the same parent distribution in such samples.
| FUV | N | N | KS-test | ||
|---|---|---|---|---|---|
| low UV | 6.9 2.6, 6.3 | 36 | 6.9, 4.3, 5.9 | 241 | 5 |
| high UV | 7.3, 3.0, 7.1 | 50 | 6.5, 4.3, 5.7 | 388 | 0.2 |
| EUV | N | N | KS-test | ||
|---|---|---|---|---|---|
| low UV | 7.2, 3.4, 6.5 | 37 | 6.7, 4.4, 5.8 | 297 | 1.1 |
| high UV | 7.1, 2.4, 7.1 | 49 | 6.6, 4.3, 5.7 | 332 | 0.5 |
photons/s/cm2
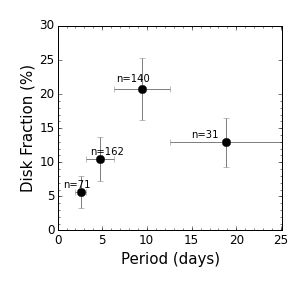

photons/s/cm2
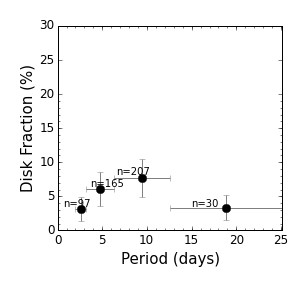
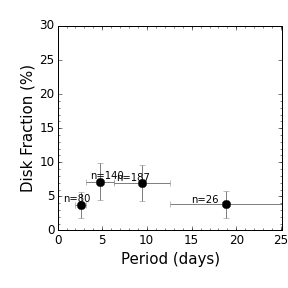
Next, like in section 4.3.2, we built period distributions for different mass ranges for low and high UV incident radiation. The shape of the distribution do not seem to be significantly affected by the amount of UV incident radiation. Both low and high local UV incidence samples show a mass-rotation connection with lower mass stars rotating in average slower than higher mass stars. Table 4 shows the values for each distribution. The number of stars in each sample, and a KS-test between the two mass range for each sub-sample is also shown. We performed KS-tests between each pair of samples for the same mass range and regions with low and high UV incidence, but for all pairs of samples the KS-test yielded that we can not exclude the possibility that the two samples came from the same parent distribution. From Table 4, one can see that KS-tests between period distributions for different mass ranges in samples with high incident UV flux give smaller probabilities that the two samples came from the same parent distribution than regions with low incident UV. This difference, even if less strong than the one found for the case of disk-rotation connection, may hint that UV incident fluxes can also influence the mass-rotation connection.
The magnitude distributions for the samples of high and low UV incidence were analysed as it was done in Section 2.3, and the completeness limits found for the two samples were qualitatively the same. The magnitude range in which the two samples can be considered complete is the same as for the full candidate member sample (Figure 6), hence we do not consider that completeness issues in the UV-selected samples may be impacting the results. Nevertheless, variability surveys sensitive to fainter stars may improve the size and completeness of the samples towards the fainter stars and help confirming the results presented here.
Further investigations are needed in order to improve these results, in special in order to complete the present analysis for faster rotators. But so far, our results suggest that local incident UV radiation may have a role on regulating the AM of YSO. In this sense, evaluating the UV radiation arising from massive stars may help to explain differences in the rotational properties of low mass stars in young cluster similarly aged presented in the literature.
6 Conclusions
In this study we presented the first analysis of rotation properties for low mass stars in the young OB association Cygnus OB2. We presented results for stars in the mass range 0.1-1.4. We identified and studied a sample of 1679 stars with signs of periodic variability in their NIR light curves, out of a sample of 5083 candidate members. After time-series analysis, we confirm periodicity in 1291 stars (25 of total candidate member sample), but after completeness analysis, only 894 of those were considered as reliable period measurements. Since the periodic sample is strongly aliased for periods shorter than about 2 days, most of our analysis was limited to the intermediate (3.146.28 days) and slow (6.28 days) rotators, with detected fast rotators only in the range 2-3.14 days. The main findings of this work are:
-
1.
We found periods widely distributed between 0.83 days, and 32.49 days, but due to completeness and contamination issues, we only analysed periods longer than 2 days. The amplitudes of variability for periodic stars were in the range 0.03-1.2 magnitudes; and the masses in the range 0.1-1.4 .
-
2.
Disk-bearing and non-disked stars are statistically distinct in their rotational properties. Even though there is a significant overlap between their period distributions, disk-bearing stars rotate on average slower (median period: 7.34 days) than non-disked stars (median period 5.80 days). Also, period detection is more common among non-disked stars, than among disked stars.
-
3.
The disk fraction increases as a function of period, except for the very-slow rotator bin (12.56 days), which has smaller statistics number and seems to suffer from contamination from field stars. The disk fraction varies from 4 for fast rotators (2-3.14 days) to 13 for slow rotators (6.28-12.56 days). This corroborates the results expected for disk-locking hypothesis, but when compared with semi-empirical simulations from Vasconcelos & Bouvier (2015) testing disk locking hypothesis, the variation of disk-fraction as a function of period is shallower than predicted by the simulations.
-
4.
A period-mass connection was verified, i.e., statistically distinct properties were found for different mass ranges. A median period of 5.7 days was found for the mass range ,and 6.9 days for . However this mass-rotation connection is different from other regions: As is the case of NGC 6530, lower mass stars in CygOB2 rotate slower than higher mass stars.
We also investigated the possibility of a correlation between the incident UV flux arising from O stars in CygOB2 and the rotational properties of low mass stars described in the previous items.
-
5.
We verified that while the distinction in the rotational properties of disk-bearing and non- disked stars is stronger in regions with low UV incidence, in regions with high UV incidence it is not possible to distinguish between the two samples.
-
6.
The increase of the disk fraction with period is stronger for a sample of stars with low local UV incidence, and it is weaker for a sample of stars with high local UV incidence. A maximum disk fraction of 21, and 7.3 for slow rotators was found for low and high local UV incidence respectively.
-
7.
Both low and high local UV incidence samples show a mass-rotation connection with lower mass stars rotating in average slower than higher mass stars. For stars with low local UV incidence, a KS-tests gives that this difference is barely significant, but for stars with high local UV incidence, KS-tests shows stronger evidence that the two mass ranges have different rotational period distributions.
Our results suggest a link between environmental conditions and the rotational evolution of PMS stars. However, it is urgent to complement the sample presented in this study for fast rotators and lower masses, in order to achieve a better understanding of the rotational scenario in the association, and to confirm such suggestions.
Acknowledgements.
This study was part of JR PhD thesis which was granted by CNPq (Conselho Nacional de Desenvolvimento Científico e Tecnológico) and CAPES (Coordenação de Aperfeiçoamento de Pessoal de Nível Superior). S.H.P.A acknowledges financial support from CNPq, CAPES, and FAPEMIG. We thank Bo Reipurth for kindly providing us with the WFCAM/UKIRT dataset used in the present study. JB acknowledges the support of ANR grant 2011 Blanc SIMI5-6 020 01 Toupies: Towards understanding the spin evolution of stars (http://ipag.osug.fr/Anr_Toupies/). We also thank Laura Venuti, Francisco Maia, Alana Souza, Jaqueline Vasconcelos for useful comments over the work development. This study has made use of NASA’s Astrophysics Data System Bibliographic Services. This research did extensive use of TOPCAT software (Taylor, 2005).References
- Adams et al. (2004) Adams, F. C., Hollenbach, D., Laughlin, G., & Gorti, U. 2004, ApJ, 611, 360
- Affer et al. (2013) Affer, L., Micela, G., Favata, F., Flaccomio, E., & Bouvier, J. 2013, MNRAS, 430, 1433
- Aihara et al. (2011) Aihara, H., Allende Prieto, C., An, D., et al. 2011, ApJS, 193, 29
- Allard et al. (2011) Allard, F., Homeier, D., & Freytag, B. 2011, in Astronomical Society of the Pacific Conference Series, Vol. 448, 16th Cambridge Workshop on Cool Stars, Stellar Systems, and the Sun, ed. C. Johns-Krull, M. K. Browning, & A. A. West, 91
- Allen et al. (2012) Allen, T. S., Gutermuth, R. A., Kryukova, E., et al. 2012, ApJ, 750, 125
- Baraffe et al. (1998) Baraffe, I., Chabrier, G., Allard, F., & Hauschildt, P. H. 1998, A&A, 337, 403
- Baraffe et al. (2015) Baraffe, I., Homeier, D., Allard, F., & Chabrier, G. 2015, A&A, 577, A42
- Barentsen et al. (2014) Barentsen, G., Farnhill, H. J., Drew, J. E., et al. 2014, MNRAS, 444, 3230
- Beerer et al. (2010) Beerer, I. M., Koenig, X. P., Hora, J. L., et al. 2010, ApJ, 720, 679
- Bell et al. (2013) Bell, C. P. M., Naylor, T., Mayne, N. J., Jeffries, R. D., & Littlefair, S. P. 2013, MNRAS, 434, 806
- Bell et al. (2014) Bell, C. P. M., Rees, J. M., Naylor, T., et al. 2014, MNRAS, 445, 3496
- Blaauw (1964) Blaauw, A. 1964, ARA&A, 2, 213
- Blaauw et al. (1959) Blaauw, A., Hiltner, W. A., & Johnson, H. L. 1959, ApJ, 130, 69
- Bodenheimer (1995) Bodenheimer, P. 1995, ARA&A, 33, 199
- Bouvier et al. (1986) Bouvier, J., Bertout, C., Benz, W., & Mayor, M. 1986, A&A, 165, 110
- Bouvier et al. (2003) Bouvier, J., Grankin, K. N., Alencar, S. H. P., et al. 2003, A&A, 409, 169
- Bouvier et al. (2014) Bouvier, J., Matt, S. P., Mohanty, S., et al. 2014, Protostars and Planets VI, 433
- Bouy et al. (2013) Bouy, H., Bertin, E., Moraux, E., et al. 2013, A&A, 554, A101
- Cardelli et al. (1989) Cardelli, J. A., Clayton, G. C., & Mathis, J. S. 1989, ApJ, 345, 245
- Carpenter et al. (2001) Carpenter, J. M., Hillenbrand, L. A., & Skrutskie, M. F. 2001, AJ, 121, 3160
- Casali et al. (2007) Casali, M., Adamson, A., Alves de Oliveira, C., et al. 2007, A&A, 467, 777
- Cieza & Baliber (2007) Cieza, L. & Baliber, N. 2007, ApJ, 671, 605
- Clarke (2002) Clarke, D. 2002, A&A, 386, 763
- Cody & Hillenbrand (2010) Cody, A. M. & Hillenbrand, L. A. 2010, ApJS, 191, 389
- Cody et al. (2014) Cody, A. M., Stauffer, J., Baglin, A., et al. 2014, AJ, 147, 82
- Cohen et al. (2004) Cohen, R. E., Herbst, W., & Williams, E. C. 2004, AJ, 127, 1602
- Comerón et al. (2002) Comerón, F., Pasquali, A., Rodighiero, G., et al. 2002, A&A, 389, 874
- Covey et al. (2007) Covey, K. R., Ivezić, Ž., Schlegel, D., et al. 2007, AJ, 134, 2398
- Cutri et al. (2003) Cutri, R. M., Skrutskie, M. F., van Dyk, S., et al. 2003, 2MASS All Sky Catalog of point sources.
- Dahm (2008) Dahm, S. E. 2008, The Young Cluster and Star Forming Region NGC 2264, ed. B. Reipurth, 966
- Damiani et al. (2004) Damiani, F., Flaccomio, E., Micela, G., et al. 2004, ApJ, 608, 781
- Doi et al. (2010) Doi, M., Tanaka, M., Fukugita, M., et al. 2010, AJ, 139, 1628
- Drew et al. (2005) Drew, J. E., Greimel, R., Irwin, M. J., et al. 2005, MNRAS, 362, 753
- Drew et al. (2008) Drew, J. E., Greimel, R., Irwin, M. J., & Sale, S. E. 2008, MNRAS, 386, 1761
- Gallet & Bouvier (2013) Gallet, F. & Bouvier, J. 2013, A&A, 556, A36
- Ghosh & Lamb (1979) Ghosh, P. & Lamb, F. K. 1979, ApJ, 234, 296
- Gregory et al. (2012) Gregory, S. G., Donati, J.-F., Morin, J., et al. 2012, ApJ, 755, 97
- Guarcello et al. (2016) Guarcello, M. G., Drake, J. J., Wright, N. J., et al. 2016, ArXiv e-prints [arXiv:1605.01773]
- Guarcello et al. (2013) Guarcello, M. G., Drake, J. J., Wright, N. J., et al. 2013, ApJ, 773, 135
- Guarcello et al. (2015) Guarcello, M. G., Drake, J. J., Wright, N. J., et al. 2015, ArXiv e-prints [arXiv:1501.03761]
- Guarcello et al. (2010) Guarcello, M. G., Micela, G., Peres, G., Prisinzano, L., & Sciortino, S. 2010, A&A, 521, A61
- Guarcello et al. (2007) Guarcello, M. G., Prisinzano, L., Micela, G., et al. 2007, A&A, 462, 245
- Guarcello et al. (2012) Guarcello, M. G., Wright, N. J., Drake, J. J., et al. 2012, ApJS, 202, 19
- Habing (1968) Habing, H. J. 1968, Bull. Astron. Inst. Netherlands, 19, 421
- Hanson (2003) Hanson, M. M. 2003, ApJ, 597, 957
- Henderson et al. (2011) Henderson, C. B., Stanek, K. Z., Pejcha, O., & Prieto, J. L. 2011, ApJS, 194, 27
- Henderson & Stassun (2012) Henderson, C. B. & Stassun, K. G. 2012, ApJ, 747, 51
- Herbst et al. (2001) Herbst, W., Bailer-Jones, C. A. L., & Mundt, R. 2001, ApJ, 554, L197
- Herbst et al. (2002) Herbst, W., Bailer-Jones, C. A. L., Mundt, R., Meisenheimer, K., & Wackermann, R. 2002, A&A, 396, 513
- Herbst & Mundt (2005) Herbst, W. & Mundt, R. 2005, ApJ, 633, 967
- Hewett et al. (2006) Hewett, P. C., Warren, S. J., Leggett, S. K. T. d., & Hodgkin, S. T. 2006, MNRAS, 367, 454
- Hillenbrand et al. (1998) Hillenbrand, L. A., Strom, S. E., Calvet, N., et al. 1998, AJ, 116, 1816
- Hodgkin et al. (2009) Hodgkin, S. T., Irwin, M. J., Hewett, P. C., & Warren, S. J. 2009, MNRAS, 394, 675
- Horne & Baliunas (1986) Horne, J. H. & Baliunas, S. L. 1986, ApJ, 302, 757
- Irwin & Bouvier (2009) Irwin, J. & Bouvier, J. 2009, in IAU Symposium, Vol. 258, IAU Symposium, ed. E. E. Mamajek, D. R. Soderblom, & R. F. G. Wyse, 363–374
- Irwin et al. (2008) Irwin, J., Hodgkin, S., Aigrain, S., et al. 2008, MNRAS, 384, 675
- Johnstone et al. (1998) Johnstone, D., Hollenbach, D., & Bally, J. 1998, ApJ, 499, 758
- Joy (1945) Joy, A. H. 1945, ApJ, 102, 168
- Kashyap (2017) Kashyap, V. L. 2017
- Kenyon & Hartmann (1995) Kenyon, S. J. & Hartmann, L. 1995, ApJS, 101, 117
- Kiminki et al. (2015) Kiminki, D. C., Kobulnicky, H. A., Vargas Álvarez, C. A., Alexander, M. J., & Lundquist, M. J. 2015, ApJ, 811, 85
- Knödlseder (2000) Knödlseder, J. 2000, A&A, 360, 539
- Koenigl (1991) Koenigl, A. 1991, ApJ, 370, L39
- Lafler & Kinman (1965) Lafler, J. & Kinman, T. D. 1965, ApJS, 11, 216
- Lamm et al. (2005) Lamm, M. H., Mundt, R., Bailer-Jones, C. A. L., & Herbst, W. 2005, A&A, 430, 1005
- Littlefair et al. (2005) Littlefair, S. P., Naylor, T., Burningham, B., & Jeffries, R. D. 2005, MNRAS, 358, 341
- Littlefair et al. (2010) Littlefair, S. P., Naylor, T., Mayne, N. J., Saunders, E. S., & Jeffries, R. D. 2010, MNRAS, 403, 545
- Lomb (1976) Lomb, N. R. 1976, Ap&SS, 39, 447
- Lucas et al. (2008) Lucas, P. W., Hoare, M. G., Longmore, A., et al. 2008, MNRAS, 391, 136
- Massey & Thompson (1991) Massey, P. & Thompson, A. B. 1991, AJ, 101, 1408
- Matt & Pudritz (2005) Matt, S. & Pudritz, R. E. 2005, ApJ, 632, L135
- Matt et al. (2012) Matt, S. P., Pinzón, G., Greene, T. P., & Pudritz, R. E. 2012, ApJ, 745, 101
- Mayne & Naylor (2008) Mayne, N. J. & Naylor, T. 2008, MNRAS, 386, 261
- McGinnis et al. (2015) McGinnis, P. T., Alencar, S. H. P., Guimarães, M. M., et al. 2015, A&A, 577, A11
- Moraux et al. (2013) Moraux, E., Artemenko, S., Bouvier, J., et al. 2013, A&A, 560, A13
- Naylor (2009) Naylor, T. 2009, MNRAS, 399, 432
- Pasquali et al. (2002) Pasquali, A., Comerón, F., Gredel, R., Torra, J., & Figueras, F. 2002, A&A, 396, 533
- Plavchan et al. (2008) Plavchan, P., Jura, M., Kirkpatrick, J. D., Cutri, R. M., & Gallagher, S. C. 2008, ApJS, 175, 191
- Press et al. (1992) Press, W. H., Flannery, B. P., Teukolsky, S. A., & Veterling, W. T. 1992, Numerical Recipes in C: the art of scientific computing, 2nd edn. (Cambridge: Cambridge University Press)
- Rauw et al. (2015) Rauw, G., Nazé, Y., Wright, N. J., et al. 2015, ApJS, 221, 1
- Rebull et al. (2004) Rebull, L. M., Wolff, S. C., & Strom, S. E. 2004, AJ, 127, 1029
- Reddish et al. (1966) Reddish, V., Lawrence, L. C., & Pratt, N. M. 1966, Publications of the Royal Observatory of Edinburgh, 5, 111
- Rice et al. (2015) Rice, T. S., Reipurth, B., Wolk, S. J., Vaz, L. P., & Cross, N. J. G. 2015, AJ, 150, 132
- Rodríguez-Ledesma et al. (2009) Rodríguez-Ledesma, M. V., Mundt, R., & Eislöffel, J. 2009, A&A, 502, 883
- Romanova et al. (2009) Romanova, M. M., Ustyugova, G. V., Koldoba, A. V., & Lovelace, R. V. E. 2009, MNRAS, 399, 1802
- Roquette (2017) Roquette, J. 2017, in preparation
- Saunders et al. (2006) Saunders, E. S., Naylor, T., & Allan, A. 2006, Astronomische Nachrichten, 327, 783
- Scargle (1982) Scargle, J. D. 1982, ApJ, 263, 835
- Schlegel et al. (1998) Schlegel, D. J., Finkbeiner, D. P., & Davis, M. 1998, ApJ, 500, 525
- Scholz & Eislöffel (2004) Scholz, A. & Eislöffel, J. 2004, A&A, 419, 249
- Scholz et al. (2009) Scholz, A., Xu, X., Jayawardhana, R., et al. 2009, MNRAS, 398, 873
- Siess et al. (2000) Siess, L., Dufour, E., & Forestini, M. 2000, A&A, 358, 593
- Sousa et al. (2016) Sousa, A. P., Alencar, S. H. P., Bouvier, J., et al. 2016, A&A, 586, A47
- Stauffer et al. (2014) Stauffer, J., Cody, A. M., Baglin, A., et al. 2014, AJ, 147, 83
- Stetson (1996) Stetson, P. B. 1996, PASP, 108, 851
- Sung et al. (2000) Sung, H., Chun, M.-Y., & Bessell, M. S. 2000, AJ, 120, 333
- Tanner (1948) Tanner, R. W. 1948, JRASC, 42, 177
- Taylor (2005) Taylor, M. B. 2005, in Astronomical Society of the Pacific Conference Series, Vol. 347, Astronomical Data Analysis Software and Systems XIV, ed. P. Shopbell, M. Britton, & R. Ebert, 29
- Tognelli et al. (2012) Tognelli, E., Degl’Innocenti, S., & Prada Moroni, P. G. 2012, Memorie della Societa Astronomica Italiana Supplementi, 22, 225
- Tognelli et al. (2011) Tognelli, E., Prada Moroni, P. G., & Degl’Innocenti, S. 2011, A&A, 533, A109
- Torres-Dodgen et al. (1991) Torres-Dodgen, A., Carroll, M., & Tapia, M. 1991, MNRAS, 249, 1
- Vasconcelos & Bouvier (2015) Vasconcelos, M. J. & Bouvier, J. 2015, A&A, 578, A89
- Venuti et al. (2016) Venuti, L., Bouvier, J., Cody, A. M., et al. 2016, ArXiv e-prints [arXiv:1610.08811]
- Vink et al. (2008) Vink, J. S., Drew, J. E., Steeghs, D., et al. 2008, MNRAS, 387, 308
- Vogel & Kuhi (1981) Vogel, S. N. & Kuhi, L. V. 1981, ApJ, 245, 960
- Walborn et al. (2002) Walborn, N. R., Howarth, I. D., Lennon, D. J., et al. 2002, AJ, 123, 2754
- Wilking et al. (2001) Wilking, B. A., Bontemps, S., Schuler, R. E., Greene, T. P., & André, P. 2001, ApJ, 551, 357
- Wright et al. (2016) Wright, N. J., Bouy, H., Drew, J. E., et al. 2016, MNRAS, 460, 2593
- Wright & Drake (2009) Wright, N. J. & Drake, J. J. 2009, ApJS, 184, 84
- Wright et al. (2010) Wright, N. J., Drake, J. J., Drew, J. E., & Vink, J. S. 2010, ApJ, 713, 871
- Wright et al. (2014) Wright, N. J., Drake, J. J., Guarcello, M. G., et al. 2014, ArXiv e-prints [arXiv:1408.6579]
- Wright et al. (2015) Wright, N. J., Drew, J. E., & Mohr-Smith, M. 2015, MNRAS, 449, 741
- Zanni & Ferreira (2013) Zanni, C. & Ferreira, J. 2013, A&A, 550, A99
Appendix A Other Possible Sources of Contamination To The Periodic Sample
A.1 Contamination by Periods Outside the Observations Resolution
Given the evidence of high contamination in the shorter periods bin (Figures 10 and 11), we performed some extra simulations focusing on periods outside the period range considered.
Longer Periods:
First, we focused on the possible contamination due to periods longer than 20 days. We repeated the simulation described in Section 3.2, but this time considering periods () between 20 and 100 days with amplitudes between 0.015 and 0.5 mag. For those specific simulations, we kept the filtering for FAP, RL- and S-statistics, but we did not perform any further cleaning for periods around 1day. The recovery success on this range is only 12 in a sample of 78000 synthetic periodic light curves for the amplitude range considered. For the 680 (9) synthetic light curves in contaminant sample (i.e., synthetic light curves selected as periodic, but with ), we analysed the distribution of measured periods (), and verified that 98 of the contaminant sample had around 10.2 days. This justify the filtering for periods in the range 0.92-1.08 days applied in Section 3.1.
Shorter Periods:
Second, we focus on the contamination due to periods shorter than our data-sampling is capable of resolving. For the set of simulations presented in Figure 11, we analysed the input characteristics of the synthetic light curves. Figure 24 shows the input period () distribution for the synthetic light curves with P days, which compose the two shortest period bins in Figure 11. The y-axis shows the fraction of contaminants with days. From this plot, we can estimate that 15 of the contamination arises from aliased periods smaller than 1 day, and 49 of the contamination arises from unresolved periods between 1 and 2 days. Despite the fact that these short period aliases account for 64 of the contamination, there is a lower level contamination arising from all period bins larger than 2 days up to 15 days, which adds up 36 of contamination. Since it is not possible to untangle the two contaminant sources, we conclude that the periodic sample with days suffers from strong contamination, and it should not be used in the further analysis.

A.2 Contamination Due to Non-Periodic Variability
We performed additional Monte Carlo simulation for non-periodic waveforms and applied the automatized period search to the non-periodic sample. For each synthetic light curve, a random amplitude was generated and two possible waveforms were randomly assigned. The first waveform assumes that the light-curve is a straight line with slope defined as the ratio between the randomly selected amplitude and the total number of observations. The second wave form was composed of random numbers generated between 0.015 and the amplitude value.
A total of 78000 synthetic light curves were generated this way, with amplitudes between 0.015 and 1.5 mag. While of the sample presented periodogram power peaks in the three bands with a power higher enough to be automatically selected as periodic, they were however not wrongly selected as periodic, since most of them are distributed around 1 day, and were ruled out from the periodic selection. The few objects with periods outside this range were ruled out by the RL-statistics or Saunder-Statistics filters. Finally, after applying the automatized period search procedure to this sample, we concluded that the procedure is robust enough to avoid any contamination due to these non-periodic waveforms in our periodic sampe.