Superorbital modulation at GeV energies in the -ray binary LS I 61°303
Abstract
We report the results from our analysis of 8 years of the data for the -ray binary LS I 61°303, obtained with the Large Area Telescope onboard the Fermi Gamma-Ray Space Telescope. We find a significant dip around the binary’s periastron in the superorbital light curves, and by fitting the light curves with a sinusoidal function, clear phase shifts are obtained. The superorbital modulation seen in the binary has been long known and different scenarios have been proposed. Based on our results, we suggest that the circumstellar disk around the Be companion of this binary may have a non-axisymmetric structure, which rotates at the superorbital period of 1667 days. As a result, the density of the ambient material around the compact star of the binary changes along the binary orbit over the superorbital period, causing the phase shifts in the modulation, and around periastron, the compact star probably enters the Be disk or switches the mode of its emission due to the intereaction with the disk, causing the appearance of the dip. We discuss the implications of this possible scenario to the observed superorbital properties at multiple frequencies.
Subject headings:
gamma rays:stars — X-rays:binaries — stars:individual (LS I 61°303)1. Introduction
Galactic X-ray binaries consist of a neutron star or a black hole as the primary and a companion star. They are luminous X-ray sources in the sky powered by accretion with mass tranferred from the companion to the primary. In addition to the often-seen periodic signals related to their binary orbits, long-term, so-called superorbital periodic signals are also seen in a few of them. The origin of the superorbital flux variations is not clearly determined, but is thought to be due to the procession or warping of the accretion disk around a compact star (see Kotze & Charles 2012 for a brief review and references therein). Other proposed possible origins include X-ray state changes, the existence of precessing jets, or the existence of a tertiary star around a binary.
Having a Be star as the companion, LS I 61°303 is one of a handful high-mass X-ray binaries (HMXBs) that are -ray loud (see, e.g., Dubus 2013). Such -ray binaries are of great interests and have been under extensive studies, as complicated physical proecesses occur in them and produce remarkable phenomena at multiple wavelengths. The orbit of LS I 61°303 is elliptical with a period of 26.496 days (Gregory, 2002) and an eccetricity of (Aragona et al., 2009). Orbital flux or emission line variations have been detected at all wavelengths, from radio (e.g., Paredes et al. 1990; Marcote et al. 2016), optical (e.g., Grundstrom et al. 2007; Zamanov et al. 2014), X-ray (e.g., Paredes et al. 1997), to -ray GeV and TeV (e.g., Abdo et al. 2009; Albert et al. 2009). Very interestingly, a long-term 16678 days periodic signal (Gregory, 2002) is also seen at nearly all the wavelengths (radio: Gregory 2002; Massi & Torricelli-Ciamponi 2016; optical: Zamanov & Martí 2000; X-ray: Chernyakova et al. 2012; Saha et al. 2016; GeV: Ackermann et al. 2013; TeV: Ahnen et al. 2016). Note that Massi & Torricelli-Ciamponi (2016) recently have determined a value of 1628 days for the long-term period.
How the superorbital varations are produced in LS I 61°303 is under debate. It has been thought that the variations are related to the cyclical changes in the mass loss of the Be companion or the density/size of the circumstellar disk around the companion (Zamanov et al., 1999). The interaction of the compact star (which is most likely a neutron star in this case; e.g., Papitto et al. 2012; Torres et al. 2012) with the disk is modulated, giving rise to the variations. Recently, arguing that the superorbital modulation is stable in the long-term radio data, Massi & Torricelli-Ciamponi (2014) have proposed a jet model, in which the jets from an accreting black hole precess at a period slightly longer than , days and the beat frequency corresponds to the superorbital signal.
In order to fully investigate the superorbital variations at -ray GeV energies and help understand the origin, we conducted detailed analysis of the data obtained with the Large Area Telescope (LAT) onboard the Fermi Gamma-Ray Space Telescope (Fermi) using the latest Pass 8 database. Previously Ackermann et al. (2013) have found sinusoidal variations, prominently seen during apastron orbital phases, at the superorbital period of 1667 days from the LAT data. Saha et al. (2016) recently have also obtained similar variations from their analysis of nearly 7-years LAT Pass 8 data. In addition to these results, our analysis indicates a significant dip around periastron and a clear phase-shift trend in the orbital-phase-resolved superorbital modulations. To explain the features, we suggest that the circumstellar disk around the companion would be eccentric and precess at the superorbital period. Here we report the results.
2. Data Analysis and Results
2.1. Fermi LAT Data
LAT, onboard Fermi, is a -ray imaging instrument that scans the whole sky every three hours and can continuously observe thousands of GeV sources in the sky (Atwood et al., 2009). In this analysis, we selected 0.1–300 GeV LAT events from the Fermi Pass 8 database inside a region, which is centered at the position of LS I 61°303 given in the Fermi LAT third source catalog (Acero et al., 2015). The time period of the LAT data is 8 years from 2008-08-04 15:43:36 (UTC) to 2016-08-18 00:48:16 (UTC). Following the recommendations of the LAT team111http://fermi.gsfc.nasa.gov/ssc/data/analysis/scitools/, we included events with zenith angles less than 90 degrees (preventing the Earth’s limb contamination) and excluded the events with quality flags of ‘bad’.
2.2. Source’s -ray Properties and Orbital Variability
We first repeated the likelihood analysis and spectral analysis to the whole selected data, and confirmed the previously reported results obtained for this source (Abdo et al., 2009; Saha et al., 2016). In addition, we also repeated orbital variability analysis by folding the source’s photons at the orbital period and obtaining the spectra during the periastron and apastron phase ranges.
2.2.1 Likelihood analysis
We included all sources within 20 degrees centered at the position of LS I 61°303 in the Fermi LAT 4-year catalog (Acero et al., 2015) to make the source model. The spectral forms of these sources are provided in the catalog. The spectral parameters of the sources within 5 degrees from LS I 61°303 were set as free parameters, and the other parameters were fixed at their catalog values. LS I 61°303 was included in the source model as a point source with emission modelled with an exponentially cutoff power law, , where and Ec are the photon index and cutoff energy, respectively. In addition, the background Galactic and extragalactic diffuse emission was included, with the spectral model gll_iem_v06.fits and the file iso_P8R2_SOURCE_V6_v06.txt, respectively, used in the source model. The normalizations of the diffuse components were set as free parameters.
Using the LAT science tools software package v10r0p5, we performed standard binned likelihood analysis to the LAT data in the 0.1–300 GeV band. The Instrument Response Functions (IRFs) of P8R2_SOURCE_V6 were used. The -ray emission of LS I 61°303 during the total data set () was detected to have a Test Statistic (TS) value of 136681, and 0.009 and 0.2 GeV were obtained. For comparison, we also repeated the likelihood analysis with emission from LS I 61°303 modelled with a simple power law , and obtained 0.004 with a TS value of 140997. We estimated the significance of the spectral cutoff from , where and are the maximum likelihood values for the power law model with and without the cutoff respectively (Abdo et al., 2013). The spectral cutoff was detected at a significance of 38. The parameters of the exponentially cutoff power-law fit are listed in Table 1.
2.2.2 Spectral analysis
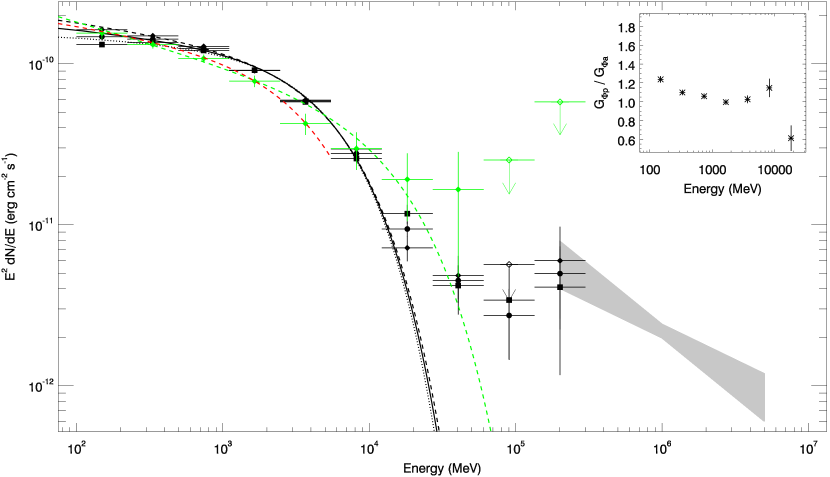
We extracted the -ray spectrum of LS I 61°303 by performing maximum likelihood analysis of the LAT data in 10 evenly divided energy bands in logarithm from 0.1–300 GeV. In the extraction, the spectral normalizations of the sources within 5 degrees from LS I 61°303 were set as free parameters, while all the other parameters of the sources were fixed at the values obtained from the above maximum likelihood analysis. We kept only spectral data points when TS greater than 9 (3 significance) and derived 95% flux upper limits otherwise. The obtained spectrum is shown in Figure 1, with the flux values of the spectral data points provided in Table 2.
2.2.3 Orbital variability analysis
We performed timing analysis to the 0.1–300 GeV LAT data of LS I 61°303 to study the orbital variations of the source. We selected -ray photons within an aperture radius of 2 degrees from LS I 61°303, as most of the sources in the source model are located 2 degrees away from LS I 61°303, and weighted them by their probabilities of originating from the binary (calculated with gtsrcprob in the science tools software package) using the fitted source model obtained in Section 2.2.1. Orbital phases for the photons were assigned using the ephemeris given in Aragona et al. (2009). We folded the weighted photons into 16 orbital phase bins, and plotted them over the exposures (calculated with gtexposure) in each of the bins in Figure 2. The folded light curve has modulation peak approximately at the periastron ( of 0.275), consistent with that in the previous studies (Abdo et al. 2009; Hadasch et al. 2012).
We further defined the orbital phase ranges of 0.0–0.5 around periastron and 0.5–1.0 around apastron as and , respectively, and performed likelihood analysis and spectral analysis to the LAT data during these two phase ranges. The likelihood results are given in Table 1. The spectra are plotted in Figure 1, with the spectral flux values listed in Table 2. The value during is 6 higher than that during (see Table 1), indicating a softer -ray emission during the former than the latter. The value during the two phase ranges are consistent within uncertainties. In order to show the detailed differences between the emission from the two phase ranges, we compared their ratios of the energy fluxes (the inner panel of Figure 1, where only the ratios in the energy ranges of 27.2 GeV are shown as the flux uncertainties in the energy ranges of 27.2–60.5 and 134.7–300 GeV are too large to be reliable). As can be seen, the -ray emission during the former is higher than that during the latter in the low energy ranges, and the ratio decreases to in the middle energies, and in the high energy range of 12.2–27.2 GeV the -ray emission during the former is lower than that during the latter. This comparison helps indicate the spectral changes between the two phase ranges found from the likelihood analysis.

2.3. Superorbital Variability Analysis
2.3.1 Orbitally-resolved superorbital variability
From previous work (Ackermann et al., 2013; Saha et al., 2016), it has been shown that the shape of superorbital modulation depends on orbital phase. We therefore performed the same superorbital analysis. According to the ephemeris given in Gregory (2002), we selected LAT photons in 10 superorbital phase bins and performed likelihood analysis to the data in each of the bins. The photons in 10 orbital phase ranges (0.0–0.1, …, 0.9–1.0) were separatedly considered. We note that the superorbital period in Gregory (2002) is consistent with that found by Massi & Torricelli-Ciamponi (2016) within the uncertainties. In addition the period difference is only 0.025 in phase (which is small compared to the 10 superorbital phase bins). We tested by using the latter period in analysis and found that the difference did not affect our results obtained in the following analysis.
The 10 light curves are shown in Figure 3. As can be seen, the superorbital modulations were significant during the five orbital phase ranges near apastron: the -test values are 128–332 for 9 degrees of freedom (dof; a value of 22 corresponds to a 99% confidence level for variations). During the other five orbital ranges near periastron, the modulations are relatively weak (the -test values are 42–120 for 9 dof), but with a significant dip appearing at superorbital phase = 0.65 in the orbtial ranges of 0.1–0.4. Note that this dip occurs near the superorbital phase where the modulation peaks are located at (see the light curves in the orbital phase ranges of 0.1–0.4). Excluding the dip point, we checked the -test values again for the three light curves, 21–84 for 8 dof (a value of 20 corresponds to the 99% confidence level), indicating that the superorbital modulations were still significant.
Most of the light curves appear to have a sinusoidal-like shape, and thus following the previous work in Ackermann et al. (2013) and Saha et al. (2016), we fit them with a sinusoidal function sin, where is the superorbital peak phase, and and are the modulation amplitude and constant flux (in units of photon cm-2 s-1), respectively. For the three light curves near periastron that have the dip, the dip data point was not included in the fitting. The resulting reduced values were in a range of 1.5–10.4, suggesting that either most of the light curves are not exactly sinusoidal or the uncertainties on the data points were under-estimated. In any case, we added an artificial value in quadrature with the uncertainties to lower the reduced values to 1. The obtained best fits are plotted as dotted lines in Figure 3, and the fit results are given in Table 3. We also evaluated the significance of the dip by comparing the observed and best-fit model fluxes at 0.65, which are also listed in Table 3. The dip was indeed significant during the orbital phase ranges of 0.1–0.4 (3–5). During the other seven orbital phase ranges, the dip was not significantly detected.
As pointed above, the superorbital modulation amplitudes near apastron are obviously larger than those near periastron. We show the best-fit parameters of the sinusoidal functions in Figure 4, and the results confirm it quantatively: the relative amplitudes () are approximately between 10%–30% during -0.5 and 40%–100% during –1.0. On the other hand, the constant fluxes near periastron are approximately 40% higher than those near apastron. In addition, a striking feature is that the superorbital modulation peak shifts with orbital phase, from at to at (see the bottom panel of Figure 4). This feature was noted by Ackermann et al. (2013) and Saha et al. (2016), but our analysis for the first time shows that there is a consistent pattern for the shifts over the whole superorbital/orbital phase.

2.3.2 Properties of the dip
We investigated the dip’s properties by first determining the orbital phase range in which the dip is the most significant. We searched through different range values by repeating the above sinusoidal fitting process, and found that in the 0.3 orbital phase range centered at =0.285, the dip was detected at the highest significance of 7 (after adding an artificial value to the uncertainties to have a reduced ). We also checked its dependence on energy. Analyzing light curves in different energy ranges, we found that the dip exists only significantly in the energy range of 5.5 GeV. The superorbital light curves in the energy ranges of below and above 5.5 GeV are shown in the left panels of Figure 5. In the 5.5 GeV energy range, the light curve was nearly a constant, as the test value was only 12.0 (for 9 dof). As a comparison, the 0.3 phase range light curves around the apastron were shown in the right panels of the figure. For the 5.5 GeV one, modulation is still visible, with a test value of 21.5 (for 9 dof; at a 98.9% confidence level).

We also performed analysis to the data during the dip determined above (i.e., –0.435 and –0.7), in order to check if there are any physical differences between the dip and the other phase ranges. The likelihood results are given in Table 1, and the obtained spectrum is shown in Figure 1, with the spectral flux values listed in Table 2. The photon index, , is significantly higher than those obtained from the total data or periastron/apastron orbital phase ranges and the cutoff energy, GeV, is also higher but with the very large uncertainty. Examining the dip spectrum in Figure 1, the spectral data points may not be well described by the exponentially cutoff power-law fit, as the fit has a higher tail (resulting the high cutoff energy of 16 GeV). Since the dip is only significant in the 5.5 GeV data, we tested to limit the likelihood analysis to the 0.1–5.5 GeV data and found that the fit results, and GeV (see also Table 1) are then consistent. Therefore there is no clear evidence for having a different spectrum during the dip.

3. Discussion
At Fermi LAT energies, -ray emission from LS I 61°303 obviously have two components, one described by a power law with an exponential cutoff at GeV and one slightly rising from GeV to 200 GeV. The former and the latter can be connected to the emission at MeV/KeV and TeV energies respectively (e.g., Zdziarski et al. 2010). No matter whether the primary is a pulsar or a black hole with jets, the former is likely due to synchrotron radiation and the latter due to the inverse Compton (IC) scattering (e.g., Zdziarski et al. 2010; Saha et al. 2016). This spectral feature is similar to that in the high-mass pulsar binary PSR B125963/LS 2883 (e.g., Xing et al. 2016), the only -ray binary with a known primary for a long time, although the synchrotron tail of the latter source approximately ends at GeV. (We note that in either pulsar or black hole accretion models such as those in Zdziarski et al. 2010 or Jaron et al. 2016, respectively, GeV emission can come from the IC scattering processes, but then the TeV component remains to be explained.)
Based on the above general scenario for emission from LS I 61°303, our analysis has shown that in addition to be orbitally modulated, the synchrotron component is also superorbitally modulated, particularly by showing a dip that is significantly seen at GeV energy range around periastron (cf., Figure 5). Although the modulations at different orbital phases may not be well described by a simple sinusoid used in our analysis, the general properties we have obtained should not be affected. Near periastron, the average flux is high and the modulation amplitude is low, and near apastron, we see the opposite (Figure 4). The sinusoidal-like modulation feature has been pointed out by the previous studies (Ackermann et al., 2013; Saha et al., 2016), but our analysis not only has confirmed its existence over the whole orbital phase ranges, but also been able to, by detecting a dip near the periastron phases, better determine the modulation properties.
Previously the superorbital modulation is often discussed as the result of a cyclical change in the density/size of the circumstellar disk of the masssive companion (e.g., Ackermann et al. 2013; Saha et al. 2016), as such changes have been relatively well observed in Be star systems (e.g., Rivinius et al. 2013), including Be/X-ray binaries (e.g., Negueruela et al. 2001). For the Be disk in LS I 61°303, changes in the radius of the disk at the superorbital period has been clearly seen in long-term optical spectroscopy (Zamanov & Martí, 2000; Zamanov et al., 2013). However in order to explain the clear trend of the phase shifts we have obtained (cf., Figure 4), a non-axisymmetric structure is needed (axisymmetric changes cannot produce the phase shifts, which are a function of orbital phase). This structure would rotate at the long period of 1667 days, inducing the observed phase shifts. A well-studied case for comparison is the superhump modulation observed in white dwarf binaries and low-mass X-ray binaries (e.g., Patterson et al. 2005; Haswell et al. 2001), which are caused by the precession of an elliptical or warped accretion disk around the compact star (see, e.g., Whitehurst & King 1991; Haswell et al. 2001).
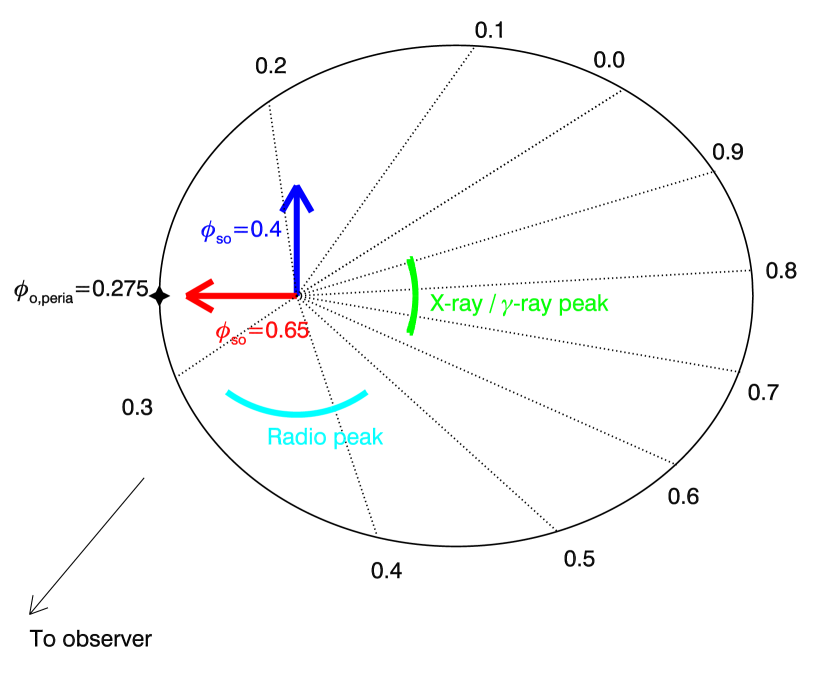
Here we suggest a similar scenario for LS I 61°303. Since around periastron, the source’s overall flux is high, particularly in 1 GeV low-energy range (Figure 1), it is reasonable to assume that the synchrotron component is somehow related to the high density condition to the compact star. If the Be disk is not axisymmetric in its structure, for exmaple having an elliptical shape or a mode with density enhanced along one direction, the preccession of such a disk would result in the density variations along the binary orbit. Assuming that the highest density, which reflects the precession, leads to the -ray emission peak (see the schemetic diagram shown in Figure 6), we obtain the dotted curve in the bottom panel of Figure 4. The curve can be seen approximately explains the phase shifts. According to observations and related numerical simulations, non-axisymmetric structures in Be disks in binary systems do exist (e.g., Rivinius et al. 2013; Panoglou et al. 2016). Specifically in Be/X-ray binaries, due to the tidal force of a neutron star, spiral density waves and an eccentric mode (in eccentric binaries) in a Be disk can be developed (Okazaki et al., 2002). In addition, in the numerical simulation designed for LS I 61°303, long spiral density waves are seen due to the interaction between the compact star and the disk, as when the compact star passes periastron, it tidally deforms the disk (Romero et al., 2007). Therefore it is possible that in addition to the long-term periodic changes in radius, the disk might have an elliptical shape or an eccentric denser part due to the tidal force of the compact star and its precession would give rise to the phase shift phenomenon. This possibility can be investigated by numerical simulations designed to check if a non-axisymmetric pattern in the Be disk of LS I 61°303 can be kept for a sufficiently long term (see Okazaki et al. 2002 for their detection of a steady eccentric mode).
In this scenario, we have set at periastron (Figure 6), the reason for which is to explain the dip we have detected at –0.7. In an eccentric binary like LS I 61°303, the strong tidal interaction between the compact star and the Be disk would truncate the disk to a size smaller than the periastron distance if the viscosity parameter (Negueruela & Okazaki, 2001; Okazaki et al., 2002). As a result, the Be disk would be denser, which has likely been observed in PSR B125963/LS 2883 when the pulsar passed through periastron (Chernyakova et al., 2014). However, Zamanov et al. (2016) have recently concluded that the compact star in LS I 61°303 passes through the outer part of the disk at periastron (from their optical spectrosopic study of the binary). Therefore when the more extended or denser part of the Be disk rotates over the periastron region, it is not unreasonable to suggest that the disk possibly extends over the periastron substantially, causing the compact star or the emission region to be totally inside the disk. The synchrotron emission is thus significantly reduced (due to blocking/scattering), forming the dip. However, no other available observational results appear to support this dip forming possibility. At X-rays, the very recent analysis of all the archival X-ray imaging data has shown significant variations of values, but the lack of observations during –0.7 around periastron does not allow an assessment to be made. In addition, we note that in the case of PSR B125963/LS 2883, when the pulsar entered the Be disk region, no significant enhancement was observed (Chernyakova et al., 2014). Whether we would see significantly increased is not clear. In any case, X-ray observations of LS I 61°303 at particular phase ranges (i.e., –0.7 and ) are of interest, for the purpose of fully studying this binary.
The other possibility of forming a dip may be based on the scenario of the compact star being a radio pulsar, which has long been proposed for LS I 61°303 (e.g., Maraschi & Treves 1981; Dubus 2006). In this case, the dip would indicate the quench of the rotation-powered activity or the state changes (see Torres et al. 2012). During , larger amount of matter from the Be disk may be captured by the pulsar and form an accretion disk. There will be an relative angular momentum of the captured matter with respect to the pulsar. The circularization radius of the captured matter may be estimated as (Frank et al., 2002; Takata et al., 2017)
where is the neutron star mass, is the relative angular velocity, and is the relative velocity of the pulsar with respect to the disk matter. In addition, is the capture radius measured from the pulsar. If we apply the standard Shakura-Sunyaev disk model, the disk matter will develop with a dynamical time scale of , where is the viscous parameter in units of 0.1, suggesting the accreting matter will take several weeks to reach the pulsar after the capture event. It is also noted that the accreting matter will still exist even after the pulsar exits from the Be disk. Since the orbit period is close to the dynamical time scale of the accreting matter, the matter could remain entire orbit once the accretion disk forms around the pulsar. In Figure 3, one notable feature is that the minumum flux of the superorbital modulation during –0.9 is also at , which could be explained by the switching-off of the rotation-powered activity (or the state changes; Torres et al. 2012) due to the formation of the accretion disk around the pulsar.
Once is tied to periastron, the fast/slow phase shifts around periastron/apastron are naturally explained. For example, examining the superorbital light curves in Figure 3, we may conclude that there are no significant phase shifts in orbital phases of 0.5–1.0. This may be because of the relatively large distance between the disk and the compact star around apastron; as a result, the modulation is not sensitive to the precession of the disk. The overall superorbital modulation at different wavelengths can also be re-examined (see Figure 6). The so-called radio outburst actually starts from and reaches the peak during –1.0 (Gregory, 2002; Torres et al., 2012), and detailed modelling of 8.3 GHz data suggests a launch of a density enhancement or shell in the Be disk occurring around (Gregory & Neish, 2002). The coincidence could be because after a stronger interaction between the compact star and the Be disk at , stronger outflows are driven from the system and radio emission is largely enhanced. Both the X-ray and GeV -ray peaks are at –0.2 (Li et al., 2012; Ackermann et al., 2013), while the TeV -ray peak is rather uncertain, with a large range of –0.6 (Ahnen et al., 2016). According to the scenario we propose here, the X-ray and GeV -ray peaks are when the non-axisymmetric Be disk points towards the apastron direction (cf., Figure 6), which may thus favor the pulsar scenario for LS I 61°303. In Figure 3, we can see that the overall -ray peak during –0.2 (see Figure 2 in Ackermann et al. 2013) is because of the contribution from the emission peaks around apastron (–0.9). This feature implies that the ambient density around the compact star should not be a dominant factor deciding the emission intensity anymore; otherwise we would expect the emission peaks always around periastron. Some other factor, such as the rotational power of a working radio pulsar (probably in form of a pulsar wind such as in the case of PSR B125963/LS 2883), would play a more important role in producing X-ray and -ray emission. Due to the limited TeV data, it is not clear how TeV emission is related to the scenario proposed here, but its superorbital modulation has been suggested to be related to the changes between the states of a propeller and a pulsar (Torres et al., 2012; Ahnen et al., 2016).
References
- Abdo et al. (2009) Abdo, A. A., Ackermann, M., Ajello, M., et al. 2009, ApJ, 701, L123
- Abdo et al. (2013) Abdo, A. A., Ajello, M., Allafort, A., et al. 2013, ApJS, 208, 17
- Acero et al. (2015) Acero, F., Ackermann, M., Ajello, M., et al. 2015, ApJS, 218, 23
- Ackermann et al. (2013) Ackermann, M., Ajello, M., Allafort, A., et al. 2013, ApJS, 209, 34
- Ahnen et al. (2016) Ahnen, M. L., Ansoldi, S., Antonelli, L. A., et al. 2016, A&A, 591, A76
- Albert et al. (2009) Albert, J., Aliu, E., Anderhub, H., et al. 2009, ApJ, 693, 303
- Aliu et al. (2013) Aliu, E., Archambault, S., Behera, B., et al. 2013, ApJ, 779, 88
- Aragona et al. (2009) Aragona, C., McSwain, M. V., Grundstrom, E. D., et al. 2009, ApJ, 698, 514
- Atwood et al. (2009) Atwood, W. B., Abdo, A. A., Ackermann, M., et al. 2009, ApJ, 697, 1071
- Chernyakova et al. (2012) Chernyakova, M., Neronov, A., Molkov, S., et al. 2012, ApJ, 747, L29
- Chernyakova et al. (2014) Chernyakova, M., Abdo, A. A., Neronov, A., et al. 2014, MNRAS, 439, 432
- Dubus (2006) Dubus, G. 2006, A&A, 456, 801
- Dubus (2013) —. 2013, A&A Rev., 21, 64
- Frank et al. (2002) Frank, J., King, A., & Raine, D. J. 2002, Accretion Power in Astrophysics: Third Edition, 398
- Gregory (2002) Gregory, P. C. 2002, ApJ, 575, 427
- Gregory & Neish (2002) Gregory, P. C., & Neish, C. 2002, ApJ, 580, 1133
- Grundstrom et al. (2007) Grundstrom, E. D., Caballero-Nieves, S. M., Gies, D. R., et al. 2007, ApJ, 656, 437
- Hadasch et al. (2012) Hadasch, D., Torres, D. F., Tanaka, T., et al. 2012, ApJ, 749, 54
- Haswell et al. (2001) Haswell, C. A., King, A. R., Murray, J. R., & Charles, P. A. 2001, MNRAS, 321, 475
- Jaron et al. (2016) Jaron, F., Torricelli-Ciamponi, G., & Massi, M. 2016, A&A, 595, A92
- Kotze & Charles (2012) Kotze, M. M., & Charles, P. A. 2012, MNRAS, 420, 1575
- Li et al. (2012) Li, J., Torres, D. F., Zhang, S., et al. 2012, ApJ, 744, L13
- Maraschi & Treves (1981) Maraschi, L., & Treves, A. 1981, MNRAS, 194, 1P
- Marcote et al. (2016) Marcote, B., Ribó, M., Paredes, J. M., et al. 2016, MNRAS, 456, 1791
- Massi & Torricelli-Ciamponi (2014) Massi, M., & Torricelli-Ciamponi, G. 2014, A&A, 564, A23
- Massi & Torricelli-Ciamponi (2016) —. 2016, A&A, 585, A123
- Negueruela & Okazaki (2001) Negueruela, I., & Okazaki, A. T. 2001, A&A, 369, 108
- Negueruela et al. (2001) Negueruela, I., Okazaki, A. T., Fabregat, J., et al. 2001, A&A, 369, 117
- Okazaki et al. (2002) Okazaki, A. T., Bate, M. R., Ogilvie, G. I., & Pringle, J. E. 2002, MNRAS, 337, 967
- Panoglou et al. (2016) Panoglou, D., Carciofi, A. C., Vieira, R. G., et al. 2016, MNRAS, 461, 2616
- Papitto et al. (2012) Papitto, A., Torres, D. F., & Rea, N. 2012, ApJ, 756, 188
- Paredes et al. (1990) Paredes, J. M., Estalella, R., & Rius, A. 1990, A&A, 232, 377
- Paredes et al. (1997) Paredes, J. M., Marti, J., Peracaula, M., & Ribo, M. 1997, A&A, 320, L25
- Patterson et al. (2005) Patterson, J., Kemp, J., Harvey, D. A., et al. 2005, PASP, 117, 1204
- Rivinius et al. (2013) Rivinius, T., Carciofi, A. C., & Martayan, C. 2013, A&A Rev., 21, 69
- Romero et al. (2007) Romero, G. E., Okazaki, A. T., Orellana, M., & Owocki, S. P. 2007, A&A, 474, 15
- Saha et al. (2016) Saha, L., Chitnis, V. R., Shukla, A., Rao, A. R., & Acharya, B. S. 2016, ApJ, 823, 134
- Takata et al. (2017) Takata, J., Tam, P. H. T., Ng, C. W., et al. 2017, ApJ, 836, 241
- Torres et al. (2012) Torres, D. F., Rea, N., Esposito, P., et al. 2012, ApJ, 744, 106
- Whitehurst & King (1991) Whitehurst, R., & King, A. 1991, MNRAS, 249, 25
- Xing et al. (2016) Xing, Y., Wang, Z., & Takata, J. 2016, ApJ, 828, 61
- Zamanov & Martí (2000) Zamanov, R., & Martí, J. 2000, A&A, 358, L55
- Zamanov et al. (2014) Zamanov, R., Martí, J., Stoyanov, K., Borissova, A., & Tomov, N. A. 2014, A&A, 561, L2
- Zamanov et al. (2013) Zamanov, R., Stoyanov, K., Martí, J., et al. 2013, A&A, 559, A87
- Zamanov et al. (1999) Zamanov, R. K., Martí, J., Paredes, J. M., et al. 1999, A&A, 351, 543
- Zamanov et al. (2016) Zamanov, R. K., Stoyanov, K. A., Martí, J., et al. 2016, A&A, 593, A97
- Zdziarski et al. (2010) Zdziarski, A. A., Neronov, A., & Chernyakova, M. 2010, MNRAS, 403, 1873
| Data set | 0.1 GeV Flux | Ec | TS | |
|---|---|---|---|---|
| (10-7 photon cm-2 s-1) | (GeV) | |||
| Total data () | 8.790.07 | 2.0860.009 | 5.50.2 | 136681 |
| Periastron () | 9.50.1 | 2.130.01 | 5.90.3 | 73272 |
| Dip () | 8.80.3 | 2.270.02 | 164 | 3190 |
| Dip (, 5.5 GeV) | 8.70.3 | 2.150.03 | 4.20.5 | 3080 |
| Apastron () | 8.130.09 | 2.040.01 | 5.10.3 | 63691 |
| Total data () | Periastron () | Dip () | Apastron () | |
|---|---|---|---|---|
| 0.1–0.2 | 14.70.2 | 16.30.2 | 151 | 13.20.3 |
| 0.2–0.5 | 14.20.1 | 14.90.2 | 13.20.8 | 13.60.2 |
| 0.5–1.1 | 12.40.1 | 12.80.2 | 10.80.6 | 12.10.1 |
| 1.1–2.5 | 9.10.1 | 9.10.2 | 7.80.6 | 9.10.2 |
| 2.5–5.5 | 5.90.1 | 5.90.2 | 4.30.6 | 5.80.2 |
| 5.5–12.2 | 2.80.1 | 3.00.2 | 3.00.8 | 2.60.2 |
| 12.2–27.2 | 0.90.1 | 0.70.1 | 1.90.9 | 1.20.2 |
| 27.2–60.5 | 0.50.1 | 0.50.2 | 21 | 0.40.1 |
| 60.5–134.7 | 0.30.1 | 0.6 | 2.5 | 0.30.2 |
| 134.7–300 | 0.50.2 | 0.60.4 | 5.8 | 0.40.3 |
Fluxes are calculated from and in units of 10-11 erg cm-2 s-1, while those values without uncertainties are the 95 upper limits.
| Orbital phase | / | / | Significance | |
|---|---|---|---|---|
| (photon cm-2 s-1) | (photon cm-2 s-1) | of the dip () | ||
| 0.0–0.1 | 1.80.5 | 8.00.3 | 0.430.06 | 0.7 |
| 0.1–0.2 | 2.10.8 | 8.50.5 | 0.470.07 | 3.2 |
| 0.2–0.3 | 2.90.6 | 9.10.3 | 0.560.03 | 5.0 |
| 0.3–0.4 | 1.30.5 | 9.20.3 | 0.710.05 | 4.0 |
| 0.4–0.5 | 1.40.7 | 7.90.5 | 1.000.08 | 2.2 |
| 0.5–0.6 | 4.10.9 | 6.50.6 | 0.140.04 | 0.9 |
| 0.6–0.7 | 2.70.9 | 6.70.5 | 0.120.05 | 1.0 |
| 0.7–0.8 | 3.20.8 | 6.50.5 | 0.110.04 | 1.3 |
| 0.8–0.9 | 5.20.9 | 5.00.6 | 0.170.03 | 0.3 |
| 0.9–0.0 | 3.30.5 | 6.30.3 | 0.260.02 | 1.2 |