Marrying excitons and plasmons in monolayer transition-metal dichalcogenides
Abstract
Just as photons are the quanta of light, plasmons are the quanta of orchestrated charge-density oscillations in conducting media. Plasmon phenomena in normal metals, superconductors and doped semiconductors are often driven by long-wavelength Coulomb interactions. However, in crystals whose Fermi surface is comprised of disconnected pockets in the Brillouin zone, collective electron excitations can also attain a shortwave component when electrons transition between these pockets. In this work, we show that the band structure of monolayer transition-metal dichalcogenides gives rise to an intriguing mechanism through which shortwave plasmons are paired up with excitons. The coupling elucidates the origin for the optical side band that is observed repeatedly in monolayers of WSe2 and WS2 but not understood. The theory makes it clear why exciton-plasmon coupling has the right conditions to manifest itself distinctly only in the optical spectra of electron-doped tungsten-based monolayers.
I Introduction and motivation
Transition-metal dichalcogenides become direct band-gap semiconductors when thinned to a single atomic monolayer Mak_PRL10 ; Splendiani_NanoLett10 . Stacking such two-dimensional crystals via van der Waals forces alleviates the need to fabricate logic and optoelectronic devices with lattice-matched crystals Wang_NatNano12 ; Geim_Nature13 ; Mak_NatPhoton16 . Furthermore, the lack of space inversion symmetry in these monolayers lifts the spin degeneracy at the edges of the conduction and valence bands Xiao_PRL12 ; Song_PRL13 . As a result, time reversal partners the spin and valley degrees of freedom such that spin-up charge carriers populate valleys (low-energy pockets) on one side of the Brillouin zone, while spin-down ones populate valleys on the opposite side Xiao_PRL12 . The intense recent research on the spin-valley partnership has led to understanding of optical selection rules and transport phenomena in monolayers transition-metal dichalcogenides (ML-TMDs) Mak_Science14 ; Xu_NatPhys14 .
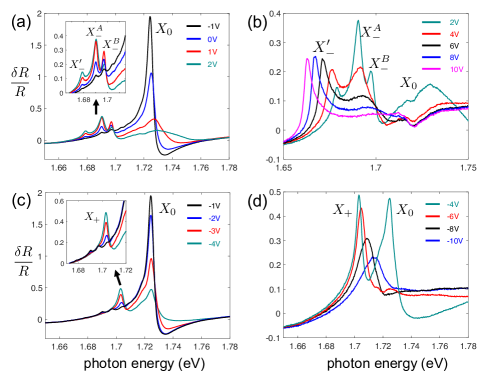
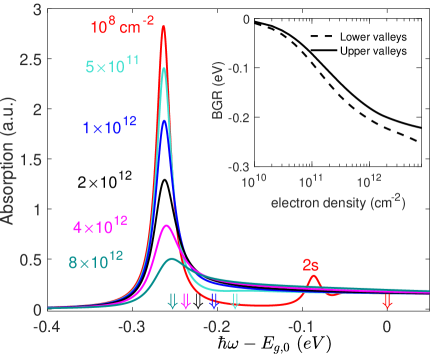
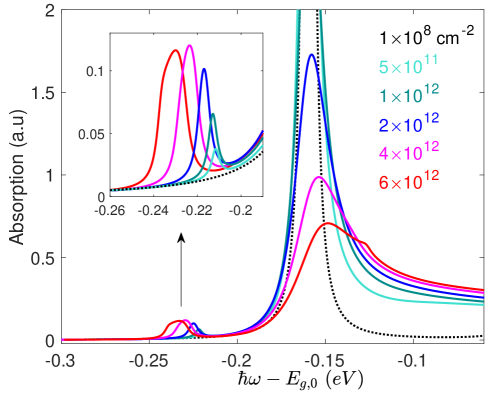
In this work, we focus on a unique optical side band that emerges in electron-doped ML-WSe2 and ML-WS2 Jones_NatNano13 ; Xu_NatPhys14 ; Shang_ACSNano15 ; Plechinger_PSS15 ; Plechinger_NanoLett16 ; Plechinger_NatCom16 ; Wang_NanoLett17 ; Wang_NatNano17 ; Koperski_nanoph17 . Understanding its microscopic origin is an outstanding open question ever since its first observation in the photoluminescence (PL) measurements of ML-WSe2 by Jones et al. Jones_NatNano13 . It was also observed in the PL of electron-doped ML-WS2, and was originally attributed to biexcitons or defects Shang_ACSNano15 ; Plechinger_PSS15 . To explain the behavior of this optical side band, we use the empirical data of differential reflectance spectroscopy of ML-WSe2 at 4 K, as shown in Fig. 1 where this band is indicated by . The monolayer was embedded between thin layers of hexagonal boron-nitride in a dual-gated structure Wang_NanoLett17 . The bias voltage was the same in the top and bottom gate electrodes, so that only the charge density in the monolayer is controlled while no out-of-plane electrical field is introduced. The relation between gate voltage and charge density is such that 1 V corresponds to 1012 cm-2 Wang_NanoLett17 .
Figure 1(a) shows the spectrum for low and intermediate electron densities. The neutral-exciton spectral line, denoted by , dominates the spectrum and its intensity decays with increasing the electron density. Also noticeable are three smaller spectral lines in the low-energy side of the spectrum (as highlighted in the enlarged box). These features cannot be completely quenched due to disordered regions that prevent complete charge depletion across the entire sample Efros_SSC89 . The spectral lines that are denoted by and were recently attributed to two types of negatively charged excitons in tungsten-based monolayers Jones_NatPhys16 ; Plechinger_NatCom16 ; Courtade_arXiv17 . The lowest-energy spectral line, denoted by , is the optical side band. In addition to the fact that and are clearly resolved from that of even at low densities, as highlighted in the enlarged box of Fig. 1(a), their behavior is strikingly different, rendering their identification relatively easy. For example, has the known properties of trions in semiconductor quantum wells Bar-Joseph_SST05 ; Suris_PSSB01 ; Ramon_PRB03 ; Kossacki_JPCM03 ; Portella-Oberli_PRB04 ; Keller_PRB05 : It is amplified without enhanced broadening when the electron population increases in the low-density regime. That is, in the regime that the Fermi energy is measurably smaller than the binding energy of the charged exciton (energy difference between and , which is about 30-35 meV). Figures 1(b) shows that starts to blueshift, decay and broaden at intermediate and elevated densities, in which the Fermi energy is no longer negligible compared with the charged-exciton binding energy. In this density regime, the trion cannot avoid many-body interactions with the Fermi sea. The optical side band, on the other hand, shares none of these features. Figure 1(b) shows that when the electron density continues to increase, redshifts and possibly drains part of the oscillator strength of the decaying charged exciton spectral lines. Its spectral line shows no evident broadening, and its saturated intensity at elevated densities hardly decays (whereas the other spectral lines strongly decay, blueshift and broaden).
Figures 1(c) and (d) show the absorption spectrum in hole-doped conditions. It includes the neutral and charged-exciton spectral lines ( and ), where the latter behaves similarly to in terms of its decay, blueshift and broadening at elevated densities. There is no optical side band. The reflectivity spectra of ML-MoSe2 is similar (not shown) Wang_NanoLett17 . It only includes two spectral lines, both in the electron and hole doping regimes, which behave similarly to and in Figs. 1(c) and (d). They share no common properties with the optical side band of tungsten-based MLs. It is emphasized that in this work we neither model nor focus on the microscopic origin of the charged exciton. Sidler et al. recently suggested that it originates from Fermi polarons wherein the exciton is attracted to the surrounding Fermi sea via weak van der Waals forces Sidler_NatPhys17 . Jadczak et al., on the other hand, attributed the charged exciton to trions, and further elucidated its strong coupling to phonons due to the resonance between the trion binding energy and that of the homopolar phonon mode Jadczak_PRB17 .
The observed behavior of the optical side band in tungsten-based compounds is largely identical in reflectance and PL experiments, including the unique feature that the band redshifts in both cases Jones_NatNano13 ; Shang_ACSNano15 ; Wang_NanoLett17 . One noticeable difference, however, is the relative amplitude of the signal. Specifically, reflectance measurements show that the largest oscillator strength is that of the neutral exciton at low densities Chernikov_PRL15 ; Cadiz_PRX17 ; Courtade_arXiv17 ; Wang_NatNano17 ; Wang_NanoLett17 . The oscillator strength of the optical side band, on the other hand, is evidently weaker as one can notice by comparing the -axis scales in Figs. 1(a) and (b). The scenario is opposite in PL measurements, where one finds that the strongest light emission comes from the optical side band at elevated electron densities, while that of the neutral exciton at low densities is evidently weaker Jones_NatNano13 ; Shang_ACSNano15 ; Wang_NanoLett17 . This apparent contradiction is settled by the facts that in PL experiments: (i) Neutral excitons in tungsten-based monolayers experience intervalley scattering after photoexcitation, rendering them less optically active in the light emission process Dery_PRB15 ; Zhang_PRL15 ; Wu_PRB15 ; Dery_PRB16 . (ii) The quantum efficiency of light emission can be improved at elevated electron densities due to screening of charged defects that function as non-radiative recombination centers for excitons. (iii) We will show that several photon emission mechanisms contribute to the optical side band in the PL case.
The main contribution of this work is in elucidating the microscopic origin for the optical side band, revealing an intriguing pairing phenomenon between excitons and plasmons, which has no parallel in other known two-dimensional (2D) systems. We make it clear why the optical band is manifested in the spectra of electron-doped ML-WSe2 and ML-WS2, while being absent in the hole-doped case or in ML-MoSe2 and ML-MS2. The theoretical framework in this work studies the oscillator strength of excitons through the electron-hole pair function in the presence of dynamical screening. The theory extends beyond the quasi-static random-phase approximation or the Shindo approximation for the dynamical effects Haug_SchmittRink_PQE84 . It therefore allows one to model the decay of the neutral exciton at elevated charge densities without introducing phenomenological screening parameters or ansatzes regarding the energy dependence of the pair function. In addition, the theory allows one to model the emergence of dynamical optical bands, where we will focus on the one that arises due to the exciton-plasmon coupling at large electron densities.
II Basic properties of Excitons and Plasmons in ML-TMDs
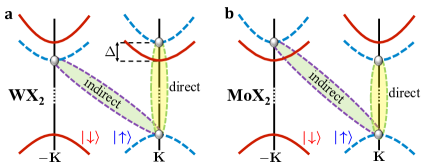
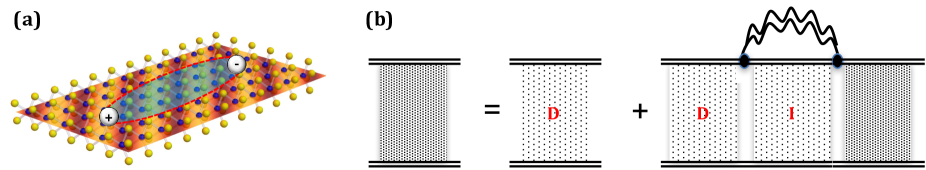
Before we can explain the coupling between plasmons and excitons, we briefly summarize the relevant properties of each of these quasiparticles separately. Excitons in ML-TMDs are classified based on the spin and valley configuration of the electron-hole pair Dery_PRB15 ; Wu_PRB15 ; Zhang_PRL15 . Figure 2 shows the valleys pertinent to the formation of low-energy excitons in ML-WX2 and ML-MoX2 where X is the chalcogen atom. Excitons are bright or dark (optically active or inactive) if the spins of the electron in the conduction band and the missing electron in the valence band are parallel or antiparallel, respectively. Scattering between dark and bright excitons necessitates a spin-flip of the electron or hole, which is typically a much slower process than the lifetime of bright excitons Lagarde_PRL14 ; Wang_PRB14 ; Yang_NatPhys15 ; Song_NanoLett16 . Therefore, we neglect dark excitons and show that the dynamical relation between two types of bright excitons is sufficient to explain the optical measurements in Fig. 1. The first type is the direct exciton in which the electron and hole have the same valley index, giving rise to direct-gap optical transitions. The second type is the indirect exciton in which the electron and hole reside in opposite valleys. Optical transitions of indirect excitons in perfect crystals are mediated by external agents such as shortwave phonons, needed to make up for the large momentum mismatch of indirect excitons and photons. As shown in Fig. 2, indirect excitons have lower energy than direct ones in ML-WX2 and vice versa in ML-MoX2 Dery_PRB15 .
Next, we briefly discuss the two plasmon species in ML-TMDs. The first type of plasmons is characterized by their long-wavelength Bohm_PR53 ; Bardasis_PR61 ; Sun_PRL16 . They originate from the long-range part of the Coulomb potential through which electrons cross the Fermi surface with small crystal momentum transfer (i.e., an intravalley process). These plasmons are common to all conducting media and are largely independent of the band structure since their wavelength is much longer than the lattice constant Pines_PR56 . In the context of optical transitions in semiconductors, plasmons screen the electron-hole attraction and they shrink the band-gap energy by assisting electrons (or holes) of similar spins to avoid each other Haug_SchmittRink_PQE84 . The energy dispersion of long-wavelength plasmons in 2D semiconductors follows
| (1) |
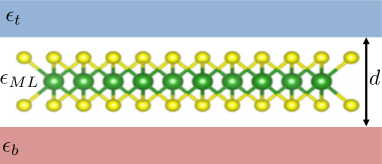
where is the elementary charge, is the wavenumber of the plasmon, and is the Fermi energy related to the charge density and effective mass of the electron ( and ). The static dielectric function takes into account the experimental sample geometry, as depicted in Fig. 3. Its form follows Keldysh_JETP79
| (2) |
where denotes the thickness of the ML including the van der Waals gap. The dielectric constants follow and , where , and denote the dielectric constants of the ML, bottom and top layers, respectively. This dielectric function is relevant for short and long wavelengths, where Cudazzo_PRB11
| (3) |
In the long-wavelength regime (), the effective dielectric constant is largely set by the average dielectric constants of the top and bottom layers. In the opposite extreme, on the other hand, the top and bottom layers play no role since the electric field lines are confined in the ML at such shortwaves.
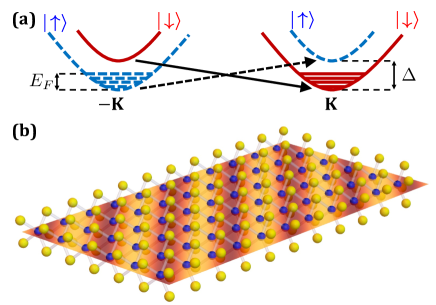
The second type of plasmons originates from the short-range Coulomb potential through which electrons transition between valleys Adler_PR62 ; Tudorovskiy_PRB10 ; Dery_PRB16 ; Schmidt_NanoLett16 ; Danovich_SR17 . Due to the relatively large spin splitting in the valence band of ML-TMDs Xiao_PRL12 , such transitions are mostly relevant in the conduction band wherein the much smaller spin splitting can be comparable to the Fermi energy, as shown in Fig. 4(a). Collective intervalley excitations result in shortwave plasmons, whose charge fluctuations profile is illustrated in Fig. 4(b), and whose energy dispersion follows Dery_PRB16
| (4) |
is the spin-splitting energy in the conduction band, , and . Here, is the wavenumber that connects the time-reversed valleys (3.2 is the lattice constant), and is the effective Bohr radius at these short wavelengths. The region of free-plasmon propagation is limited to where is the Fermi wavenumber Dery_PRB16 . That is, when the wavenumber of a shortwave plasmon belongs to a small region of nearly perfect time-reversal intervalley conditions (), it does not interact with individual electrons and should be treated as an independent degree of freedom in the electronic system Pines_PR56 .
In addition to their different length scales, intravalley and intervalley plasmons in ML-TMDs differ in their energy spectrum. The spin splitting in the conduction band produces a gapped dispersion for shortwave plasmons compared with the gapless dispersion in the long wavelength case: while . The value of is governed by the spin-orbit coupling at vanishing electron densities. Its value increases at elevated densities due to the electron-electron exchange interaction Dery_PRB16 .
III The Pair function of Excitons in the presence of Plasmons
To study how excitons interact with plasmons, we use the finite-temperature Green’s functions formalism Mahan_Book , and quantify the optical signature of bright excitons when surrounded by collective charge excitations Haug_SchmittRink_PQE84 . The connection to the absorption spectrum is then established via the imaginary part of the electron-hole pair function,
| (5) |
is the photon energy and is the thermal energy. and are 2D crystal wavevectors, where the electron in the pair takes on and the hole -. In the limit that , a direct optical transition is rendered due to the small momentum of photons. Throughout the analysis below, pair functions of direct and indirect excitons are evaluated by assigning and , respectively. Dynamical effects due to plasma oscillations are embodied by the dependence of on and , which are odd (Fermion) and even (Boson) imaginary Matsubara energies, and , where is an integer Haug_SchmittRink_PQE84 . The sums over and in Eq. (5) integrate out the Fermion degrees of freedom. In the last step, Padé analytical continuation is performed in order to evaluate the pair function at real photon energies Vidberg_JLTP77 : where and is expressed in terms of photon energy and quasi-chemical potentials in the conduction and valence bands.
To find the pair function in Eq. (5), we make use of the so-called screened ladder approximation. It describes repeated interaction of the electron-hole pair with the dynamically-screened potential Haug_SchmittRink_PQE84 . While this physical picture considers the interaction of excitons with collective electron excitations, it neglects exciton-exciton interactions. Accordingly, the screened ladder approximation can be used to explain experiments in which the ML is not subjected to intense photoexcitation. Figure 5 shows the Feynman diagram of the two-particle Green function before contraction (i.e., before integrating out any of its quantum numbers). This diagram is formally written as
| (6) |
where is the dynamically-screened potential to be discussed later. and are the interacting and non-interacting pair functions, respectively. The non-interacting case is given by the product of the electron and hole Green’s function
| (7) |
where here and below we assume the area of the monolayer is 1. The Kronecker delta-function allows us to integrate out the final wavevector in Eq. (6), and calculate the contracted pair function, , from which we can estimate the absorption according to Eq. (5). We note that while this step seems trivial, the approach so-far was to contract over the odd-Matsubara energy () and then use the so-called Shindo approximation to describe dynamical screening Shindo_JPSJ70 ; Haug_SchmittRink_PQE84 . However, dynamical screening can be better described upon contraction in momentum rather than energy space. This contraction keeps both dynamical parameters (even and odd Matsubara energies), while eliminating does not compromise any further accuracy in the solution of the pair function if the starting point is the screened ladder approximation. After contraction, we simplify the form of Eq. (6),
| (8) |
This equation can be solved by matrix inversion techniques, as explained in Appendix A.
III.1 The effect of long wavelength plasmons on excitons
We begin by evaluating the pair functions of direct excitons when , and in Eq. (8) are affected only by long-wavelength plasmons. Neglecting shortwave plasmons in the first step allows us to find common attributes between ML-TMDs and conventional semiconductor quantum wells HaugKoch_Book .
A central part of the theory is the inclusion of the dynamically-screened potential in Eq. (8). We invoke the single-plasmon pole approximation (SPP), which provides a relative compact form for the dynamical screening. Using the more rigorous random-phase approximation does not lead to qualitative changes or to increased computational complexity when solving Eq. (8). When including long-wavelength plasma excitations, the dynamically-screened Coulomb potential under the SPP approximation reads Haug_SchmittRink_PQE84
| (9) |
where
| (10) |
is the pole energy, and is the effective Bohr radius at long wavelengths. The solution of Eq. (8) is greatly simplified when using the static approximation, , or when studying the zero density case, . In these cases, one first calculates the sum , and then directly calculates the absorption spectrum from the contracted pair function, . The static approximation, however, tends to overestimate the role of screening, and one has to introduce phenomenological terms in the static potential to mitigate the screening effect SchmittRink_PRB86 ; HaugKoch_Book . A better description for the screening is provided by keeping the dynamical terms in the potential, . This approach, however, renders the solution of Eq. (8) evidently more computationally demanding compared with the static case.
The second signature of long-wavelength plasmons is introducing the band-gap renormalization (BGR) through the self-energy terms in the electron and hole Green’s functions,
| (11) |
where , and is the noninteracting electron (or hole) energy. The self energy term, , stems from the interaction of the electron (or hole) with the dynamically-screened potential, and is the chemical potential. is the temperature and density dependent chemical potential of the non-interacting electron gas. Using the -approximation, the self-energy term is written as Haug_SchmittRink_PQE84
| (12) | |||||
where is the Green’s function of the noninteracting particle (). The self energy is separated into exchange and correlation parts. The former follows
| (13) |
where is the Fermi-Dirac distribution. The exchange contribution from electron-electron interaction can only shift the filled valleys (i.e., ). The correlation term, on the other hand, affects all bands and it comes from emission or absorption of long-wavelength plasmons (intravalley processes),
where is the Bose Einstein distribution function evaluated at the plasmon pole energy, and is the integration cutoff introduced to guarantee convergence. Physically, it amounts to avoiding plasma damping due to particle-hole excitations of the Fermi sea.
We now have all of the ingredients to solve the pair function in Eq. (8), and then to the calculate the absorption spectrum from Eq. (5) after performing analytical continuation from the imaginary to the real axis (see Appendix A for more details). Figure 6 shows the calculated absorption spectrum at T=10 K from which one can clearly notice the exciton decay when the background charge density increases. The effective masses for both electrons and holes are 0.36 Kormanyos_2DMater15 , where is the free-electron mass (see Appendix A.1). The dielectric environment is modeled by sandwiching the ML ( nm, ) between thick layers of hexagonal boron-nitride () Wang_NanoLett17 ; Kim_ACSNano15 . The arrows in Fig. 6 indicate the continuum redshift due to BGR. Above this energy the excitons are no longer bound. Note that the bound state merges into the continuum already at relatively small densities due to its smaller binding energy. The BGR is calculated from the value of at , by assuming rigid shift of the bands. The cutoff energies we have used for the bottom and top spin-split valleys in Eq. (III.1) are meV and meV, respectively. These cutoff energies are the same for all densities. Using larger (smaller) cutoff energies will gradually redshift (blueshift) the peak position as one increases the charge density. The inset of Fig. 6 shows that the BGR is strongest when the charge density is ramped up from zero to 1012 cm-2. The continuum redshift is much slower between 1012 and 1013 cm-2, during which excitons become unbound and merge into the continuum.
Two effects cause the decay of the neutral-exciton spectral line with the increase in electron density. The dominant one is the broadening effect when the exciton energy approaches the continuum (see arrows in Fig. 6 and Eq. (22) in the Appendix). The decay that is caused by reduction in the oscillator strength plays a secondary role due to the mitigated effect of screening in 2D. This behavior is reminiscent of excitonic enhancement of free electron-hole transitions in semiconductor quantum wells SchmittRink_PRB86 , in which the overlap between the electron and hole wavefunctions remains sizable when excitons enter continuum. The simulated decay of the neutral exciton in Fig. 6 is corroborated in the differential-reflectivity measurements, which resolve the oscillator strength and broadening of the spectral lines Wang_NanoLett17 ; Wang_NatNano17 . Figures 1(a) and (c) show that when the charge density is ramped up by gate voltage, the measured decay of neutral excitons is not compensated by equivalent increase of charged excitons, thereby reinforcing the important role of BGR and dynamical screening. It is noted that unlike the experimental findings of Fig. 1, the simulated exciton peak in Fig. 6 is not completely quenched at elevated densities. In addition to the fact that we do not consider charged excitons, which drain part of the oscillator strength of neutral excitons Esser_PSSB01 , the model tends to overestimate the Coulomb attraction at elevated densities. The reason is that broadening effects are not introduced in the electron and hole Green’s functions of Eq. (8); they are introduced in the analytical continuation phase after the pair function is solved (Appendix A).
Additional important result in Fig. 6, which is supported by Figs. 1(a) and (c), is that the neutral exciton spectral position is hardly affected by the background charge density. The reason is the mutual offset between BGR and the screening-induced reduction in the binding energy of excitons; the long-wavelength plasmons are responsible for both effects HaugKoch_Book . One can therefore realize that the binding energy of excitons in ML-TMDs can be of the order of few hundreds meV only at vanishing charge densities. All in all, long-wavelength plasmons lead to qualitatively similar effects in ML-TMDs and conventional semiconductor quantum wells SchmittRink_PRB86 . The only change is a quantitatively larger effect in ML-TMDs due to reduced dielectric screening and larger electron mass Ugeda_NatMater14 ; Chernikov_NatPhoton15 .
III.2 The effect of shortwave plasmons on excitons
In the next step, the unique features of ML-TMDs are revealed by turning on the coupling between shortwave plasmons and excitons. In the long wavelength case, the exciton-plasmon coupling is implicit: It is embodied in the self energies of the electron and hole as well as in the attractive screened potential (i.e. the coupling to plasmons is ‘concealed’ in the dressed propagator and Coulomb lines in Fig. 5). An explicit exciton-plasmon interaction is inhibited if the extension of the exciton is smaller than the wavelength of the plasmon due to the charge neutrality of the former. This physical picture changes for shortwave plasmons, which can be effectively paired up with an exciton in spite of its charge neutrality. Here, the short-range nature of the charge fluctuations, as can be seen in Fig. 7(a), allows the hole or electron to act as a spectator while the plasmon interacts with the opposite charge.
The energy required to excite a shortwave plasmon at low temperatures is greater than that available thermally (). In addition, we recall that free propagating plasmons are independent degrees of freedom, which do not interact with individual charged particles of the electronic system. As a result, plasmon signatures in the optical spectrum can be resolved by supplying energy from outside the electron system in amounts greater than the plasmon energy. This is the case when we shake-up the electronic system by exciting electron-hole pairs. Figure 7(b) shows the Feynman diagram for the explicit coupling between an exciton and a shortwave plasmon when the hole acts as the spectator. The plasmon propagator is the double wiggly line. This Feynman diagram corresponds to renormalization of the pair function of direct excitons according to
| (15) |
where the pair Green’s functions were contracted by integrating out the Fermion Matsubara energies. The mixing with indirect excitons comes from the self-energy term,
| (16) |
where is the interaction between the plasmon and the electron component of the exciton, and is the free-plasmon propagator. The sum in Eq. (16) is restricted to intervalley transitions, , so that the pair function on the right-hand side is that of indirect excitons. The interaction and propagator terms follow Pines_PR56
| (17) | |||||
| (18) |
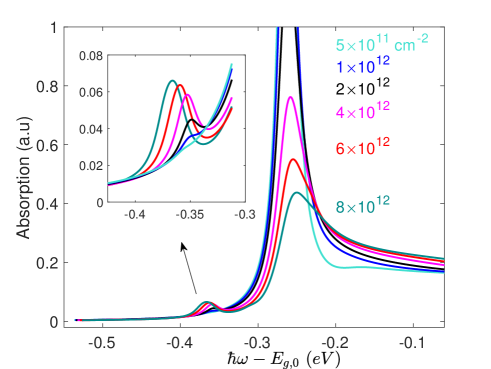
Figure 8 shows the renormalized absorption spectrum of direct excitons in electron-doped ML-WX2 at 10 K. A dynamical band emerges in the low-energy side of the spectrum. We have considered tungsten-based settings such that indirect excitons have lower energy than direct ones (Fig. 2(a)). The spin-orbit coupling splits the conduction-band valleys by 26 meV Zhang_arXiv17 . All other parameters are the same as in Fig. 6. The behavior of the simulated dynamical band is similar to the empirical behavior of the optical side band in electron-doped ML-WX2 Jones_NatNano13 ; Xu_NatPhys14 ; Shang_ACSNano15 ; Plechinger_PSS15 ; Plechinger_NanoLett16 ; Plechinger_NatCom16 ; Wang_NanoLett17 ; Wang_NatNano17 , as shown in Fig. 1(b). Comparing the theory and experiment results, both show a redshift and amplification of the optical side band when increasing the electron density until they saturate. We note that the pair function reflects the oscillator strength of the optical transition, and in this respect its amplitude should be compared with that seen in differential reflectivity rather than photoluminescence experiments (we will further address this issue later). Comparing the results in Figs. 1(b) and 8, however, we still find two quantitative disagreements. The first one is that the main peak does not completely decay at elevated densities. As explained before, we attribute this disagreement to the fact that broadening effects are introduced only after solving the two-particle Dyson equation (Appendix A). The second disagreement is that the relative amplitude of the simulated dynamical band is about three times weaker than the oscillator strength of the optical side band. We attribute this mismatch to the difficulty to simulate a stronger dynamical band through increase of the integration cutoff in Eq. (16) outside the small window of free-plasmon propagation (e.g., when ). The reason is that the high-order Padé polynomials used to perform analytical continuation, , are notoriously sensitive to minute numerical errors Osolin_PRB12 .
We now focus on the redshift and initial amplification of the dynamical band, which are common to both experiment, as shown in Figs. 1(b), and our simulations (highlighted in the enlarged box of Fig. 8). The redshift is caused by the electron-electron exchange interaction when the lower spin-split valleys are being filled. This interaction leads to stronger energy redshift of the populated lower valleys compared with the unpopulated upper ones (inset of Fig. 6), thereby increasing the plasmon energy via in Eq. (4). The initial amplification of the dynamical band is commensurate with the increase in the number of free-propagating plasmon modes (larger value of ). Saturation at high densities occurs when the energy difference between direct and indirect excitons, , deviates from the energy of shortwave plasmons, . Specifically, indirect excitons experience a blueshift due to electron filling of the lower valleys, while direct ones are not subjected to this effect since they originate from electronic states in the empty upper valleys. Continuing to increase the electron density eventually leads to a slow decay of the dynamical band due to increased ‘off-resonance’ conditions between and (Appendix A.5).
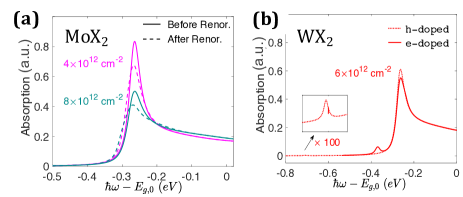
Our model shows that the dynamical band is evident only in electron-doped ML-WX2, providing a strong evidence that it corresponds to the measured optical side band Jones_NatNano13 ; Xu_NatPhys14 ; Shang_ACSNano15 ; Plechinger_PSS15 ; Plechinger_NanoLett16 ; Plechinger_NatCom16 ; Wang_NanoLett17 ; Wang_NatNano17 . Figure 9(a) shows that the dynamical band is absent in electron-doped ML-MoX2, simulated by reversing the order of the conduction-band valleys such that direct excitons have lower energy (Fig. 2(b)). The dynamical band is not seen due to ‘wrong conditions’. Namely, the band is positioned at about one plasmon energy below the energy of the indirect exciton, which in the case of ML-MoX2 coincides with the direct-exciton spectral line. This behavior makes it hard to resolve the optical signature of exciton-plasmon quasiparticles in ML-MoX2. Figure 9(a) indeed shows the renormalization only affects the spectral region of the exciton peak without the emergence of dynamical bands in other spectral regions. In electron-doped ML-WX2, on the other hand, the dynamical band can be distinctly recognized since the indirect exciton has lower energy, so that overall the band emerges below the direct-exciton spectral line.
Further evidence that the revealed exciton-plasmon phenomenon corresponds to the optical side band in electron-doped ML-WX2 is provided by simulating the hole-doped case. Figure 9(b) shows the renormalized absorption spectra of hole- and electron-doped ML-WX2. The dynamical band is practically absent in the hole-doped case, which is similar to the experimental findings in Figs. 1(c) and (d). We can understand this behavior by noting that for electron doping, the splitting of the conduction-band valleys corresponds to both plasmon energy and energy difference between direct and indirect excitons (the role of electron-hole exchange is relatively small as we explain in Appendix A.4). For hole doping, on the other hand, the plasmon energy is governed by the large splitting of the valence-band valleys (400 meV in ML-WX2), while the energy difference between direct and indirect excitons is still governed by the much smaller splitting in the conduction band. The large mismatch between the two suppresses the emergence of a visible dynamical band in hole-doped ML-TMDs.
III.3 Stokes vs anti-Stokes optical side bands
Figure 8 shows that the exciton-plasmon resonance emerges below the direct-exciton spectral line in electron-doped ML-WX2. Figure 9(a) shows that it coincides with the spectral line of the direct exciton in electron-doped ML-MoX2. These calculations did not reveal the emergence of an optical side band above the direct-exciton spectral line due to the small population of shortwave plasmons at the simulated low temperature (T=10 K), when . Specifically, the self energy of direct excitons includes both plasmon emission and absorption processes, corresponding to ‘Stokes’ and ‘anti-Stokes’ bands below and above the energy of the indirect exciton, respectively (see Appendix A.2). The amplitude of the ‘Stokes’ band is commensurate with , while that of the ‘anti-Stokes’ band with . The vanishing value of the latter at low temperatures explains the fact that Figs. 8 and 9 do not include signatures of high-energy optical side bands due to plasmon absorption.
At high temperatures, on the other hand, it may be possible to observe a distinct high-energy optical side band in the absorption spectrum of electron-doped ML-MoSe2. The value of in this material is non-negligible Dery_PRB15 ; Kormanyos_2DMater15 , resulting in a well-resolved ‘anti-Stokes’ band whose energy is above the spectral line of the direct exciton. This high-energy optical side band is expected to blueshift when increasing the electron density due to the increasing value of . Its amplitude, however, should be measurably weaker than that of the ‘Stokes’ band in ML-WX2 since the ratio remains evidently smaller than 1 even close to room-temperature (see Appendix A.2). In addition, the observation of an high-energy optical side band in high-temperature ML-MoSe2 may be elusive if it resides close or within the continuum. That is, the exciton-plasmon coupling is manifested at elevated electron densities in which the exciton energy approaches the continuum due to the strong BGR. The emergence of an exciton-plasmon resonance above the direct-exciton spectral line is hampered by broadening effects, similar to the behavior of neutral excitons when their energy approaches the continuum (Fig. 6). The plasmon emission process, on the other hand, is relatively robust since the increased value of with electron density causes the low-energy optical side band to redshift, thereby keeping it protected from merging into the red-shifting continuum. Accordingly, broadening effects of the ‘Stokes’ band are mitigated and ultrafast dissociation of the exciton-plasmon quasiparticle to the continuum of electron-hole pairs is suppressed. Appendix A.2 includes further details on the ‘Stokes’ and ‘anti-Stokes’ optical side bands.
IV Discussion
When comparing the results in this work with experimental findings, one should recall that the theory only evaluates the pair function and its renormalization due to coupling with plasmons. Accordingly, the theory does not capture optical transitions that are associated with three-body complexes Suris_PSSB01 ; Ramon_PRB03 ; Narvaez_PhysE01 ; Berkelbach_PRB13 ; Zhang_NanoLett15 ; Thilagam_JAP14 ; Chernikov_PRL14 ; Ganchev_PRL15 ; Efimkin_PRB17 , Fermi polarons Sidler_NatPhys17 , and exciton optical transitions next to localization centers Hawrylak_PRB91 . Nonetheless, the theory in this work covers two important regimes. The first one is the low density regime, cm-2, in which the neutral exciton dominates the absorption spectrum. The dynamical picture we have developed quantifies its induced decay due to long-wavelength plasmons (Fig. 6), where we find good agreement with reflectivity experiments Wang_NanoLett17 . The second case is the high-doping regime, cm-2, in which both reflectivity and PL experiments show that only one peak survives in the spectrum of electron-doped ML-WX2 Jones_NatNano13 ; Wang_NanoLett17 , as shown by Fig. 1(b). The main focus of this work is on this doping regime, and we attribute this optical transition to a new type of quasiparticle where the exciton is coupled to a shortwave charge fluctuation. We provided evidence that the behavior of the optical side band when increasing the electron density matches that of the exciton-plasmon quasiparticle, and further showed that it emerges in electron-doped ML-WX2 but not in hole doped or ML-MoX2 cases (Figs. 8 and 9). Any alternative explanation that aims at deciphering the origin for the optical side band should be consistent with this observation. Below, we discuss several key aspects that one may find helpful when interpreting experimental findings and when comparing them with our theory.
IV.1 Plasmon-assisted optical transitions
We have attributed the optical side band in the reflectance spectra to creation of an exciton-plasmon quasiparticle. It was found by renormalization of the pair function of direct excitons, through the sum of infinite plasmon-induced virtual transitions to intermediate indirect-exciton states (Fig. 7(b)). This physical picture should not be confused with that of a plasmon-assisted optical absorption, in which an indirect exciton is created through two virtual transitions into and from a direct exciton. To better understand this difference and its implication in the context of the experimental data (Fig. 1), we assume low temperatures where only emission of a shortwave plasmon is feasible during these processes ().
IV.1.1 Plasmon-assisted photon absorption (reflectivity spectrum)
In photon absorption at low temperatures, the plasmon-assisted process creates an indirect exciton and a shortwave plasmon in the final state. The overall energy conservation of the absorption process is such that the photon energy is the sum of the indirect exciton and plasmon energies,
| (19) |
where the crystal momenta of the plasmon and indirect exciton are opposite to guarantee momentum conservation (the photon carries negligible momentum). Here, the photon is absorbed into a direct-exciton virtual state, followed by plasmon emission that transfers the exciton to its final state. Crystal momentum must be conserved during virtual transitions to and from intermediate states due to translation symmetry. As a second-order process, the absorption amplitude is weak unless the energy of the intermediate virtual state resonates with the real energy level of the direct exciton. Recalling of the energy diagram in Fig. 2, Eq. (19) implies that this condition is met in electron-doped ML-WX2 but not in ML-MoX2. That is, the plasmon-assisted photon absorption is a second-order resonance process in electron-doped ML-WX2, meaning that the neutral-exciton spectral line () has two contributions. The first one is from the first-order absorption process, which creates direct excitons. The second contribution is from the second-order resonance process, which creates indirect excitons via emission of shortwave plasmons.
Therefore, an important resulting question is how can one resolve the relative contribution of the plasmon-assisted optical transitions to the oscillator strength of in electron-doped ML-WX2. Clearly, the contribution has negligible weight at vanishing electron densities due to the minute range of free-propagating plasmon modes. When the charge density increases, however, we can identify this contribution by looking for differences between the reflectance data in the electron-doped and hole-doped regimes. Indeed, Figs. 1(a) and (c) reveal a clear difference in the measured behavior of , whose blueshift and broadening is evidently stronger in the electron doped case. As we suggest below, the plasmon-assisted optical transitions can give rise to this behavior.
Without the contribution of shortwave plasmons, one would expect the blueshift of to be stronger in the hole-doped case. Specifically, the blueshift of neutral excitons in the absorption spectrum of semiconductors is induced by filling one or both of the bands that are involved in the optical transition HaugKoch_Book . This condition is not readily met in electron-doped ML-WX2 since only the bottom conduction valleys are populated, whereas the optical transition involves the top valleys. Both experiment and theory show that electron population in the top valleys of ML-WX2 begins at densities that are comparable to cm-2 Dery_PRB15 ; Wang_NanoLett17 . The situation is different for the hole-doped case at which hole filling in the top of the valence band is measurable at smaller densities. Thus, while such behavior should lead to weaker or at most comparable blueshift of the direct exciton in the electron-doped case, the experiment shows the opposite. Furthermore, the simulated decay of the pair function in Fig. 6 resembles the observed decay of in the hole-doped case better. This fact suggests a missing component in the theory such that dynamical screening and BGR are not enough to fully explain the behavior of in electron-doped ML-WX2.
Plasmon-assisted optical transitions can complete the puzzle and explain the stronger blueshift and broadening of in electron-doped ML-WX2. There are two complementing facts that support this claim. Firstly, plasmon-assisted optical absorption stems from a resonance process in electron-doped ML-WX2, suggesting a non-negligible effect. Secondly, Eq. (19) can explain the enhanced blueshift in the experiment since the plasmon energy increases at elevated densities (through the increased value of ). Finally, the enhanced broadening of in ML-WX2 when the electron density increases can be explained by closer proximity of the photon energy to the red-shifting continuum (or possibly merging with the continuum). We will provide a complete description of these phenomena alongside second-order perturbation theory to describe the plasmon-assisted optical transitions in a future work.
All in all, the optical side band in the reflectance experiment of electron-doped ML-WX2 () is attributed to the exciton-plasmon quasiparticle, originating from renormalization of the self energy of the direct exciton. Its energy is one (two) plasmon(s) below that of the indirect (direct) exciton. Photon absorption due to plasmon-assisted optical transitions, on the other hand, is a second-order process that converts photons into indirect excitons through plasmon emission at low temperatures. It becomes important in electron-doped ML-WX2, in which the intermediate virtual exciton state resonates with the real energy level of the direct exciton. The signature of this process in the reflectance experiment of electron-doped ML-WX2 is limited to the spectral region of the direct exciton (). Unlike phonon-assisted optical transitions Lax_PR61 ; Li_PRL10 ; Li_PRB13 ; Dery_PRB15 , the amplitude of the plasmon-assisted ones increases with the electron density due to the increased range of free propagating plasmon modes.
IV.1.2 Plasmon-assisted photon emission (PL spectrum)
In photon emission at low temperatures, the plasmon-assisted process creates a shortwave plasmon and a photon in the final state through annihilation (radiative recombination) of an indirect exciton. The overall energy conservation of the emission process is such that,
| (20) |
Here, the indirect exciton in the initial state is transitioned into a direct-exciton virtual state by plasmon emission, followed by the photon emission. Recalling of the energy diagram in Fig. 2, Eq. (20) implies that the resonance condition is now met in electron-doped ML-MoX2, in which the energy of the intermediate virtual state resonates with the real energy level of the direct exciton. However, this second-order resonance process has no real value at low temperature PL since the population of indirect excitons in ML-MoX2 is negligible at low temperature: Most excitons in these compounds remain direct after photoexcitation and energy relaxation (Fig. 2(b)). Therefore, we do not expect plasmon-assisted optical transitions to have a measurable signature in the PL spectrum of ML-MoX2 at low temperatures.
The case of electron-doped ML-WX2 is unique if we consider the renormalization of direct excitons that led to the exciton-plasmon quasiparticle. In the reflectance spectrum, we have concluded that the contributions from creation of indirect excitons through the plasmon-assisted photon absorption and creation of exciton-plasmon quasiparticles are spectrally resolved: The latter corresponds to the optical side band (), and the former can only affect the spectral region of the bare neutral exciton (). In the PL spectrum, on the other hand, Eq. (20) suggests that the photon energy should coincide with that of the optical side band. That is, both the annihilation of the exciton-plasmon quasiparticle and the annihilation of indirect excitons through plasmon-assisted photon emission contribute to in the PL spectrum. The latter contribution may not be negligible due to large population of indirect excitons after energy thermalization in ML-WX2 (Fig. 2(a)). In addition, while the energy of the intermediate virtual state does not resonate with the real energy level of the bare direct exciton, it matches the low energy of the dressed one (i.e., the exciton-plasmon quasiparticle). Therefore, the recombination of indirect exciton due to plasmon-assisted photon emission may have a measurable signature on the spectral weight of , explaining in part why its magnitude is much stronger in PL compared with reflectance spectra (see related discussion in the Sec. I) Jones_NatNano13 ; Wang_NanoLett17 . We note that modeling of the density-dependent PL spectrum is beyond the scope of this work, partly because of the lack of knowledge of the non-radiative recombination processes. For example, charged impurities that function as nonradiative recombination centers are screened at elevated densities, resulting in improved quantum efficiency for radiative recombination. Conversely, non-radiative Auger processes are amplified at elevated densities Hausser_APL90 ; Polkovnikov_PRB98 ; Danovich_2DMater16 , thereby reducing the quantum efficiency.
IV.1.3 High Temperatures
So far we have discussed plasmon-assisted optical transitions at low temperatures, in which only emission of shortwave plasmons is possible during the photon absorption or emission. At high temperatures, on the other hand, we should also consider the absorption of shortwave plasmons during these optical processes. Repeating the previous analyses, one can see that the conditions for second-order resonance processes are switched between ML-MoX2 and ML-WX2. Detecting the signatures of these processes in the high-temperature reflectance or PL spectra may be elusive for the same reasons we have mentioned regarding the ‘anti-Stokes’ optical side band in Sec. III.3.
IV.1.4 Other optical spectroscopy tools to probe the plasmon-exciton coupling
In addition to differential reflectivity and photoluminescence experiments, it may be possible to probe the coupling between excitons and shortwave plasmons in electron-doped samples using Raman-type experiments or non-linear optical spectroscopy. For example, the energy of scattered photons in the ‘Stokes’ band of a Raman experiment is expected to be 2 below that of the incident photon. It involves a virtual process through which two counter-propagating shortwave plasmons are emitted, so that the sum of their momenta becomes negligible and matches the minute momentum of photons. In the first step of this process, the incident photon induces a virtual transition to a direct exciton intermediate level, which in the second step is scattered to the indirect exciton intermediate level due to plasmon emission. In the next step, the indirect exciton is scattered back to the direct exciton intermediate level by emission of a counter-propagating plasmon. Finally, the system emits a photon at the ‘Stokes’ energy (the energy of the incident photon minus the energy of two plasmons). The overall process is expected to be weak since two plasmon-mediated virtual transitions are involved. The amplitude of the scattered light can increase by using near resonance conditions. The amplitude of the scattered light and its energy can be controlled by employing a gate voltage that tunes the value of through electron filling of the lower spin-split valleys. That is, the gate voltage provides additional control parameter in the experiment. A similar approach can be used in non-linear wave mixing spectroscopy: The generated wave is amplified when the detuning between the input beams approaches 2.
IV.2 Three body complexes versus exciton-plasmon quasiparticles
It is beyond the scope of this work to provide a complete three-body dynamical function since it is impossible to solve numerically its corresponding Dyson equation without simplifying approximations. The dynamical model we have developed describes the behavior of the pair function and its renormalization due to coupling with shortwave plasmons. The optical side band, which we have associated with the exciton-plasmon quasiparticle, has nearly opposite behavior to that of charged excitons (see discussion of Fig. 1 in Sec. I). Accordingly, the identification of charged excitons complexes and exciton-plasmon quasiparticles can be readily achieved. Studying how the dynamically-screened potential influences the oscillator strength and broadening of charged excitons is a work in progress. Here, we mention some of the known theoretical approaches to study their behavior. The most computationally convenient way to deal with trions is to dispense with the dynamical terms altogether Courtade_arXiv17 ; Narvaez_PhysE01 ; Berkelbach_PRB13 ; Zhang_NanoLett15 ; Thilagam_JAP14 ; Ganchev_PRL15 ; Chernikov_PRL14 , but then one can only conclude on their binding energy. Such static models cannot describe the density-dependent rise, decay, energy shift, and broadening of trions in the spectrum. Alternatively, one can neglect dynamical terms in the exciton-electron interaction Sidler_NatPhys17 , or a priori assume the dynamical form of the Green’s function without solving the corresponding dynamical Dyson equation Suris_PSSB01 ; Efimkin_PRB17 . In the latter case, one can describe the behavior of charged excitons by invoking an exciton-electron scattering function, where dynamical terms in the scattering potential are neglected.
One open question in the context of our work deals with possible coupling between trions and shortwave plasmons. Figures 1(a) and (b) do not show optical side bands whose energy is or below that of the charged exciton spectral line; the value of is about 26 meV at low densities Zhang_arXiv17 , and it increases at elevated ones Dery_PRB16 . The absence or weakness of trion-plasmon coupling is attributed to the relatively small oscillator strength of the charged exciton compared with that of the neutral exciton (Fig. 1). The oscillator strength is inversely proportional to the square of the complex radius, where the radius is about three times larger for trions Kylanpaa_PRB15 ; Mayers_PRB15 . This fact is also reflected in the much smaller binding energy of the charged exciton. Here, we reemphasize that the decay of the neutral-exciton spectral line with the increase in electron density is mostly caused by broadening effects when the exciton energy approaches the redshifting continuum (see discussion of Fig. 6). The quasiparticle made by a neutral exciton coupled to a shortwave plasmon is resilient to this broadening since its energy is kept away from the redshifting continuum due to the increasing value of when the density is ramped up. For that reason, the oscillator strength of the optical side band neither decays nor broadens at elevated densities (Fig. 1(b) and Fig. 8). Quantitatively, the oscillator strength amplitude is manifested in a relatively large value of the pair function at even Matsubara energies, compared with the respective dynamical Green’s function that would describe charged excitons. Finally, we mention that the optical side band is weak but noticeable even when is significantly smaller than the binding energy of the charged exciton (enlarged boxes of Figs. 1(a) and 8). In this regime, the negatively charged exciton manages to stay away from electrons and plasma excitations of the Fermi sea, as evident from the absence of broadening and blueshift of and in Fig. 1(a). Neutral electron-hole pairs, on the other hand, are not repelled by the surrounding Fermi sea, and therefore can be coupled to shortwave plasmons at all finite densities.
IV.3 Strong Photoexcitation conditions
Recently, You et al. observed the emergence of a strong spectral line in the PL of ML-WSe2 when subjected to strong excitation You_NatPhys15 . This peak showed quadratic dependence on the intensity of the pump signal, and did not shift appreciably when increasing the pumping intensity. This behavior suggests that the emerged spectral line is due to exciton-exciton interaction You_NatPhys15 . A similar behavior was also observed in the PL of ML-WS2 Shang_ACSNano15 ; Plechinger_PSS15 . To date, however, this behavior was not reported in the PL of ML-MoX2.
We argue that these observations can be settled by considering the shortwave Coulomb excitations. Specifically, the strong pump intensity generates a relatively large density of direct excitons whose majority relax in energy and turn indirect in ML-WX2 (Fig. 2(a)) Dery_PRB15 ; Zhang_PRL15 . The band structure of indirect excitons is similar to the one shown in Fig. 4(a) Song_PRL13 , where their electron component generates the same type of shortwave Coulomb excitations. A direct exciton can then interact with these excitations in the same way as before leading to renormalization of its self energy. The observed biexciton spectral line emerges through this renormalization. The main difference from the optical side band, which emerges under conditions of weak photoexcitation in electron-doped ML-WX2, is that now the pumping is responsible not only for the exciton population. It is also responsible for the generation of shortwave Coulomb excitations through the electron components of indirect excitons. These two responsibilities explain the quadratic dependence of the observed optical transition on the pumping intensity. In this view, the measured phenomena can still be identified as an exciton-exciton interaction, but with the notion that the coupling is between direct and indirect excitons due to shortwave charge fluctuations.
The importance of our theory is therefore in suggesting a microscopic origin for the exciton-exciton optical transition in the PL of strongly photoexcited ML-WX2. We claim that it originates from the intervalley Coulomb excitations, and not due to other sources such as van der Waals-type attraction between two neutral excitons. If the latter was the microscopic origin for the observed biexciton spectral line, then it should be insensitive to whether the two excitons are direct, indirect or a mixture of the two. As a result, one should be able to observe the biexciton spectral line in the PL of both ML-MoX2 and ML-WX2 under comparable pumping intensities. That this scenario is not observed in experiments precludes such microscopic origins. Furthermore, previous theoretical calculations have shown that the binding energy of the biexciton is about 20 meV either in ML-MoX2 or ML-WX2, by using a variety of four-body computational models with static 2D Coulomb (Keldysh) potentials Berkelbach_PRB13 ; Zhang_NanoLett15 ; Kylanpaa_PRB15 ; Velizhanin_PRB15 ; Mayers_PRB15 ; Kezerashvili_FBS17 ; Szyniszewski_PRB17 . PL experimental reports, on the other hand, are available only for ML-WX2 in which the biexciton emerges 50 - 60 meV below the neutral-exciton spectral line You_NatPhys15 ; Shang_ACSNano15 ; Plechinger_PSS15 . Our claim regarding the coupling between direct and indirect excitons through shortwave charge fluctuations is indeed self-consistent with the fact that the biexciton spectral line was not reported to date in PL experiments of ML-MoX2. The low-temperature population of indirect excitons in these compounds is negligible due to their higher energy, as shown in Fig. 2(b). Moreover, the coupling between indirect and direct excitons has the same ‘wrong conditions’ that were discussed in the context of Fig. 9(a). Namely, the renormalization of direct excitons does not lead to a distinct spectral line, which can be resolved from that of the neutral exciton.
In addition, our explanation is consistent with the fact that the indirect-direct biexciton spectral line in ML-WX2 emerges at the same spectral position of the optical side band in electron-doped ML-WX2 ( below the direct-exciton spectral line, which is of the order of 50 - 60 meV in these materials) Jones_NatNano13 ; Shang_ACSNano15 ; Wang_NanoLett17 ; Wang_NatNano17 . One difference between the two cases, however, is that the energy shift of the direct-indirect biexciton is weak when the photoexcitation intensity increases You_NatPhys15 , compared with the redshift of the optical side-band when increasing the electron density Jones_NatNano13 . The reason is that unlike gate-induced free electrons, bound and neutral excitons do not lead to appreciable change of . The value of can change due to the long-wavelength exchange interaction, which is effective in the case of free electrons Dery_PRB16 . As a result, the indirect-direct biexciton shows a relatively weak energy shift when increasing the photoexcitation intensity (as long as excitons remain bound).
V conclusion and perspectives
The identified pairing of shortwave plasmons and excitons explains the puzzling observations of the emerging low-energy optical side band in the spectra of electron-doped WSe2 and WS2, while being conspicuously absent with hole doping, MoSe2 and MoS2 Jones_NatNano13 ; Xu_NatPhys14 ; Shang_ACSNano15 ; Plechinger_PSS15 ; Plechinger_NanoLett16 ; Plechinger_NatCom16 ; Wang_NanoLett17 ; Wang_NatNano17 . Elucidating the exciton-plasmon mechanism and the importance of dynamical screening paves the way to harness unexplored manifestations of spin-valley coupling and the realization of other dynamical bands, such as those arising due to the exciton-phonon coupling.
The findings of this work reveal the unique nature of shortwave (intervalley) plasmons in monolayer transition-metal dischalcogenides. Recalling that freely propagating shortwave plasmons are independent degrees of freedom in the electronic system, these quasiparticles can be directly detected in electron-rich monolayers (i.e., not through their coupling to excitons). Using THz spectroscopy, for example, one should expect to see a resonance in the absorption spectrum when the photon energy is about twice the spin splitting in the conduction band ( 0.1 eV). Such far-infrared photons can couple to two counter-propagating shortwave plasmons, thereby conserving both energy and momentum. As before, the plasmon energy and amplitude can be tuned by a gate voltage. Beyond monolayer transition-metal dichalcogenides, intervalley plasmons may give rise to pairing mechanisms in superconductors whose Fermi surface comprises distinct time-reversal pockets or flat bands. The short-range nature of these plasmons and their gapped energy renders them resilient to screening.
ACKNOWLEDGMENTS
The authors are indebted to Zefang Wang, Kin Fai Mak, and Jie Shan for providing the reflectivity measurements in Fig. 1 and for many useful discussions. We also thank Xiaodong Xu for discussing and sharing valuable experimental results prior to their publication. This work is mainly supported by the Department of Energy, Basic Energy Sciences (DE-SC0014349). The computational work at Rochester was also supported by the National Science Foundation (DMR-1503601) and the Defense Threat Reduction Agency (HDTRA1-13-1-0013). The work at Buffalo was supported by the Department of Energy, Basic Energy Sciences (DE-SC0004890). The work at Regensburg and Würzburg was supported by the DFG (SCHA 1899/2-1 and SFB 1170 “ToCoTronics”), and by the ENB Graduate School on Topological Insulators.
Appendix A Computational Details
Equation (8) is solved with matrix inversion. Each row (or column) in the matrix is indexed via . The angular dependence of in is averaged out, and then all the 2D wavevectors in Eq. (8) are treated as scalars. We use a uniform grid with a spacing of where is chosen such that eV. For the Fermion Matsubara energies, , runs between to . The Boson Matsubara energy in Eq.(8) is treated as a parameter in the matrix. That is, we solve this equation for each with . For numerical calculations, we have used , , and the code was written in Fortran and parallelized with OpenMP. For every density, the calculation of or takes about 7 hours when using 44 CPUs (2 GHz) with 1 TB shared DRAM.
After the calculation of the pair Green’s function, we use Eq. (5) to calculate the absorption spectrum. Specifically, we first calculate the function
| (21) |
and then use Padé polynomials to extract the analytical form of in the upper complex plane from knowledge of its values at discrete even Matsubara energies Vidberg_JLTP77 . The broadening term is taken by HaugKoch_Book
| (22) |
where () are three parameters with the following meaning: reflects the inhomogeneous broadening due to disorder, adatoms, and charge puddles. and reflect the enhanced homogenous broadening when the transition energy belongs to the continuum (). Far below the continuum, we get that . Far above the continuum edge, we get that . See chapter 13 in Ref. HaugKoch_Book for more details. In this work, we have used meV, meV, and meV.
The results shown in Figs. 8 and 9 were obtained using the renormalization in Eq. (15). The self-energy term, whose expression is provided in Eq. (16), is calculated by summing over even Matsubara energies and by integrating over . The integration interval for the latter is where . That is, we have assumed that plasmons are not immediately damped outside the region of free-plasmon propagation.
A.1 Effective mass model
It is emphasized that the goal of this work is not to reproduce the exact binding energy of excitons in ML-TMDs. Rather, we are interested in the effects of dynamical screening and coupling between excitons and shortwave plasmons. We use the effective mass approximation since it allows us to simplify the calculation while keeping the main dynamical effects intact. In the calculation of the pair functions of direct and indirect excitons, we have assumed similar effective masses for electrons in the lower and upper valleys of the conduction band. We ignore the (small) change in the values of the effective masses at the edges of the lower and upper valleys since the binding energy of excitons in ML-TMDs is much larger than the conduction-valley splitting energy. That is, the matrix we use to solve the pair function includes electronic states whose energies are hundreds of meV above the edge of the band. For such states, the exact value of the effective mass in the bottom of the band is meaningless. We therefore choose the same value for both lower and upper valleys, which represents the effective mass of the ‘extended‘ conduction band.
A.2 Emission and absorption of plasmons
The self energy of the exciton due to the interaction with shortwave plasmons, given in Eq. (16), includes both emission and absorption terms. Formally, these terms are derived from the identity Haug_SchmittRink_PQE84 ; Mahan_Book
| (23) | |||||
where the sum runs over even Matsubara energies, and the integration contour in the upper plane encircles the poles in the positive sense. Using Cauchy’s residue theorem, the Bose Einstein distribution factors for absorption and emission, , result from the poles in the plasmon propagator, (see Eq. (18)), where . Furthermore, by approximating the pair function as a simple pole expression, where is the exciton energy, we can analytically derive the ’Stokes’ and ’anti-Stokes’ side bands. The former stems from the emission term , where and at low temperatures. Similarly, the absorption term stems from .
Section III.3 describes some of the difficulties that may arise when one tries to observe the ‘anti-Stokes’ band in the absorption spectrum of high-temperature ML-MoSe2. Other difficulties that impede its detection may be caused by plasmon damping due to coupling with phonons, and by the relatively small population of shortwave plasmons due to the increased value of at elevated electron densities. This behavior can be understood from inspecting the Bose-Einstein distribution factors that are associated with the distinct ‘anti-Stokes’ and ’Stokes’ bands, , which emerge in ML-MoSe2 and ML-WX2, respectively. For example, assuming that these optical side bands persist at 200 K and assigning 40 meV for both materials at some comparable elevated densities Dery_PRB16 , then the amplitude of the ’Stokes’ band becomes 20 times stronger than that of the ‘anti-Stokes’ band.
A.3 Type B excitons
Type B excitons correspond to optical transitions from the lower spin-split valence band. We expect the coupling between type B excitons in ML-TMDs and shortwave plasmons to be weak due to the ultrashort lifetime of type B excitons: They experience ultrafast intervalley spin-conserving energy relaxation of holes to the lower spin-split valleys. Furthermore, at elevated charge densities in which the plasma excitations become relevant, the band-gap renormalization is strong enough so that type B optical transitions are within the continuum. That is, when the densities of resident holes or electrons are larger than 1012 cm-2, type B excitons can experience ultrafast dissociation to free electrons and holes. The coupling to shortwave plasmons is less effective in this case.
A.4 Electron-hole exchange
The relatively large binding energy of excitons in ML-TMDs can lead to evident energy splitting between bright and dark excitons Maialle_PRB93 ; Yu_NatComm14 ; Echeverry_PRB16 . The theory presented in our work, however, involves only bright excitons (singlet spin configuration of the electron and hole). Therefore, both direct and indirect bright excitons should experience similar effects due to the electron-hole exchange interaction. As a result, the energy splitting between direct and indirect excitons remains equivalent to the spin-splitting of the conduction band. Furthermore, the emergence of the dynamical band is relevant at elevated charge densities in which the wavefunctions of excitons are blown-up due to screening (smaller binding energy). The electron-hole exchange is a weaker effect at such conditions.
A.5 More simulation results
It is important to realize that the effects of dynamical screening and interaction with plasmons are largely independent of the exact parameters that we choose for the effective mass and dielectric constant. For example, in the main text we have assumed that the monolayer is embedded in hexagonal boron nitride for which there is discrepancy in the reported values of the dielectric constant. Recent experiments use values of Wang_NanoLett17 ; Wang_NatNano17 , and we have used this parameter in Figs. 6, 8, and 9. However, previous studies of hexagonal boron nitride reported values that are nearly twice as large, Geick_PR66 . We have used this value in Fig. 10, illustrating that such changes do not affect the findings of this work. The only change, as seen from the values of the -axis, is a smaller binding energy due to the larger dielectric screening. Yet, the roles of dynamic screening and the emergence of the dynamical band are the same. Here, we have also used a slightly larger cutoff where instead of that we used in Figs. 8 and 9. We use this value to enable stronger pairing between excitons and shortwave plasmons, as can be seen from the shoulder and enhanced blueshift of the main peak at elevated densities. At the same time, the redshift of the dynamical band is also somewhat enhanced and shows slight decay at elevated densities.
References
- (1) K. F. Mak, C. Lee, J. Hone, J. Shan, and T. F. Heinz, Atomically Thin MoS2: A new direct-gap semiconductor, Phys. Rev. Lett. 105, 136805 (2010).
- (2) A. Splendiani, L. Sun, Y. Zhang, T. Li, J. Kim, C.-Y. Chim, G. Galli, and F. Wang, Emerging photoluminescence in monolayer MoS2, Nano Lett. 10, 1271 (2010).
- (3) Q. H. Wang, K. Kalantar-Zadeh, A. Kis, J. N. Coleman, and M. S. Strano, Electronics and optoelectronics of two-dimensional transition metal dichalcogenides, Nature Nanotechnol. 7, 699 (2012).
- (4) A. K. Geim and I. V. Grigorieva, Van der Waals heterostructures, Nature 499, 419 (2013).
- (5) K. F. Mak and J. Shan, Photonics and optoelectronics of 2D semiconductor transition metal dichalcogenides, Nature Photon. 10, 216 (2016).
- (6) D. Xiao, G.-B. Liu, W. Feng, X. Xu, and W. Yao, Coupled Spin and Valley Physics in Monolayers of MoS2 and Other Group-VI Dichalcogenides, Phys. Rev. Lett. 108, 196802 (2012).
- (7) Y. Song and H. Dery, Transport theory of monolayer transition-metal dichalcogenides through symmetry, Phys. Rev. Lett. 111, 026601 (2013).
- (8) K. F. Mak, K. L. McGill, J. Park, P. L. McEuen, The Valley Hall Effect in MoS2 Transistors, Science 344, 1489 (2014).
- (9) X. Xu, W. Yao, D. Xiao, and T. F. Heinz, Spin and pseudospins in layered transition metal dichalcogenides, Nature Phys. 10, 343 (2014).
- (10) A. M. Jones, H. Yu, N. J. Ghimire, S. Wu, G. Aivazian, J. S. Ross, B. Zhao, J. Yan, D. G. Mandrus, D. Xiao, W. Yao, and X. Xu, Optical generation of excitonic valley coherence in monolayer WSe2, Nature Nano. 8, 634 (2013).
- (11) J. Shang, X. Shen, C. Cong, N. Peimyoo, B. Cao, M. Eginligil, and T. Yu, Observation of excitonic fine structure in a 2D transition-metal dichalcogenide semiconductor, ACS Nano 9, 647 (2015).
- (12) G. Plechinger, P. Nagler, J. Kraus, N. Paradiso, C. Strunk, C. Schüller, and T. Korn, Identification of excitons, trions and biexcitons in single-layer WS2, Phys. Status Solidi RRL 9, 457 (2015).
- (13) G. Plechinger, P. Nagler, A. Arora, A. Granados del Águila, M. V. Ballottin, T. Frank, P. Steinleitner, M. Gmitra, J. Fabian, P. C. M. Christianen, R. Bratschitsch, C. Schüller, and T. Korn, Excitonic valley effects in monolayer WS2 under high magnetic fields, Nano Lett. 16, 7899 (2016).
- (14) G. Plechinger, P. Nagler, A. Arora, R. Schmidt, A. Chernikov, A. Granados del Águila, P. C. M. Christianen, R. Bratschitsch, C. Schüller, and Tobias Korn, Trion fine structure and coupled spin-valley dynamics in monolayer tungsten disulfide, Nature Commun. 7, 12715 (2016).
- (15) Z. Wang, L. Zhao, K. F. Mak, and J. Shan, Probing the spin-polarized electronic band structure in monolayer transition metal dichalcogenides by optical spectroscopy, Nano Lett. 17, 740 (2017).
- (16) Z. Wang. K. F. Mak, and J. Shan, Valley- and spin-polarized Landau levels in monolayer WSe2, Nature Nanotechnol. 12, 144 (2017).
- (17) M. Koperski, M. R. Molas, A. Arora, K. Nogajewski, A. O. Slobodeniuk, C. Faugeras, and M. Potemski, Optical properties of atomically thin transition metal dichalcogenides: Observations and puzzles, Nanophotonics, (2017), doi:10.1515/nanoph-2016-0165
- (18) A. L. Efros, Metal-non-metal transition in heterostructures with thick spacer layers, Solid State Commun. 70, 253 (1989).
- (19) A. M. Jones, H. Yu, J. Schaibley, J. Yan, D. G. Mandrus, T. Taniguchi, K. Watanabe, H. Dery, W. Yao, X. Xu, Excitonic luminescence upconversion in a two-dimensional semiconductor, Nature Phys. 12, 323 (2016).
- (20) E. Courtade, M. Semina, M. Manca, M. M. Glazov, C. Robert, F. Cadiz, G. Wang, T. Taniguchi, K. Watanabe, M. Pierre, W. Escoffier, E. L. Ivchenko, P. Renucci, X. Marie, T. Amand, B. Urbaszek, Charged excitons in monolayer WSe2: experiment and theory, arXiv:1705.02110
- (21) R. A. Suris, V. P. Kochereshko, G. V. Astakhov, D. R. Yakovlev, W. Ossau, J. Nürnberger, W. Faschinger,G. Landwehr, T. Wojtowicz, G. Karczewski, and J. Kossut, Excitons and trions modified by interaction with a two-dimensional electron gas, Phys. stat. solid (b) 227, 343 (2001).
- (22) G. Ramon, A. Mann, and E. Cohen, Theory of neutral and charged exciton scattering with electrons in semiconductor quantum wells, Phys. Rev. B 67, 045323 (2003).
- (23) P. Kossacki, Optical studies of charged excitons in II-VI semiconductor quantum wells, J. Phys.: Condens. Matter 15, R471 (2003).
- (24) M. T. Portella-Oberli, V. Ciulin, J. H. Berney, B. Deveaud, M. Kutrowski, and T. Wojtowicz, Interacting many-body systems in quantum wells: Evidence for exciton-trion-electron correlations, Phys. Rev. B. 69, 235311 (2004).
- (25) I. Bar-Joseph, Trions in GaAs quantum wells, Semicond. Sci. Technol. 20, R29 (2005).
- (26) D. Keller, D. R. Yakovlev, G. V. Astakhov, W. Ossau, S. A. Crooker, T. Slobodskyy, A. Waag, G. Schmidt, and L. W. Molenkamp, Magneto-optics of two-dimensional electron gases modified by strong Coulomb interactions in ZnSe quantum wells, Phys. Rev. B 72, 235306 (2005).
- (27) M. Sidler, P. Back, O. Cotlet, A.Srivastava, T. Fink, M. Kroner, E. Demler, and A. Imamoglu, Fermi polaron-polaritons in charge-tunable atomically thin semiconductors, Nature Phys. 13, 255 (2017).
- (28) J. Jadczak, A. Delgado, L. Bryja, Y. S. Huang, and P. Hawrylak, Robust high-temperature trion emission in monolayers of Mo(SySe1-y)2 alloys, Phys. Rev. B 95, 195427 (2017).
- (29) A. Chernikov, A. M. van der Zande, H. M. Hill, A. F. Rigosi, A. Velauthapillai, J. Hone, and T. F. Heinz Electrical Tuning of Exciton Binding Energies in Monolayer WS2, Phys. Rev. Lett. 115, 126802 (2015).
- (30) F. Cadiz, E. Courtade, C. Robert, G. Wang, Y. Shen, H. Cai, T. Taniguchi, K. Watanabe, H. Carrere, D. Lagarde, M. Manca, T. Amand, P. Renucci, S. Tongay, X. Marie, and B. Urbaszek, Excitonic linewidth approaching the homogeneous limit in MoS2-based van der Waals heterostructures, Phys. Rev. X 7, 021026 (2017).
- (31) H. Dery and Y. Song, Polarization analysis of excitons in monolayer and bilayer transition-metal dichalcogenides, Phys. Rev. B 92, 125431 (2015).
- (32) X.-X. Zhang, Y. You, S. Yang, F. Zhao, and T. F. Heinz, Experimental Evidence for Dark Excitons in Monolayer WSe2, Phys. Rev. Lett. 115, 257403 (2015).
- (33) F. Wu, F. Qu, and A. H. MacDonald, Exciton band structure of monolayer MoS2, Phys. Rev. B 91, 075310 (2015).
- (34) H. Dery, Theory of intervalley Coulomb interactions in monolayer transition-metal dichalcogenides, Phys. Rev. B 94, 075421 (2016).
- (35) H. Haug and S. Schmitt-Rink, Electron theory of the optical properties of laser excited semiconductors, Prog. Quant. Electr. 9, 3 (1984).
- (36) D. Lagarde, L. Bouet, X. Marie, C. R. Zhu, B. L. Liu, T. Amand, P. H. Tan, and B. Urbaszek, Carrier and polarization dynamics in monolayer MoS2, Phys. Rev. Lett. 112, 047401 (2014).
- (37) G. Wang, L. Bouet, D. Lagarde, M. Vidal, A. Balocchi, T. Amand, X. Marie, and B. Urbaszek, Valley dynamics probed through charged and neutral exciton emission in monolayer WSe2, Phys. Rev. B 90, 075413 (2014).
- (38) L. Yang, N. A. Sinitsyn, W. Chen, J. Yuan, J. Lou, and S. A. Crooker, Long-lived nanosecond spin relaxation and spin coherence of electrons in monolayer MoS2 and WS2, Nature Phys. 11, 830 (2015).
- (39) X. Song, S. Xie, K. Kang, J. Park, and V. Sih, Long-lived hole spin/valley polarization probed by Kerr rotation in monolayer WSe2, Nano Lett. 16, 5010 (2016).
- (40) D. Bohm and D. Pines, A Collective description of electron interactions: III. Coulomb interactions in a degenerate electron gas, Phys. Rev. 92, 609 (1953).
- (41) A. Bardasis and J. R. Schrieffer, Excitons and plasmons in superconductors, Phys. Rev. 121, 1050 (1961).
- (42) Z. Sun, D. N. Basov, and M. M. Fogler, Adiabatic amplification of plasmons and demons in 2D systems, Phys. Rev. Lett. 117, 076805 (2016).
- (43) D. Pines, Collective energy losses in solids, Rev. Mod. Phys. 28, 184 (1956).
- (44) L. V. Keldysh, Coulomb interaction in thin semiconductor and semimetal films, JETP Lett. 29, 658 (1979).
- (45) P. Cudazzo, I. V. Tokatly, and A. Rubio, Dielectric screening in two-dimensional insulators: Implications for excitonic and impurity states in graphane, Phys. Rev. B 84, 085406 (2011).
- (46) R. Schmidt, G. Berghauser, R. Schneider, M. Selig, P. Tonndorf, E. Malic, A. Knorr, S. Michaelis de Vasconcellos, and R. Bratschitsch, Ultrafast Coulomb-induced intervalley coupling in atomically thin WS2, Nano Lett. 16, 2945 (2016).
- (47) S. L. Adler, Quantum theory of the dielectric constant in real solids, Phys. Rev. 126, 413 (1962).
- (48) T. Tudorovskiy and S. A. Mikhailov, Intervalley plasmons in graphene, Phys. Rev. B 82, 073411 (2010).
- (49) M. Danovich, V. Zolyomi, and V. I. Fal’ko, Dark trions and biexcitons in WS2 and WSe2 made bright by e-e scattering, Sci. Rep. 7, 45998 (2017).
- (50) G. D. Mahan, Many-particle physics, 3rd ed. (Kluwer Academics, New York, 2000).
- (51) H. J. Vidberg, and J. W. Serene, Solving the Eliashberg equations by means of N-point Pade approximants, J. Low Temp. Phys. 29, 179 (1977).
- (52) K. Shindo, Effective Electron-Hole Interaction in Shallow Excitons, J. Phys. Soc. Japan 29, 287 (1970).
- (53) H. Haug and S. W. Koch, Quantum theory of the optical and electronic properties of semiconductors, 3rd ed. (World Scientific, Singapore, 1994).
- (54) S. Schmitt-Rink, C. Ell, and H. Haug, Many-body effects in the absorption, gain, and luminescence spectra of semiconductor quantum-well structures, Phys. Rev. B 33, 1183 (1986).
- (55) A. Kormànyos, G. Burkard, M. Gmitra, J. Fabian, V. Zòlyomi, N. D. Drummond, and V. I. Fal’ko, theory for two-dimensional transition metal dichalcogenide semiconductors, 2D Mater. 2, 049501 (2015).
- (56) K. Kim, S. Larentis, B. Fallahazad, K. Lee, J. Xue, D. C. Dillen, C. M. Corbet, and E. Tutuc, Band alignment in WSe2 - graphene heterostructures, ACS Nano 9, 4527 (2015).
- (57) A. Esser, R. Zimmermann, and E. Runge, Theory of trion spectra in semiconductor Nanostructures, Phys. stat. solid (b) 227, 317 (2001).
- (58) M. M. Ugeda, A. J. Bradley, S.-F. Shi, F. H. da Jornada, Y. Zhang, D. Y. Qiu, W. Ruan, S.-K. Mo, Z. Hussain, Z.-X. Shen, F. Wang, S. G. Louie, and M. F. Crommie, Giant bandgap renormalization and excitonic effects in a monolayer transition metal dichalcogenide semiconductor, Nature Mater. 13, 1091 (2014).
- (59) A. Chernikov, C. Ruppert, H. M. Hill, A. F. Rigosi, and T. F. Heinz, Population inversion and giant bandgap renormalization in atomically thin WS2 layers, Nature Photon. 9, 466 (2015).
- (60) X.-X. Zhang, T. Cao, Z. Lu, Y.-C. Lin, F. Zhang, Y. Wang, Z. Li, J. C. Hone, J. A. Robinson, D. Smirnov, S. G. Louie, and T. F. Heinz, Magnetic brightening and control of dark excitons in monolayer WSe2, arXiv:1612.03558
- (61) Ž. Osolin and R. Žitko, Padé approximant approach for obtaining finite-temperature spectral functions of quantum impurity models using the numerical renormalization group technique, Phys. Rev. B 87, 245135 (2013).
- (62) T. C. Berkelbach, M. S. Hybertsen, and D. R. Reichman, Theory of neutral and charged excitons in monolayer transition metal dichalcogenides, Phys. Rev. B 88, 045318 (2013).
- (63) A. Chernikov, T. C. Berkelbach, H. M. Hill, A. Rigosi, Y. Li, O. B. Aslan, D. R. Reichman, M. S. Hybertsen, and T. F. Heinz, Exciton Binding Energy and Nonhydrogenic Rydberg Series in Monolayer WS2, Phys. Rev. Lett. 113, 076802 (2014).
- (64) D. K. Zhang, D. W. Kidd, K. Varga, Excited biexcitons in transition metal dichalcogenides, Nano Lett. 15, 7002 (2015).
- (65) A. Thilagam, Exciton complexes in low dimensional transition metal dichalcogenides, J. Appl. Phys. 116, 053523 (2014).
- (66) B. Ganchev, N. Drummond, I. Aleiner, and V. Fal’ko, Three-particle complexes in two-dimensional semiconductors, Phys. Rev. Lett. 114, 107401 (2015).
- (67) G. A. Narvaez, P. Hawrylak, and J. A. Brum, The role of finite hole mass in the negatively charged exciton in two dimensions, Physica E 9, 716 (2001).
- (68) D. K. Efimkin and A. H. MacDonald Many-body theory of trion absorption features in two-dimensional semiconductors, Phys. Rev. B 95, 035417 (2017).
- (69) P. Hawrylak, Optical properties of a two-dimensional electron gas: Evolution of spectra from excitons to Fermi-edge singularities, Phys. Rev. B 44, 3821 (1991).
- (70) M. Lax and J. J. Hopfield, Selection rules connecting different points in the Brillouin zone, Phys. Rev. 124, 115 (1961).
- (71) P. Li and H. Dery, Theory of spin-dependent phonon-assisted optical transitions in silicon, Phys. Rev. Lett. 105, 037204 (2010).
- (72) P. Li, D. Trivedi, and H. Dery, Spin-dependent optical properties in strained silicon and germanium, Phys. Rev. B 87, 115203 (2013).
- (73) S. Hausser, G. Fuchs, A. Hangleiter, and K. Streubel, Auger recombination in bulk and quantum well InGaAs, Appl. Phys. Lett. 56, 913 (1990).
- (74) A. S. Polkovnikov and G. G. Zegrya, Auger recombination in semiconductor quantum wells, Phys. Rev. B 58, 4039 (1998).
- (75) M. Danovich, V. Zólyomi, V. I. Fal?ko, and I. L Aleiner, Auger recombination of dark excitons in WS2 and WSe2 monolayers, 2D Mater. 3, 035011 (2016).
- (76) I. Kylänpää and H.-P. Komsa, Binding energies of exciton complexes in transition metal dichalcogenide monolayers and effect of dielectric environment, Phys. Rev. B 92, 205418 (2015).
- (77) M. Z. Mayers, T. C. Berkelbach, M. S. Hybertsen, and D. R. Reichman, Binding energies and spatial structures of small carrier complexes in monolayer transition-metal dichalcogenides via diffusion Monte Carlo, Phys. Rev. B 92, 161404 (2015).
- (78) Y. You, X.-X. Zhang, T. C. Berkelbach, M. S. Hybertsen, D. R. Reichman, and T. F. Heinz, Observation of biexcitons in monolayer WSe2, Nature Phys. 11, 477 (2015).
- (79) K. A. Velizhanin and A. Saxena, Excitonic effects in 2D semiconductors: path integral Monte Carlo approach, Phys. Rev. B 92, 195305 (2015).
- (80) R. Ya. Kezerashvili and S. M.Tsiklauri, Trion and biexciton in monolayer transition metal dichalcogenides, Few-Body Syst. 58, 18. (2017).
- (81) M. Szyniszewski, E. Mostaani, N. D. Drummond, and V. I. Fal’ko, Binding energies of trions and biexcitons in two-dimensional semiconductors from diffusion quantum Monte Carlo calculations, Phys. Rev. B 95, 081301(R) (2017).
- (82) M. Z. Maialle, E. A. de Andrada e Silva, and L. J. Sham, Exciton spin dynamics in quantum wells, Phys. Rev. B 47, 15776 (1993).
- (83) H. Yu, G.-B. Liu, P. Gong, X. Xu, and W. Yao, Dirac cones and Dirac saddle points of bright excitons in monolayer transition metal dichalcogenides, Nature Commun. 5, 3876 (2014).
- (84) J. P. Echeverry, B. Urbaszek, T. Amand, X. Marie, and I. C. Gerber, Splitting between bright and dark excitons in transition metal dichalcogenide monolayers, Phys. Rev. B 93, 121107 (2016).
- (85) R. Geick, C. H. Perry, and G. Rupprecht, Normal modes in hexagonal boron nitride, Phys. Rev. 146, 543 (1966).