11email: csanchez@cab.inta-csic.es 22institutetext: Instituto de Astronomía, Universidad Nacional Autónoma de México, Postal address: Apartado Postal 70-264, 04510, México, CDMX, Mexico 33institutetext: Observatorio Astronómico Nacional (IGN), Alfonso XII No 3, 28014 Madrid, Spain 44institutetext: Observatorio Astronómico Nacional (IGN), Ap 112, 28803 Alcalá de Henares, Madrid, Spain 55institutetext: Centro de Astrobiología (CSIC-INTA), Ctra de Torrejón a Ajalvir, km 4, 28850 Torrejón de Ardoz, Madrid, Spain
A pilot search for mm-wavelength recombination lines from emerging ionized winds in pre-planetary nebulae candidates
We report the results from a pilot search for radio recombination line (RRL) emission at millimeter wavelengths in a small sample of pre-planetary nebulae (pPNe) and young PNe (yPNe) with emerging central ionized regions. Observations of the H30, H31, H39, H41, H48, H49, H51, and H55 lines at 1 and 3 mm have been performed with the IRAM 30 m radio telescope. These lines are excellent probes of the dense inner (≲ 150 au) and heavily obscured regions of these objects, where the yet unknown agents for PN-shaping originate. We detected mm-RRLs in three objects: CRL 618, MWC 922, and M 2-9. For CRL 618, the only pPN with previous published detections of H41, H35, and H30 emission, we find significant changes in the line profiles indicating that current observations are probing regions of the ionized wind with larger expansion velocities and mass-loss rate than 29 years ago. In the case of MWC 922, we observe a drastic transition from single-peaked profiles at 3 mm (H39 and H41) to double-peaked profiles at 1 mm (H31 and H30), which is consistent with maser amplification of the highest frequency lines; the observed line profiles are compatible with rotation and expansion of the ionized gas, probably arranged in a disk+wind system around a 5-10 central mass. In M 2-9, the mm-RRL emission appears to be tracing a recent mass outburst by one of the stars of the central binary system. We present the results from non-LTE line and continuum radiative transfer models, which enables us to constrain the structure, kinematics, and physical conditions (electron temperature and density) of the ionized cores of our sample. We find temperatures 6000-17,000 K, mean densities 105-108 cm-3, radial density gradients with 2-3.5, and motions with velocities of 10-30 km s-1 in the ionized wind regions traced by these mm-wavelength observations. We deduce mass-loss rates of 10-6- yr-1, which are significantly higher than the values adopted by stellar evolution models currently in use and would result in a transition from the asymptotic giant branch to the PN phase faster than hitherto assumed.
Key Words.:
Stars: AGB and post-AGB – circumstellar matter – Stars: winds, outflows – Stars: mass-loss – HII regions – Radio lines: general1 Introduction
The yet unknown physical mechanisms responsible for the onset of asphericity and polar acceleration in planetary nebulae (PNe) are already active in early stages of the evolution beyond the asymptotic giant branch (AGB). Therefore, pre-PNe (pPNe) and young PNe (yPNe) hold the key to understanding the complex and fast (1000 yr) nebular evolution from the AGB toward the PN phase. Some studies of pPNe support the idea that the multiple lobes and high-velocities observed are produced by the impact of collimated fast winds (CFWs or ) on the spherical and slowly expanding circumstellar envelopes (CSEs) formed in the previous AGB phase (see, e.g., Balick & Frank, 2002, for a review). However, this jet+‘AGB CSE’ two-wind interaction scenario remains unconfirmed by direct characterization of the post-AGB jets themselves and of the central nebular regions from which these jets would be launched (within few100 au). Studying these central regions is difficult because of their small (sub-arcsec) angular sizes and, most importantly, because they are usually heavily obscured by optically thick circumstellar dust shells or disks. Moreover, post-AGB ejections, believed to be the main PN-shaping agents, are short-duration phenomena (with lifetimes of ≲ 100 yr) and they are already inactive (or, at least, much less energetic) in evolved PNe. Therefore, progress requires sensitive observations at long wavelengths of the crucial, short-lived pPN/yPN phases.
Central stars of pPNe start ionizing their surroundings at the mid-stages of their post-AGB evolution toward the central star of PN (CSPN) phase, typically when they reach a B-type spectral classification. Optical spectroscopic observations of pPNe and yPNe (e.g., Sánchez Contreras et al., 2002; Arrieta & Torres-Peimbert, 2003; Sánchez Contreras et al., 2008, and references therein) have revealed the widespread presence of broad (FWZI 100-1000 km s-1) H emission, often with blue-shifted absorption features (P-cygni profiles) that are produced at their nuclei. In some pPNe, the H emission suggests the presence of active fast shocks in the stellar vicinity that could be linked, for example, to ongoing jets sculpting the inner regions of slower and older mass ejecta. Owing to the large amount of dust in most pPNe/yPNe, which is mainly concentrated in the equatorial regions, at optical wavelengths the light from the ionized nucleus can only be observed indirectly after it is reflected by the dust in the lobes. This situation not only impedes line detections but also complicates the interpretation of the observed scattered-H profiles enormously (Sánchez Contreras & Sahai, 2001; Arrieta et al., 2005).
The just emerging central ionized cores of pPNe/yPNe, however, can be traced by radio recombination line (RRL) emission with the important advantage that dust extinction effects are minimal. The theory of RRL emission is well understood (e.g., Brown et al., 1978), however, RRL observations are challenging, especially in the cm-wavelength range where these lines are extremely weak in comparison to the continuum level (typically 1%). However, in the mm-wavelength range larger line-to-continuum flux ratios are expected, i.e., above 80% and 10% at 1 and 3 mm, respectively. To date, some mm-wavelength, but mainly cm-wavelength RRL studies have been carried out for some of the best-known and most luminous evolved PNe (e.g., Roelfsema et al., 1991; Bachiller et al., 1992; Vázquez et al., 1999). However, this field remains largely unexplored for pPNe/yPNe, where central ionized regions are in an early stage of development.
To our knowledge, RRLs have only been detected in the mm-wavelength range (H41, H35, and H30) toward one pPN, i.e., the C-rich CRL 618 (Martín-Pintado et al., 1988). As shown by these authors, mm-wavelength RRLs (mm-RRLs) are excellent tools to study the structure, physical conditions (electron temperature, , and density, ), and kinematics of the dense, central ionized regions of pPNe/yPNe. Indeed, even though single-dish observations do not enable us to spatially resolve the structure of the compact ionized cores, to some extent it is possible to constrain the properties of the current (post-AGB) mass-loss process from detailed radiative transfer modeling of RRL observations. Then, RRLs allow us to study post-AGB mass-loss, which remains very poorly known even when it is key to understanding the physics mediating the AGB-to-PN evolution.
In this paper, we report the results from our pilot study of the emerging central ionized regions of a sample of pPNe/yPNe candidates by means of single-dish observations of RRLs at mm-wavelengths. In Section 2, we describe our sample and provide a brief, yet somewhat detailed, introduction to the three sources with mm-RRL detections. The observations and observational results are described in Sections 3 and 4, respectively. The analysis of the data, which includes radiative transfer model of the line and continuum emission, and the derived results are reported in Section 5. Results are interpreted and discussed in Sections 6 and 7 and our main conclusions are summarized in Section 8.
2 Sample
A small sample of eight targets (Table 1) was selected as follows. First, we chose pPNe/yPNe candidates with compact H emission signalling active ionized winds at their cores (Sánchez Contreras et al., 2008; Arrieta & Torres-Peimbert, 2003; van de Steene et al., 2000) observable with the IRAM 30 m dish. In contrast to evolved PNe, radio continuum flux measurements are lacking for the vast majority of pPNe/yPNe, however, we carefully dug into the literature and publicly available data archives to build the spectral energy distributions (SEDs) of our targets. We preferentially selected objects with indications of positive spectral indexes in the mm-to-cm range ( , with ), indicative of partially optically thick continuum emission. A positive spectral index is expected in the case of an isothermal spherical wind with a power-law radial density gradient (e.g., Panagia & Felli, 1975; Reynolds, 1986). In this case, the peak-line intensities of RRLs steeply increase with frequency, optimizing the chances of detection at mm-wavelengths. We also made a final sieve by choosing objects with the strongest H line and continuum fluxes. All targets in our sample have relatively hot central stars with effective temperatures in the range 20,000-40,000 K, which correspond to early-B to late-O spectral types (references are given in Table 1).
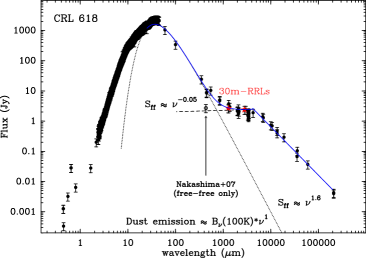
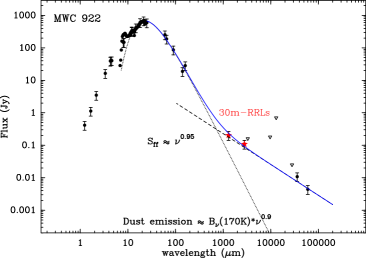
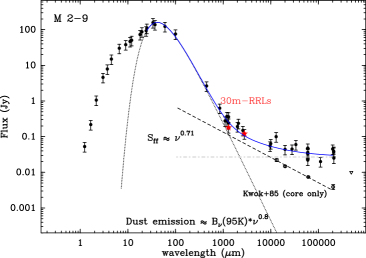
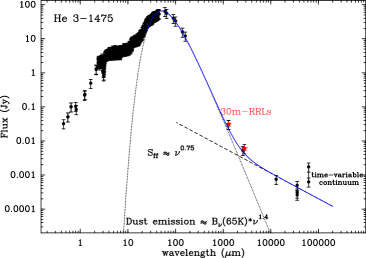
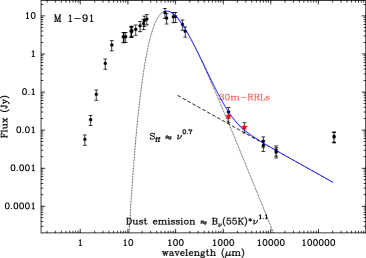
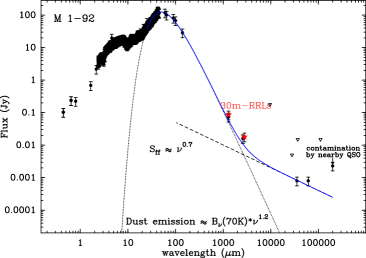
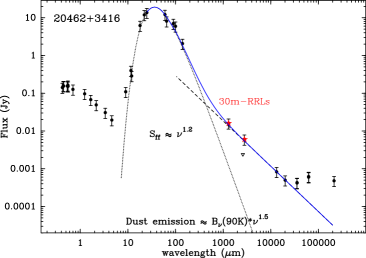
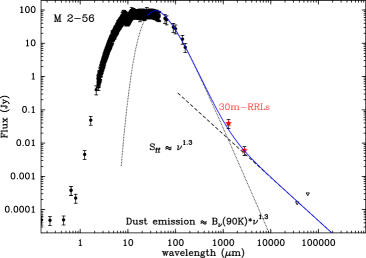
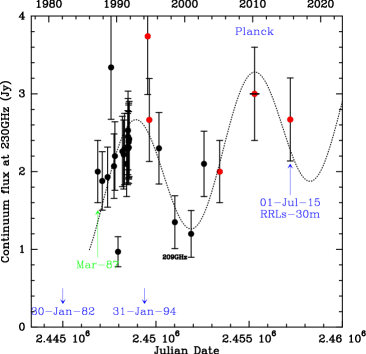
In Figure 1, we show the SEDs of the targets in our sample. In the mm-wavelength region, the continuum emission is a mixture of thermal dust and free-free emission. In the case of the well studied pPN CRL 618, with a strong variability of the radio continuum flux reported over the past three decades (e.g., Kwok & Feldman, 1981; Martín-Pintado et al., 1988; Sánchez Contreras et al., 2004; Tafoya et al., 2013, and § 2.1), we have used coeval and almost coeval mm-to-cm data as compiled by Tafoya et al. (2013) and Planck Collaboration et al. (2015). For the rest of the sources, ancillary data are not necessarily coeval and a certain degree of variability of the radio continuum cannot be ruled out; this could partially explain the scatter of the cm-continuum data points in some targets. Indeed, this is most likely the case of He 3-1475 as noticed by Cerrigone et al. (2011), who found a periodic pattern in the 3.6 cm continuum light curve of this object.
| Source | RA(J2000) | Dec(J2000) | Continuum (mJy)a𝑎aa𝑎aContinuum flux measured by us near the H39 (2.7 mm) and H41 (1.3 mm) RRLs. The formal errors of the continuum fluxes, averaging all line-free channels within the observed sub-band, do not include the absolute flux calibration uncertainties, which can be up to 20 and 30% at 3 and 1 mm, respectively. | Distance | Luminosityb𝑏bb𝑏bObtained integrating the SED and adopting the distance given in this table. | References | |
|---|---|---|---|---|---|---|---|
| name | (h m s) | (° ′ ″) | 2.7 mm | 1.3 mm | (kpc) | (103 ) | |
| RRL detections | |||||||
| CRL 618 | 04:42:53.64 | +36:06:53.4 | 239517 | 267050 | 0.9 | 8.5 | 10, 19, 20, 21, 25, 29 |
| M 2-9 | 17:05:37.96 | 10:08:32.5 | 1213 | 18010 | 0.65,1.3††{\dagger}††{\dagger}Uncertain distance: two possible values and the corresponding luminosities are given (see § 2.2 and 2.3). | 0.7,3.0††{\dagger}††{\dagger}Uncertain distance: two possible values and the corresponding luminosities are given (see § 2.2 and 2.3). | 5, 6, 8, 17 |
| MWC 922 | 18:21:15.91 | 13:01:27.1 | 1092 | 2035 | 1.7,3.0††{\dagger}††{\dagger}Uncertain distance: two possible values and the corresponding luminosities are given (see § 2.2 and 2.3). | 18,59††{\dagger}††{\dagger}Uncertain distance: two possible values and the corresponding luminosities are given (see § 2.2 and 2.3). | 2, 15, 16, 28 |
| RRL non-detections | |||||||
| Hen 3-1475 | 17:45:14.19 | 17:56:46.9 | 62 | 3110 | 5 | 9 | 11, 14, 18 |
| PN M 1-91 | 19:32:57.69 | +26:52:43.1 | 121 | 233 | 2.1 | 0.3 | 6, 12, 17, 27 |
| PN M 1-92 | 19:36:18.90 | +29:32:49.9 | 182 | 862 | 2.5 | 10 | 1, 3, 4, 9, 17, 22 |
| IRAS 20462+3416 | 20:48:16.63 | +34:27:24.3 | 62 | 163 | 3.5 | 0.8 | 13, 22, 24, 26 |
| PN M 2-56 | 23:56:36.38 | +70:48:17.9 | 61 | 394 | 2.1 | 5.5 | 7, 17, 23 |
\tablebib
(1) Alcolea et al. (2007); (2) Allen & Swings (1976); (3) Arrieta et al. (2005); (4) Bujarrabal et al. (1998); (5) Bujarrabal et al. (2001); (6) Calvet & Cohen (1978); (7) Castro-Carrizo et al. (2002); (8) Castro-Carrizo et al. (2012); (9) Cohen& Kuhi (1977); (10) Goodrich (1991); (11) Huggins et al. (2004); (12) Lee et al. (2007); (13) Parthasarathy (1993); (14) Riera et al. (1995); (15) Rodríguez et al. (2012); (16) Rudy et al. (1992); (17) Sánchez Contreras et al. (1998); (18) Sánchez Contreras & Sahai (2001); (19) Sánchez Contreras et al. (2002); (20) Sánchez Contreras & Sahai (2004); (21) Sánchez Contreras et al. (2004); (22) Sánchez Contreras et al. (2008); (23) Sánchez Contreras et al. (2010); (24) Sánchez Contreras & Sahai (2012); (25) Schmidt & Cohen (1981); (26) Suárez et al. (2006); (27) Torres-Peimbert et al. (2010); (28) Tuthill & Lloyd (2007); (29) Westbrook et al. (1975).
In the following subsections, we provide a broad introduction to the three sources with mm-RRL detections.
2.1 CRL 618
CRL 618 (aka RAFGL 618 = IRAS 04395+3601 = Westbrook Nebula) is a well-studied C-rich pPN currently going through the very early stages of PN development (e.g Westbrook et al., 1975; Wynn-Williams, 1977; Kwok & Feldman, 1981). The optical nebula consists of multiple elongated (jet/finger-like) lobes, roughly oriented in the E-W direction, composed of shock-excited gas rapidly outflowing from the central star with velocities of up to 180 km s-1 (Sánchez Contreras et al., 2002; Trammell & Goodrich, 2002; Riera et al., 2011; Balick et al., 2013). The lobes seem to be ‘cavities’ excavated in the AGB CSE via an interaction with a spray of clumps/bullets that resulted from brief, episodic, and asymmetric ejection events along multiple axes about a century ago (Balick et al., 2013; Velázquez et al., 2014; Huang et al., 2016). In the optical, the remnant of the AGB CSE is seen as a large-scale, roughly round reflection halo around the lobes (Trammell et al., 1993; Sánchez Contreras et al., 2002).
Most of the nebular material in CRL 618 is in the form of molecular gas (0.3 ), which has been very well studied based on high-angular resolution submm/mm-wavelength emission maps of CO and other molecules (Sánchez Contreras & Sahai, 2004; Sánchez Contreras et al., 2004; Lee et al., 2013a, b; Nakashima et al., 2007). The molecular envelope includes fast compact outflows that are aligned with the optical lobes with expansion velocities increasing linearly with the distance to the nebula center, up to 340 km s-1 (at the lobe tips). In addition, there are, at least, three distinct structures expanding at low velocity: a large equatorial torus with a dense compact core ( ≲ 12 km s-1), a thin-walled, bipolar shell encompassing the shock-excited optical lobes (22 km s-1), and an extended tenuous halo (16 km s-1) surrounding all other components.
The central star, which is hidden from direct view at optical wavelengths by a dusty equatorial torus, has been classified as B0 with an effective temperature of 30,000 ≲≲ 40,000 K (Westbrook et al., 1975; Schmidt & Cohen, 1981; Trammell et al., 1993; Balick et al., 2014).
Around the central star, there is a compact H ii region that produces free-free continuum emission (e.g., Wynn-Williams, 1977; Kwok & Feldman, 1981; Kwok & Bignell, 1984; Martín-Pintado et al., 1988). At cm-wavelengths, the ionized region shows an overall elliptical brightness distribution elongated in the E-W direction (Martín-Pintado et al., 1993). The continuum flux and size of the ionized core at cm-wavelengths have been increasing monotonically in the past three decades. In their discovery paper, Kwok & Feldman (1981) interpreted this result as the advance of the ionization front within the molecular envelope as a consequence of the increasing stellar . The rapid angular expansion of the nuclear H ii region, which had reached an angular size of 0502 ( 450180 au at =900 pc) at 22 GHz in 2008, has recently been studied in detail by Tafoya et al. (2013). These authors use high-angular resolution maps of the 1.5-43 GHz continuum emission at multiple epochs spanning over 25 years. Tafoya et al. (2013) demonstrate that the advance of the ionization front cannot explain the current expansion of the optically thick continuum-emitting region. These authors conclude that it is the optical depth of the free-free continuum at a given distance that increases with time, which is attributed to the rise of the electron density with time. This supports the idea that CRL 618 is expelling gas in the form of an ionized wind whose mass-loss rate has been increasing, from 4 to 6 yr-1, during the last century. Tafoya et al. (2013) establish the onset of the ionization around 1971.
The free-free continuum at mm-wavelengths, which is optically thin and, thus, probes denser and deeper (≲ 150 au) regions than the continuum at cm-wavelengths (optically thick), displays much abrupt and unpredictable flux changes that cannot be simply attributed to the smooth growth of the optically thick layers of the H ii region but most likely denote alterations in the activity and/or physical conditions of the post-AGB wind at its core (Sánchez Contreras & Sahai, 2004; Sánchez Contreras et al., 2004, see also Fig. 2).
CRL 618 is the only pPN in which mm-RRL emission has been reported prior to this work: the H41, H35, and H30 transitions (at 3.5, 2, and 1.3 mm, respectively) have been detected by Martín-Pintado et al. (1988). From the analysis of their single-dish spectra, which included LTE radiative transfer modeling of the line and continuum emission, these authors conclude that mm-RRLs trace a 13,000 K stellar wind with a terminal expansion velocity of 20 km s-1 and a mass-loss rate of 7.6 yr-1.
The distance to CRL 618 adopted in this work is =900 pc, as determined using independent techniques by Goodrich (1991), from a total luminosity criteria, and by Sánchez Contreras & Sahai (2004), from the analysis of proper motions of the fast expansion of the molecular gas in the lobes. The inclination of the nebular axis with respect to the plane of the sky is 30° (Sánchez Contreras et al., 2002; Sánchez Contreras & Sahai, 2004).
2.2 M 2-9
M 2-9, also known as the “Butterfly” or the “Twin Jet” nebula, is a bright bipolar nebula discovered by Minkowski (1947) and considered by many authors to be in the earliest stages of becoming a PN. In the optical, it shows a bright compact core from which two bilobed nested structures emerge oriented nearly north-south (Schwarz et al., 1997; Clyne et al., 2015). The brightness and morphology of the optical nebula have been changing notably on a timescale of a few years or less since its discovery (e.g., Allen & Swings, 1972; van den Bergh, 1974; Kohoutek & Surdej, 1980; Doyle et al., 2000). In particular, the main bright condensations (knots) in the lobes progressively shift in the west-east direction, which has been most recently interpreted as produced by a rotating collimated spray of high velocity particles (jet) from the central binary system, which excites the walls of the inner cavity of M 2-9 (Corradi et al., 2011). From the rotation period of the beam particles, these authors infer an orbital period of 90 yr.
Optical spectroscopic observations point to an expansive kinematics in the lobes, as for most pPNe and young PNe with expansion velocities ranging from 23 km s-1 in the inner nebula up to 164 km s-1 in the outer lobe tips (Schwarz et al., 1997; Torres-Peimbert et al., 2010; Clyne et al., 2015). The central core is dominated by H emission with 1600 km s-1-wide wings. The broad H profile could indicate ongoing ultra-fast winds, although H wing emission could be partially (or totally) broadened by other mechanisms, such as Raman scattering (Torres-Peimbert et al., 2010; Arrieta & Torres-Peimbert, 2003).
The central exciting star has been estimated to be of spectral type B1 and possibly late O, 35,000 K (Calvet & Cohen, 1978; Swings & Andrillat, 1979). As in the case of CRL 618, the large extinction and high-infrared excess observed are attributed to a dusty torus in our line of sight that prevents us from seeing the central star directly but allows it to illuminate the lobes. The binarity of the nucleus of M 2-9 has been observationally established by Castro-Carrizo et al. (2012), hereafter CC12. Interferometric 12CO (=21) emission maps with subarcsecond-resolution by these authors show two coaxial, slightly off-centered rings lying in the equatorial plane of the nebula. These rings have been interpreted as the result of two short mass ejections produced at different positions in the binary orbit. The rings lie at a plane that is inclined with respect to the line of sight by 171° (Castro-Carrizo et al., 2017).
M 2-9 is known to be a source of thermal radio continuum emission. According to Kwok et al. (1985), two components are needed to properly fit the cm-wavelength data: a compact ionized wind at the center that produces free-free emission following a Sν∼[0.6-0.7] law, and high-density condensations located in the extended ionized lobes that produce a nearly flat continuum emission distribution. At mm-wavelengths, the contribution from the extended lobes to the observed continuum is small and the free-free emission from the compact ionized core together with thermal emission by dust dominate the observed continuum flux (Sánchez Contreras et al., 1998, and Fig 1). At cm-wavelengths, the continuum brightness distribution is elongated along the N-S (lobe’s) direction (Kwok et al., 1985; Lim & Kwok, 2000, 2003). At mm-wavelengths, the ionized core is expected to be very compact, ≲ 01, but its geometry is unknown. Based on VLA cm-continuum emission maps obtained in 1982, Kwok et al. (1985) deduce a major-to-minor axis ratio that decreases monotonically as the frequency increases, implying a nearly spherical brightness distribution at 80 GHz and beyond. However, based on a different set of VLA cm-continuum maps obtained in 1999, Lim & Kwok (2003) report a frequency-independent major-to-minor axis ratio of 2.5 (in the 1.3-to-6 cm wavelength range) that, if extrapolated to mm-wavelengths, would imply an elongated geometry at these high frequencies.
The distance to M 2-9 is very uncertain. Values spanning almost two orders of magnitude, from 50 pc to 3 kpc, are found in the literature. The two most accepted values derived from recent works are 650 pc, from the analysis of the proper motions of the expanding molecular rings at the nebula equator (CC12), and =1.30.2 kpc, from the analysis of the proper motions of the dusty blobs in the lobes (Corradi et al., 2011).
2.3 MWC 922
The evolutionary status of this, yet barely studied, dust/gas-enshrouded B[e] star is unclear. An evolved nature has been suggested based on similarities of its SED and nebular morphology with another well-known pPN, the Red Rectangle (e.g., Cohen et al., 1975; Waters et al., 1998; Bujarrabal et al., 2016). Based on the appearance of its surrounding nebulosity in the near-infrared, MWC 922 has been nicknamed the Red Square Nebula. Tuthill & Lloyd (2007) report -band adaptive optics imaging showing an X-shaped nebular structure, which extends for about 5″, with an equatorial dark band (running along PA46°) at the center. A similar square-like structure is observed in the mid-infrared (Lagadec et al., 2011). This nebular appearance may result from the projection of two twin opposing biconical lobes excavated in a dense dust-scattered halo, although illumination effects could be significant; for example, if the light from the central source is blocked by an inner dusty torus or disk at the nucleus.
The optical and infrared spectra of MWC 922 show a great amount of emission lines, including many recombination and forbidden Fe II lines but also transitions from neutral elements, e.g., O I, H2, etc (Allen & Swings, 1976; Rudy et al., 1992; Pereira et al., 2003; Wehres et al., 2014). A B 3-B 6 spectral class for the exciting star has been suggested by Rudy et al. (1992) based on the nebular emission line spectrum. These authors acknowledge that this classification is very uncertain (in fact, it would imply 12,000-17,000 K, which is not sufficient to produce significant photoionization) and propose an upper limit for the stellar temperature of 31,000 K based on the strength of the He I 10830Å line. A symbiotic nature is not favored by these authors given the lack of molecular absorption bands (very prominent in late-type giants) in the spectrum of MWC 922.
There is a bright compact radio continuum source associated with MWC 922, which has been studied by Rodríguez et al. (2012) using a 095066 angular resolution 3.6 cm radio continuum VLA map. In these maps, the ionized core is angularly resolved with deconvolved dimensions 018020. Continuum observations at 6 cm from the CORNISH project exist (Purcell et al., 2013); the corresponding flux is included in the SED shown in Fig. 1. The 6 cm radio continuum source is unresolved with 15-angular resolution.
The distance to MWC 922 is unknown. As mentioned by Tuthill & Lloyd (2007), if it lies within the Ser OB1 association then the distance is =1.7 kpc. If this (speculative) association is real then it may be consistent with a pre-main sequence nature for this object, which would still be linked to other young massive OB stars (but see discussion in § 6.3). We estimate the kinematic distance to MWC 922 from its radial velocity, =32.5 km s-1 (deduced from the centroids of the RRLs; see § 4), and its galactic coordinates (=17.9275°, =+00.6336°) by assuming a simple galactic rotation law and adopting a value for the A Oort constant of 14.4 km s-1 kpc-1 and a galactocentric radius of 8.5 kpc (Kerr & Lynden-Bell, 1986). We deduce values of 3 and 13 kpc, for the near and far kinematic distance, respectively.
The bolometric flux of MWC 922 computed by integrating its SED from 1 m to cm-wavelengths is 5800 kpc-2. At the far kinematic distance, this would imply a total luminosity on the order of a million , approaching that of the most luminous and massive (100 ) stars known in the Galaxy. At =1.7-3 kpc, the total luminosity is [1.7-5.4] , which is at the high end of the range for post-AGB objects (Bloecker, 1995). The foreground-ISM extinction toward the 7′7′ region around MWC 922 is 1.7-2.7 mag at a distance of 2-3 kpc (Zasowski et al., 2015). After applying the corresponding ISM extinction correction, the total luminosity deduced at =1.7-3.0 kpc is [1.8-5.9] .
3 Observations and data reduction
Observations have been carried out with the IRAM 30 m radiotelescope (Pico Veleta, Granada, Spain) using the new generation heterodyne Eight MIxer Receiver (EMIR; Carter et al., 2012). Spectra were taken in two observational campaigns in June/July and September 2015 (project 050-15).
We simultaneously used the E090 (at 3 mm) and E230 (at 1 mm) bands operated in dual sideband (2SB) mode. For all targets, we observed the 8 GHz-wide upper side band in dual (H+V) polarization. This enabled us to cover the 105-113 and 226-234 GHz frequency ranges simultaneously and, thus, to observe H39, H48, H49, H55, and 13CO (=10) at 3 mm together with H30 and 12CO (=21) at 1 mm. For CRL 618, MWC 922, and M 2-9, we also used a different receiver setup to survey the lower and upper side bands of each receiver at the same time in single (either V or H) polarization. This enabled us to expand the frequency coverage to the 89-97 and 210-218 GHz ranges, which include H41 and H51 at 3 mm and H31 at 1 mm.
The image sideband was rejected with an average sideband rejection of 14 dB. Each receiver was connected to the Fast Fourier Transform Spectrometer (FTS) in its 195 kHz spectral resolution mode (0.25 and 0.5 km s-1 at 1 and 3 mm, respectively). Observations were performed in wobbler switching mode with a wobbler throw of 120″ and frequencies of 0.5 Hz. Calibration scans on the standard two load system were taken every 15 min. Pointing and focus were checked regularly on nearby continuum sources. After pointing corrections, the typical pointing accuracy was 2″-3″. Average system temperatures were 130-200 K at 3 mm and 400-1000 K at 1.3 mm. On-source integration times are in the range 2-6.5 h per target and receiver setup.
The beam parameters of the IRAM 30 m telescope used in this work, that is, the half-power beam width (HPBW), the main beam efficiency (), and the point source sensitivity (/, i.e., the K-to-Jy conversion factor), are described to a good accuracy as a function of the frequency (, in GHz) by
| (1) |
according to measurement updates performed in August 2013222http://www.iram.es/IRAMES/mainWiki/EmirforAstronomers.
We reduced the data using CLASS333CLASS is a world-wide software used to process, reduce and analyze heterodyne line observations maintained by the Institut de Radioastronomie Millimetrique (IRAM) and distributed with the GILDAS software, see http://www.iram.fr/IRAMFR/GILDAS. following the standard procedure, which includes killing bad channels, subtracting baseline, and averaging individual good-quality scans to produce the final spectra. We obtained and presented the spectra in antenna-temperature () scale, which can be converted to main-beam temperature () applying =/ or to a flux scale using the K-to-Jy conversion factor given above.
The uncertainty in the relative calibration of our observations was estimated by comparing the spectra in the same spectral ranges, including the 12CO (=21) and 13CO (=10) transitions, every day. We estimate that the total line calibration uncertainty is 20% and 15% at 1 mm and 3 mm, respectively. The profiles of the bonus 12CO (=21) and 13CO (=10) transitions observed in this project are presented in Figures 9 and 10 of the Appendix.
3.1 Continuum measurements
We measured the continuum emission level (in a scale) within the different frequency ranges covered in these observations by fitting a low-order polynomial function to the spectral baseline in our data, which were obtained using the wobbler-switching method described above. For the sources that were observed in two epochs (June/July and September 2015), namely, CRL 618, MWC 922, M 2-9, and M 1-92, we obtained continuum measurements separately for both epochs and we find that the continuum levels in the two epochs are in agreement within 30% at 1 mm. The continuum flux uncertainty at 3 mm is probably lower than 20%.
For CRL 618, which is a strong (2 Jy) millimeter continuum emitter, we also measured the continuum from cross-scans in azimuth and elevation direction performed for pointing. After discarding a few obvious bad/noisy scans, we obtained final, weighted average scans444We used 1/ weights, where is the rms of the baseline of the cross-scan. for the four frequency ranges observed, centered at 93, 109, 214, and 230 GHz. Gaussian fits were applied to the average scans to derive the antenna temperature at the peak, which was converted to flux density using the frequency-dependent conversion in Eq. (1).
In CRL 618, the line emission flux contribution to the total flux in the continuum backend (8 GHz-wide) used for the pointing cross-scans is estimated 10% at 230 GHz, where the strong 12CO (=21) line lies, and less than 4% at the lower frequency ranges observed, and has been considered to derive the (line-free) continuum flux level. The value of the continuum flux obtained from the two methods (baseline fitting and cross-scans) agree to a 20% level.
4 Observational results
4.1 Continuum
Our continuum flux measurements at frequencies adjacent to the H39 and H30 lines, that is, at 2.7 and 1.3 mm, respectively, are given in Table 1 and are shown in Fig. 1 (red symbols). In all cases, we find continuum fluxes that are in good agreement with previous measurements at similar wavelengths (whenever available) within the absolute flux uncertainties. A fit to the mm-to-cm free-free continuum fluxes, after removal of the dust thermal emission contribution, was performed and is shown in Fig. 1 (dashed line). In the case of M 2-9, two free-free continuum components, one nearly flat and another one as , were used for the fit based on previous results at cm-wavelengths (Kwok et al., 1985, and § 2.2). To our knowledge, our IRAM 30 m data represent the first detection of the continuum flux at mm-wavelengths for MWC 922, M 1-91 (tentatively detected at 1 mm by Sánchez Contreras et al., 1998), IRAS 20462+3416, and M 2-56. For these sources, we find that the mm-to-cm free-free continuum is consistent with , with values of in the range 0.7 and 1.3.
The mm- and cm-wavelength continuum of CRL 618 has been observed many times during the last decades and is known to be variable, alternating periods of brightening and weakening at mm-wavelengths (§ 2.1). In Fig. 2 we show an updated light curve of the continuum near 1mm including our recent measurement from this work.
The free-free continuum of CRL 618 is nearly flat at mm-wavelengths, which is consistent with optically thin emission and follows at longer wavelengths (Fig. 1). Our data (and model presented in § 5) are consistent with a turnover frequency ≲ 80-90 GHz in 2015, in agreement with the value of obtained in 1998 (Wyrowski et al., 2003). At earlier epochs, the turnover frequency of the free-free continuum was larger, in particular, 100-200 GHz in 1987 (Martín-Pintado et al., 1988). The decrease of with time could imply a decrease of the emission measure from EM(1.60.9) to 5.5 cm-6 pc (adopting =13,000 K). However, this simplistic interpretation is only correct if the physical conditions in, and geometry of, the ionized core have remained unaltered, which seems unlikely given the rapid unforeseen changes of the mm-continuum emission (Fig. 2 and § 2.1); for example, a variation of the electron temperature from 10,000 to 18,000K would result in a shift of from 150 to 100 GHz for the same value of EM1.1 cm-6 pc.
In the case of the pPN M 2-9, our continuum data (both at 1 and 3 mm) appear to be systematically lower than all previous published measurements at these wavelengths. This, together with the scatter of the continuum (ancillary) data points in the mm- and cm-wavelength domain could reflect time variability of the free-free emission in M 2-9.
The pPN Hen 3-1475 is another object in our sample with flux-density variations. A possibly periodic pattern and an inversion of its spectral index on a timescale of a few years have been suggested from previous multifrequency high-angular resolution radio observations (Cerrigone et al., 2011).
In the case of M 1-92, M 1-91, and IRAS 204623416, the continuum flux at ≳ 3-4 cm clearly exceeds that expected by extrapolating the trends observed at lower wavelengths, including the mm-range. This could be due to contaminating foreground/background emission sources, strong continuum variability, or additional superimposed free-free emission components with different contributions at cm- and mm-wavelengths (e.g., analog to the faint, extended emission from the lobes of M 2-9, § 2.2).
4.2 Recombination lines
We have detected radio recombination line emission at mm-wavelengths for three (out of a total of eight) sources: CRL 618, M 2-9, and MWC 922 (Figs. 3, 4, and 5). The main line parameters directly derived from the observed profiles are given in Table 2. In Fig. 6, we plot the flux, full width at half maximum (FWHM), and centroids of the hydrogen RRLs detected as a function of their rest frequencies. The rms noise of the spectra for RRL non-detections are given in Table 3. These undetected sources are rather weak mm-continuum emitters, which anticipate low mm-RRL intensities below our detections limits (see § 5.4).
| Linea𝑎aa𝑎aStandard line notation, i.e., level transitions with =1, 2, or 3 for , , and lines, respectively. | Frequency | FWHM | rmsb𝑏bb𝑏bFormal rms noise for a 3 km s-1 resolution, as in Figs. 3-5. Baseline subtraction or absolute calibration uncertainties are not included.
|
|||
|---|---|---|---|---|---|---|
| (GHz) | (K km s-1) | (km s-1) | (km s-1) | (mK) | (mK) | |
| CRL 618 | ||||||
| H41 | 92.03443 | 9.020.12 | 24.30.3 | 47.60.8 | 178 | 4 |
| H39 | 106.73736 | 11.900.05 | 24.00.1 | 46.50.2 | 240 | 2 |
| H31 | 210.50177 | 16.40.2 | 23.60.2 | 38.30.6 | 403 | 12 |
| H30 | 231.90093 | 20.20.1 | 22.90.1 | 37.10.2 | 512 | 5 |
| H51 | 93.60732 | 1.70.1 | 22.91.7 | 603 | 27 | 4 |
| H49 | 105.30186 | 2.170.04 | 22.60.5 | 59.41.2 | 34 | 2 |
| H48 | 111.88507 | 2.260.06 | 23.40.6 | 53.21.5 | 40 | 4 |
| H55 | 109.53600 | 0.310.12 | 234 | 2314 | 12 | 6 |
| He41 | 92.07194 | 0.760.07 | 25.01.8 | 425 | 17 | 4 |
| He39∗*∗*Uncertain due to line blending; line center and width fixed to match the corresponding H39 values. | 106.78085 | 1.100.04 | 24.00.0 | 46.50.0 | 22 | 2 |
| He30 | 231.99543 | 2.080.13 | 23.51.2 | 424 | 46 | 5 |
| M 2-9 | ||||||
| H41 | 92.03443 | 7 | ||||
| H39 | 106.73736 | 0.320.02 | 75.51.5 | 40.93.1 | 7 | 1 |
| H31 | 210.50177 | 27 | ||||
| H30 | 231.90093 | 0.790.07 | 73.71.6 | 34.74.1 | 21 | 5 |
| H51 | 93.60732 | 6 | ||||
| H49 | 105.30186 | 2 | ||||
| H48 | 111.88507 | 3 | ||||
| H55 | 109.53600 | 2 | ||||
| MWC 922 | ||||||
| H41 | 92.03443 | 0.690.18 | 295 | 4013 | 16 | 8 |
| H39 | 106.73736 | 0.890.03 | 32.30.5 | 32.51.2 | 26 | 2 |
| H31-blue∗∗**∗∗**The blue and read intensity peaks of the two-horned profile of the H30 and H31 lines in MWC 922 were fitted using two Gaussians. | 210.50177 | 3.00.5 | 19.21.2 | 153 | 190 | 40 |
| H31-red∗∗**∗∗**The blue and read intensity peaks of the two-horned profile of the H30 and H31 lines in MWC 922 were fitted using two Gaussians. | 210.50177 | 2.80.5 | 45.11.6 | 184 | 150 | 40 |
| H30-blue∗∗**∗∗**The blue and read intensity peaks of the two-horned profile of the H30 and H31 lines in MWC 922 were fitted using two Gaussians. | 231.90093 | 2.850.09 | 19.10.3 | 17.90.7 | 150 | 6 |
| H30-red∗∗**∗∗**The blue and read intensity peaks of the two-horned profile of the H30 and H31 lines in MWC 922 were fitted using two Gaussians. | 231.90093 | 3.00.1 | 46.20.3 | 20.70.8 | 134 | 6 |
| H51 | 93.60732 | 8 | ||||
| H49 | 105.30186 | 0.120.02 | 383 | 297 | 4 | 2 |
| H48 | 111.88507 | 0.220.04 | 373 | 367 | 6 | 3 |
| H55 | 109.53600 | 3 | ||||
| Line | Freq. | rms (mK); 5 km s-1 | ||||
|---|---|---|---|---|---|---|
| (GHz) | He 3-1475 | M 1-91 | M 1-92 | 20462 | M 2-56 | |
| H39 | 106.7 | 2.4 | 1.3 | 1.1 | 1.3 | 1.0 |
| H30 | 231.9 | 8.6 | 2.7 | 2.6 | 3.3 | 1.8 |
| H49 | 105.3 | 2.8 | 1.3 | 1.2 | 1.2 | 0.9 |
| H48 | 111.9 | 3.6 | 1.6 | 1.7 | 1.8 | 1.2 |
| H55 | 109.5 | 3.5 | 1.6 | 1.7 | 1.8 | 1.3 |
The strongest RRLs are observed toward CRL 618, which also shows the strongest mm-wavelength continuum. We detect a total of eight hydrogen recombination lines (, , and ) together with helium -transitions (Fig. 3). The RRLs appear to be partially blended with some of the many molecular transitions with composite emission and absorption profiles that crowd the submm/mm spectrum of this object (see, e.g., Pardo et al., 2007). The profile of the weak H55 line is the most adversely affected by deep adjacent absorptions.
We find significant changes in the spectral profiles and total fluxes of the H41 and H30 lines of CRL 618 relative to the observations performed in 1987 by Martín-Pintado et al. (1988). In particular, these RRLs are now a factor 2-3 more intense and 20-60% broader than 29 years ago. This is not totally unexpected given the obvious variability of the free-free continuum emission observed over many years (§ 2.1 and Fig.2), and suggests changes with time of the physical conditions at the inner regions around the central source. In M 2-9, weak emission from the H30 and H39 lines and, tentatively, from the H31 and H41 transitions is detected (Fig. 4).
In MWC 922, we detect the four Hn transitions observed in this work plus the weaker H48 and H49 lines (Fig. 5). In contrast to CRL 618 and M 2-9, in this source there is an evident drastic change from single-peaked to double-peaked profiles in the Hn lines at 3 and 1 mm. A similar transition from single-peaked profiles of RRLs near 3 mm (and at cm-wavelengths) to double-peaked profiles of the RRLs near 1 mm was observed for the first time toward the ultra-compact H ii region of MWC 349A by Martín-Pintado et al. (1989a, b). These authors showed that, in this case, the two-horned line profiles result from maser amplification of the emission from a rotating ionized disk. As we see in § 5.3, we reach a similar conclusion for MWC 922 that, thus, adds to the (yet short) list of sources where mm-RRL masers have been discovered to date; to our knowledge, these include MWC 349A, Carinae, Cepheus A HW2, and MonR2-IRS2 ( see Martín-Pintado et al., 1989a; Cox et al., 1995; Jiménez-Serra et al., 2011, 2013; Abraham et al., 2014).
There are a few general observational results that can be readily seen in Fig. 6 and are summarized here:
[-] The line strength of the RRLs with the same increases with the frequency with MWC 922 showing the steepest slope. In particular, for the -transitions, the slope in this target clearly deviates from the dependency expected in case of optically thin LTE emission (e.g., Rodríguez et al., 2009). This is in agreement with the presence of maser amplification of the high-frequency lines. Non-LTE emission conditions are also inferred in the case of CRL 618 from the -to- line ratios, which depart from the theoretical predictions under LTE (e.g., Peters et al., 2012).
[-] The line widths of the -transitions range between FWHM 30 and 50 km s-1 and, thus, they are larger than expected from thermal motions alone (e.g., the sound speed is 13 km s-1 for ionized gas with an average electron temperature of 10,000 K, typical of H ii regions). As discussed in § 5, this indicates macroscopic ordered motions of the bulk of the gas at moderate speeds of 10-30 km s-1. We cannot rule out the presence of broad (30 km s-1) emission wings below our detection limits, i.e., at 20% of the line peak.
[-] The Hn line width increases with increasing quantum number in CRL 618 and (tentatively) M 2-9, but the opposite behavior is found for MWC 922. The high- transitions trace more tenuous regions than lower- lines (at higher frequencies and, thus, with continuum emission optically thinner). Therefore, assuming that the density in the ionized region falls off with the distance to the center (), the trend observed in CRL 618 and M 2-9 suggests that the gas velocity increases with , which is consistent with an expanding wind. In the case of MWC 922, the spectra seem more consistent with a rotating disk/wind, where one expects the rotation speed to decrease with . In CRL 618, the widths of the -lines are systematically higher than the -lines at comparable frequencies. This is partially due to line blending and poor baseline subtraction related uncertainties, which happen to be on average more severe in the -transitions, but also due to larger pressure broadening for the -lines compared with the -lines predicted by theory (e.g., Brocklehurst & Seaton, 1972; Walmsley, 1990; Strelnitski et al., 1996; Peters et al., 2012, and § 5).
[-] The centroids of RRLs provide us with an estimate of the line-of-sight velocity of the bulk of the ionized gas (and, plausibly, of the ionizing star that lies at the center). Using the Hn profiles, with the highest S/N, we find =23.50.2 km s-1 for CRL 618, =752 km s-1 for M 2-9, and =32.50.4 km s-1 for MWC 922. In the case of CRL 618, our data are consistent with a progressive velocity shift toward the blue at low frequencies (Table 2 and Fig. 6). Although tentative, the small velocity shift could be caused by the gradual decrease of the optical depth of the lines with the frequency (e.g., Martín-Pintado et al., 1988). In an outflowing gas, the optically thicker, lower frequency RRLs mainly trace a major part of the gas from the front (blue-shifted) of the nebula, since part of the emission from the back side (red-shifted) is absorbed through the line+continuum emitting region. If this is the case, the 1 mm lines are expected to be centered closer to the line-of-sight velocity of the ionizing star of CRL 618 (see § 5.1).
5 Radiative transfer model
In order to constrain the structure, physical conditions, and kinematics of the emerging ionized regions of CRL 618, MWC 922, and M 2-9, we modeled their free-free continuum and mm-RRL emission using the non-LTE radiative transfer code MORELI (MOdel for REcombination LInes), which is described in detail in Báez-Rubio et al. (2013).
The MORELI code considers a given geometry (with spherical or cylindrical symmetry) for the ionized region. The electron density is assumed to decrease with the distance to the central star following a power law of the type . Also, MORELI takes the electron temperature, (), and a given velocity field as inputs. For simplicity, and since the exact gas kinematics cannot be precisely determined from single-dish observations, in our models the velocity field is described by radial expansion (at constant velocity or increasing, linearly or asymptotically, with ) and/or Keplerian rotation (see Sections 5.1 to 5.3 for more details). In addition to the gas macroscopic motions, thermal broadening and electron impact (pressure) broadening from high-density gas are included in the line profile function. Turbulence velocity dispersion is not considered as an additional form of line broadening since it is expected to be very small (2-3 km s-1) in the envelopes of AGB and post-AGB objects (e.g., Schöier et al., 2004; Bujarrabal et al., 2005; Decin et al., 2010) and, thus, negligible compared to other broadening terms.
The MORELI code predicts the free-free RRLs and continuum emission by solving the equation of radiative transfer and integrating the intensity along the line of sight. The ionized region starts at minimum radius, , which in principle could be the stellar photospheric radius; this region extends up to a distance that is a few times larger than the radius that encircles a major percentage (90%) of the observed fluxes, which is referred to as the effective outer radius 666The terms (90%) and (99%), which are also explicitly given in some cases (e.g., Table 5), refer to the radius that encircles 90% and 99% of the mm-continuum flux, respectively.. Thomson electron scattering is commonly neglected, to a first approximation, to solve the radiative transfer problem for recombination lines at millimeter wavelengths (e.g., Peters et al., 2012). The effect of this process is, in general, weak and high electron concentrations of 108-1012 cm-3; in electron-scattering, regions of sizes of a few10 au are needed to cause a measurable effect (Arrieta & Torres-Peimbert, 2003; Sekeráš & Skopal, 2012).
The hydrogen non-LTE level populations are computed in MORELI using departure coefficients, , which are defined as the ratio between the actual level population for the principal quantum number, , and its value in LTE (/). Computations of the coefficients are available in the literature for as low as 20 and for a broad range of electron densities and temperatures (typically, 10-108.5 cm-3 and 5000-15000 K; Salem & Brocklehurst, 1979; Walmsley, 1990; Storey & Hummer, 1995, and references therein). The factors computed by different authors for the same values of and do not fully agree. The uncertainties in the coefficients have a major impact on the accuracy to which we can reproduce the intensity of RRLs where stimulated emission appears to be present. It is particularly critical in the case of the H30 and H31 maser lines in MWC 922 (§ 4.2). The coefficients from Storey & Hummer (1995) were found to provide the best fit of the maser transitions in MWC 349A (Báez-Rubio et al., 2013) and we systematically used these for our targets.
The relative intensities of the RRLs and the line-to-continuum flux ratios observed in M 2-9 are consistent with LTE conditions (or, at most, with small non-LTE effects) and, therefore, the line profiles were modeled with MORELI in LTE mode in this case. In MWC 922 and CRL 618, however, there was a need for more general non-LTE calculations and we performed these calculations to reproduce simultaneously the - and -profiles observed at different frequencies.
In all cases, we explored a broad range of physical conditions until we obtained a reasonable match between the model predictions and mm-wavelength line and continuum observations. Our model also provides reasonable predictions for radio continuum data at longer wavelengths (whenever available), such as the total cm-to-mm free-free continuum flux and the angular size frequency dependence. In general, we tried to keep the number of model input parameters as low as possible given the data available.
As shown by, for example, Lee et al. (2007) and Báez-Rubio et al. (2013), the mass-loss rate is almost exclusively constrained by the flux of the free-free continuum, which has a moderate observational uncertainty of 30% (§ 3). The other two main sources of uncertainty in the mass-loss rate are the expansion velocity and distance to the source. Except for MWC 922 (see § 5.3), the expansion velocity of the bulk of the ionized wind is rather well constrained, with a 20% accuracy, from the widths of the RRLs. For the distances adopted, we find that the range of possible mass-loss rates that can reproduce the observed continuum, and are also consistent with the line profiles, are always within a factor 2 of uncertainty. The spatio-kinematics and electron temperature stratification across the ionized mm-wavelength emitting layers critically determine the shape and intensity of the RRLs, but have a rather limited effect on the continuum flux. The expansion velocities and temperatures are then mainly constrained by the fit of the single-dish profiles and should be taken as representative average values within the ionized regions under study.
The modeling results and their main uncertainties are described for each of the modeled sources in the next subsections.
| Parameter | CRL 618 | M2-9 |
|---|---|---|
| Distance () | 900 pc | 650 pc |
| LSR Systemic velocity () | km s-1 | 75 km s-1 |
| Geometry | cylindrical††{\dagger}††{\dagger}For CRL 618 and M 2-9, we assume a cylindrical H ii region with an outer radius at the base (i.e., along the nebula equator) and a central spherical cavity with inner radius . The cylinder extends to infinity along the major axis, where 90% of the mm-continuum is produced within 110 au and 50 au along the axis, respectively. | cylindrical††{\dagger}††{\dagger}For CRL 618 and M 2-9, we assume a cylindrical H ii region with an outer radius at the base (i.e., along the nebula equator) and a central spherical cavity with inner radius . The cylinder extends to infinity along the major axis, where 90% of the mm-continuum is produced within 110 au and 50 au along the axis, respectively. |
| Inner radius () | 45 au | 0.05 au (2 au) |
| Outer radius () | 95 au | 160 au |
| Electron density () | 2.4()-2.0 cm-3 | 6.4()-2.1 cm-3 |
| Electron temperature () | 16500 K | 7500 K |
| Kinematics | radial expansion | radial expansion |
| Velocity () | )0.75 km s-1 | 22 km s-1 |
| Kinematic Age () | 15-20 yr | ≲ 15 yr |
| Inclination () | 24° | 17° |
| Mass-loss rate () | 8.4() yr-1 | 3.9() yr-1 |
| Ionized mass () | 2.0 | 5.5 |
| Parameter | MWC 922 |
|---|---|
| Distance () | 1700 pc |
| LSR Systemic velocity () | 33 km s-1 |
| Geometry | double-cone‡‡{\ddagger}‡‡{\ddagger}Double-cone geometry as described in § 5.3 and depicted in Fig. 3 of Báez-Rubio et al. (2013). |
| Double-cone’s semi-opening angle () | 25° |
| Inclination () | 0° |
| Inner radius () | 0.05 au (35 au) |
| Electron density () | 9()-2.4exp() cm-3 |
| Electron temperature () | 6700 K |
| Opening angle of the ionized disk () | 6.5° |
| Ionized disk’s outer radius () | 50 au |
| Ionized outflow’s outer radius () | 150 au |
| Ionized outflow’s velocity () | 5 km s-1 (radial expansion) |
| Keplerian rotation velocity () | 32.6/ km s-1 |
| Mass-loss rate () | 2() yr-1 |
| Ionized mass () | 3.6 |
5.1 CRL 618
Based on previous works (§ 2.1), as a simple model of the ionized core of CRL 618, we adopted an isothermal stellar wind represented by a cylinder of ionized gas with a central cavity around the star, constant electron temperature, and an inverse-square density profile. This is similar to the model used by Martín-Pintado et al. (1988) to fit their H41, H35, and H30 spectra and continuum emission observed in 1987. The presence of a central cavity, with radius , was originally proposed by these authors to explain with this simple model the nearly flat (optically thin) free-free continuum at mm-wavelengths and, at the same time, the strong continuum emission and large emission measure deduced (EMfew-1011 cm-6 pc).
The outer radius of the cylinder (along PA0°) was set to 95 au, which is the size of the minor semi-axis of the H ii region expected in 2015 adopting the growth function = 0.03( deduced by Tafoya et al. (2013). As shown by these authors, the measured minor axis of the cm-continuum, which remains basically constant at all frequencies, pinpoints the locus of the ionization front along these dense equatorial regions. In the direction of the lobes (PA90°), the ionization front was already at distances ≳ 600 au in 1998 and is probably near 800 au at present. In our model, the cylinder extends out to infinity along its major axis. It is not necessary to truncate the cylinder at 600-800 au because the ionized wind layers farther out would not contribute appreciably (0.001%) to the mm-RRLs/continuum emission.
The input parameters of the best-fit model for CRL 618 are given in Table 4. The synthetic spectral Hn profiles are overimposed to the observed spectra in Fig. 3. The line peak intensities and their FWHM are well reproduced within a ≲ 15%. Our model recreates the progressive blue-shift of the line centroids as the frequency decreases, as observed (see § 4.2). This is due to the moderate line optical depth effects in this source, which produce an overall velocity shift toward the blue relative to the line-of-sight velocity of the ionizing star, adopted to be (LSR)=19 km s-1 in our model. The free-free continuum emission in the mm-to-cm regime predicted by our model is also in very good agreement with the observational data (Fig. 8).
We find a characteristic electron temperature of 16,000-17,000 K, which is somewhat larger than the value obtained assuming LTE conditions by Martín-Pintado et al. (1988). The bulk of the mm-RRLs/continuum emission is produced inside the adopted cylindrical structure within a distance along its major axis (or semi-length) of (90%)110 au. The electron densities range between 2 and 4 cm-3 in the mm-RRLs/continuum emitting region. This is in very good agreement with the values deduced by Tafoya et al. (2013) extrapolating their density law, which applies to the 150-650 au layers, to the inner wind regions. We find that an inverse-square density profile yields satisfactory model predictions, however, both the RRL profiles and the mm-to-cm SED can also be reproduced with slightly different values of the power-law index, in particular, with the steeper gradient, , proposed by Tafoya et al. (2013). Finally, since we are able to explain our single-dish data suitably with a latitude-independent density law, we have not attempted any models with equatorially enhanced density profiles. We do not conclude that there is no equatorial overdensity present in the ionized wind, but increasing the model parameter space is undesirable with the data available since it would not provide a more accurate characterization of the density structure of the inner wind regions under study.
We chose to model the wind kinematics using an asymptotic expansion velocity law similar to what is commonly used to model the dust/wind acceleration region of mass-losing stars (Table 4). This law reproduces the broader profiles of the 3 mm Hn lines compared to the 1 mm transitions. We emphasize that, in the absence of spatially resolved maps of the emission of mm-RRLs, it is not possible to accurately determine the exact velocity field in the ionized core. From the observed profiles, and taking into account that the 1 mm and 3 mm lines arise in neighboring layers, probably only 10 au apart from each other, we deduce that there must be a steep rise of the expansion velocity at these small spatial scales. In particular, the data are consistent with a minimum expansion velocity of 7-12 km s-1 at the innermost regions of the wind (probably near 40-60 au) and 20-25 km s-1 near the outer boundary of the modeled region (70-90 au). The observed profiles can also be reproduced with different velocity fields (e.g., with or ) as long as the full range of expansion velocities observed (10-20km s-1) is preserved. The expansive kinematics inferred imply a kinematical age for the inner wind layers of only 15-20 yr. Our model also reproduces very well the broader profiles of the -transitions, which confirms that, as expected from theory, these lines undergo pressure broadening.
The radius of the central cavity required in the model adopted is rather uncertain and, if it exists, it can only be well determined with spatially resolved observations at mm-wavelengths. Although the model presented in Table 4 provides the best fit to the data, larger values of are also acceptable (up to 70 au). The larger the size of the cavity, the larger the mass-loss rate that is required to keep the mm-continuum emission at the observed flux level. For example, if 70 au, a mass-loss rate of 1.1 yr-1 is necessary. In the case of a bigger cavity the velocity gradient across the 1 mm- and 3 mm-emitting layers should also be larger.
Our final model also reproduces the frequency-dependence of the major and minor axes sizes of the cm-continuum deduced by Tafoya et al. (2013) based on their detailed analysis of VLA 1.4-23 GHz continuum maps observed in the period 1982-2007. In principle, a good fit to the cm-continuum maps observed in the past should not be a strict requirement for our models because our mm-wavelength observations probe the optically thin (≲ 110 au) part of the ionized wind that was ejected in the last 15-20 years. But the cm-wavelength observations trace the outer regions, 150-630 au, of an older wind that was ejected at earlier times during the last century. We chose to roughly reproduce simultaneously ancillary cm-continuum data to avoid extremely abrupt changes in the inner and outer wind properties.
5.2 M 2-9
As explained in § 2.2, the free-free continuum emission of M 2-9 at millimeter wavelengths is expected to be dominated by the compact ionized wind at the core of the nebula, with a positive spectral index, 0.7. The mm-RRLs observed are also most likely produced in this ionized wind. The spectral distribution of the continuum, with no apparent changes in the spectral slope over 10-230 GHz range, suggests that the free-free emission is optically thick at mm-wavelengths. In fact, this emission probably becomes optically thin for frequencies 230 GHz alone since no transition to a flat continuum spectrum is observed at lower frequencies. However, without angularly resolved maps of the continuum at millimeter wavelengths, a separate, accurate determination of the spectral index of the core and extended lobes is not possible.
As in the case of CRL 618, we modeled the compact ionized core of M 2-9 as an isothermal cylindrical wind that expands radially, which is the simplest structure that is consistent with the elongation of the radio core observed at cm-wavelengths. The input parameters of our best-fit model are given in Table 4 and the predicted RRL profiles and free-free continuum emission from the compact ionized wind are shown in Figures 4 and 8.
The spectral index of the compact ionized wind continuum is well reproduced with an electron density gradient with a power index of =2.1 and electron density of 6 cm-3 at 45 au, resulting in a current mass-loss rate of 3.9 yr-1. We also derive an upper limit for the inner radius of the H II region of 2 au, which is needed to explain the turnover frequency at 230 GHz, as previously stated (Fig 1). The bulk of the RRL and continuum emission at millimeter wavelengths arises within the 5-50 au inner layers of the ionized wind.
We find that an LTE electron temperature of 7,500 K reproduces well the velocity-integrated line to free-free continuum flux ratios (LTCR) observed for all -transitions. This implies a value for the sound speed of 11 km s-1. The isothermal assumption reproduces the LTCR frequency dependence observed, LTCR , which is expected under LTE conditions (see, e.g., Mezger & Hoglund 1967).
The trend of decreasing line width with increasing frequency guessed from the H profiles of M 2-9 (Fig. 6) suggests radial expansion with a positive velocity gradient, as for CRL 618. As a first approximation we assumed constant radial expansion because in this case the trend is only tentative and the inferred velocity difference between the inner and outer layers of the ionized wind (where the H30 and H39 emission is produced, respectively) is small (4 km s-1). Under this assumption, the RRL profiles are reasonably well fitted assuming 22 km s-1 and a systemic velocity of =75 km s-1. Unlike for CRL 618, the optical depth of the mm-RRLs is very small (1) over the bulk of the emitting region of M 2-9 and, therefore, the line centroids are predicted to be well centered on the adopted systemic velocity.
Finally, our simple cylindrical model is able to reproduce the RRL profiles and free-free continuum at mm-wavelengths produced at the compact core of M 2-9, but our model (moderately) underestimates the continuum flux density from the core at wavelengths ≳3 cm. This is because a non-negligible fraction of the cm-continuum flux arises in the outer (160 au) layers of the ionized wind, which are being truncated, and thus excluded, in the cylindrical model along the equatorial direction. We used a cylindrical geometry based on the elongated shape of the cm-continuum brightness distribution observed by Kwok et al. (1985) and Lim & Kwok (2003). However, the model presented here mainly aims to constrain the properties of the inner regions of the ionized wind (5-50 au), where the free-free (RRL and continuum) emission at mm-wavelengths reported in this work arises and which are satisfactorily reproduced. Detailed modeling of the properties of the cm-continuum emission produced in the outermost regions of the ionized wind is beyond the scope of this paper.
We stress again that, as for the other targets, the simple model presented here is most likely not unique and that more complex geometries, kinematics, density, and temperature profiles (e.g., latitude-dependent) cannot be ruled out. In the particular case of M 2-9, we checked that a double-cone geometry, similar to that used for MWC 922 (see next section), could also reproduce the mm-wavelength data. In this case, to fit the widths of the mm-RRLs, the expansion velocity of the wind would have to be larger and the mass-loss rate moderately smaller (for example, 1.4 yr-1 for a semi-opening angle of 20° and =25 km s-1). High-angular resolution maps of the mm-continuum emission are needed to accurately determine the spatio-kinematic structure and physical conditions of the inner ionized wind layers of our targets.
5.3 MWC 922
The ionized core of MWC 922 has been represented by a double-cone geometry like that used for modeling the ultra-compact H II region MWC 349 A in Martín-Pintado et al. (2011) and, more recently, Báez-Rubio et al. (2013). This is based on the resemblance of the maser and non-maser RRL profiles of both sources and it is also consistent with the X-like morphology of the optical/NIR nebula surrounding MWC 922 (§ 2.3). The ionized emission is thus assumed to arise in two opposing conical structures. Each of these structures is formed by two nested cones co-axial with, and inscribed in, an extended neutral rotating disk. A sketch of this geometry is given by Báez-Rubio et al. (2013) in their Fig. 3. The outermost surface of the bicone (in contact with the neutral disk) has a semi-opening angle measured from its revolution axis to the midplane. The outer (shell-like) bicone has an angular width . The regions that are inside of (surrounded by) the innermost surface of the outer bicone, at colatitude , form the inner bicone. Regions of colatitude reside in the neutral disk, which is adopted to be edge-on.
The inner and outer ionized bicones can have different kinematics. The outer bicone is assumed to rotate in a Keplerian fashion, presumably sharing the same kinematics with the neutral disk in which this bicone is hypothetically inscribed. The outer bicone would then simply represent the thin conical surface of the rotating disk that is illuminated and photoionized by the central source. If the density above the disk is lower than that in the equatorial plane, the central star irradiates/ionizes the upper thin surfaces of the disk. We note that the disk material at low latitudes could remain largely neutral if the ionizing radiation is additionally blocked along the midplane by dust, for example, at the inner edge of a compact circumstellar disk. The inner bicone is modeled as a rotating and radially expanding wind; the same Keplerian rotation field adopted in the disk is vectorially added to a radial expansion field. The inner bicone could represent the stellar wind and/or gas photoevaporating from the ionized surface of the rotating disk. We refer to the inner and the surrounding outer bicone as the “ionized outflow” and the “ionized disk component”, respectively.
The gas in the rotating disk outside a certain radius is considered to be part of the outflow, that is, it is expanding and rotating. The value of is always chosen to be smaller than or equal to the disk gravitational radius, which is defined as the point where the Keplerian velocity ( escape velocity) and the sound speed are equal; the disk region outside the gravitational radius is no longer gravitationally bound to the central mass and it flows away freely (e.g., Hollenbach et al., 1994; Owen et al., 2012).
The electron density is assumed to vary throughout the disk and outflow as a function of the radial distance, following a power-law distribution and also as a function of the latitude, decreasing exponentially from the midplane toward the poles. In principle, our model enables the electron temperature to be different in the disk and outflow (but see below).
In Table 4 we give the input parameters of a model that successfully reproduces the mm-RRL profiles and the free-free continuum emission of MWC 922 (Figs. 5 and 8). This model predicts the observed transition from single-peak profiles at 3 mm to double-peak profiles at 1 mm, including the velocity peak-to-peak separation of the latter, and the steep increase of the Hn-line FWHM and intensity as a function of frequency; the latter is indicative of non-LTE conditions and, in particular, of H30 maser emission in this object. It also recreates the spectral continuum emission distribution from the mm- to the cm-wavelength range and the angular diameter (02=340 au at 1700 pc) of the 3.6 cm-continuum emitting region (§ 2.3).
Before discussing this model in detail, we stress that in the case of MWC 922, the geometry, kinematics, and electron temperature deduced are particularly uncertain. This is because of the extremely high sensitivity of the maser line intensity not only to small changes in the local physical conditions but also to the uncertain departure coefficients (§ 5). Our final model presented in Table 4 uses the coefficients by Storey & Hummer (1995), however, we also explored a large range of model parameters using the coefficients Walmsley (1990). Since the coefficients computed by these two groups differ significantly, the physical model needed to reproduce the observed line intensities are different when using one set of or the other. Irrespective of the set adopted, the biggest challenge is always to reproduce simultaneously the maser and non-maser RRL profiles observed.
Most of the mm-wavelength free-free emission observed in MWC 922 arises in a rather compact region within 150 au. In particular, 90% of the RRL and continuum emission at 1 and 3 mm arise in the inner (10-80 au) and outer (20-150 au) parts of the central ionized core, respectively. The full extent of the H II region is probably larger as suggested by the 3.6 cm-continuum maps. The inner radius of the ionized core of MWC 922 is poorly determined from these data since the deepest ionized layers at 10-15 au are very optically thick at mm-wavelengths and thus are not probed by our mm-RRL profiles. We chose a nominal inner radius in our model of =0.05 au, which is equivalent to 1 , adopting the values of and luminosity given in Table 1. As for M 2-9, we derive an upper limit to the radius of an hypothetical central cavity, which could be devoid of ionized gas, of 35 au; this is the largest cavity radius that would still reproduce the uniform spectral index of the free-free continuum as observed, which indicates optically thick emission from cm wavelengths up to 230 GHz (at least).
The electron temperature distribution in the ionized core can only be poorly constrained from single-dish data. Initially, the temperature has been enabled to be different in the disk and in the outflow, however, for the geometry and opening angle adopted in our final model, the temperature in the disk and outflow have to be comparable to reproduce simultaneously the observed maser and non-maser profiles, 6500-7000 K.
The electron density rapidly declines from the ionized surface/layer of the rotating disk toward the poles. Along =+, i.e., within the thin ionized layer of the disk, the density ranges from 107 to 105 cm-3, following a power law, across the 15-150 au layers that emit the bulk of the continuum and emission of RRLs at mm-wavelengths. The density falls off by a factor of 20-30 across the full width of the ionized disk, , and continues to decrease rather steeply across the ionized outflow, dropping by 5 dex at the revolution axis.
As discussed in § 4, the gradual increase of the width of the Hn profiles as a function of frequency is consistent with Keplerian rotation. To explain the velocity peak-to-peak separation observed in the H30 maser line, we considered a central mass of 8 , which is equivalent to the rotation velocity field given in Table 4; we find that a range of 5-10 gives also acceptable predictions. The maser spike emission arises mainly in the Keplerian disk, at radial distances 35-55 au, because this region has the geometry (a high coherence length) and the densities, of 106-107 cm-3, required to produce strong maser amplification of the H30 line. The double-peaked profile of the H31 line, which is also indicative of stimulated non-LTE amplification, is well reproduced by our model. However, the intensity of the H31 line relative to the rest of the RRLs detected is always notably lower than observed for all models regardless of the physical conditions and kinematics adopted. For this reason, and given the extremely high uncertainties of the coefficients, in our final model, we used the same departure -coefficient for the H31 and H30 transition, which results in a much better model-data agreement.
In the ionized outflow, we adopted a constant expansion velocity of 5 km s-1, which is consistent with the profile of the non-maser H39 and H41 lines, and, in particular, with the lack of emission wings. Given the dimensions of the outermost regions of the ionized wind probed by our observations, 140 au, we derive a kinematical age for the outflow of 150 yr. This is a lower limit, since the outer boundaries of the ionized core of MWC 922 are not observationally constrained and could reach larger distances. The innermost layers of the outflow, for example, at =15 au, would have been ejected only 10 yr ago. The age of the rotating disk cannot be estimated from these data but it, in principle, it could be a much older long-lived structure.
Finally, we already mentioned the large uncertainties of the model input parameters in the case of MWC 922. From our multiple model runs, we conclude that it is also possible to reproduce the data used in this work adopting a larger opening angle for the ionized disk+outflow structure. For example, using 53°, we are able to find a set of physical parameters that satisfactorily explain the observations. One important difference with respect to the model in Table 4 is that, for a larger opening angle, the temperature in the ionized disk must be notably larger than in the outflow. In our opinion, the presence of a hot ionized thin disk sandwiched between two cooler structures (namely, the outflow and the neutral disk) is improbable.888For example, based on our theoretical and observational current understanding of photoevaporating disks; see, for example, Hollenbach et al. (1994); Yorke & Welz (1996); Báez-Rubio et al. (2013).
As for the other targets, we estimate an equivalent isotropic mass-loss rate for the outflow. For a constant expansion velocity of =5 km s-1, and considering that we are adopting a non-isotropic (bipolar) outflow with a latitude-dependent density, we find 1.8(1cos(25°))2 yr-1 for the value of =25° used in our model. As expected, the equivalent isotropic mass-loss rate does not notably change when using a different opening-angle, since it is mainly constrained by the free-free continuum flux. In particular, for 53°,we find 5.2(1cos(53°))2.0 yr-1. However, the nature of the outflow in MWC 922 is unclear (stellar wind and/or photoevaporating gas from the ionized disk) and, therefore, the meaning/interpretation of the rate derived is not straightforward.
5.4 Remaining targets: mm-RRL non-detections
We modeled the free-free continuum emission of the sample targets with no mm-RRL detections. This mainly aims at obtaining an estimate of the mass-loss rate for these objects as well. In the simplified model used in this case, we assume that the free-free emission arises in a spherical isothermal wind expanding at constant velocity. In particular, we adopt =15 km s-1, =10,000 K, and an electron density power-law of the type (). In this case, the free-free continuum is expected to vary with frequency as and, therefore, the parameter can be constrained from the spectral index of the free-free continuum (see, e.g., Rodríguez et al., 2009).
The main input parameters and synthetic free-free continuum emission of the best models are given in Table 5 and in Fig. 8. In all cases, we checked that MORELI predicts mm-RRLs with intensities below our detection limits. As we can see, most of the free-free continuum emission at mm-wavelengths arises at the very inner layers of the wind around the star, typically within (99%)≲ 130 au and, in some cases such as M 2-56, in regions as compact as (99%)≲30 au. The pPNe/yPNe with the most extended H II region is He 3-1475 (with (99%)800 au). In all but one case (He 3-1475), these inner layers represent very recent mass ejections that happened less than 15() years ago.
We find spectral indexes roughly consistent with inverse-square density laws except for M 2-56 and IRAS 20462+3416. In these two cases, a steeper radial density fall, as , is inferred, which may suggest a gradual increase of the mass-loss rate in recent times.
We derive characteristic mass-loss rates in the range [0.3-4] yr-1. We do not observe a clear trend between and the bolometric luminosity; there are rather luminous objects, namely, M 1-91 and M 2-56, with relatively low mass-loss rates of [2-3] yr-1, as well as dim sources, namely, IRAS 20462+3416, with relatively high mass-loss rates of [1-2] yr-1.
| Source | (90%) | (99%) | (6.68 au) | (90%) | (90%) | ||
|---|---|---|---|---|---|---|---|
| name | (au) | (au) | ( cm-3) | ( yr-1) | () | (yr) | |
| He 31475 | 185 | 840 | 6.2 | 2.18 | 4.4 | 1.7 | 60 |
| M 191 | 44 | 144 | 4.7 | 2.10 | 3.4 | 4.2 | 14 |
| M 192 | 40 | 132 | 4.1 | 2.10 | 3.0 | 3.5 | 13 |
| IRAS 20462 | 22 | 67 | 2.4 | 3.13 | 1.7 | 2.9 | 7 |
| M 256 | 12 | 24 | 7.0 | 3.50 | 5.0 | 2.3 | 4 |
6 Mass-loss history and evolutionary status
The emission from the mm-RRLs reported and modeled here allowed us to characterize the relatively dense, 106-8 cm-3, inner ( 10-100 au) ionized regions of three of our program objects: CRL 618, M 2-9, and MWC 922. Considering their expansion velocities and small extent (Table 4 and § 5), these inner regions probe very recent mass ejections events that happened less than 15-20 yr. This is probably also true for our sources with no mm-RRL detections, since there is no reason to expect remarkably different bulk gas motion speeds in these regions.
The mass-loss history in more ancient epochs (back to few thousand years ago) is relatively well known for CRL 618 and M 2-9 from previous works but, unfortunately, not for MWC 922 (§ 1). In the next subsections, we discuss our findings in the context of these former mass-loss episodes, the nature and evolutionary status of these objects.
6.1 CRL 618
In the case of CRL 618, we found a significant difference between the H30 and H41 line profiles (widths and peak intensity) and those observed in 1987 by Martín-Pintado et al. (1988). These changes are not totally surprising since our observations do not trace the same wind material as observed in the 1980s. This is because the expanding wind layers probed by the mm-RRLs observed 30 years ago by Martín-Pintado et al. (1988) have traveled 125 au outward during this time (at 20 km s-1) starting from their position in 1987 (at 70 au). Therefore, they are now beyond 195 au and outside the mm-RRL emitting regions. The changes in the line profiles observed are then indicative of wind variability, i.e., evolution with time of the wind properties.101010Incidentally, in the case of unperturbed wind expansion, the layers studied by Martín-Pintado et al. (1988) would have now entered the optically thick part of the ionized wind (encompassing 150-650 au; see Fig. 5 in Tafoya et al. 2013) and, thus, should be best traced at present by RRLs and continuum observations at cm-wavelengths.
The kinematic age of the layers of the post-AGB wind of CRL 618 observed by us is 10-20 yr (Table 4). The mass-loss rate deduced from our mm-RRL observations, 8.4 yr-1, is that of a post-AGB wind that was ejected in the 10-20 years previous to 2015. Similarly, the mass-loss rate deduced by Martín-Pintado et al. (1988), 7.6 yr-1, probably corresponds to a wind ejected in the 10-20 years previous to 1987. The slightly larger mass-loss rate estimated by us in more recent epochs is then in agreement with the trend deduced by Tafoya et al. (2013), who proposed that the mass-loss rate had increased (from 4 to 6 yr-1) in the 130 years previous to 1998. In this context, our result is consistent with a mass-loss rate that has continued to rise and, indeed, at nearly the same rate contemplated by Tafoya et al. (2013).
Martín-Pintado et al. (1988) considered a central cavity with radius 70 au in their LTE model of the ionized core of CRL 618. As explained in § 5, the size of this cavity, which could result from a short period of diminished mass-loss rate, is rather uncertain because of the degeneracy of the turnover frequency with and . However, we would like to mention that the presence of a cavity with a radius of 70 au in 1987 is not inconsistent with our data and model. This is because, as explained in the first paragraph of this section, the cavity (as the rest of the layers of the ionized wind) would have moved forward by 125 au in the last 30 years. Therefore, if the cavity hypothesized by Martín-Pintado et al. (1988) was real and its size in 1987 roughly correct, 30 years later, it should constitute a low-density shell at 195-265 au, i.e., beyond the ionized wind layers traced by our mm-wavelength observations. The fact that a cavity is also needed to explain the observations in 2015 could indicate another (periodically recurrent?) recent short intermission of the mass loss. In any case, we caution that the cavity is needed in the context of the simple model used here (Table 4). The cavity may not be a requirement if one adopts a more sophisticated model with a sufficiently complex geometry, density, temperature, and velocity stratification (for example, an inhomogeous wind with dense clumps).
Of course, the comparison of the mass-loss rates (and other parameters) derived from different works has to be carried out with extreme caution since these are affected by hardly quantifiable uncertainties that are inherent to the different analysis methods and assumptions adopted. Therefore, our conclusions about the overall increase of and intermittent reduced mass-loss rate intervals should be considered tentative.
The mass-loss history of CRL 618 in earlier epochs is written in its nebular architecture (§ 2.1). From detailed observations and modeling of its molecular envelope, two major large-scale, mass-loss episodes in the form of slow winds ( ≲ 17km s-1) have been identified. The first took place ≳ 2500 yr ago at a rate of ≲ 10-5 yr-1 and generated a tenuous extended halo. The second mass-loss event started 400 yr ago at very high rate of few-10-3 yr-1 resulting in the formation of a dense central core (Sánchez Contreras et al., 2004; Lee et al., 2013a; Soria-Ruiz et al., 2013). More recently, 200 yr ago, the interaction between fast bullet-like ejections and the pre-existing AGB circumstellar envelope probably shaped the optical lobes (Balick et al., 2013; Velázquez et al., 2014). The compact, fast ( 100km s-1) molecular outflows of CRL 618, with a kinematical age of 30-80 yr, could have been partially shaped by the mentioned bullet-like ejections or by a distinct, more recent (≲ 80 yr) collimated fast wind (Sánchez Contreras et al., 2004; Lee et al., 2013b; Huang et al., 2016).
The mass-loss rate at which the post-AGB wind was ejected over the last 150 years in CRL 618 is [4-8] yr-1 . Considering the whole range of values deduced including our work (see above), this mass-loss rate is then only moderately lower than the mass-loss rates of the slow AGB winds that led to the molecular extended halo and dense core. Given their low expansion velocity and high mass-loss rates, the halo and core were most likely ejected when the central star was ascending the AGB toward its tip and immediately before leaving this phase, respectively; this is when the most intense winds are believed to be blown out (e.g., Bloecker, 1995; Vassiliadis & Wood, 1993). Therefore, in the case of CRL 618, the drop of the mass-loss rate, which is believed to mark the end of the AGB phase (after the so-called “superwind”) and the beginning of the AGB-to-PN evolution, is rather modest, in particular, only about one order of magnitude lower than that of the core-wind, and comparable to that of the halo-wind.
6.2 M 2-9
Our mm-RRL observations trace the inner layers of a dense ionized wind at the core of M 2-9 that has been ejected at an average rate of 3.5 yr-1 and expansion velocity 22 km s-1 over the last ≲ 15 yr (Table 4). The mass-loss rate estimated by us is consistent (within uncertainties) with that obtained by Kwok et al. (1985) for the outer layers of the ionized core from their analysis of the cm-continuum emission maps (1.4-22 GHz, see also § 2.2). These authors find =3.3(/1600km s-1)(/kpc)3/2 yr-1, which is equivalent to =2.4 yr-1 after scaling it to the values of the distance and the expansion velocity in Table 4.
In 1982, the outer boundary of the ionized core of M 2-9 along the nebula axis was probably near 03 (200 au); beyond this radius most of the material remains neutral, as deduced from the cm-continuum maps presented by Kwok et al. (1985). Adopting the same expansion velocity measured by us, 22 km s-1, the wind layers traced by the cm-continuum observed by these authors must have been ejected in the 40-50 years previous to 1982 (the observing date), that is, sometime after 1932. Therefore, the current wind observed by us could have been ongoing with a constant or, at least, not markedly variable mass-loss rate of 3 yr-1 since it began at least 50 yr ago.
Prior to this, two other major mass-loss episodes have been identified in this object leading to two ring-shaped, eccentric molecular structures at the nebular equator mapped in CO emission by CC12; see also § 2.2. Recent 018-resolution CO emission maps obtained with ALMA confirm the spatio-kinematics of the two rings (Castro-Carrizo et al., 2017). These authors conclude that these two expanding rings were formed during two short mass-loss episodes (of duration 40 yr) produced when the mass-losing star was at different positions in the orbit of the central binary. This scenario is also supported by the different systemic velocities found for the two rings, =80.0 and 80.6 km s-1 (0.1 km s-1) for the outer and inner ring, respectively, which is readily explained if the mass-losing star changed its velocity due to its orbital motion within a binary (or multiple) system. CC12 proposed that the outer ring, with 2340 au and =7.80.1 km s-1, was ejected at a rate of 9 yr-1 about 1400 years ago, whereas the inner ring, with 780 au and =3.90.1 km s-1, would have occurred 900 yr ago at a slightly smaller rate. It is unknown whether the mass-losing central star of M 2-9 was in the late AGB or early post-AGB phase when the CO-rings were ejected, but the relatively high mass-loss rates (and low expansion velocities) observed are most consistent with a late-AGB status. The mass-loss rate of the younger ionized core-wind studied here (Table 4) is about two orders of magnitude smaller than that of the preceding mass outburst that led to the inner CO ring, and thus most consistent with a post-AGB evolutionary stage at present.
6.2.1 The central binary
We found a significant difference between the centroids of the mm-RRLs, =752 km s-1 (§ 4), and those of the CO lines. This difference is consistent with the scenario proposed by CC12 in which the mass-losing star is moving along its orbit; the centroid of the mm-RRLs would then correspond to the line-of-sight velocity of the star averaged during the last ≲ 10-20 years (when the inner layers of the ionized wind were ejected). The kinematical age of the inner wind layers probed by our mm-RRL observations only represents a small fraction (1/5) of the orbital period. We can obtain a lower limit to the orbital velocity of the mass-losing (primary) star of ≳(80.6-75)/(2*cos(17°))2.9 km s-1, which would imply an average distance to the center of mass of ≳ 8.7 au for an orbital period of 90 yr. With this limited knowledge of the orbital elements for only one of the stars (, the mass-losing star), we cannot derive the mass () and orbit of the secondary with certainty, but we can obtain some constraints by applying the well-known relationship between the binary mass function, , and the observables and . Assuming a circular orbit, the mass function, which is derived from the third Kepler’s law, is given by
| (2) |
where is the mass of the companion, is the dimensionless secondary-to-primary mass ratio =/; units are given in , au, and years for the masses (including ), semi-major axis, and period, respectively.
Using the lower limit to deduced above, we can also obtain a lower limit to the left hand of this equation, ≳ 0.08 and, thus, a lower limit to the mass of the companion relative to the primary. The mass of the primary star (), which is the stellar remnant after most of the envelope was ejected in the earlier red giant and AGB phases, is expected to be within 0.5-1 range (Schönberner, 1983; Bloecker, 1995; Vassiliadis & Wood, 1994). In particular, the low luminosity of M 2-9 (700-3000 at =650-1700 pc, Table 1) is most consistent with a low-mass progenitor (with an initial mass of ≲ 1 ) and, thus, with a low-mass stellar post-AGB core of about 0.5 (see § 7 and Fig. 7). Adopting =0.5 , the limit to implies that the companion mass must be ≳0.4 . The uncertainty in the systemic velocity of the RRLs, =752 km s-1, translate into a relative error of 50% in the mass of the companion, which could then be as low as 0.2 as derived from these data.
We now analyze the possible evolutionary status of the secondary for different values of the mass ratio. A main sequence companion would be consistent with a mass in the range ≳0.2 and ≲ 1 . Larger masses of the secondary (assuming a dwarf star) would be in conflict with its slower evolution relative to the low-mass (≲ 1 ) primary. In this case, the relative orbital separation would be 18-23 au. If the companion is a white dwarf (WD), the upper limit to its mass is 1.4 , which would imply a slightly larger orbital separation of 25 au. If this is the case, then M 2-9 could have been a classic symbiotic system (AGB+WD) until recently, when the primary mass-losing star would have left the AGB; at present, the whole system could be dying a second death as as post-symbiotic (‘post-AGB’+WD) system.
Values of larger than those discussed above are, in principle, possible based on our observables and interpretation (≳ 8.7 au and 90 yr), but it would imply that the companion is a dark, compact stellar remnant such as a neutron star (NS, with a typical mass in the range 1.1-3.2 ) or a black hole (BH, if 3 ). If this is the case, the orbital separation of the system would be larger than for the dwarf or WD companion scenario (for example, 44 au for 10 ). If the mass-losing star is accompanied by such a NS/BH then, given the relatively large orbital separation, it would be most likely in a “silent” mode; that is, this star would not be undergoing significant mass-transfer that, if present, should be accompanied by high-energetic phenomena. This is indeed consistent with the non-detection of X-ray emission toward M 2-9 (Ruiz, 2014).
The mass of the companion deduced here (0.2 ) is somewhat larger than that estimated by CC12, who proposed a low-mass companion of 0.1-0.2 orbiting around a 1 mass-losing star when the CO rings were ejected. The low secondary-to-primary mass ratio proposed by these authors results from the low orbital velocity of the primary used in their calculations, 1 km s-1, which is smaller than the value inferred from the separation between the centroids of the mm-RRLs and the CO line (2.91 km s-1). We note that CC12 interpret the difference between the CO line centroids (0.6 km s-1) and velocity gradients observed in the two rings as the result of two short mass-ejection events that took place when the mass-losing star was at two specific positions in a circular orbit. In particular, they proposed that the large CO ring was ejected when the system was near conjunction (with the stars moving perpendicularly to the line of sight) and the small ring was blown out 500 yr later, when the stars were at quadrature (and, thus moving in a direction very close to the line of sight); see red and green marks in their Fig. 4.
The low radial velocity shifts deduced from the CO emission from the two rings are not inconsistent with a moderately larger orbital velocity, as deduced here, if the rings were expelled at positions slightly different from those adopted by CC12 or, most importantly, if the orbit is not circular. For elliptical orbits, the radial velocity curve exhibit a marked skew symmetry with different maximum and minimum absolute radial velocities. In fact, for eccentric orbits the observed radial velocity can be much smaller than the semi-amplitude of the curve during most of the orbital phase. If this is the case, the relatively low radial velocities derived from the spatio-kinematics of the CO rings would not be incompatible with a larger radial velocity measured at a third epoch from our RRLs, probably nearer to periastron.
Finally, one can also consider the possibility that the ionized gas traced by our mm-RRLs is not centered around the primary mass-losing star but around the companion. In this case, the difference between the centroids of the RRLs and CO transitions would represent the orbital velocity of the less massive secondary (moving faster than the primary about the mass center). If the companion is a very low-mass star, ≲0.2, an external source of ionization, other than the companion itself, would be needed. This is because a main sequence star of this mass or lower would have a spectral type later than M 4, i.e., 3200 K, and would not be able to ionize the gas in its vicinity. High-speed shocks in a putative accretion disk around and/or within fast winds launched by the secondary (presumably, after wind mass transfer from the primary) may constitute an alternative ionization agent. If this is correct, at present, the companion must be undergoing active accretion from the wind of the primary (given the short lifetime, 10-20 yr, of the ionized core) and broader RRL profiles from the hot shocked emitting gas would be expected. In the case of high-speed shocks, one would also expect partial ionization of the slow dense wind around the mass-losing star by the UV radiation generated by the shocks.
With the observables available to date and, in particular, in the absence of direct empirical determination of its orbital or stellar parameters, an accurate characterization of the system at the core of M 2-9 is not possible.
6.3 MWC 922
The B [e] star MWC 922 and its surrounding nebulosity remain poorly characterized to date and, therefore, the long-term history of the mass loss and nebular shaping cannot be reconstructed as for CRL 618 and M 2-9. Our mm-RRL observations are consistent with the presence of an ionized outflow and a Keplerian rotating disk within a radius of 150 au from the center. The origin of these two structures is unknown and cannot be determined from our data.
The rotating kinematics of the disk, if it is Keplerian as adopted in our model, provides an estimate of the mass of the central object. This parameter is poorly constrained, mainly owing to the large uncertainties of the departure coefficients on which the maser line profiles critically depend, but values of 5-10 are consistent with our observations. This large mass could represent the total mass of a binary or, more generally, multiple system.
The location of MWC 922 in the HR diagram is uncertain, mainly due to the unknown distance. The temperature of the central star is also not well established, although it probably lies within the range 20,000-30,000 K (§ 2.3). As discussed by Tuthill & Lloyd (2007), the presence of gas and dust around MWC 922 suggests either a pre-main sequence star still partially embedded in its natal cloud or a post-main sequence star surrounded by matter ejected in its late evolutionary stages.
The range of and luminosities given in Table 1 are consistent, in principle, with MWC 922 being a post-AGB object evolved from a massive progenitor (Fig. 7). Considering the post-AGB evolutionary tracks by Bloecker (1995), which include stars with initial masses of up to 7 , MWC 922 could be the evolutionary product of a 5 main sequence star [adopting =1.7 kpc and =4.25] or even more massive, 7 [if =3.0 kpc and =4.77]. The mass of the remnant post-AGB core of MWC 922 would be around 1 at present. Since the total mass at the center of the rotating disk of MWC 922 deduced from our analysis is significantly larger, 5-10 , either a massive companion ( 4-9 ) or multiple lower mass companions must exist. As explained earlier, the mass of the central object in uncertain. If we take the lowest value to be consistent with the observations, which is 5 , then the secondary could be a 4 star still on the main sequence [with 2.2 and spectral type B 6-B7], while the more massive primary (with an initial mass 5 ) would have evolved off the main sequence already (in less than 10-100 Myr).
If this scenario is correct and MWC 922 is an evolved/post-main sequence star, its age would still be sufficiently low to be associated with other young less massive stars born in the same natal cloud, which could also remain not fully dispersed. This is not inconsistent with the strong ISM contamination of the CO spectra toward this target (see Appendix A), which could be completely masking out the emission from the presumptive mass-ejecta from the star. In any case, given its location close to the Galactic plane, strong ISM contamination is expected toward MWC 922.
If the total mass of the system at the core of MWC 922 is 8-10 , and 1 , then the companion (or companions) should account for the remaining stellar mass of 7-9 . In this case, and if there is only one companion, a pre-main sequence nature would be probably favored. This is the case unless, of course, the initial mass of MWC 922 was even larger, i.e., 10 , and it is now in a pre-oxygen-neon WD or pre-supernova stage; this stage is expected to be extremely short, which makes this scenario less probable.
7 Post-AGB mass-loss rates and post-AGB evolution
The post-AGB phase is, beyond question, one of the least understood phases of the evolution of low-to-intermediate mass stars. Mass loss is the dominant mechanism impelling these stars across the HR diagram on their way to the CSPN phase, before fading along the white dwarf cooling sequence. The total AGB-to-PN transition time depends on the heating rate of the central star, which is, indeed, critically dictated by the mass-loss rate, especially in the early post-AGB stages: the more intense the post-AGB wind, the faster the evolution to the final (hottest) point of the CSPN phase. In spite of its decisive role in stellar evolution, empirical data on post-AGB mass-loss rates are notably lacking and, therefore, evolutionary models are bound to adopt completely unconstrained mass-loss prescriptions, for example, interpolating between those theoretically or semi-empirically determined for the preceding AGB and the following CSPN phases (e.g., Schönberner, 1983; Bloecker, 1995; Vassiliadis & Wood, 1993; Miller Bertolami, 2016).
Commonly, the post-AGB mass-loss is described by a sudden abrupt drop immediately after the departure from the AGB phase (where very high rates of 10-3-10-4 yr-1 are applied) followed by a less steep, linear decline, and final flattening in the CSPN regime (see Fig. 7, bottom panel, and references above). The mass-loss rates derived for CRL 618, MWC 922, and M 2-9 in this work (Table 4) are well above the typical values adopted in post-AGB evolutionary models, which vary between 1 and 2 yr-1 for the range of considered here.
The largest discrepancy, by three orders of magnitude, is found for the well-known pPN CRL 618. The location of this object in the HR diagram (Fig. 7, upper panel) is consistent with a remnant core of 0.625, which is the descendant of a star with an initial mass of 3 on the main sequence, for which 1 yr-1 would be assumed by evolutionary models currently in use (Fig. 7, bottom panel).
The mass-loss rate deduced for M 2-9 is also much higher than the values adopted by models, although the progenitor mass in this case is less certain because the distance to this object is not well known. Adopting the largest distance proposed in previous works, =1.7 kpc, the position of M 2-9 in the HR diagram would be consistent with a remnant mass of 0.565, which is the descendant of a 1 star, for which 10-9 yr-1 or less is normally assumed (Fig. 7). The lowest luminosity point in the HR diagram (2.8, adopting =650 pc) falls below the evolutionary tracks of the least massive stars (0.8 ), which are expected to evolve off the main sequence in less than a Hubble time.
In the case of MWC 922, the mass-loss rate is also above the model prescriptions assuming that it is the evolutionary product of a 5 star (with a 0.836 remnant core). However, not only the post-AGB nature of this object is questionable (§ 6.3); the origin of the expanding outflow (+rotating disk), which is consistent with the observed mm-RRL line profiles, is not clear since it could represent a stellar wind or gas photoevaporating from the ionized surface of a circumstellar disk, or a mixture of both.
Although the mass-loss rates inferred for the five objects in our sample with no mm-RRL detections are uncertain (given that the spatio-kinematics of their ionized cores is unconstrained), for all of these objects we obtain relatively large values of 10-6-10-7 yr-1 (Table 5) that clearly exceed the rates adopted by models. For example, the most luminous pPNe/yPNe in our sample with no mm-RRL detections, namely, He3-1475, M 1-92, and M 2-56, would have similar 2-3 progenitors to CRL 618 for which models would use 10-8 yr-1. IRAS 20462+3416 and M 2-56 have luminosities that are comparable to M 2-9 and, therefore, they also probably descend from a low-mass (1 ) progenitor. For such a low-mass progenitor, the post-AGB mass-loss rates used by models are 3 orders of magnitude below the rates inferred by us.
As mentioned in the beginning of this section, the mass-loss rates applied by models during the transition between the AGB and hot CSPN stage are expected to influence the HR crossing time dramatically. Some models, for example, those by Schönberner (1983) for 0.8-1 stars, assume that most of the envelope mass is removed at very high rates of 10-3-10-4 yr-1in a short “superwind” phase that happens only in the vicinity of the AGB, i.e. for 4000-6000 K. After that point, which is arbitrarily defined by most theorists as the beginning of the post-AGB phase, the adopted mass-loss rates fall well below the growth rate of the core due to hydrogen burning, and therefore, they are considered to influence only moderately the transition of the star to the CSPN region. Other evolutionary models, such as those by Bloecker (1995) for stars with initial masses between 1 and 7 , however, indicate that the transition time from the AGB to the CSPN region depends strongly on the treatment of mass loss beyond the AGB phase, although rather low post-AGB mass-loss rates (inferred by radiation-driven wind theories) are still applied in these computations.
We have shown that the mass-loss rate in the post-AGB phase, when the star has reached 20,000 K and the ionization has begun, can be orders of magnitude larger than the values assumed by evolutionary models. If this is found to be a common property of most post-AGB stars (which needs to be investigated using larger samples), much faster evolutionary speeds to the PN region may be expected.
A similar result was obtained by Trams et al. (1989) from the analysis of H P-Cygni profiles in four candidate post-AGB stars with 6500-10,000 K, which yielded order-of-magnitude estimates of the mass-loss rate of 10-8 to 10-7 yr-1. These authors discussed the drastic consequences of high mass-loss rates for the formation of PNe, especially for objects with low-mass progenitors. For example, for a low-luminosity object like M 2-9, with a 0.55 core, the time needed to evolve from 5000 K to its current temperature is 100,000 yr when adopting the model mass-loss prescriptions, 2 yr-1, but less than 5000 yr when adopting the observed rate (see Fig.7). The latter transition time leads to a much better agreement with the dynamical lifetime of the nebulosity in this and other similar objects.
8 Conclusions
We have detected RRL emission at mm-wavelengths from the central ionized regions of CRL 618, M 2-9, and MWC 922 at a moment when these H ii region are in a very early stage of development after the ionization onset. The RRLs at mm-wavelengths trace the inner regions of these targets at scales 10-100 au, indicating bulk motion speeds of 10-30 km s-1.
Our analysis of the RRL spectra and free-free continuum data included detailed modeling of CRL 618, M 2-9, and MWC 922 using the non-LTE radiative transfer code MORELI. This has enabled us to set constraints of the density and temperature profiles and morpho-kinematics in the ionized cores of these objects. Typical densities are found to range between 106 and 108 cm-3, following radial power-law distributions () . The total mass of ionized gas at the core of these objects is 10-6-10-4 , which is currently being ejected at rates of 10-6-10-7 yr-1. Simple models of the free-free continuum emission have also been performed for the remaining five targets with no mm-RRL detections under the assumption that their ionized cores are spherical isothermal winds. The post-AGB mass-loss rates derived in these cases range between 3 and 4 yr-1. These rates are significantly higher than those adopted by current post-AGB evolutionary models. New evolutionary tracks should be made allowing post-AGB stars to lose mass at higher rates, to study their influence on the star heating rate, AGB-to-PN transition times, initial-final mass relation, etc.
8.1 Future prospects
Our models are necessarily simplified representations of the presumably more complex spatio-kinematical and physical structure of the dense stellar surroundings in these objects. We need RRL emission maps with ≲ 005-angular resolution to better constrain the properties of these very inner winds, in particular, to test our conjectures on nebular morphology and kinematics.
For example, these maps are needed to check the rotating ‘disk+wind’ scenario in MWC 922; if confirmed, it will be possible to obtain from the disk kinematics a more reliable estimate of the mass of the central source(s) and, thus, to clarify its nature. Disentangling the composite nebular structure of MWC 922 and, in particular, isolating the wind from the disk is needed for an accurate interpretation of the mass loss in this case. In parallel, measuring the outflow rotation and studying the disk dynamics can provide fundamental information regarding the origin of the outflow and the role of the disk in the wind launching/collimation process. High-angular resolution maps of RRLs are also needed to confirm or not the expansive kinematics and the suspected velocity gradient in the ≲ 100 au inner regions of CRL 618 and M 2-9: Does it follow a law as observed at much larger linear scales in these, and most, pPNe? Also, these maps are necessary to unveil the presence of jet-like features, of which indirect observational indicia exist but whose direct characterization remains elusive. High angular-resolution of the ionized core of M 2-9 is also critical for a truthful judgement of the binary system at its nucleus and to unravel the different ionized gas (and dust) components that contribute to the observed mm-continuum.
With its unprecedented capabilities, ALMA is the only facility in the world that is able to map with sufficient sensitivity and angular resolution the dense inner winds of young PNe at the precise moment when these come into existence and begin to be ionized.
Acknowledgements.
We thank the referee for his/her comments and very valuable suggestions. The data presented in this paper were reduced using the packages available in the GILDAS software (http://www.iram.fr/IRAMFR/GILDAS). This work has been partially supported by the Spanish MINECO through grants CSD2009-00038, AYA2009-07304, AYA2010-2169-C04-01, AYA2012-32032, AYA2016-78994-P, FIS2012-39162-C06-01, ESP2013-47809-C03-01 and ESP2015-65597-C4-1. A. Báez-Rubio acknowledges support from DGAPA postdoctoral grant (year 2015) to UNAM. This research has made use of the SIMBAD database and VizieR catalog access tool (CDS, Strasbourg, France), the NASA Astrophysics Data System, and Aladin.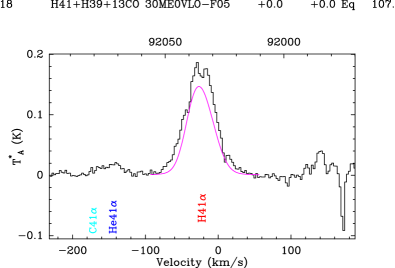
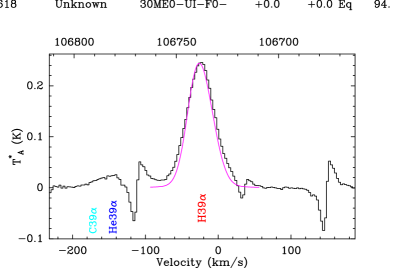
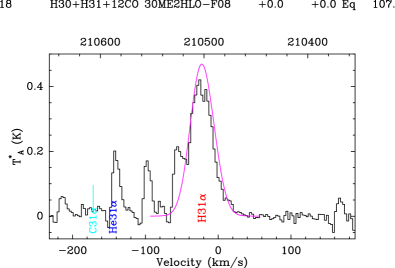
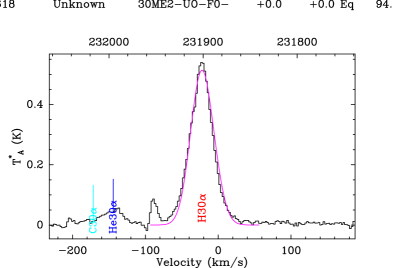
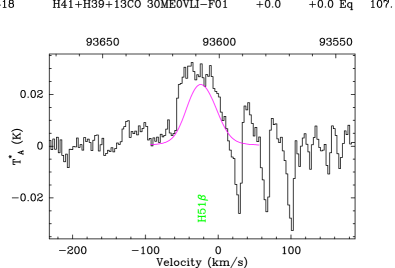

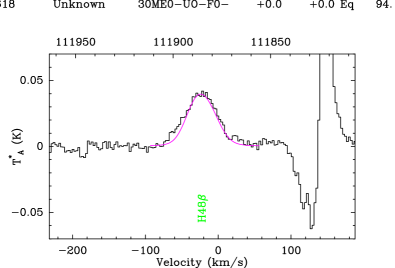
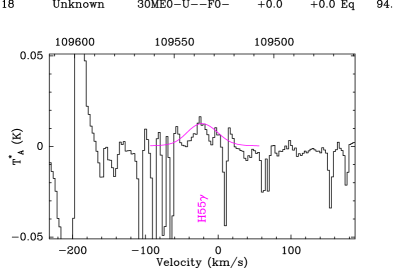
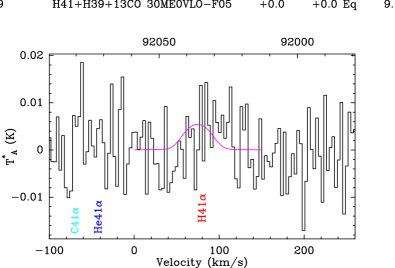
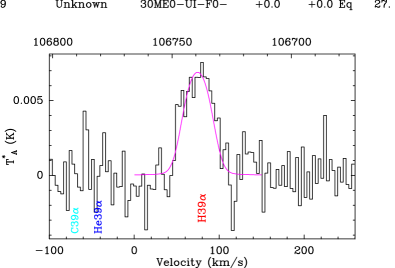
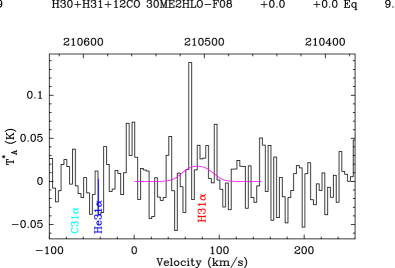
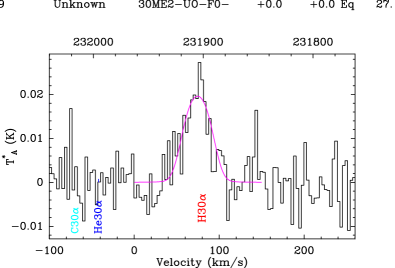
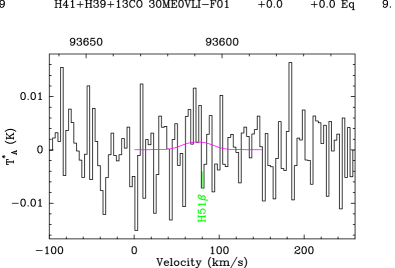
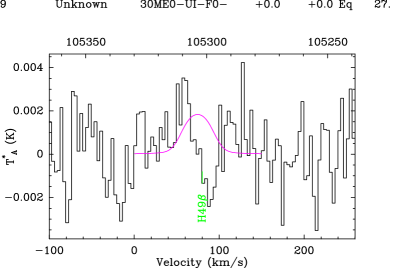
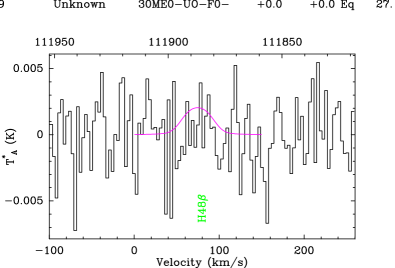
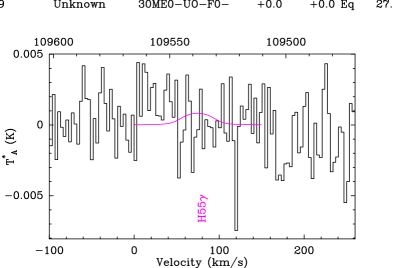
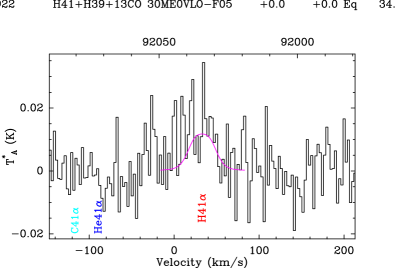
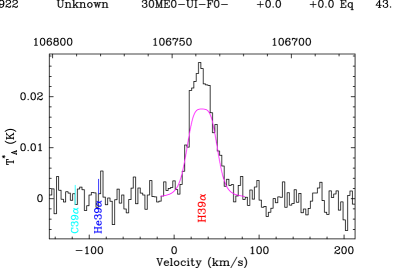
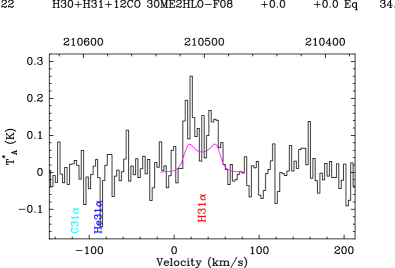
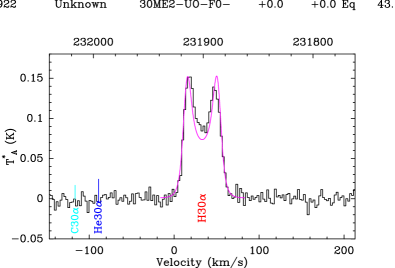
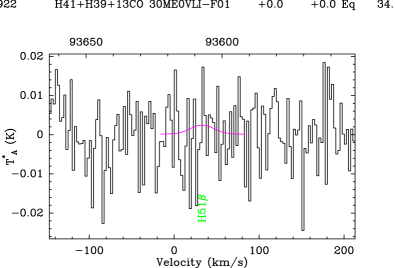
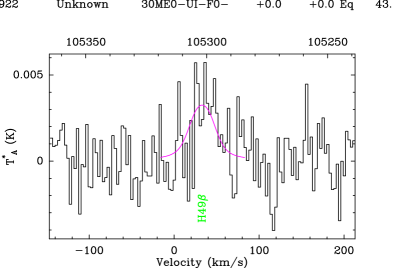
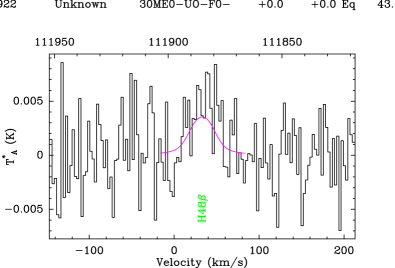
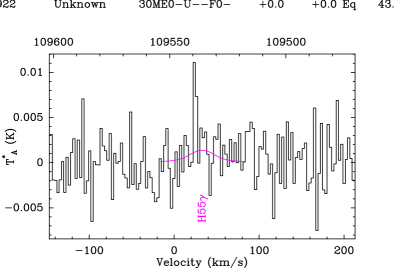
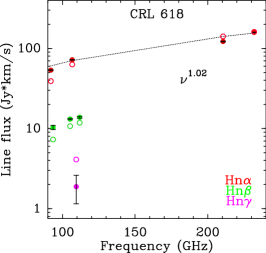
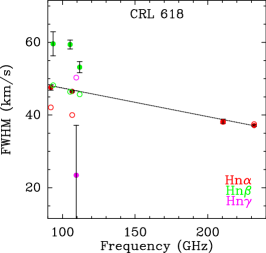
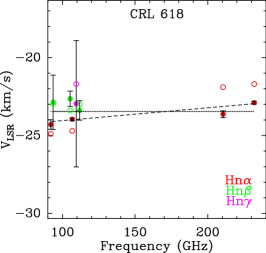
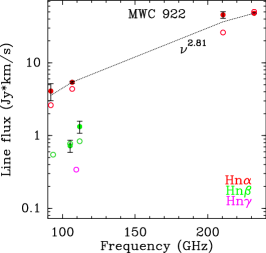
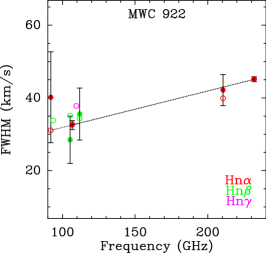
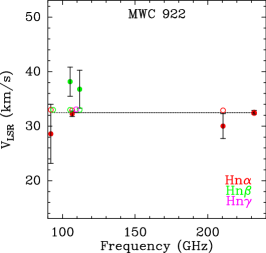
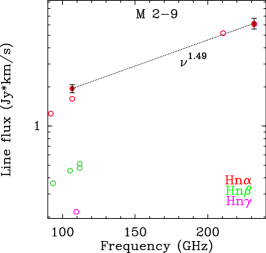
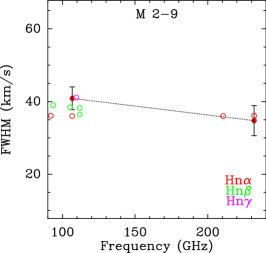
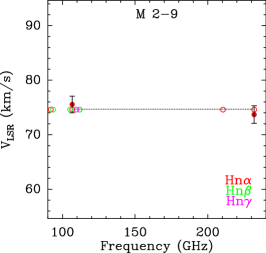
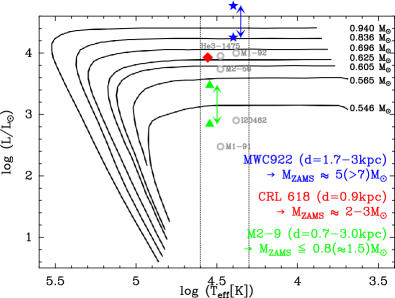
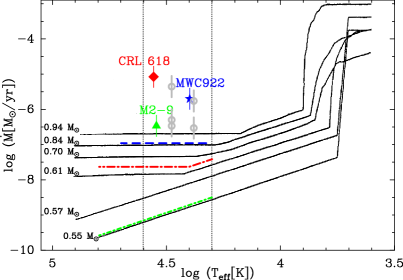
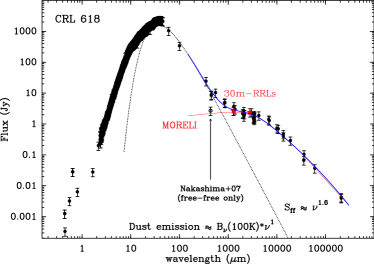
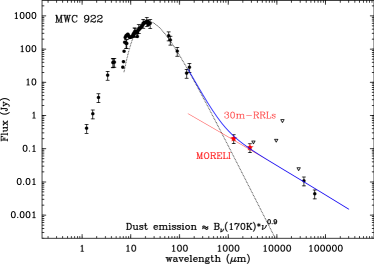
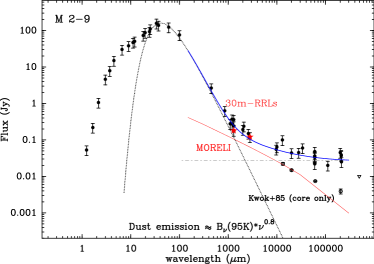
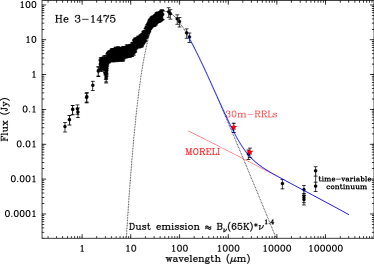
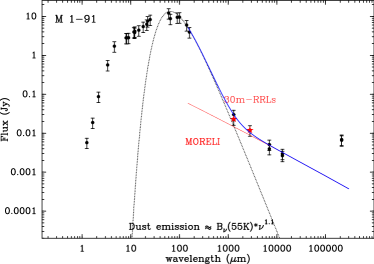
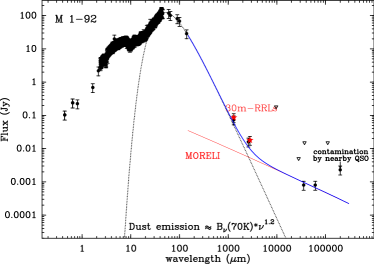
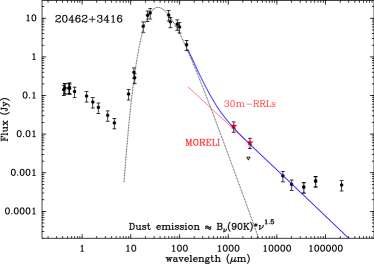
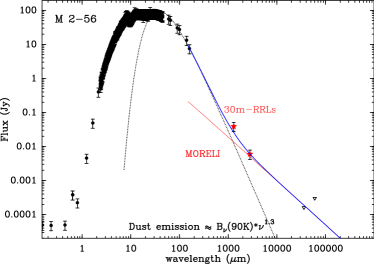
References
- Abraham et al. (2014) Abraham, Z., Falceta-Gonçalves, D., & Beaklini, P. P. B. 2014, ApJ, 791, 95
- Alcolea et al. (2007) Alcolea, J., Neri, R., & Bujarrabal, V. 2007, A&A, 468, L41
- Allen & Swings (1972) Allen, D. A., & Swings, J. P. 1972, ApJ, 174, 583
- Allen & Swings (1976) Allen, D. A., & Swings, J. P. 1976, A&A, 47, 293
- Arrieta et al. (2005) Arrieta, A., Torres-Peimbert, S., & Georgiev, L. 2005, ApJ, 623, 252
- Arrieta & Torres-Peimbert (2003) Arrieta, A., & Torres-Peimbert, S. 2003, ApJS, 147, 97
- Bachiller et al. (1992) Bachiller, R., Huggins, P. J., Martin-Pintado, J., & Cox, P. 1992, A&A, 256, 231
- Báez-Rubio et al. (2013) Báez-Rubio, A., Martín-Pintado, J., Thum, C., & Planesas, P. 2013, A&A, 553, A45
- Balick (1989) Balick, B. 1989, AJ, 97, 476
- Balick et al. (2013) Balick, B., Huarte-Espinosa, M., Frank, A., et al. 2013, ApJ, 772, 20
- Balick et al. (2014) Balick, B., Riera, A., Raga, A., Kwitter, K. B., & Velázquez, P. F. 2014, ApJ, 795, 83
- Balick & Frank (2002) Balick, B., & Frank, A. 2002, ARA&A, 40, 439
- Bloecker (1995) Bloecker, T. 1995, A&A, 299, 755
- Brocklehurst & Seaton (1972) Brocklehurst, M., & Seaton, M. J. 1972, MNRAS, 157, 179
- Brown et al. (1978) Brown, R. L., Lockman, F. J., & Knapp, G. R. 1978, ARA&A 16, 445
- Bujarrabal et al. (1998) Bujarrabal, V., Alcolea, J., Sahai, R., Zamorano, J., & Zijlstra, A. A. 1998, A&A, 331, 361
- Bujarrabal et al. (2001) Bujarrabal, V., Castro-Carrizo, A., Alcolea, J., & Sánchez Contreras, C. 2001, A&A, 377, 868
- Bujarrabal et al. (2005) Bujarrabal, V., Castro-Carrizo, A., Alcolea, J., & Neri, R. 2005, A&A, 441, 1031
- Bujarrabal et al. (2016) Bujarrabal, V., Castro-Carrizo, A., Alcolea, J., et al. 2016, arXiv:1606.07238
- Calvet & Cohen (1978) Calvet, N., & Cohen, M. 1978, MNRAS, 182, 687
- Carter et al. (2012) Carter, M., Lazareff, B., Maier, D., et al. 2012, A&A, 538, A89
- Castro-Carrizo et al. (2002) Castro-Carrizo, A., Bujarrabal, V., Sánchez Contreras, C., Alcolea, J., & Neri R. 2002, A&A, 386, 633
- Castro-Carrizo et al. (2012) Castro-Carrizo, A., Neri, R., Bujarrabal, V., et al. 2012, A&A, 545, A1
- Castro-Carrizo et al. (2017) Castro-Carrizo, A., Bujarrabal, V., Neri, R., et al. 2017, A&A, 600, A4
- Cerrigone et al. (2008) Cerrigone, L., Umana, G., Trigilio, C., et al. 2008, MNRAS, 390, 363
- Cerrigone et al. (2011) Cerrigone, L., Trigilio, C., Umana, G., Buemi, C. S., & Leto, P. 2011, MNRAS, 412, 1137
- Clyne et al. (2015) Clyne, N., Akras, S., Steffen, W., et al. 2015, A&A, 582, A60
- Cohen et al. (1975) Cohen, M., Anderson, C. M., Cowley, A., et al. 1975, ApJ, 196, 179
- Cohen& Kuhi (1977) Cohen, M., & Kuhi, L. V. 1977, ApJ, 213, 79
- Corradi et al. (2011) Corradi, R. L. M., Balick, B., & Santander-García, M. 2011, A&A, 529, A43
- Cox et al. (1995) Cox, P., Martin-Pintado, J., Bachiller, R., et al. 1995, A&A, 295, L39
- Decin et al. (2010) Decin, L., De Beck, E., Brünken, S., et al. 2010, A&A, 516, A69
- Doyle et al. (2000) Doyle, S., Balick, B., Corradi, R. L. M., & Schwarz, H. E. 2000, AJ, 119, 1339
- Goodrich (1991) Goodrich, R. W. 1991, ApJ, 376, 654
- He et al. (2014) He, J. H., Szczerba, R., Hasegawa, T. I., & Schmidt, M. R. 2014, ApJS, 210, 26
- Hollenbach et al. (1994) Hollenbach, D., Johnstone, D., Lizano, S., & Shu, F. 1994, ApJ, 428, 654
- Huang et al. (2016) Huang, P.-S., Lee, C.-F., Moraghan, A., & Smith, M. 2016, ApJ, 820, 134
- Huggins et al. (2004) Huggins, P. J., Muthu, C., Bachiller, R., Forveille, T., & Cox, P. 2004, A&A, 414, 581
- Jiménez-Serra et al. (2011) Jiménez-Serra, I., Martín-Pintado, J., Báez-Rubio, A., Patel, N., & Thum, C. 2011, ApJ, 732, L27
- Jiménez-Serra et al. (2013) Jiménez-Serra, I., Báez-Rubio, A., Rivilla, V. M., et al. 2013, ApJ, 764, L4
- Josselin et al. (2000) Josselin, E., Bachiller, R., Manchado, A., & Guerrero, M. A. 2000, A&A, 353, 363
- Kerr & Lynden-Bell (1986) Kerr, F. J., & Lynden-Bell, D. 1986, MNRAS, 221, 1023
- Kohoutek & Surdej (1980) Kohoutek, L., & Surdej, J. 1980, A&A, 85, 161
- Kwok & Feldman (1981) Kwok, S., & Feldman, P. A. 1981, ApJ, 247, L67
- Kwok & Bignell (1984) Kwok, S., & Bignell, R. C. 1984, ApJ, 276, 544
- Kwok et al. (1985) Kwok, S., Purton, C. R., Matthews, H. E., & Spoelstra, T. A. T. 1985, A&A, 144, 321
- Lagadec et al. (2011) Lagadec, E., Verhoelst, T., Mékarnia, D., et al. 2011, MNRAS, 417, 32
- Lee et al. (2001) Lee, H.-W., Kang, Y.-W., & Byun, Y.-I. 2001, ApJ, 551, L121
- Lee et al. (2007) Lee, T.-H., Lim, J., & Kwok, S. 2007, ApJ, 665, 341
- Lee et al. (2013a) Lee, C.-F., Yang, C.-H., Sahai, R., & Sánchez Contreras, C. 2013a, ApJ, 770, 153
- Lee et al. (2013b) Lee, C.-F., Sahai, R., Sánchez Contreras, C., Huang, P.-S.,& Hao Tay, J. J. 2013b, ApJ, 777, 37
- Lim & Kwok (2000) Lim, J., & Kwok, S. 2000, Asymmetrical Planetary Nebulae II: From Origins to Microstructures, 199, 259
- Lim & Kwok (2003) Lim, J., & Kwok, S. 2003, Symbiotic Stars Probing Stellar Evolution, 303, 437
- Lykou et al. (2011) Lykou, F., Chesneau, O., Zijlstra, A. A., et al. 2011, A&A, 527, A105
- Martín-Pintado et al. (1988) Martín-Pintado, J., Bujarrabal, V., Bachiller, R., Gomez-Gonzalez, J., & Planesas, P. 1988, A&A, 197, L15
- Martín-Pintado et al. (1989a) Martín-Pintado, J., Bachiller, R., & Thum, C. 1989, A&A, 222, L9
- Martín-Pintado et al. (1989b) Martín-Pintado, J., Bachiller, R., Thum, C., & Walmsley, M. 1989, A&A, 215, L13
- Martín-Pintado et al. (1993) Martín-Pintado, J., Gaume, R., Bachiller, R., & Johnson, K. 1993, ApJ, 419, 725
- Martín-Pintado et al. (2011) Martín-Pintado, J., Thum, C., Planesas, P., & Báez-Rubio, A. 2011, A&A, 530, L15
- Mezger & Hoglund (1967) Mezger, P. G., & Hoglund, B. 1967, ApJ, 147, 490
- Miller Bertolami (2016) Miller Bertolami, M. M. 2016, A&A, 588, A25
- Minkowski (1947) Minkowski, R. 1947, PASP, 59, 257
- Nakashima et al. (2007) Nakashima, J.-i., Fong, D., Hasegawa, T., et al. 2007, AJ, 134, 2035
- Owen et al. (2012) Owen, J. E., Clarke, C. J., & Ercolano, B. 2012, MNRAS, 422, 1880
- Panagia & Felli (1975) Panagia, N., & Felli, M. 1975, A&A, 39, 1
- Pardo et al. (2007) Pardo, J. R., Cernicharo, J., Goicoechea, J. R., Guélin, M., & Asensio Ramos, A. 2007, ApJ, 661, 250
- Parthasarathy (1993) Parthasarathy, M. 1993, ApJ, 414, L109
- Pereira et al. (2003) Pereira, C. B., Franco, C. S., & de Araújo, F. X. 2003, A&A, 397, 927
- Peters et al. (2012) Peters, T., Longmore, S. N., & Dullemond, C. P. 2012, MNRAS, 425, 2352
- Planck Collaboration et al. (2015) Planck Collaboration, Arnaud, M., Atrio-Barandela, F., et al. 2015, A&A, 573, A6
- Purcell et al. (2013) Purcell, C. R., Hoare, M. G., Cotton, W. D., et al. 2013, ApJS, 205, 1
- Reuter et al. (1997) Reuter, H.-P., Kramer, C., Sievers, A., et al. 1997, A&AS, 122, 271
- Reynolds (1986) Reynolds, S. P. 1986, ApJ, 304, 713
- Riera et al. (1995) Riera, A., Garcia-Lario, P., Manchado, A., Pottasch, S. R., & Raga, A. C. 1995, A&A, 302, 137
- Riera et al. (2011) Riera, A., Raga, A. C., Velázquez, P. F., Haro-Corzo, S. A. R., & Kajdic, P. 2011, A&A, 533, A118
- Rodríguez et al. (2009) Rodríguez, L. F., Zapata, L. A., & Ho, P. T. P. 2009, ApJ, 692, 162
- Rodríguez et al. (2012) Rodríguez, L. F., Báez-Rubio, A., & Miroshnichenko, A. S. 2012, Rev. Mexicana Astron. Astrofis., 48, 47
- Roelfsema et al. (1991) Roelfsema, P. R., Goss, W. M., Zijlstra, A., & Pottasch, S. R. 1991, A&A, 251, 611
- Ruiz (2014) Ruiz, N. 2014, Ph.D. Thesis
- Rudy et al. (1992) Rudy, R. J., Erwin, P., Rossano, G. S., & Puetter, R. C. 1992, ApJ, 398, 278
- Salem & Brocklehurst (1979) Salem, M., & Brocklehurst, M. 1979, ApJS, 39, 633
- Sánchez Contreras et al. (1998) Sánchez Contreras, C., Alcolea, J., Bujarrabal, V., & Neri, R. 1998, A&A, 337, 233
- Sánchez Contreras et al. (2002) Sánchez Contreras, C., Sahai, R., & Gil de Paz, A. 2002, ApJ, 578, 269
- Sánchez Contreras et al. (2004) Sánchez Contreras, C., Bujarrabal, V., Castro-Carrizo, A., Alcolea, J., & Sargent, A. 2004, ApJ, 617, 1142
- Sánchez Contreras et al. (2008) Sánchez Contreras, C., Sahai, R., Gil de Paz, A., & Goodrich, R. 2008, ApJS, 179, 166
- Sánchez Contreras et al. (2010) Sánchez Contreras, C., Cortijo-Ferrero, C., Miranda, L. F., Castro-Carrizo, A., & Bujarrabal, V. 2010, ApJ, 715, 143
- Sánchez Contreras & Sahai (2001) Sánchez Contreras, C., & Sahai, R. 2001, ApJ, 553, L173
- Sánchez Contreras & Sahai (2004) Sánchez Contreras, C., & Sahai, R. 2004, ApJ, 602, 960
- Sánchez Contreras & Sahai (2012) Sánchez Contreras, C., & Sahai, R. 2012, ApJS, 203, 16
- Sekeráš & Skopal (2012) Sekeráš, M., & Skopal, A. 2012, MNRAS, 427, 979
- Schmidt & Cohen (1981) Schmidt, G. D., & Cohen, M. 1981, ApJ, 246, 444
- Schöier et al. (2004) Schöier, F. L., Olofsson, H., Wong, T., Lindqvist, M., & Kerschbaum, F. 2004, A&A, 422, 651
- Schönberner (1983) Schönberner, D. 1983, ApJ, 272, 708
- Schwarz et al. (1997) Schwarz, H. E., Aspin, C., Corradi, R. L. M., & Reipurth, B. 1997, A&A, 319, 267
- Solf (2000) Solf, J. 2000, A&A, 354, 674
- Soria-Ruiz et al. (2013) Soria-Ruiz, R., Bujarrabal, V., & Alcolea, J. 2013, A&A, 559, A45
- Storey & Hummer (1995) Storey, P. J., & Hummer, D. G. 1995, MNRAS, 272, 41
- Strelnitski et al. (1996) Strelnitski, V. S., Ponomarev, V. O., & Smith, H. A. 1996, ApJ, 470, 1118
- Suárez et al. (2006) Suárez, O., García-Lario, P., Manchado, A., et al. 2006, A&A, 458, 173
- Swings & Andrillat (1979) Swings, J. P., & Andrillat, Y. 1979, A&A, 74, 85
- Tafoya et al. (2013) Tafoya, D., Loinard, L., Fonfría, J. P., et al. 2013, A&A, 556, A35
- Torres-Peimbert et al. (2010) Torres-Peimbert, S., Arrieta, A., & Bautista, M. 2010, Rev. Mexicana Astron. Astrofis., 46, 221
- Towle et al. (1996) Towle, J. P., Feldman, P. A., & Watson, J. K. G. 1996, ApJS, 107, 747
- Trams et al. (1989) Trams, N. R., Waters, L. B. F. M., Waelkens, C., Lamers, H. J. G. L. M., & van der Veen, W. E. C. J. 1989, A&A, 218, L1
- Trammell et al. (1993) Trammell, S. R., Dinerstein, H. L., & Goodrich, R. W. 1993, ApJ, 402, 249
- Trammell & Goodrich (2002) Trammell, S. R., & Goodrich, R. W. 2002, ApJ, 579, 688
- Tuthill & Lloyd (2007) Tuthill, P. G., & Lloyd, J. P. 2007, Science, 316, 247
- van den Bergh (1974) van den Bergh, S. 1974, A&A, 32, 351
- van de Steene et al. (2000) van de Steene, G. C., Wood, P. R., & van Hoof, P. A. M. 2000, Asymmetrical Planetary Nebulae II: From Origins to Microstructures, 199, 191
- van de Steene & Pottasch (1993) van de Steene, G. C. M., & Pottasch, S. R. 1993, A&A, 274, 895
- Vassiliadis & Wood (1993) Vassiliadis, E., & Wood, P. R. 1993, ApJ, 413, 641
- Vassiliadis & Wood (1994) Vassiliadis, E., & Wood, P. R. 1994, ApJS, 92, 125
- Vázquez et al. (1999) Vázquez, R., Torrelles, J. M., Rodríguez, L. F., et al. 1999, ApJ, 515, 633
- Velázquez et al. (2014) Velázquez, P. F., Riera, A., Raga, A. C., & Toledo-Roy, J. C. 2014, ApJ, 794, 128
- Walmsley (1990) Walmsley, C. M. 1990, A&AS, 82, 201
- Waters et al. (1998) Waters, L. B. F. M., Cami, J., de Jong, T., et al. 1998, Nature, 391, 868
- Wehres et al. (2014) Wehres, N., Ochsendorf, B., Bally, J., et al. 2014, The Diffuse Interstellar Bands, 297, 226
- Werner et al. (2014) Werner, M. W., Sahai, R., Davis, J., et al. 2014, ApJ, 780, 156
- Westbrook et al. (1975) Westbrook, W. E., Willner, S. P., Merrill, K. M., et al. 1975, ApJ, 202, 407
- Wright & Barlow (1975) Wright, A. E., & Barlow, M. J. 1975, MNRAS, 170, 41
- Wynn-Williams (1977) Wynn-Williams, C. G. 1977, MNRAS, 181, 61P
- Wyrowski et al. (2003) Wyrowski, F., Schilke, P., Thorwirth, S., Menten, K. M., & Winnewisser, G. 2003, ApJ, 586, 344
- Yorke & Welz (1996) Yorke, H. W., & Welz, A. 1996, A&A, 315, 555
- Zasowski et al. (2015) Zasowski, G., Chojnowski, S. D., Whelan, D. G., et al. 2015, ApJ, 811, 119
Appendix A Spectra of the bonus 12CO (=21) and 13CO (=10) lines.
In this Appendix we report the 12CO (=21) and 13CO (=10) spectral profiles observed toward our targets in this work (see Section 3). Spectra are channel-smoothed to a final velocity resolution of 2 km s-1 and are shown in units of (K) and (km s-1) in Figs. 9 and 10.
All our sample targets are CO emission detections except for IRAS 20462+3416, which is also non-detected in previous surveys (e.g., Sánchez Contreras & Sahai, 2012; He et al., 2014), and MWC 922. This is the first detection of CO emission in the young PN M 1-91 after some unsuccessful previous searches (e.g., Josselin et al., 2000; Bujarrabal et al., 2001). To our knowledge, these are also the first published CO spectra toward MWC 922. The narrow absorption and fewer emission features observed toward this object are most likely produced by intervening ISM clouds along the line of sight. For CO detections, we find line profiles and line fluxes in good agreement with previous observations, whenever available within typical 20-30% calibration uncertainties (e.g., Bujarrabal et al., 2001; Sánchez Contreras & Sahai, 2012; He et al., 2014).


