INTEGRAL IBIS, SPI, and JEM-X observations of LVT151012
During the first observing run of LIGO, two gravitational wave events and one lower-significance trigger (LVT151012) were reported by the LIGO/Virgo collaboration. At the time of LVT151012, the INTErnational Gamma-Ray Astrophysics Laboratory (INTEGRAL) was pointing at a region of the sky coincident with the high localization probability area of the event and thus permitted us to search for its electromagnetic counterpart (both prompt and afterglow emission). The imaging instruments on-board INTEGRAL (IBIS/ISGRI, IBIS/PICsIT, SPI, and the two JEM-X modules) have been exploited to attempt the detection of any electromagnetic emission associated with LVT151012 over 3 decades in energy (from 3 keV to 8 MeV). The omni-directional instruments on-board the satellite, i.e. the SPI-ACS and the IBIS/Veto, complemented the capabilities of the IBIS/ISGRI and IBIS/PICsIT for detections outside their imaging field of view in order to provide an efficient monitoring of the entire LVT151012 localization region at energies above 75 keV. We did not find any significant transient source that was spatially and/or temporally coincident with LVT151012, obtaining tight upper limits on the associated hard X-ray and -ray radiation. For typical spectral models, the upper limits on the fluence of the emission from any 1 s long-lasting counterpart of LVT151012 ranges from 3.510-8 erg cm-2 (20 – 200 keV), within the field of view of the imaging instruments, to =7.110-7 erg cm-2 (75 – 2000 keV), considering the least favorable location of the counterpart for a detection by the omni-directional instruments. These results can be interpreted as a tight constrain on the ratio of the isotropic equivalent energy released in the electromagnetic emission to the total energy of the gravitational waves: 4.410-5. Finally, we provide an exhaustive summary of the capabilities of all instruments on-board INTEGRAL to hunt for -ray counterparts of gravitational wave events, exploiting both serendipitous and pointed follow-up observations. This will serve as a reference for all future searches.
1 Introduction
Gravitational waves (GWs) were predicted as a natural consequence of general relativity (Einstein, 1916), but until recently only indirect evidence of their existence was found by measuring the time evolution of orbital parameters in binary pulsars (Hulse & Taylor, 1975; Kramer et al., 2006). The first direct detection of GWs has been achieved with the discovery of GW150914 (Abbott et al., 2016d) during the first science run of the Advanced LIGO interferometer (O1). This was followed by the observation of another high-significance event, GW151226 (Abbott et al., 2016b).
A third possible GW event, LVT151012, was detected during O1 with a low statistical significance of 1.7 or about 4.5% in the O1 (corresponding to a false alarm rate of once in 2.7 years; Abbott et al., 2016a). The trigger occurred on UTC 2015-10-12 09:54:43, and had signal-to-noise ratio (SNR) of 9.7 (to be compared to 13 of GW151226 and 23.7 of GW150914). Considering the relatively low detection significance, this event has not been confidently classified by the LIGO/Virgo collaboration as a GW burst, but rather as a LIGO/Virgo Transient, possibly associated with an astrophysical event. In this case, it would correspond to a merger of two black holes of 23 M⊙ and 13 M⊙ at a distance of 1000 Mpc (Abbott et al., 2016a). LVT151012 has been localized within an area of about 1600 deg2 (90% confidence level), consisting of two elongated regions spanning over 60 degrees each. Owing to their characteristic shapes, we refer to them in the following as the southern and northern arc LIGO regions.
Electromagnetic counterparts of GW events are mainly expected if at least one neutron star is involved (see e.g. Voss & Tauris, 2003; Siellez et al., 2013; Patricelli et al., 2016). However, it cannot be excluded that the merging of black holes could produce an electromagnetic signal under particular conditions (see Sect. 4). To promote the searches for possible electromagnetic counterparts of GW events, the LIGO/Virgo collaboration distributes near real time alerts to selected teams who have signed a memorandum of understanding. These alerts contain a localization probability map for each event and have led so far to a massive follow-up campaign of GW150914 and GW151226 (Abbott et al., 2016c, e; Racusin et al., 2016; Yoshida et al., 2016; Gando et al., 2016; Abe et al., 2016; Adriani et al., 2016; Cowperthwaite et al., 2016; The Pierre Auger Collaboration et al., 2016). In the case of LVT151012, the localization was distributed to the community only 6 months after the event. No extensive follow-up observations have thus been performed and only serendipitous data-sets are available from all relevant facilities.
The INTErnational Gamma-Ray Astrophysics Laboratory (INTEGRAL; Winkler et al., 2003) team participated to the search for electromagnetic counterparts of GW150914 and provided the tightest upper limits for the whole LIGO localization region above 75 keV, challenging the reported evidence for a temporarily coincident -ray event originated from the merging of two black holes (Savchenko et al., 2016; Connaughton et al., 2016; Greiner et al., 2016). At the time of GW151226, INTEGRAL was not taking scientific data due to proximity of one of the perigee passages111Note that the INTEGRAL satellite orbital period was reduced from 3 to 2.6 sidereal days in January 2015.. Slightly before and after each of these passages, all instruments on-board INTEGRAL are switched off to prevent damages while crossing the Earth radiation belts, thus limiting the observational efficiency of the observatory (“duty cycle”) to 85%.
We report in this paper the results of our serendipitous search for an electromagnetic counterpart of the third possible GW event, LVT151012. In Sect. 2, we first introduce the INTEGRAL general capabilities and then describe the observations performed at the time of LVT151012. Then, we report the upper limits obtained with each instrument on any possible hard X-ray/-ray counterpart of LVT151012. We detail the characteristics of each instrument relevant for our purpose in the Appendix. This section provides an extensive summary of the capabilities of all INTEGRAL instruments to perform similar searches, serving as a references for future studies of transient events. In Sect. 3, we combine together the different results to achieve the most stringent upper limit on the electromagnetic emission from LVT151012. We discuss our results in the context of different models for the electromagnetic counterparts of GW events, illustrating the potential of our search for the detection of prompt and afterglow-like emission from similar sources (Sect. 4). We draw our conclusions in Sect. 5.
2 Observations
INTEGRAL was designed to perform observations in the hard X-ray / soft -ray energy range over a 3030 deg field of view (FoV) with two main instruments: IBIS, optimized for high angular resolution (Ubertini et al., 2003), and SPI providing high spectral resolution (Vedrenne et al., 2003). In addition, the JEM-X and OMC instruments provide simultaneous monitoring in the central part of the FoV in the soft X-ray and optical domains, respectively (Lund et al., 2003; Mas-Hesse et al., 2003). IBIS and SPI are equipped with active shields to reduce the cosmic-ray induced background. The event count-rate provided by these shields can be used to detect transient -ray phenomena over the full sky, making the Anti Coincidence Shield (ACS) of SPI and the Veto system of IBIS two -ray detectors with a competitive sensitivity for such purpose.
The observational mode of INTEGRAL foresees several pointings lasting roughly 1 hour and with an aim position that is changed by a few degrees from one pointing to the other (“dithering strategy”) in order minimize the systematics of the coded mask imaging. The imaging instruments allow us to reach deeper sensitivities (even though in a much more limited region of the sky) compared to the omni-directional instruments, which can monitor the entire sky but are typically affected by a higher background featuring much less controllable variability. As we detail later, some of the imaging instruments are also able to provide detections for events occurring outside their FoVs at the expenses of imaging capabilities.
LVT151012 took place approximately 5 minutes before the end of the pointing 159700850010, the last scientific one in the INTEGRAL revolution 1597. This pointing started on 2015 October 12 at 2015-10-12 08:59:14 (UTC) and was concluded on the same day at 09:59:20 (UTC). At 09:58:48 (UTC), SPI was configured to enter the radiation belts and thus the SPI-ACS and SPI data acquisition was interrupted at 09:59:20 (UTC). In the current configuration, SPI enters stand-by mode slightly before the radiation belt passage. IBIS and JEM-X collected up to 230 seconds of additional science data during the following pointing 159700860010, but the observing conditions were not optimal due to the enhanced background variability. We thus comment on these data separately. The aim point of the imaging instruments during the pointing 159700850010 was at RA = 250.7, Dec = –45.9, i.e. close to the most probable localization of LVT151012 within the southern arc LIGO region (RA = 245.2, Dec = –32.9). At least for a fraction of this region (up to 20%, depending on the instrument), we could exploit for the first time the high sensitivity of the observations obtained within the FoVs of the imaging instruments (JEM-X, IBIS/ISGRI, IBIS/PICsIT, and SPI) to search for both an impulsive event and an afterglow-like emission. The FoV of JEM-X, IBIS/ISGRI, IBIS/PICsIT, and SPI cover an area of 130 deg2, 900 deg2, 900 deg2, and 1225 deg2, respectively222These FoVs coverages are provided at 0% coding efficiency.. The remaining part of the southern arc and the northern arc of the LIGO localization region were only covered with lower sensitivity by the omni-directional instruments and through the out-of-FoV observations with the IBIS/ISGRI and IBIS/PICsIT. We verified that at the time of the GW trigger the region of the sky occulted by the Earth was nearly 5 deg in radius for INTEGRAL but it did not overlap with any portion of the LIGO localization region of LVT151012 where the detection probability of the GW event was significantly higher than zero.
Given the different availabilities of the INTEGRAL instruments specified above, we performed two independent types of searches in order to identify a possible -ray counterpart to LVT151012:
-
1.
search for the prompt burst emission of LVT151012 (“impulsive event”). In this case, we exploited both the data collected by the imaging (within and outside their FoV) and omni-directional instruments in a time interval spanning from 30 seconds before to 30 seconds after the time of the LIGO trigger. Two different possibilities were considered for the spectral energy distribution of the event: (i) the hard Comptonized model that describes the typical short GRB spectrum, parametrized by a cutoff powerlaw with Epeak = 600 keV and = -0.5 (these values are close to the average of the measurements obtained from all GBM short GRBs; Gruber et al., 2014); (ii) the Band model usually adopted to describe long-soft GRBs with representative parameters Epeak = 300 keV, = -1, and =-2.5. We assumed the durations of 1 s and 8 s in order to be representative of the cases of short and long GRBs, respectively. The specific choice of 8 s binning is driven by the readout time of the IBIS/Veto light curve (see Sect. A.4).
-
2.
search for the long-lasting afterglow of LVT151012. In this case, we concentrated on the detection of a hard X-ray/-ray emission in the FoV of imaging instruments that could resemble a GRB afterglow. We assumed a power-law decay of the emission intensity over time and a relatively soft spectral energy distribution ().
In the following sub-sections, we describe in detail the performances of each INTEGRAL instrument for the above searches and derive separated upper limits on the flux of any possible electromagnetic counterpart of LVT151012.
2.1 JEM-X results
Both JEM-X modules (see also Appendix A.1) were nominally operated during the entire INTEGRAL pointing 159700850010, securing a reliable gain determination. We also verified that no particularly large background variations connected to the solar activity affected the JEM-X data collected in the time interval spanning from 300 s before the LVT151012 detection by LIGO and the end of the INTEGRAL pointing.
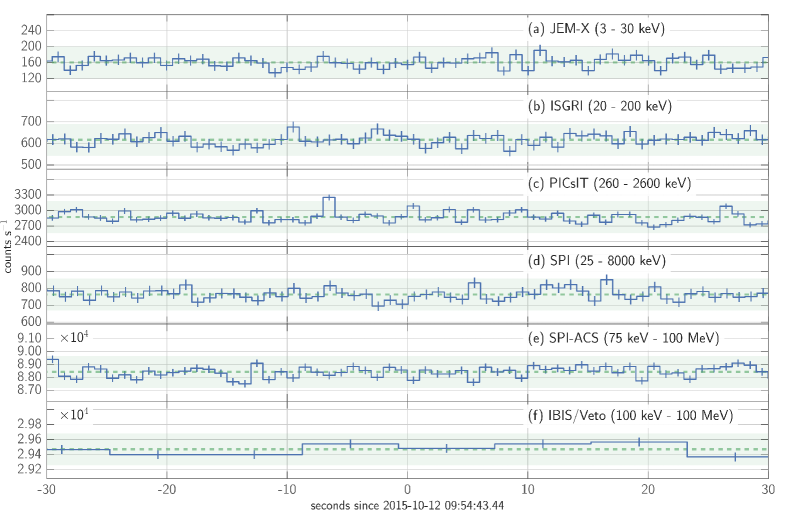
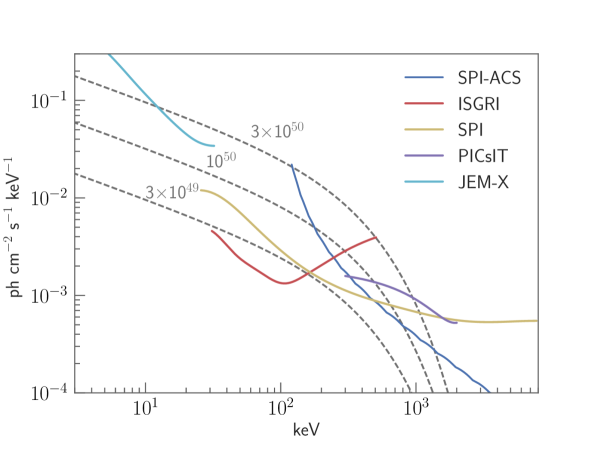
The inspection of the count-rate collected by JEM-X during the 30 seconds preceding and following the onset of LVT151012 did not show any convincing presence of impulsive events (see Figure 1a). To derive an accurate upper limit on the X-ray flux of the non-detected counterpart to the GW source, we evaluated the instrument sensitivity by using an observation of the Crab pulsar and nebula carried out earlier in the same revolution (1597). Combining the detector count-rates from both JEM-X modules, we found that the limiting detectable 3-35 keV fluence of a hard 1 s-long (soft 8 s-long) event in a location compatible with that of LVT151012 and within the instrument FoV is 4.510-8 erg cm-2 s-1 (1.610-7 erg cm-2 s-1) at 3 confidence level (see also Figure 2 for the energy dependency of the instrument sensitivity).
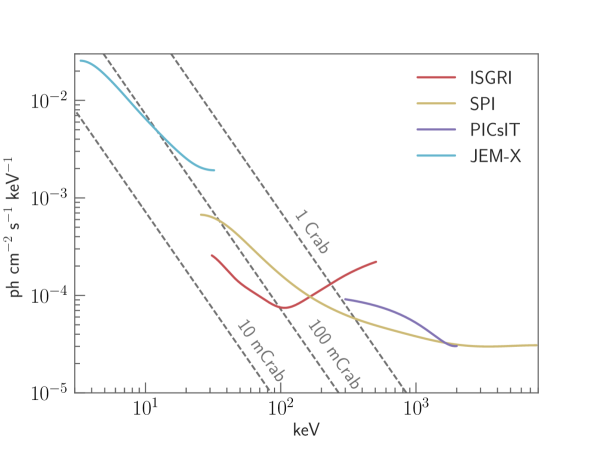
To search for a possible GRB afterglow-like event, we built the two JEM-X images in the time interval spanning from 30 seconds before the LIGO detection up to 287 s after. We made use of the standard OSA software (v10.2) distributed by the ISDC (Courvoisier et al., 2003) and combined the two images to achieve the highest possible sensitivity. We did not find any convincing source in the summed image and, assuming a powerlaw shaped energy spectrum with =-2, we estimated the most stringent 3 upper limit on the 3-35 keV X-ray flux of a source observed on-axis at 1.410-9 erg cm-2 s-1 (see also Figs. 3 and 4 for the upper limit dependency on source position within the JEM-X FoV).
As anticipated in Sect. 2, the two JEM-X modules collected about 230 s of additional data in the pointing 159700860010. An inspection of these data revealed that they were strongly affected by variable background. Thus, we do not discuss these data any further.
2.2 IBIS/ISGRI results
We searched for impulsive events in the full detector light curves (neglecting the imaging capabilities, see Appendix A.2.1 ) covering the 20–200 keV energy range and the time interval spanning from T0-30 s to T0+30 s (where T0 is the time of the LIGO trigger; see Figure 1b). No significant detection was found and we estimated the most stringent 3 upper limit on the 20 – 200 keV flux of a 1 s-long (8 s-long) event of 3.510-8 erg cm-2 s-1 (7.510-8 erg cm-2 s-1), assuming the localization of the event in the center of the instrument FoV and a typical hard (soft) GRB-like spectrum (see Table 1). The energy dependence of the upper limit for the 1 s-long hard event is shown in Figure 2. ISGRI response and sensitivity coverage for events occurring outside its FoV are illustrated in Sect. 3.1 and Figure 5 (see also Figure 10).
We searched for GRB afterglow-like events in the ISGRI image extracted with the OSA 10.2 software in the time interval ranging from T0-30 s to T0+287 s. We did not find convincing evidence of any new source that could be associated with the GW event within the ISGRI FoV. The most stringent upper limit on the corresponding flux is derived within the instrument fully coded FoV and corresponds to 7.410-10 erg cm-2 s-1 (assuming a powerlaw spectrum with a slope of ). The dependence of ISGRI sensitivity on energy during the time interval T0-30 s – T0+287 s is shown in Figure 3.
About 230 s of additional ISGRI data were accumulated starting on 2015 October 12 at during pointing 159700860010. During this time interval, the instrument was affected by larger background and we could not find any evidence for a convincing new source detection in the corresponding image. We also checked that combining these observations with the previously used exposure resulted only in a marginally improved sensitivity. Thus, we neglected ISGRI data in pointing 159700860010 while combining the results from all INTEGRAL instruments in Sect. 3.
2.3 IBIS/PICsIT results
We first built the PICsIT full detector light curves in the energy range 260-2600 keV with a time resolution of 1 s (see Figure 1c) and estimated the instrument background (together with its variance) to search for possible impulsive events within the time interval spanning from T0-30 s to T0+30 s. A marginally significant excess (signal-to-noise ratio, SNR, of 3.9) was found at T0 - 6.5 s. The corresponding post-trial significance of this excess is 2.0, too low to be considered a realistic detection. We thus set the 3 upper limit on the fluence of any 1 s-long (8 s-long) impulsive event not detected by PICsIT within the fully-coded instrument FoV at 9.710-7 erg cm-2 (1.910-6 erg cm-2). The obtained PICsIT sensitivity as a function of energy is shown in Figure 2. The PICsIT sensitivity to events occurring outside its FoV is illustrated in Sect. 3.1 (see also Figure 10).
2.4 IBIS Compton mode results
From the measurements of the IBIS Compton-mode background in the vicinity of LVT151012, we verified that the Compton kinematics could be used to reduce by 50% the background of an on-axis source and about 75% that of a source located 40 deg off-axis observed in this mode. A limited amount of detected photons have a localization accuracy as good as 10% of the sky. However, the use of only these photons to search for possible counterparts to LVT151012 would dramatically reduce the statistics of any signal that can be recorded from any point-like source. The highest sensitivity to the emission from a point source with an unknown position based on the Compton kinematics was obtained without applying any event selection, i.e., by using the total IBIS Compton-mode count-rate.
As the effective area of IBIS Compton mode is smaller than that of both ISGRI and PICsIT, the lower number of recorded photons in this mode cannot provide by definition a more stringent upper limit on the non-detected counterpart to LVT151012 when compared to what was discussed before.
2.5 IBIS/Veto Results
We show in Figure 1f the IBIS/Veto light curve close to the time of the LVT151012 detection and with a bin time of 8 s. No obvious impulsive events are found within a time interval of 30 s around the occurrence of LVT151012. Similarly to the SPI-ACS, the IBIS/Veto is unable to localize the events and provide any energy resolution. Assuming the two representative GRB spectra mentioned in Sect. 2 and considering all accessible regions of interest for the IBIS/Veto, we determined 3 upper limits on the fluence of any impulsive events in a 8 s time bin ranging from 4.410-7 erg cm-2 to 9.510-6 erg cm-2 (see also Table 1).
2.6 SPI results
We first extracted the total instrument light curve in the 25–8000 keV energy range with a time resolution of 1 s in the time interval spanning from T0-30 s to T0+30 s. This light curve is shown in Figure 1d. No clear signatures for the presence of significant impulsive events are observed.
In order to estimate the instrument sensitivity to the detection of transient sources through the coded mask imaging within the fully-coded FoV, we first performed a maximum likelihood fit in each energy bin by assuming a combined contribution to the data from detector background and a single on-axis point source. We derived a 3 upper limit on the fluence of any non-detected 1 s-long event during the investigated time interval of 5.710-7 erg cm-2 in the 25–8000 keV energy range. We show in Figure 2 the sensitivity of SPI for similar events as a function of energy. The instrument sensitivity gradually decreases in the partially coded FoV (i.e., for off-axis angles larger than 8 deg), becoming null at 16 deg.
SPI images can also be used to search for GRB afterglow-like events. We could not detect any significant new source in the available image integrated from T0–30 s to the end of the SPI observation in INTEGRAL pointing 159700850010 (T0+245 s). We estimated a correspondingly 3 upper limit on the 25–1000 keV X-ray flux of erg cm-2 s-1, assuming a power-law shaped source spectral energy distribution with a photon index of and a source located within the instrument fully-coded FoV. The dependence of SPI sensitivity on energy for the detection of GRB afterglow-like events is shown in Figure 3, while the dependence on source location within the instrument FoV is shown in Figure 4.
2.7 SPI-ACS results
We extracted the full SPI-ACS detector light curve around the time of LVT151012 detection (from T0-30 s to T0+30 s). The light curve is shown in Figure 1e and does not display any signature of significant impulsive events above the instrumental background. For the fluence upper limit evaluation, we inspected the instrument background variability and calculated the corresponding variance in the time interval spanning from T0-300 s to T0+287 s (LVT151012 occurred close to the end of INTEGRAL orbit where the instruments are usually hit by the stream of Earth magnetospheric particles). We verified that the background variability was mainly limited to a low-frequency noise ( 0.1 Hz) in the time interval of interest. As the SPI-ACS has no energy resolution and localization capabilities, its sensitivity strongly depends on the assumptions on the source spectral energy distribution and position in the sky. Considering the two representative GRB spectra mentioned in Sect. 2 and scanning the full sky area accessible to the SPI-ACS, we determined 3 upper limits on the fluence of the non-detected 1 s-long (8 s-long) event ranging from 1.310-7 erg cm-2 (3.310-7 erg cm-2) to 7.110-7 erg cm-2 (2.210-6 erg cm-2; see also Table 1).
Evaluating SPI-ACS sensitivity as a function of the energy is particularly challenging, as it depends strongly on the spectral models considered. Assuming a number of spectra described through the GRB Band model with ranging from 0 to -2, Epeak from 50 keV to 5 MeV, and from -2.5 to -5.5, we computed the function describing the maximum photon flux at different energies that each spectrum should have in order not to be detected by the SPI-ACS in 1 s (at 3 sigma confidence level). We use this function to plot a conservative estimate of SPI-ACS sensitivity in Figure 2.
 |
 |
 |
 |
| Instrument | energy range | 3 sensitivity | ||||
| 120 deg | 120 deg 80 deg | 80 deg FoV | Field of View | On-Axis | ||
| (erg cm-2) | (erg cm-2) | (erg cm-2) | (erg cm-2) | (erg cm-2) | ||
| JEM-X | 3 – 30 keV | N/A | N/A | N/A | 2.610-7, 9.210-7 | 4.510-8, 1.610-7 |
| ISGRI | 20 – 200 keV | N/A | N/A | 2.310-7, 1.110-6 | 8.310-8, 1.810-7 | 3.510-8, 7.510-8 |
| PICsIT | 260 – 2600 keV | N/A | N/A | 8.610-7, 2.410-6 | 9.710-7, 1.910-6 | 4.410-7, 8.710-7 |
| SPI | 25 – 8000 keV | N/A | N/A | N/A | 1.610-6, 2.310-6 | 3.910-7, 5.710-7 |
| SPI-ACS | 75 – 2000 keV | 3.610-7, 10-6 | 2.210-7, 610-7 | 210-7, 5.310-7 | 3.510-7, 9.510-7 | 4.210-7, 1.410-6 |
| IBIS/Veto | 100 – 2000 keV | 8.710-7, 7.610-7 | 2.110-6, 1.910-6 | 1.710-6 | 2.710-6, 2.810-6 | N/A |
| fraction of the | 48% | 12% | 19 – 36% | 4 – 19% | ||
| LVT151012 localization | ||||||
| Instrument | Energy range | Field of View | Fraction of the LVT151012 | Angular resolution | 3 sensitivity |
|---|---|---|---|---|---|
| deg2 | localization | (erg cm-2 s-1) | |||
| JEM-X | 3 – 30 keV | 110 | 4 % | 3’ | 1.410-9 |
| ISGRI | 20 – 200 keV | 820 | 19 % | 12’ | 7.410-10 |
| PICsIT | 260 – 2600 keV | 820 | 19 % | 30’ | 2.410-8 |
| SPI | 25 – 1000 keV | 790 | 18 % | 2.5∘ | 4.210-9 |
3 Results
We combine in this section all previous results in order to derive the tightest possible upper limits on any electromagnetic emission in the entire LIGO localization region that can be associated with LVT151012, depending on the assumed spectral energy distribution and event duration.
3.1 Impulsive events
By exploiting the coverage of all instruments on-board INTEGRAL, we could search for an impulsive event associated to LVT151012 in a wide energy band, covering from 3 keV to 10 MeV. The most stringent upper limits on the detection of such event were obtained in those regions of the sky included within the imaging instruments FoVs, containing up to about 20% of the total LIGO localization probability of LVT151012.
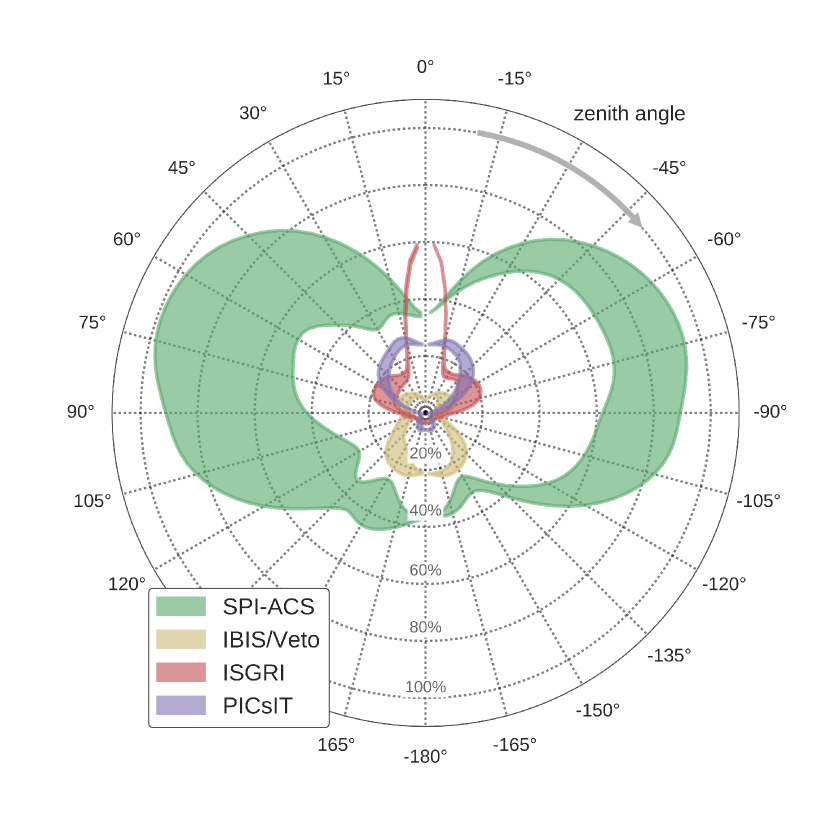
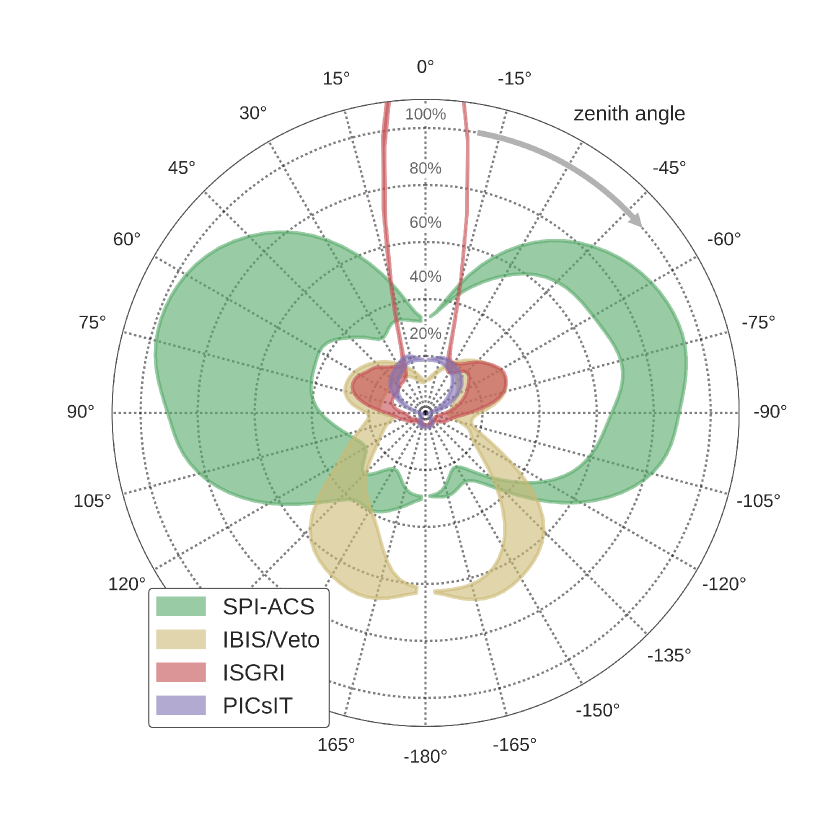
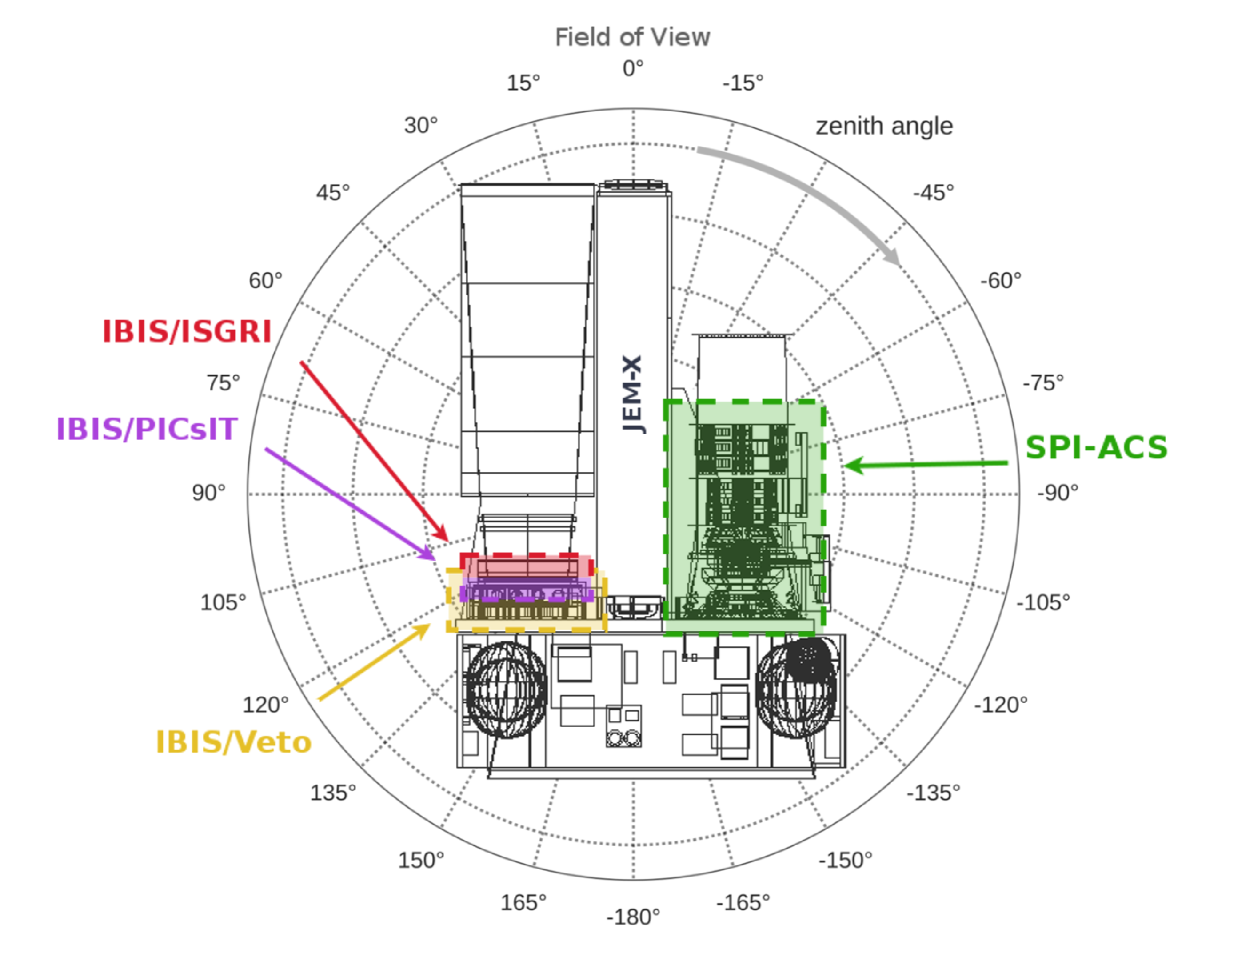
For the remaining regions, we could only derive upper limits on the fluence of non-detected events above 75 keV by exploiting the INTEGRAL omni-directional instruments and the out-of-FoV coverage provided by IBIS/ISGRI and IBIS/PICsIT. An effective way of illustrating the relative capabilities of all INTEGRAL instruments for these latter observations is provided in Figure 10. We computed in these two figures the range of detection significances achieved by each instrument for two representative GRB-like events: a short burst (1 s) characterized by a hard emission (Figure 10 upper panel) and a long burst (8 s) with a softer spectral energy distribution (Figure 10 middle panel; see also our previous definitions in Sect. 2). We assumed an arbitrary fluence for the 1 s or 8 s-long event and computed for each zenith angle the distribution of detection significances that can be achieved by the different instruments at all azimuthal angles. We normalized all these values to the highest detection significance obtained with the SPI-ACS and then used the derived distributions (excluding for clarity the 10% worst and 10% best values) to draw a shaded region per instrument representing the fraction of normalized detection significance (from 0% to 100%) as a function of the zenith angle.
We note from Figure 10 that the detection significance strongly depends on the zenith (i.e., off-axis) angle. Taking as a reference the connecting axis between SPI and IBIS, we can define two relevant hemispheres to explain this dependence. For the SPI-ACS, the rightmost shaded region is more extended due to the presence of IBIS, while the leftmost region is narrower as this corresponds to the unobstructed portion of the sky visible by the instrument. The regions derived in the figure for the IBIS/Veto, IBIS/ISGRI, and IBIS/PICsIT are more regular compared to those of the SPI-ACS, as the whole SPI assembly covers a relatively small solid angle, as seen by IBIS. The nearly vertical red lines represent the rapid transition between high sensitivity within the IBIS/ISGRI FoV and the directions for which the passive shield of IBIS starts to be important. The different orientation of all shaded regions highlight the complementarity of the different instruments to efficiently cover the whole sky.
Based on the above results and those obtained in Sect. 2, we conclude that in the case of short (1 s) impulsive events outside the imaging instruments FoVs, the most stringent upper limits are derived from the SPI-ACS in about 99% of the sky, ranging from 1.310-7 erg cm-2 to 7.110-7 erg cm-2. The IBIS/Veto is more sensitive than SPI-ACS to these events in about 1% of the sky. For impulsive events lasting more than 8 s, IBIS/Veto is more sensitive than the SPI-ACS in about 15% of the sky (see Figure 5). The sky fraction in which IBIS/Veto has a high detection efficiency is much reduced compared to that of SPI-ACS, but the upper limit on the non-detection of any electromagnetic emission associated with LVT151012 that can be obtained from the IBIS/Veto is a factor of 4 more stringent in those regions that are only accessible with a reduced SPI-ACS sensitivity (at 3 confidence level and for 8 s long events). For events occurring inside the FoV of different instruments, ISGRI provides the most stringent upper limits for both short-hard and long-soft impulsive events, while SPI is best suited to study particularly hard events with most of the photons released at energies 200 keV. JEM-X provides, in principle, coverage within the energy range 3–35 keV, but its smaller FoV compared to ISGRI makes serendipitous detections of impulsive events less likely.
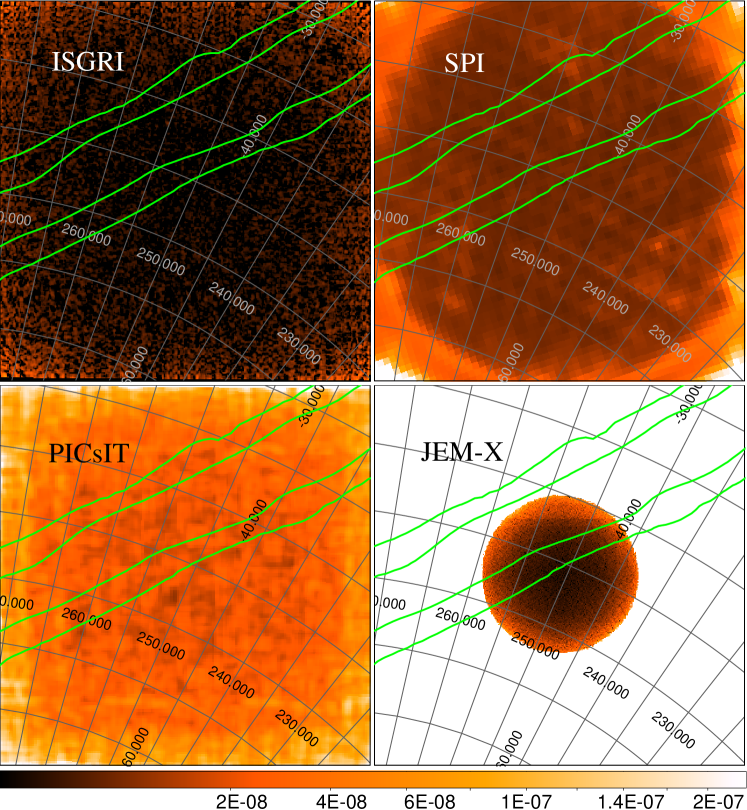
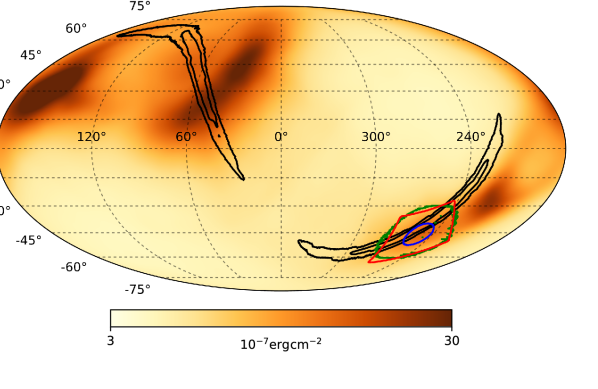
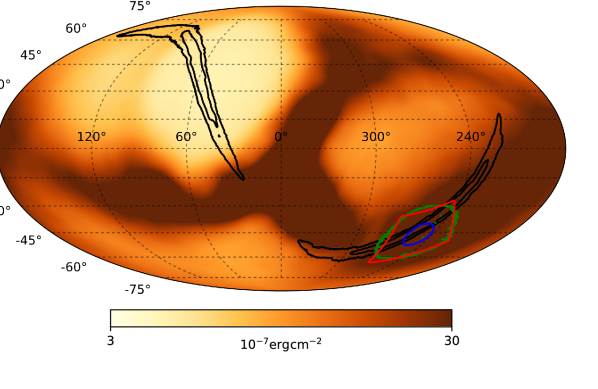
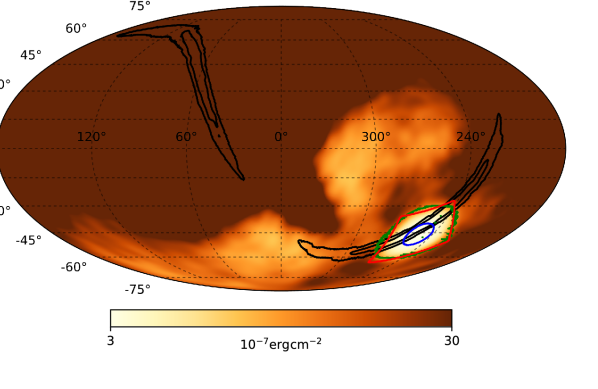
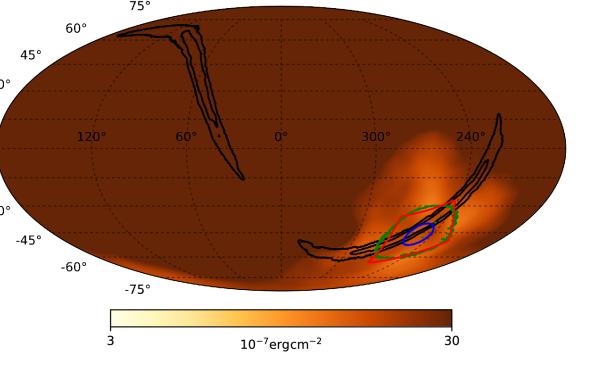
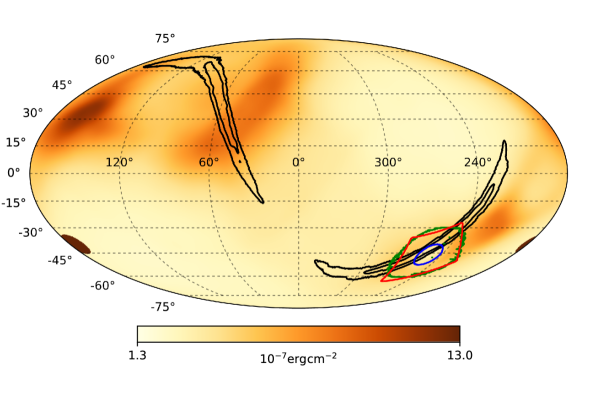
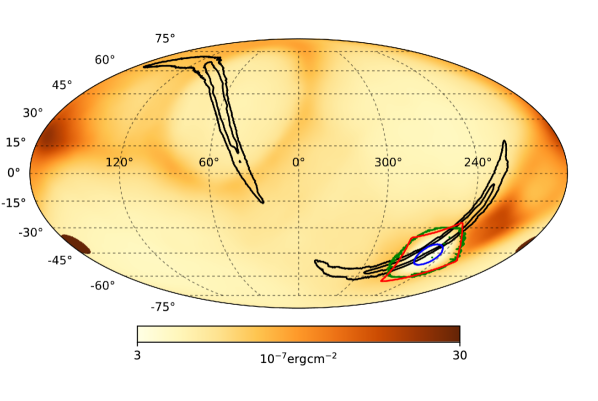
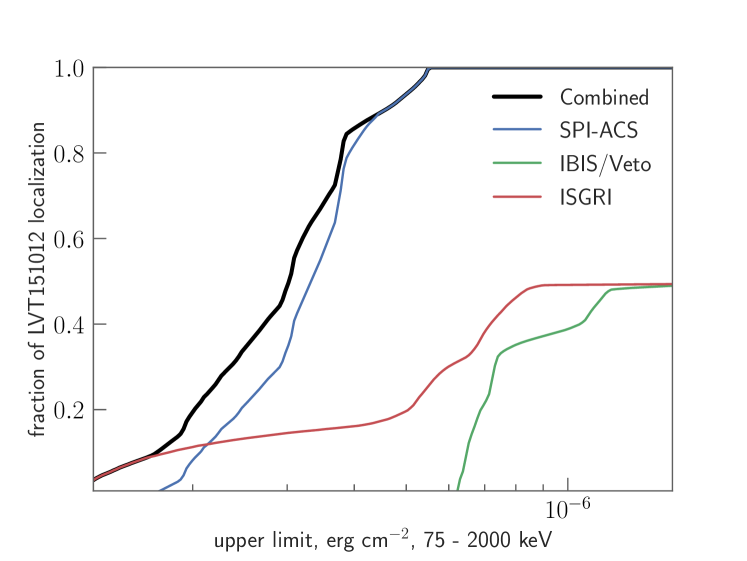
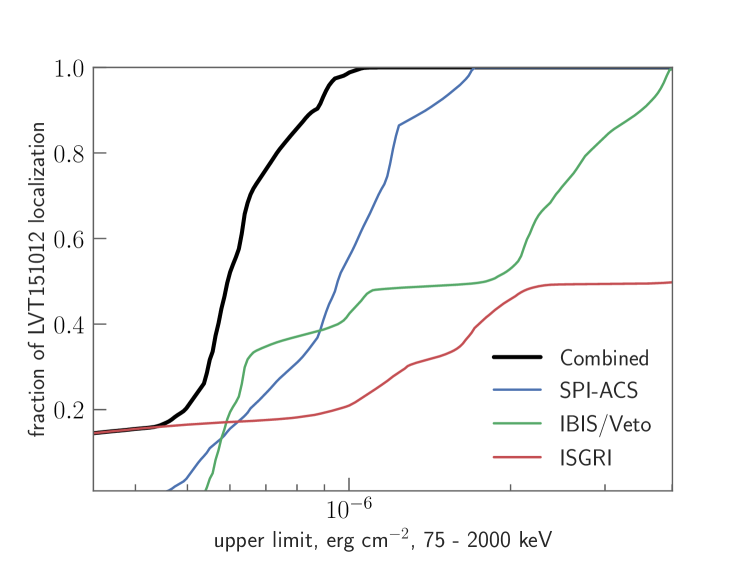
The capability of INTEGRAL to constrain gamma-ray emission from the entire highly extended LIGO localization region can be efficiently illustrated by computing the LVT151012 localization probability observed with different levels of sensitivity, see Figures 8 and 9.
Summarizing, we can identify three zones within the LIGO localization area of LVT151012 in which INTEGRAL can provide stringent upper limits on the fluence of its possible electromagnetic counterpart and which are not included within the FoVs of INTEGRAL imaging instruments:
-
1.
off-axis angles up to 80 deg (excluding the instruments FoVs). This region is simultaneously covered with almost the best achievable sensitivity of SPI-ACS and IBIS/ISGRI+PICsIT for out-of-FoV observations.
-
2.
off-axis angles ranging from 80 to 120 deg. This region is covered with the best achievable sensitivity for SPI-ACS.
-
3.
off-axis angles larger than 120 deg. In this case, SPI-ACS can only cover the region with limited sensitivity, but the IBIS/Veto almost achieves its best performances.
3.2 GRB afterglow-like emission
The upper limits on the non-detection of a GRB afterglow-like emission () from LVT151012 that we obtained inspecting the FoV of imaging instruments on-board INTEGRAL (JEM-X, IBIS/ISGRI, IBIS/PICsIT, and SPI) are summarized in Table 2. ISGRI provides the highest sensitivity to search for such emissions within the IBIS FoV (see Figure 4). Harder events with the bulk of high energy radiation emitted above 200 keV can be more efficiently detected by SPI. JEM-X is the only instrument providing coverage at energies 20 keV.
These results are particularly relevant for the dedicated target of opportunity (ToO) observations that are being planned with INTEGRAL in order to follow-up future triggers provided by LIGO and Virgo. These ToO observations will image the accessible regions of the sky included in the localization of GW events within 1 day from the trigger, thus probing mainly the presence of any long-lasting electromagnetic emission from the GW source. The complementary of INTEGRAL instruments provides a unique broad-band coverage and is very well suited to hunt for electromagnetic counterparts of GW events.
4 Discussion
INTEGRAL features a duty cycle as high as 85% for the collection of scientific data, being unable to monitor the X-ray/-ray sky only for a short amount of time around the perigee passage when all instruments are turned off due to charged particles in the Earth radiation belts. Its elongated orbit strongly limits the occultation of the accessible sky by Earth, making the suite of all available on-board instruments capable to efficiently catch the prompt emission associated with GW events, as well as to follow up any possible related afterglow in a broad energy range (3 keV–10 MeV).
SPI-ACS is the most sensitive all-sky detector of -rays with energies 100 keV among the instruments currently in operation or solidly planned in the foreseeable future. It can be efficiently exploited to hunt for the prompt emission associated to LIGO/Virgo triggers, and could provide in case of LVT151012 relatively deep 3 upper limits on the fluence of non detected counterparts on the all sky, ranging from 1.310-7 erg cm-2 to 2.210-6 erg cm-2 (see Table 1 and Figure 5). IBIS (IBIS/Veto, IBIS/ISGRI, and IBIS/PICsIT) is also able to provide monitoring of a large fraction of the sky, efficiently complementing SPI-ACS data where its sensitivity is reduced. Moreover, we showed that for the majority of transients more than one INTEGRAL all-sky instrument is able to provide significant detection, opening a possibility of constraining the signal arrival direction and its nature. Even with the current level of systematic uncertainty, in some particularly favorable cases, it is possible to narrow down to uncertainty on the event location to within 1% of the sky.
Combination of all-sky INTEGRAL detectors allows to put stringent upper limit on the hard X-ray emission associated with LVT151012. This limit can be interpreted as a constraint on ratio of isotropic equivalent electromagnetic energy emitted in an isolated burst during the LVT151012 to the total energy of the gravitational waves: ¡4.410-5 . This constraint is less tight than the one we found in the case of GW150914 (Savchenko et al., 2016) for several reasons: the LIGO event was more distant, less luminous, localized less favorably for SPI-ACS and took place near the end of INTEGRAL observations when the background was somewhat disturbed.
As the FoV of IBIS and SPI corresponds to only 2% of the sky, events similar to the prompt emission of GRBs are rarely observed within these limited areas (the situation is even worst for the two JEM-X modules, given the much smaller FoV compared to both IBIS and SPI). Although the number of correspondingly significant reported detections are relatively small (about ten detections a year for IBIS; Mereghetti, 2012), the high INTEGRAL sensitivity in the hard X-ray domain efficiently probes a population of particularly faint and soft -ray bursts, with 20–200 keV fluences down to a few 10-8 erg cm-2 (Bošnjak et al., 2014). If at least a fraction of the LIGO/Virgo localization area for the future GW triggers will overlap with the IBIS and/or SPI FoV, INTEGRAL observations could be used to localize and characterize in fairly good details the correspondingly electromagnetic counterparts, or at least put tight constraints on their hard X-ray/-ray emission (similarly to what we have done in the present paper for LVT151012). The possibility of exploiting the presence of the coded masks to obtain the JEM-X, IBIS, and SPI images allows us also to perform in these cases searches for any possible GRB afterglow-like emission associated with the GW event. This will be the main goal of the deep pointed observations that INTEGRAL aims at performing within 1 d from the announcement of future LIGO/Virgo triggers, whenever compatible with the satellite operational constraints.
For the fraction of the LVT151012 probability region in the field of view of the INTEGRAL detectors we are able to put tight upper limit on the long-lasting hard X-ray emission component. This implies a constrain on ratio of isotropic equivalent electromagnetic energy emitted in the 287 s following the LVT151012 to total energy of the gravitational waves: ¡8.910-6 . Here we have chosen energy range the most suitable for IBIS/ISGRI, which is the most sensitive instrument to a long-lasting emission characterized by our assumed spectral energy distribution (a powerlaw with a slope of ).
The nature of the hard X-ray emission that we should expect from the likely associated with GW events remains speculative. Afterglows of long and short GRBs are amongst the most anticipated counterparts of the LIGO and Virgo detections, but their hard X-ray properties are not yet well understood. When a bright nearby long GRB is observed by a sensitive hard X-ray instrument, it may remain visible for many hours. Two examples are those of GRB 990123, which was detected at energies 20 keV by BeppoSAX/PDS up to 20 ks after the onset of the event (Corsi et al., 2005), and GRB120711A, which was observed by INTEGRAL/ISGRI (INTEGRAL/JEM-X) to faint down not earlier than 10 ks (20 ks; Martin-Carrillo et al., 2014). The long-lasting hard X-ray emission of GRB120711A was shown to be remarkably similar to that recorded in the GeV band by the Fermi/LAT. As the detection of luminous GRB afterglows are not uncommon at these very high energies (Ackermann et al., 2013), it seems reasonable to expect that an associated hard X-ray emission should also be frequently observed. Convincing evidences for the presence of a slowly decaying hard X-ray and soft -ray afterglow emission has been reported for several GRBs, such as GRB 130427A (Maselli et al., 2014) and GRB 080319B (Savchenko, 2012, ,Figure 4.14). In the case of GRB 130427A, the connection between the afterglow in the hard X-ray and -ray bands was supported by a highly sensitive pointed NuSTAR observation (Kouveliotou et al., 2013). The paucity of previous detections at hard X-rays could be mostly ascribed to the relatively narrow FoV of the instruments available in this energy domain and the lack of performed follow-up observations of GRB afterglows.
Rescaling the hard X-ray afterglow of GRB 120711A (redshift of 1.4 or DL = 10 Gpc) to the distance of LVT151012 that also corresponds to the typical observational horizon of the LIGO O1/O2 runs (redshift of 0.2 or DL= 1 Gpc), would make such an event significantly detectable in ISGRI and JEM-X in the 10 days following the initial onset of the burst (we assumed here that the decay in time continued accordingly to what was observed during the initial afterglow of GRB 120711A or, in the worst case, that it followed a power-law shaped decay in time characterized by a slope not steeper than ). In case the direction of an outflow from a GRB is not aligned with the observer’s line of sight, the high energy luminosity during an afterglow will be suppressed and will reach its peak at a later time (Granot et al., 2002). Comparing the 3- sensitivity of INTEGRAL/ISGRI to the luminosity of the afterglow recorded from GRB 120711A, rescaled to a distance of 1 Gpc, we found that ISGRI could have detected such event even if the outflow was not originally pointed towards the observer, as long as the angle between the outflow direction and the line of sight was no more than 30 degrees. Note that, assuming a values of a GRB jet opening angle similar to that measured in the case of GRB 120711A, only few percent of the misaligned detections would be accompanied by a prompt emission. This suggests the presence of a considerable population of orphan hard X-ray afterglows. A similar result can be obtained for the case of GRB 130427A using the outcomes of dedicated multiwavelength observations. The hard X-ray emission associated to the afterglow of this exceptionally bright burst was observed by Swift/BAT and NuSTAR, which operate in low-Earth orbits and can point continuously to a celestial target for no longer than 3 ks. As the highly elliptical orbit of INTEGRAL enables uninterrupted observations with duration up to about two days, we estimated that the afterglow of GRB 130427A should have remained detectable to the INTEGRAL instruments for about 1 day following the onset of the event.
In at least a few cases, the prompt emission of the GRB was observed to last for more than 20 ks (e.g. Evans et al., 2014; Savchenko et al., 2013), and thus a very rapid hard X-ray follow-up could catch the burst still going off while giving rise to an associated GW emission.
Even though the above arguments show that there are promising prospects to observe the afterglows of long GRBs with INTEGRAL, it is presently expected that GW events should be associated to short GRBs following the merging of compact binary systems involving at least a neutron star. So far, no hard-X-ray afterglows have been detected from short GRBs. Fermi/LAT observations of GRB 090510 provided some indications that particularly bright short GRB could display a -ray afterglow. We conclude that the presence of an hard X-ray afterglow following at least a few short GRBs cannot be completely ruled out yet.
On the other hand, it is also possible that energetic supernovae, accompanied by a bright and long GRB, produce a distinct gravitational wave signal (see Ott, 2009, for a review).
Magnetars are also suspected to produce GWs with sufficient intensity to be detected by Advanced LIGO and Advanced Virgo (e.g. Zink et al., 2012). Several objects in this class showed outbursts lasting for a few days during which many bright flares of hard X-rays were going off, with a clearly detectable high energy emission extending up to 100 keV, producing remarkable signal in the INTEGRAL detectors (Mereghetti et al., 2009; Savchenko et al., 2010). In the future, GW signals possibly associated with these events could be efficiently followed-up with INTEGRAL.
Future GW detections might also pave the way for still unexplored (or poorly explored) physical mechanisms to trigger substantial electromagnetic emissions during these events. This was already the case when the tentative gamma-ray counterpart of GW150914 was announced (Connaughton et al., 2016). A BH-BH merger is expected to have little (if any at all) material in its immediate surroundings and was thus not considered a likely source of electromagnetic emissions so far. However, it has been speculated that even in this case a GRB-like event may be expected under some peculiar assumptions, such as the presence of a long-lived accretion disk (Perna et al., 2016), the coalescence immediately following the collapse of a star (Loeb, 2016; Woosley, 2016), the non-vanishing electric charge of a black holes (Fraschetti, 2016) or the creation of a transient naked singularity (Malafarina & Joshi, 2016). If a binary BH merger can be associated with beamed relativistic outflows, their interaction with the close-by ambient medium might led to the production of a long-lasting electromagnetic emission observable from the radio to TeV energies, similarly to what happens during a GRB afterglow (Zhu & Wang, 2016).
5 Conclusions
At odds with the cases of GW150914 and GW151226, there was no extensive multi-wavelength campaign to follow-up the discovery of LVT151012 due to the late release of the corresponding announcement by the LIGO/Virgo collaboration. Luckily, INTEGRAL was pointing towards the peak of the LIGO localization probability, allowing us to exploit the full capabilities of its instruments. We reported in this paper the serendipitous search for electromagnetic counterparts to the possible GW event by exploiting all INTEGRAL data that were collected at that time. The results of our analysis provide the most sensitive constraints obtained so far on the non-detection of any electromagnetic emission associated to LVT151012 in a large fraction of the event localization, as well as very competitive limits in the whole 90% localization region. This confirms and strengthens the potential of INTEGRAL to hunt for GW counterparts, as already demonstrated at the time of GW150914.
Using the SPI-ACS, we set a 3 upper limit on the whole localization region of LVT151012 ranging from 1.310-7 erg cm-2 to 2.210-6 erg cm-2 in 75 – 2000 keV (depending on the source location, spectrum, and duration). This result rules out the possibility that a bright impulsive burst of -rays is associated with the GW event, constraining the ratio of the isotropic equivalent energy released in such an event to the energy of the GWs: 4.410-5 . Additional upper limits are provided for specific limited regions in the sky, taking advantage of the complimentary coverage provided by the second omni-directional instrument on-board INTEGRAL, the IBIS/Veto, and the two imaging instruments capable of providing coverage also outside their FoV, i.e. the IBIS/ISGRI and IBIS/PICsIT. In particular, the data of IBIS/Veto reach a better sensitivity compared to those of SPI-ACS in the sky region located at off-axis angles larger than deg with respect to the satellite aim point, while ISGRI and PICsIT improve the sensitivity for locations in the sky up to 15 deg off-axis (30 deg in case of events characterized by a particularly soft spectral energy distribution). The most stringent upper limits for impulsive events associated with LVT151012 were obtained within the FoV of the coded-mask imaging instruments IBIS, SPI, and JEM-X, which overlapped with a large portion of the higher probability localization region of the GW event. We set a 3 upper limit of 3.510-8 erg cm-2 (7.510-8 erg cm-2) in the 20 – 200 keV energy range, 3.910-7 erg cm-2 (5.710-7 erg cm-2) in the 25 – 8000 keV energy range, and 4.510-8 erg cm-2 (1.610-7 erg cm-2) in the 3 – 30 keV energy range, in the case of a short-hard (long-soft) GRBs-like impulsive event observed close to the spacecraft aim point. All these results are summarized in Table 1.
The availability of images from IBIS, SPI, and JEM-X allowed us also to search in the correspondingly covered fraction of the sky for GRB afterglow-like events possibly associated with LVT151012. Also in this case no significant detection was found, limiting the ratio of the isotropically equivalent energy in slowly decaying hard X-ray afterglow to total GW energy to 8.910-6 . We summarized all results in Table 2. For future triggers, that will be promptly announced by the LIGO/Virgo collaboration, INTEGRAL plans dedicated pointed observations that will cover as much as possible of the event localization regions with the imaging instruments to search and characterize long-lasting high energy emission associated with GW events. The joint effort of Virgo and LIGO might also lead in the future to an enhanced localization capability for GW events that could allow INTEGRAL to cover the entire region with a single pointing.
Our non-detections of any electromagnetic counterpart to LVT151012 (to within the limiting observational capabilities of the instruments on-board INTEGRAL) remains compatible so far with the commonly accepted scenario that no hard X-ray/-ray emission is expected from the coalescence of a binary black hole.
Acknowledgements.
This paper is based on data from observations with INTEGRAL, an ESA project with instruments and science data center funded by ESA member states (especially the PI countries: Denmark, France, Germany, Italy, Spain, and Switzerland), Czech Republic and Poland, and with the participation of Russia and the USA. The SPI-ACS detector system has been provided by MPE Garching/Germany. We acknowledge the German INTEGRAL support through DLR grant 50 OG 1101. The Italian INTEGRAL/IBIS team acknowledges the support of ASI/INAF agreement n. 2016-025-R.0. AL and RS acknowledge the support from the Russian Science Foundation (grant 14-22-00271). Some of the results in this paper have been derived using the HEALPix (Górski et al., 2005) package. We are grateful the François Arago Centre at APC for providing computing resources, and VirtualData from LABEX P2IO for enabling access to the StratusLab academic cloud. Finally we thank the referee for careful reading of the manuscript and for the insightful comments.Appendix A Instrument description
A.1 JEM-X
JEM-X is a coded-mask X-ray monitor consisting of two identical Microstrip Gas Chamber modules which are simultaneously operational since 2010 (Lund et al., 2003). The two modules are surrounded by a collimator tube that is nearly opaque to X-rays between 3 and 35 keV, where JEM-X is collecting science data. For this reason, the instrument is not useful to search for impulsive events occurring outside its FoV. As JEM-X is endowed with a relatively large FoV, featuring a diameter of 13.2 deg at zero response, and provides coverage in an energy range that is not accessible by any other INTEGRAL instrument, it is particularly well suited and best exploited to search for long-lasting soft X-ray transients. The extraction of reliable measurements from the JEM-X science data is not always straightforward, as the response of the detector is occasionally unstable during the observations, owing to temperature changes, irregularities introduced by detector cold start, or autonomous switch-offs and reactivations.
A.2 IBIS
IBIS is a hard X-ray telescope characterized by a relatively good angular resolution of about 12 arcmin and a point source location accuracy (PSLA) of 1–3 arcmin (for sources with typical fluxes of a few mCrab in the 20-40 keV energy range). The reconstruction of sky images is performed by exploiting the availability of a coded mask located 3.2 m above the detection plane at the extreme end of the telescope. This results in a 99 degree fully-coded FoV, extending to about 3030 degrees when the zero-response partially coded FoV is considered.
The IBIS collimation system is made by using a passive shield. Its structural components are composed by a 1 mm thick tungsten hopper (placed on top of the detection systems) and a lead tube with a variable thickness extended up to the mask. A 1.5 mm thick lead door complements the shield in the direction opposite to SPI (see Figure 10 bottom panel). The whole system, becoming increasingly transparent for energies above 200 keV, was designed to reduce the diffuse sky component of the instrument background.
The detection plane consists of 2 layers. The top, ISGRI, is optimized for the collection of photons up to energies of keV and placed 90 mm above the other layer, PICsIT. The latter covers a higher energy range extending up to 10 MeV. Both detector arrays are surrounded by an active shield, the IBIS/Veto system, which is essential to reduce the cosmic-ray-induced instrument background.
A.2.1 ISGRI
IBIS/ISGRI (Lebrun et al., 2003) is the top detector layer of the IBIS telescope and is made of 16384 4x4 mm and 2 mm thick CdTe pixels. It is sensitive to photons with energies between 15 and 800 keV and retains a detection efficiency of nearly 100% for photons up to 100 keV. The effective area of ISGRI is reduced in the energy range 100 keV-1 MeV, as it becomes increasingly optically thin to such radiation. In this energy range, photons begin to interact with the full volume of the detector pixels. The charge collection for interactions occurring at large depths in the detector is less efficient, complicating reconstruction of the incident photon energy. Nevertheless, ISGRI maintains good energy resolution up to 800 keV, thanks to the original software-based charge loss correction. The charge loss is reduced for photons arriving from highly off-axis sources, thus increasing the instrument performances for the study of such objects. The instrumental energy resolution toward the end of 2015 ranged from 15% at 60 keV to 9% at 511 keV (full width half maximum, FWHM). These values slowly worsen with time due to the degradation of the detector gain. The latter is related to the evolution of charge collection efficiency driven by the long term irradiation of the detector in space (Caballero et al., 2013), becoming the principal cause for the current systematic uncertainties in the instrument calibrations. For the same reason, the characteristic low-energy threshold of the instrument increased from 15 keV at launch to 22 keV in 2015, at the same time becoming progressively less sharp. Simultaneous increase and smoothening of low threshold efficiency cut-off implies that photons with energies not far above 15 keV can still be detected after more than 14 years in orbit, albeit with dramatically decreased efficiency.
The coded mask through which ISGRI is usually observing the high-energy sky cannot be fully exploited when searching for impulsive events within the fully-coded FoV, when their location is not known. While the sensitivity for a source in a fixed location can be improved by using the coded mask pattern to reject about 50% of the background, this advantage is lost in a search for a new source due to additional trial factor. The conditions are different in the partially coded FoV, as a progressively smaller fraction of the detector is exposed through the coded mask holes and searches for short transients could be optimized by considering a smaller portion of the detector relevant for specific directions. This reduces the background, which is proportional to the total effective area used for the search. The instrument sensitivity is, however, also reduced by exploring lower effective areas, rapidly approaching that of the SPI-ACS (see Figs. 4 and 10 upper panel). We generally prefer to rely on the light curves built from the entire detector to search for impulsive events in the ISGRI data.
As the IBIS collimator tube is becoming increasingly transparent at energies above 200 keV, photons from directions that are up to 80 deg off-axis with respect to the satellite aim point can reach the ISGRI detectors, making this instrument capable to detect also events occurring outside its FoV. Even soft events, with the bulk of photons released below 200 keV, can also be detected in ISGRI despite the absorption by the IBIS shield and other satellite structures. For the very same reason, photons from soft events produce a highly contrasted pattern on the ISGRI detector plane, which can be used to roughly constrain the source location (similarly to what is done with a higher precision when the event is recorded through the coded mask within the instrument FoV).
ISGRI is particularly well suited to search for rather long transients, i.e., those associated to GRB afterglows, because the coded mask imaging allows us to better characterize the instrument background as well as persistent sources, accurately subtracting their contribution from the data to probe the presence of faint transients.
A.3 PICsIT
IBIS/PICsIT (Labanti et al., 2003) is the bottom detector layer of the IBIS telescope and it is located 90 mm below ISGRI. It is made of 4096 30 mm-thick CsI pixels, featuring a total collecting area of about 2900 cm2 and sensitive to photons with energies between 175 keV and 10 MeV. In this energy range, the IBIS collimator tube is largely transparent and thus PICsIT can observe sources from all the directions that are not occulted by IBIS/Veto (i.e. with off-axis angles as large as 70 deg; see Sect. A.4). The effective area of the instrument is slowly decreasing as a function of off-axis angle, mainly due to the effect of the PICsIT planar geometry combined with the change in opacity of the shield and ISGRI detector plane. As the instrument coded mask opacity to hard X-ray photons is larger than that of the passive shield, PICsIT in principle collects more signal from sources outside the FoV rather than those closer to the satellite aim point (at odds with the case of ISGRI). This leads to a sensitivity increase for isolated bright impulsive events. In these cases, the background variability can be often neglected and its average level well constrained before and after the event, without relying on the coded mask.
To evaluate the response of PICsIT to high energy bursts from any sky direction, it is important to take into account the partial absorption of the corresponding radiation by the satellite structures. We thus performed Monte-Carlo simulations using the INTEGRAL mass model previously described by Ferguson et al. (2003) and improving it through the inclusion of a more detailed IBIS mass model (Laurent et al., 2003). We validated our approach by comparing the results obtained for the detection of sources within the instrument FoV with the predictions of the PICsIT responses based on the up-to-date instrument calibrations provided by the instrument team.
A.3.1 IBIS Compton mode
When an incident photon undergoes Compton scattering in ISGRI, the scattered photon may be subsequently detected by PICsIT. It is also possible that a photon is Compton back-scattered in PICsIT and then detected in ISGRI. The electronics of IBIS identifies such nearly simultaneous interactions and records them in the so-called Compton mode data (Ubertini et al., 2003). The effective area of the Compton mode is lower than that of both ISGRI and PICsIT, reaching 50 cm2 at 400 keV for a 30 deg off-axis source.
In principle, it is possible to use the Compton kinematics to constrain the photon arrival direction and reject spurious coincidences between independent ISGRI and PiCSIT events, being these the main background component. When searching for a known source, the Compton-mode sensitivity can be improved by excluding events incompatible with a given source location (Forot et al., 2007). The localization area for a single photon is primarily limited by the PICsIT energy resolution and can be as small as 5% of the sky for a 2 MeV incident photon. However, its size strongly depends on the energies of incident and Compton scattered photons. For a typical background spectrum, only a small fraction of the interactions can be well-localized: appropriate event selections provide an average localization area per photon of about 20% of the sky. Selections based on the event localization accuracy suppresses the background and improves the determination of source coordinates, but reduces the number of usable photons. The trade-off between the event localization accuracy and the number of usable events has to be evaluated on a case-by-case basis. Our results on LVT151012 apply to a wide range of conditions and should be considered representative in the case of weak transient sources.
In the case of brighter events, the Compton mode offers an important advantage, as it suffers much less telemetry stream saturation gaps than both ISGRI and PiCSIT. If the prompt emission associated with a GW event is bright enough to be detected in the IBIS Compton mode data, the localization of this event could be even more precise. We expect that an angular resolution better 5 deg can be achieved for a 1 s-long event characterized by a spectral energy distribution similar to that of a short-hard GRB and a fluence larger than erg cm-2 (assuming the event occurs in the area covered with the optimal sensitivity of the IBIS Compton mode). A GRB-like event yielding a 20 detection in the IBIS Compton mode would also give rise to a detection at a significance of at least 50 in SPI-ACS (300 for most of the accessible source directions). We thus expect to exploit data collected by IBIS in Compton mode only when a very strong detection of the same event is reported in SPI-ACS, IBIS/ISGRI, and IBIS/PICsIT.
A.4 IBIS/Veto
The bottom and lateral sides of the IBIS detectors are surrounded by an active anti-coincidence shield, IBIS/Veto, which is made of 2 cm thick BGO crystals (Quadrini et al., 2003). The count-rate of IBIS/Veto is continuously integrated every 8 s and transmitted to the ground, making this subsystem an efficient detector of GRBs (as well as other -ray transient phenomena), albeit with a reduced sensitivity for events shorter than the nominal integration time.
We used Monte-Carlo simulations exploiting the INTEGRAL mass model (Ferguson et al., 2003) to compute the response of IBIS/Veto (see Figure 10). We checked our results by using the observations of bright GRBs that were detected by Fermi/GBM. For a good match, we had to adjust the low energy threshold of the IBIS/Veto system for which we have a limited description. The estimated discrepancy between the observed number of counts in the IBIS/Veto and those expected based on the GBM results is found in all cases to be 20%.
IBIS/Veto is a particularly useful instrument to study sources with off-axis angles larger than 120 deg, where the sensitivity of ISGRI, PICsIT, and the IBIS Compton mode are low. At these angles, also the coverage provided by the SPI-ACS is limited (see Figure 5). We also note that there is a relatively small fraction of the sky (about 15%, depending on the source spectral energy distribution) for which the effective area of the IBIS/Veto is larger than that of the SPI-ACS. Owing to its lower background, the IBIS/Veto has a factor of 4 improved sensitivity compared to the SPI-ACS for the detection of impulsive events that are longer than 8 s and localized in some directions close to the opposite of satellite pointing axis (see Fig 10).
A.5 SPI
SPI is a -ray spectrometer made of 19 hexagonal high-purity Germanium detectors. A tungsten coded aperture mask characterized by a hexagonal pattern is located 1.7 m above the detection plane of the instrument, thus allowing SPI to image a large region of the sky at once (the fully-coded FoV radius is 8 deg) with a typical angular resolution of 2.5 deg.
The Germanium detectors are surrounded by an active anti-coincidence shield, SPI-ACS, forming a collimator tube and a bottom shield. SPI-ACS is made of 91 BGO (Bismuth Germanate, Bi4Ge3O12) scintillator crystals and is very efficient in preventing -rays from reaching the germanium detectors from every direction apart from the instrument FoV (see Sect. A.5.1). SPI data can thus only be exploited to study sources within its FoV.
A.5.1 SPI-ACS
Besides its main function of providing a veto signal for charged particles irradiating the SPI instrument, ACS is also able to provide the count-rate corresponding to all impinging particles and high energy photons. It can thus be used as a nearly omnidirectional detector of transient events with an effective area reaching 0.7 m2 at energies above 75 keV and a time resolution of 50 ms (von Kienlin et al., 2003). The effective area of SPI-ACS is strongly affected by the opacity of materials, which are used for the INTEGRAL satellite structure and other instrument detectors. To estimate this opacity, we performed a number of Monte-Carlo particle transport simulations using both the SPI detector mass model (Sturner et al., 2003) and the INTEGRAL satellite mass model (TIMM; Ferguson et al., 2003). We verified that both models predicted similar count-rates for the known impulsive events observed by SPI-ACS to within an accuracy of 20%. For the detector response evaluation, we made use only of the TIMM, as it known to include a more accurate description of spacecraft structures.
References
- Abbott et al. (2016a) Abbott, B. P., Abbott, R., Abbott, T. D., et al. 2016a, Physical Review X, 6, 041015
- Abbott et al. (2016b) Abbott, B. P., Abbott, R., Abbott, T. D., et al. 2016b, Physical Review Letters, 116, 241103
- Abbott et al. (2016c) Abbott, B. P., Abbott, R., Abbott, T. D., et al. 2016c, ApJ, 826, L13
- Abbott et al. (2016d) Abbott, B. P., Abbott, R., Abbott, T. D., et al. 2016d, Phys. Rev. Lett., 116, 061102
- Abbott et al. (2016e) Abbott, B. P., Abbott, R., Abbott, T. D., et al. 2016e, ApJS, 225, 8
- Abe et al. (2016) Abe, K., Haga, K., Hayato, Y., et al. 2016, ApJ, 830, L11
- Ackermann et al. (2013) Ackermann, M., Ajello, M., Asano, K., et al. 2013, ApJS, 209, 11
- Adriani et al. (2016) Adriani, O., Akaike, Y., Asano, K., et al. 2016, ApJ, 829, L20
- Band et al. (1993) Band, D., Matteson, J., Ford, L., et al. 1993, ApJ, 413, 281
- Bošnjak et al. (2014) Bošnjak, Ž., Götz, D., Bouchet, L., Schanne, S., & Cordier, B. 2014, A&A, 561
- Caballero et al. (2013) Caballero, I., Zurita Heras, J. A., Mattana, F., et al. 2013, ArXiv e-prints [arXiv:1304.1349]
- Connaughton et al. (2016) Connaughton, V., Burns, E., Goldstein, A., et al. 2016, ApJ, 826, L6
- Corsi et al. (2005) Corsi, A., Piro, L., Kuulkers, E., et al. 2005, A&A, 438, 829
- Courvoisier et al. (2003) Courvoisier, T. J.-L., Walter, R., Beckmann, V., et al. 2003, A&A, 411, L53
- Cowperthwaite et al. (2016) Cowperthwaite, P. S., Berger, E., Soares-Santos, M., et al. 2016, ApJ, 826, L29
- Einstein (1916) Einstein, A. 1916, Sitzungsberichte der Königlich Preußischen Akad. der Wissenschaften (Berlin), Seite 688-696.
- Evans et al. (2014) Evans, P. A., Willingale, R., Osborne, J. P., et al. 2014, MNRAS, 444, 250
- Ferguson et al. (2003) Ferguson, C., Barlow, E. J., Bird, A. J., et al. 2003, A&A, 411, L19
- Forot et al. (2007) Forot, M., Laurent, P., Lebrun, F., & Limousin, O. 2007, ApJ, 668, 1259
- Fraschetti (2016) Fraschetti, F. 2016, ArXiv e-prints [arXiv:1603.01950]
- Gando et al. (2016) Gando, A., Gando, Y., Hachiya, T., et al. 2016, ApJ, 829, L34
- Górski et al. (2005) Górski, K., Hivon, E., Banday, A., et al. 2005, ApJ, 622, 759
- Granot et al. (2002) Granot, J., Panaitescu, A., Kumar, P., & Woosley, S. E. 2002, ApJ, 570, L61
- Greiner et al. (2016) Greiner, J., Burgess, J. M., Savchenko, V., & Yu, H.-F. 2016, ApJ, 827, L38
- Gruber et al. (2014) Gruber, D., Goldstein, A., Weller von Ahlefeld, V., et al. 2014, ApJS, 211, 12
- Hulse & Taylor (1975) Hulse, R. & Taylor, J. 1975, ApJ, 195, L51
- Kouveliotou et al. (2013) Kouveliotou, C., Granot, J., Racusin, J. L., et al. 2013, ApJ, 779, L1
- Kramer et al. (2006) Kramer, M., Stairs, I. H., Manchester, R. N., et al. 2006, Science, 314, 97
- Labanti et al. (2003) Labanti, C., Di Cocco, G., Ferro, G., et al. 2003, A&A, 411, L149
- Laurent et al. (2003) Laurent, P., Limousin, O., Cadolle-Bel, M., et al. 2003, A&A, 411,
- Lebrun et al. (2003) Lebrun, F., Leray, J. P., Lavocat, P., et al. 2003, A&A, 411,
- Loeb (2016) Loeb, A. 2016, ApJ, 819, L21
- Lund et al. (2003) Lund, N., Budtz-Jørgensen, C., Westergaard, N. J., et al. 2003, A&A, 411, L231
- Malafarina & Joshi (2016) Malafarina, D. & Joshi, P. S. 2016, ArXiv e-prints [arXiv:1603.02848]
- Marcinkowski et al. (2006) Marcinkowski, R., Denis, M., Bulik, T., et al. 2006, A&A, 452, 113
- Marcinkowski et al. (2007) Marcinkowski, R., Denis, M., Bulik, T., et al. 2007, in ESA Spec. Publ., Vol. 622, 609
- Martin-Carrillo et al. (2014) Martin-Carrillo, A., Hanlon, L., Topinka, M., et al. 2014, A&A, 567, A84
- Mas-Hesse et al. (2003) Mas-Hesse, J. M., Giménez, A., Culhane, J. L., et al. 2003, A&A, 411, L261
- Maselli et al. (2014) Maselli, A., Melandri, A., Nava, L., et al. 2014, Science, 343, 48
- Mereghetti (2012) Mereghetti, S. 2012, in Proc. ”An Integr. view high-energy sky (the first 10 years)” - 9th Integr. Work. Celebr. 10th Anniv. launch (INTEGRAL 2012). 15-19 Oct. 2012. Bibl. Natl. Fr. Paris, Fr. Publ. o, 126
- Mereghetti et al. (2009) Mereghetti, S., Götz, D., Weidenspointner, G., et al. 2009, ApJ, 696, L74
- Ott (2009) Ott, C. D. 2009, Classical and Quantum Gravity, 26, 063001
- Patricelli et al. (2016) Patricelli, B., Razzano, M., Cella, G., et al. 2016, J. Cosmology Astropart. Phys., 11, 056
- Perna et al. (2016) Perna, R., Lazzati, D., & Giacomazzo, B. 2016, ApJ, 821, L18
- Quadrini et al. (2003) Quadrini, E. M., Bazzano, A., Bird, A. J., et al. 2003, A&A, 411, L153
- Racusin et al. (2016) Racusin, J. L., Burns, E., Goldstein, A., et al. 2016, ArXiv e-prints [arXiv:1606.04901]
- Savchenko (2012) Savchenko, V. 2012, Gamma-ray bursts, PhD thesis
- Savchenko et al. (2013) Savchenko, V., Beckmann, V., Ferrigno, C., et al. 2013, GRB Coordinates Network, 15259
- Savchenko et al. (2016) Savchenko, V., Ferrigno, C., Mereghetti, S., et al. 2016, ApJ, 820, L36
- Savchenko et al. (2010) Savchenko, V., Neronov, A., Beckmann, V., Produit, N., & Walter, R. 2010, A&A, 510, A77
- Siellez et al. (2013) Siellez, K., Boer, M., & Gendre, B. 2013, MNRAS, 437, 649
- Sturner et al. (2003) Sturner, S., Shrader, C., Weidenspointner, G., et al. 2003, A&A, 411, L81
- The Pierre Auger Collaboration et al. (2016) The Pierre Auger Collaboration, Aab, A., Abreu, P., et al. 2016, ArXiv e-prints [arXiv:1608.07378]
- Ubertini et al. (2003) Ubertini, P., Lebrun, F., Di Cocco, G., et al. 2003, A&A, 411, L131
- Vedrenne et al. (2003) Vedrenne, G., Roques, J.-P., Schönfelder, V., et al. 2003, A&A, 411, L63
- von Kienlin et al. (2003) von Kienlin, A., Beckmann, V., Rau, A., et al. 2003, A&A, 411, L299
- Voss & Tauris (2003) Voss, R. & Tauris, T. M. 2003, MNRAS, 342, 1169
- Winkler et al. (2003) Winkler, C., Courvoisier, T. J.-L., di Cocco, G., et al. 2003, A&A, 411, L1
- Woosley (2016) Woosley, S. E. 2016, ApJ, 824, L10
- Yoshida et al. (2016) Yoshida, M., Utsumi, Y., Tominaga, N., et al. 2016, PASJ[arXiv:1611.01588]
- Zhu & Wang (2016) Zhu, Q.-Y. & Wang, X.-Y. 2016, ApJ, 828, L4
- Zink et al. (2012) Zink, B., Lasky, P. D., & Kokkotas, K. D. 2012, Phys. Rev. D, 85, 024030