| Anisotropic thermal conductivity and mechanical properties of phagraphene: A molecular dynamics study | |
| Luiz Felipe C. Pereiraa, Bohayra Mortazavib, Meysam Makaremic and Timon Rabczukd | |
| Phagraphene is a novel 2D carbon allotrope with interesting electronic properties which has been recently theoretically proposed. Phagraphene is similar to a defective graphene structure with an arrangement of pentagonal, heptagonal and hexagonal rings. In this study we investigate thermal conductivity and mechanical properties of phagraphene using molecular dynamics simulations. Using the non-equilibrium molecular dynamics method, we found the thermal conductivity of phagraphene to be anisotropic, with room temperature values of W/m-K along the armchair direction and W/m-K along the zigzag direction. Both values are one order of magnitude smaller than pristine graphene. Analysis of phonon group velocities also shows a significant reduction in this quantity for phagraphene in comparison to graphene. By performing uniaxial tensile simulations, we studied the deformation process and mechanical response of phagraphene. We found that phagraphene exhibits a remarkable high tensile strength around GPa, whereas its elastic modulus is also anisotropic along in-plane directions, with values of GPa and GPa for armchair and zigzag directions respectively. The lower thermal conductivity of phagraphene along with its predicted electronic properties suggests that it could be a better candidate than graphene in future carbon-based thermoelectric devices. |
1 Introduction
Since the first experiments with graphene 1, 2, 3 the range of predicted and produced two-dimensional carbon-based materials has increased considerably 4. Graphene remains the most stable planar form of carbon with honeycomb atomic arrangement. Nonetheless, some of these novel carbon-based materials have already been produced, such as nitrogenated holey graphene 5 and amorphized graphene heterostructures 6, while some have only been theoretically proposed, such as the carbon allotropes penta-graphene 7 and phagraphene 8. Phagraphene is a new planar carbon allotrope composed of 5-6-7 carbon rings 8. First principles calculations based on density functional theory have shown that this planar carbon allotrope is energetically comparable to graphene 8. In fact, these recent first principles calculations confirm that phagraphene is more favorable than other planar carbon allotropes proposed so far, not only because of its sp2-hybridization, but also due to its dense atomic packing 8.
Graphene presents an extraordinary and unique combination of superior physical properties, such as ballistic electronic transport 9, 10, high thermal conductivity 11, 12, 13 and remarkable mechanical strength 14. Among the novel carbon-based materials there is a wealth of physical properties. For example, nitrogenated holey graphene is a semiconductor with a band gap eV 5, while penta-graphene is predicted to have a eV band gap 7. Similar to graphene, phagraphene also presents peculiar electronic properties due to the prediction of distorted Dirac cones. Nevertheless, to the best of our knowledge, the thermal conduction and mechanical properties of phagraphene have not yet been studied neither theoretically nor experimentally. The objective of this work is therefore to evaluate thermal transport properties and mechanical strength of phagraphene via computer simulations in order to guide future experimental investigations.
In the present work we employ classical molecular dynamics simulations to calculate the thermal conductivity of phagraphene at room temperature, as well as to determine its elastic modulus and mechanical strength. The in-plane thermal conductivity of phagraphene was obtained via non-equilibrium molecular dynamics simulations (NEMD), which include a finite temperature gradient and resemble most experimental setups 12. The mechanical response of phagraphene was investigated by performing uniaxial tensile stress simulations, from which we determine the elastic modulus and the breaking strength of the material. We find that the thermal conductivity of phagraphene is one order of magnitude smaller than that of graphene, while its elastic modulus and tensile strain are comparable to graphene, albeit a little smaller. Remarkably, our simulations show that the thermal conductivity and the elastic modulus of phagraphene are direction dependent, presenting an in-plane anisotropy not observed in the case of graphene and other two-dimensional carbon-based materials.
2 Molecular dynamics modeling
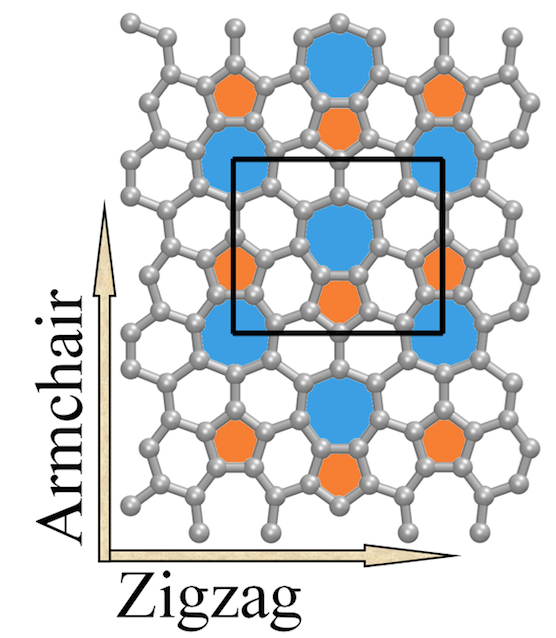
The atomic structure of phagraphene is depicted in Fig. 1, which includes a special pattern of pentagonal, hexagonal and heptagonal carbon rings, as well as space-inversion symmetry. In fact, there are only 6 inequivalent carbon atoms in the 20-atom rectangular unit cell shown in Fig. 1. Also indicated are the armchair and zigzag directions of the phagraphene lattice structure, defined in analogy to the ones in graphene. In our study, both mechanical and heat conduction properties were investigated along armchair and zigzag directions. All structures simulated in this work are periodic along the planar directions. Interaction between carbon atoms are modeled by the Tersoff empirical potential with parameters optimized for graphene and carbon nanotubes 15, 16. This optimized Tersoff potential had been shown to appropriately reproduce phonon dispersions of graphene, and has been employed in several studies involving thermal transport 17, 18, 12, 19, 20, 21, 22, 23 and mechanical properties 24, 23, 25 of graphene and graphene-like materials.
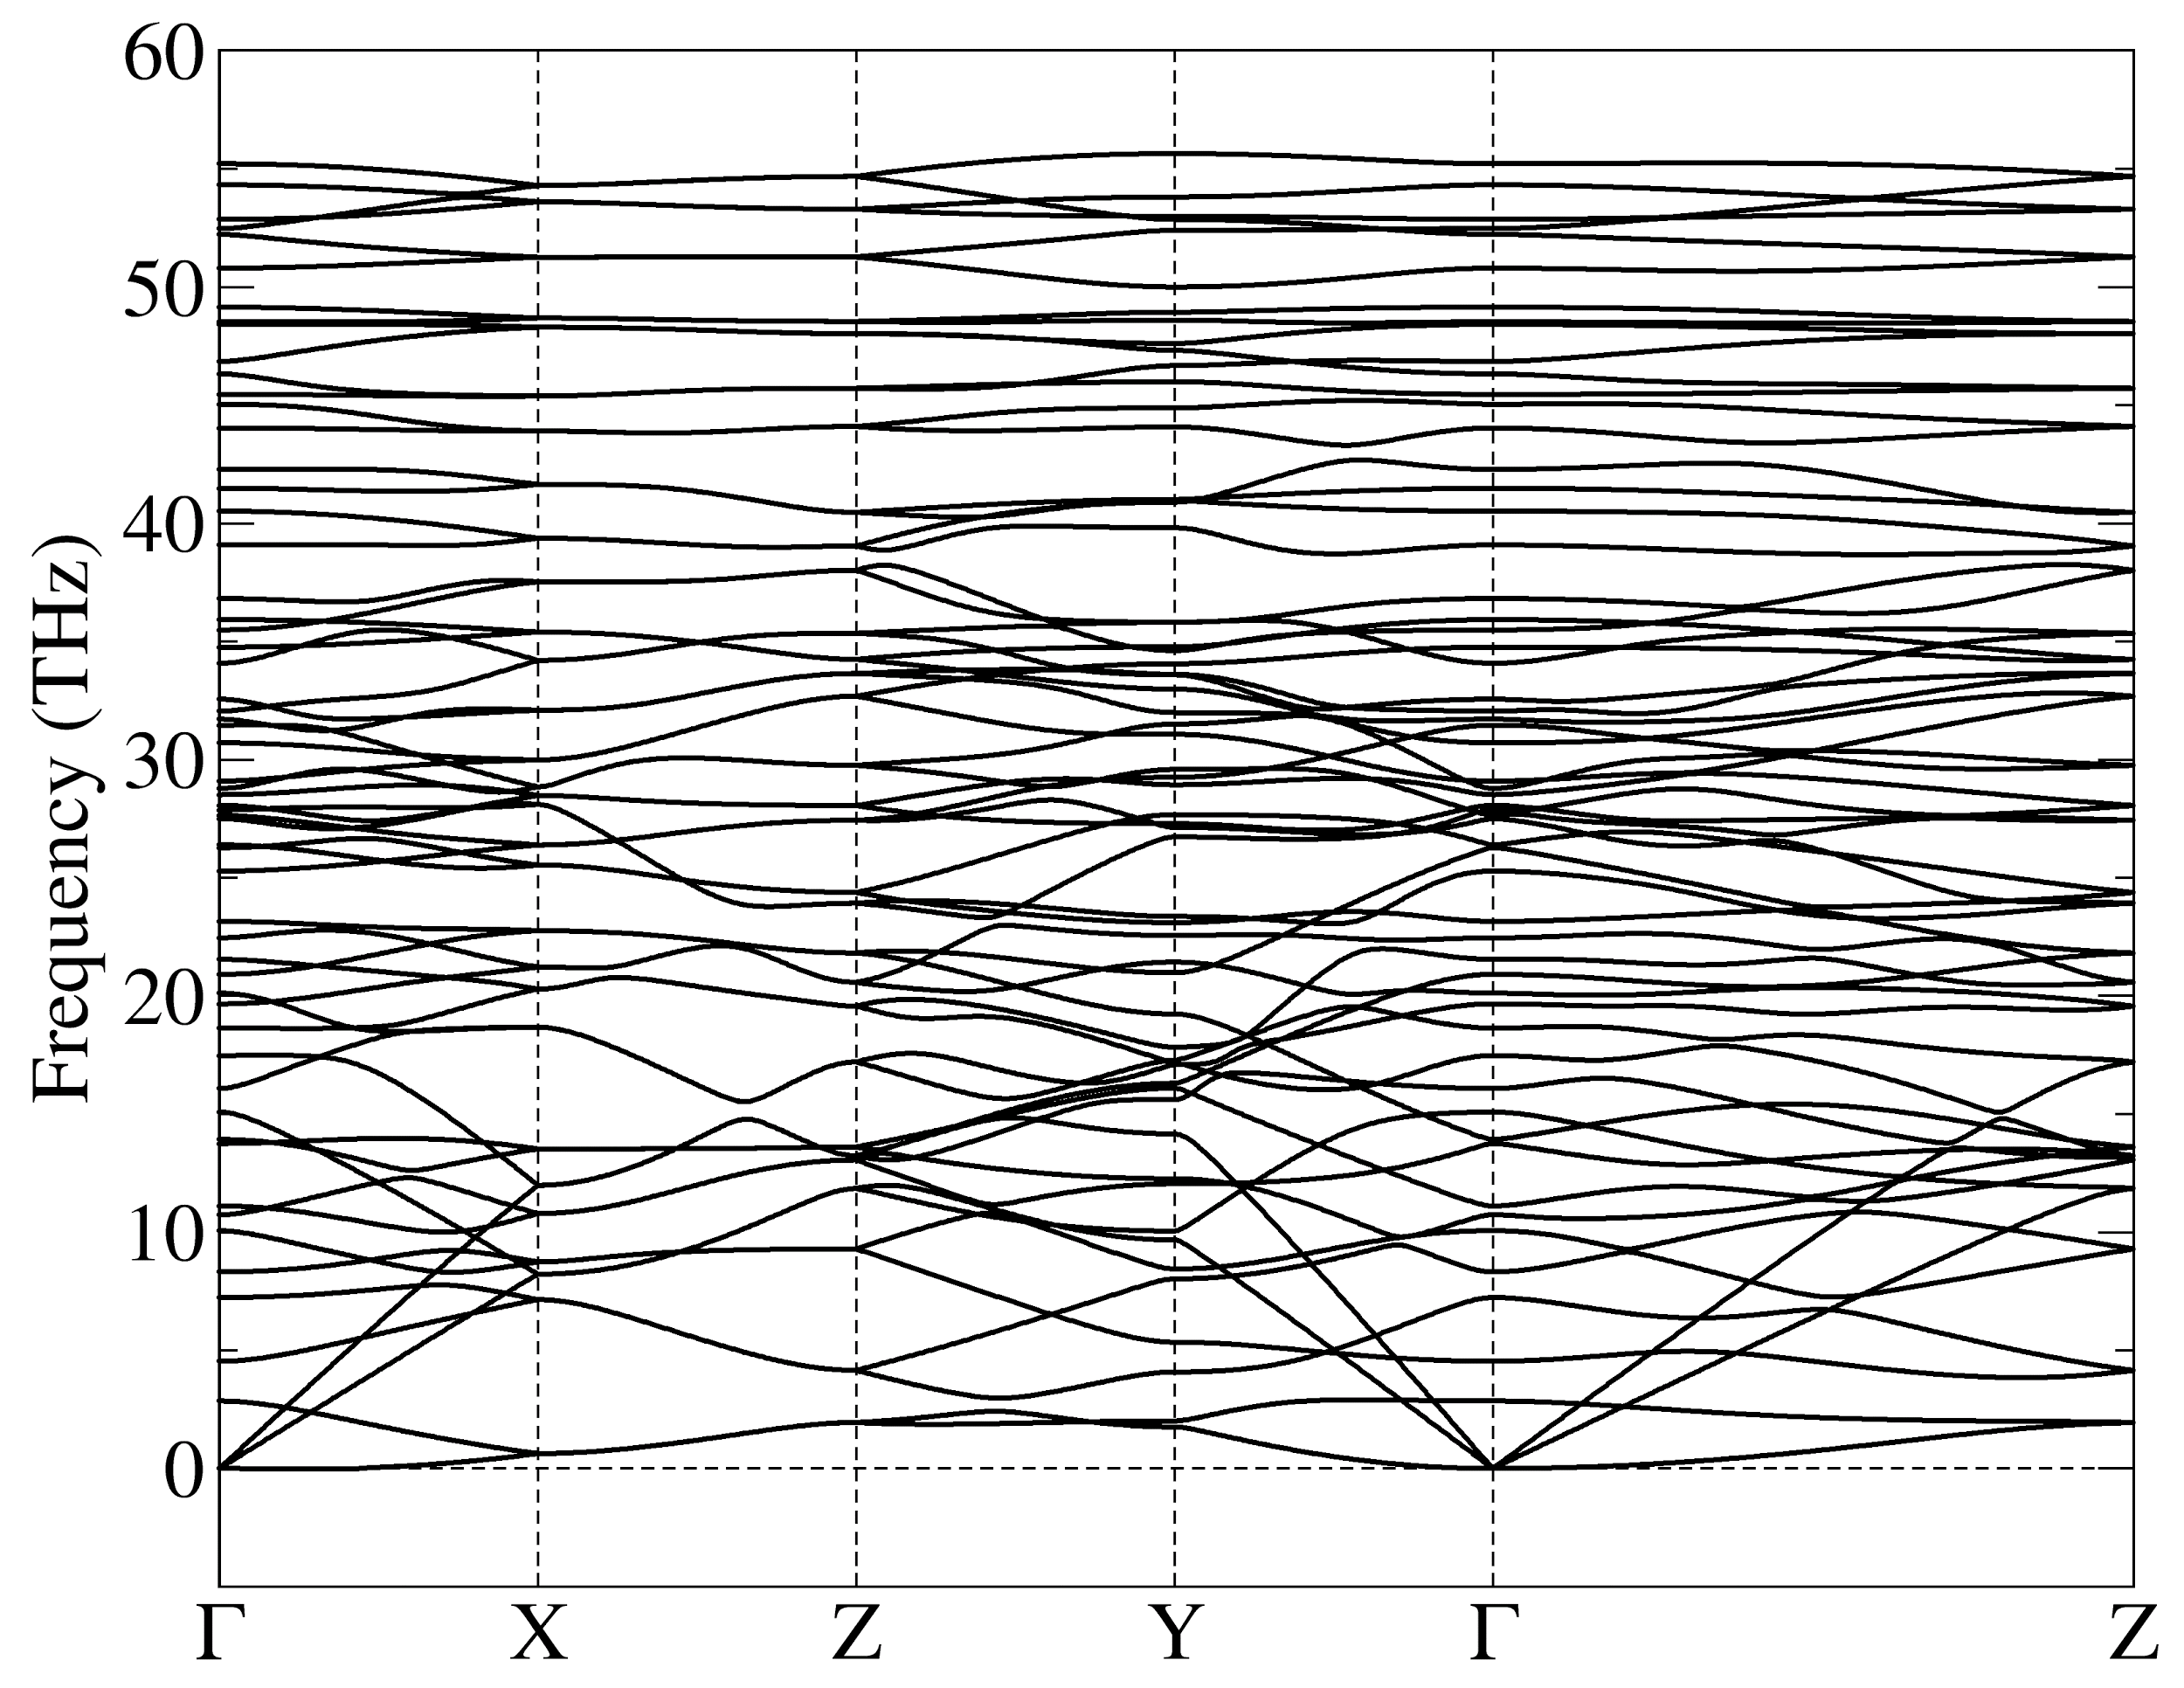
In order to verify the accuracy of the optimized Tersoff potential in describing the atomic bonding structure of phagraphene we calculated its phonon dispersions via the lattice dynamics software GULP 26, 27. Fig. 2 presents the phonon dispersions along high symmetry points of the Brillouin zone, obtained from the 20-atom unit cell shown in Fig. 1. The absence of phonon modes with negative (imaginary) frequencies in the dispersion indicates that the crystal structure of phagraphene is stable when modeled by the chosen potential. In particular, of the three acoustic phonon modes, both in-plane modes present linear dispersions while the flexural mode presents a parabolic dispersion around the point. Furthermore, the presence of high frequency modes ( THz) such as in graphene is related to the high strength of the sp2 chemical bonds between carbon atoms in phagraphene.
Next we performed room temperature molecular dynamics simulations with LAMMPS 28. All simulations employed periodic boundary conditions along both in-plane directions and free boundary conditions in the perpendicular directions, such that our simulations would correspond to suspended phagraphene samples. It is important to notice that the presence of 5- and 7-membered rings in the structure of phagraphene is similar to some topological defects found in graphene and may result in technical difficulties such as instabilities during simulations at finite temperature 19, 21. To avoid this problem, in all molecular dynamics simulations the equations of motion were integrated with a relatively small time increment of fs.
NEMD simulations were performed to investigate the thermal conductivity of phagraphene along both in-plane directions, labeled armchair and zigzag in Fig. 1, independently. For each simulation, the system was divided in slabs along the sample length (the direction of heat transport), and atoms at both ends where fixed. The whole structure, excluding fixed atoms, was then thermalized for ps at room temperature ( K) with a Nosé-Hoover thermostat (NVT) 29, 30. In our simulations, a temperature gradient is imposed in the system via independent thermostats while the heat flux is calculated from the energy exchanged with the thermostats. Therefore, the original thermostat was turned off, and two independent thermostats were coupled to the “hot” slab (first slab, K) and “cold” slab (22nd slab, K), giving rise to a temperature gradient along the system length. All the atoms between the cold and hot regions evolve freely from thermostats, and the temperature of each slab can be calculated from the average kinetic energy of its atoms via the equipartition theorem. The temperature of slab is given by
| (1) |
where is the number of atoms in the slab, is Boltzmann’s constant, is the mass of atom and represents its velocity. Meanwhile, the heat flux is given by the energy added to the hot slab and removed from the cold slab, such that it can be written as
| (2) |
where is the cross sectional area of the phagraphene sample and is the energy exchanged with the thermostats. The cross sectional area is given by the product of the sample width with the thickness of the phagraphene sheet. All simulated samples had a width of approximately nm, while the thickness of phagraphene was taken to be nm, in analogy to the nominal value assumed for graphene. After approximately ps of NEMD, the system achieves a steady-state where the average heat flux and the temperature gradient are stationary. We then simulate the system for an additional time of at least ns and at most ns. Once the average heat flux and temperature gradient are stable, the conductivity () can be calculated directly from Fourier law as
| (3) |
where indicates time averages.
For the evaluation of phagraphene’s mechanical properties we also applied periodic boundary conditions along both in-plane directions, and the structures were equilibrated at K and zero-pressure via a Nosé-Hoover thermostat and barostat. The loading of the structure was performed via deformation of the simulation box, which was increased along the loading direction by a constant engineering strain rate of s-1 at every simulation time step. In order to guarantee uniaxial stress conditions, a barostat was applied to the direction perpendicular to loading and set for zero-stress. Virial stresses were calculated at each strain level to obtain the stress-strain curves presented in the next section, and the elastic modulus was obtained directly from the slope of the stress-strain curves.
3 Results and discussion
3.1 Thermal conductivity
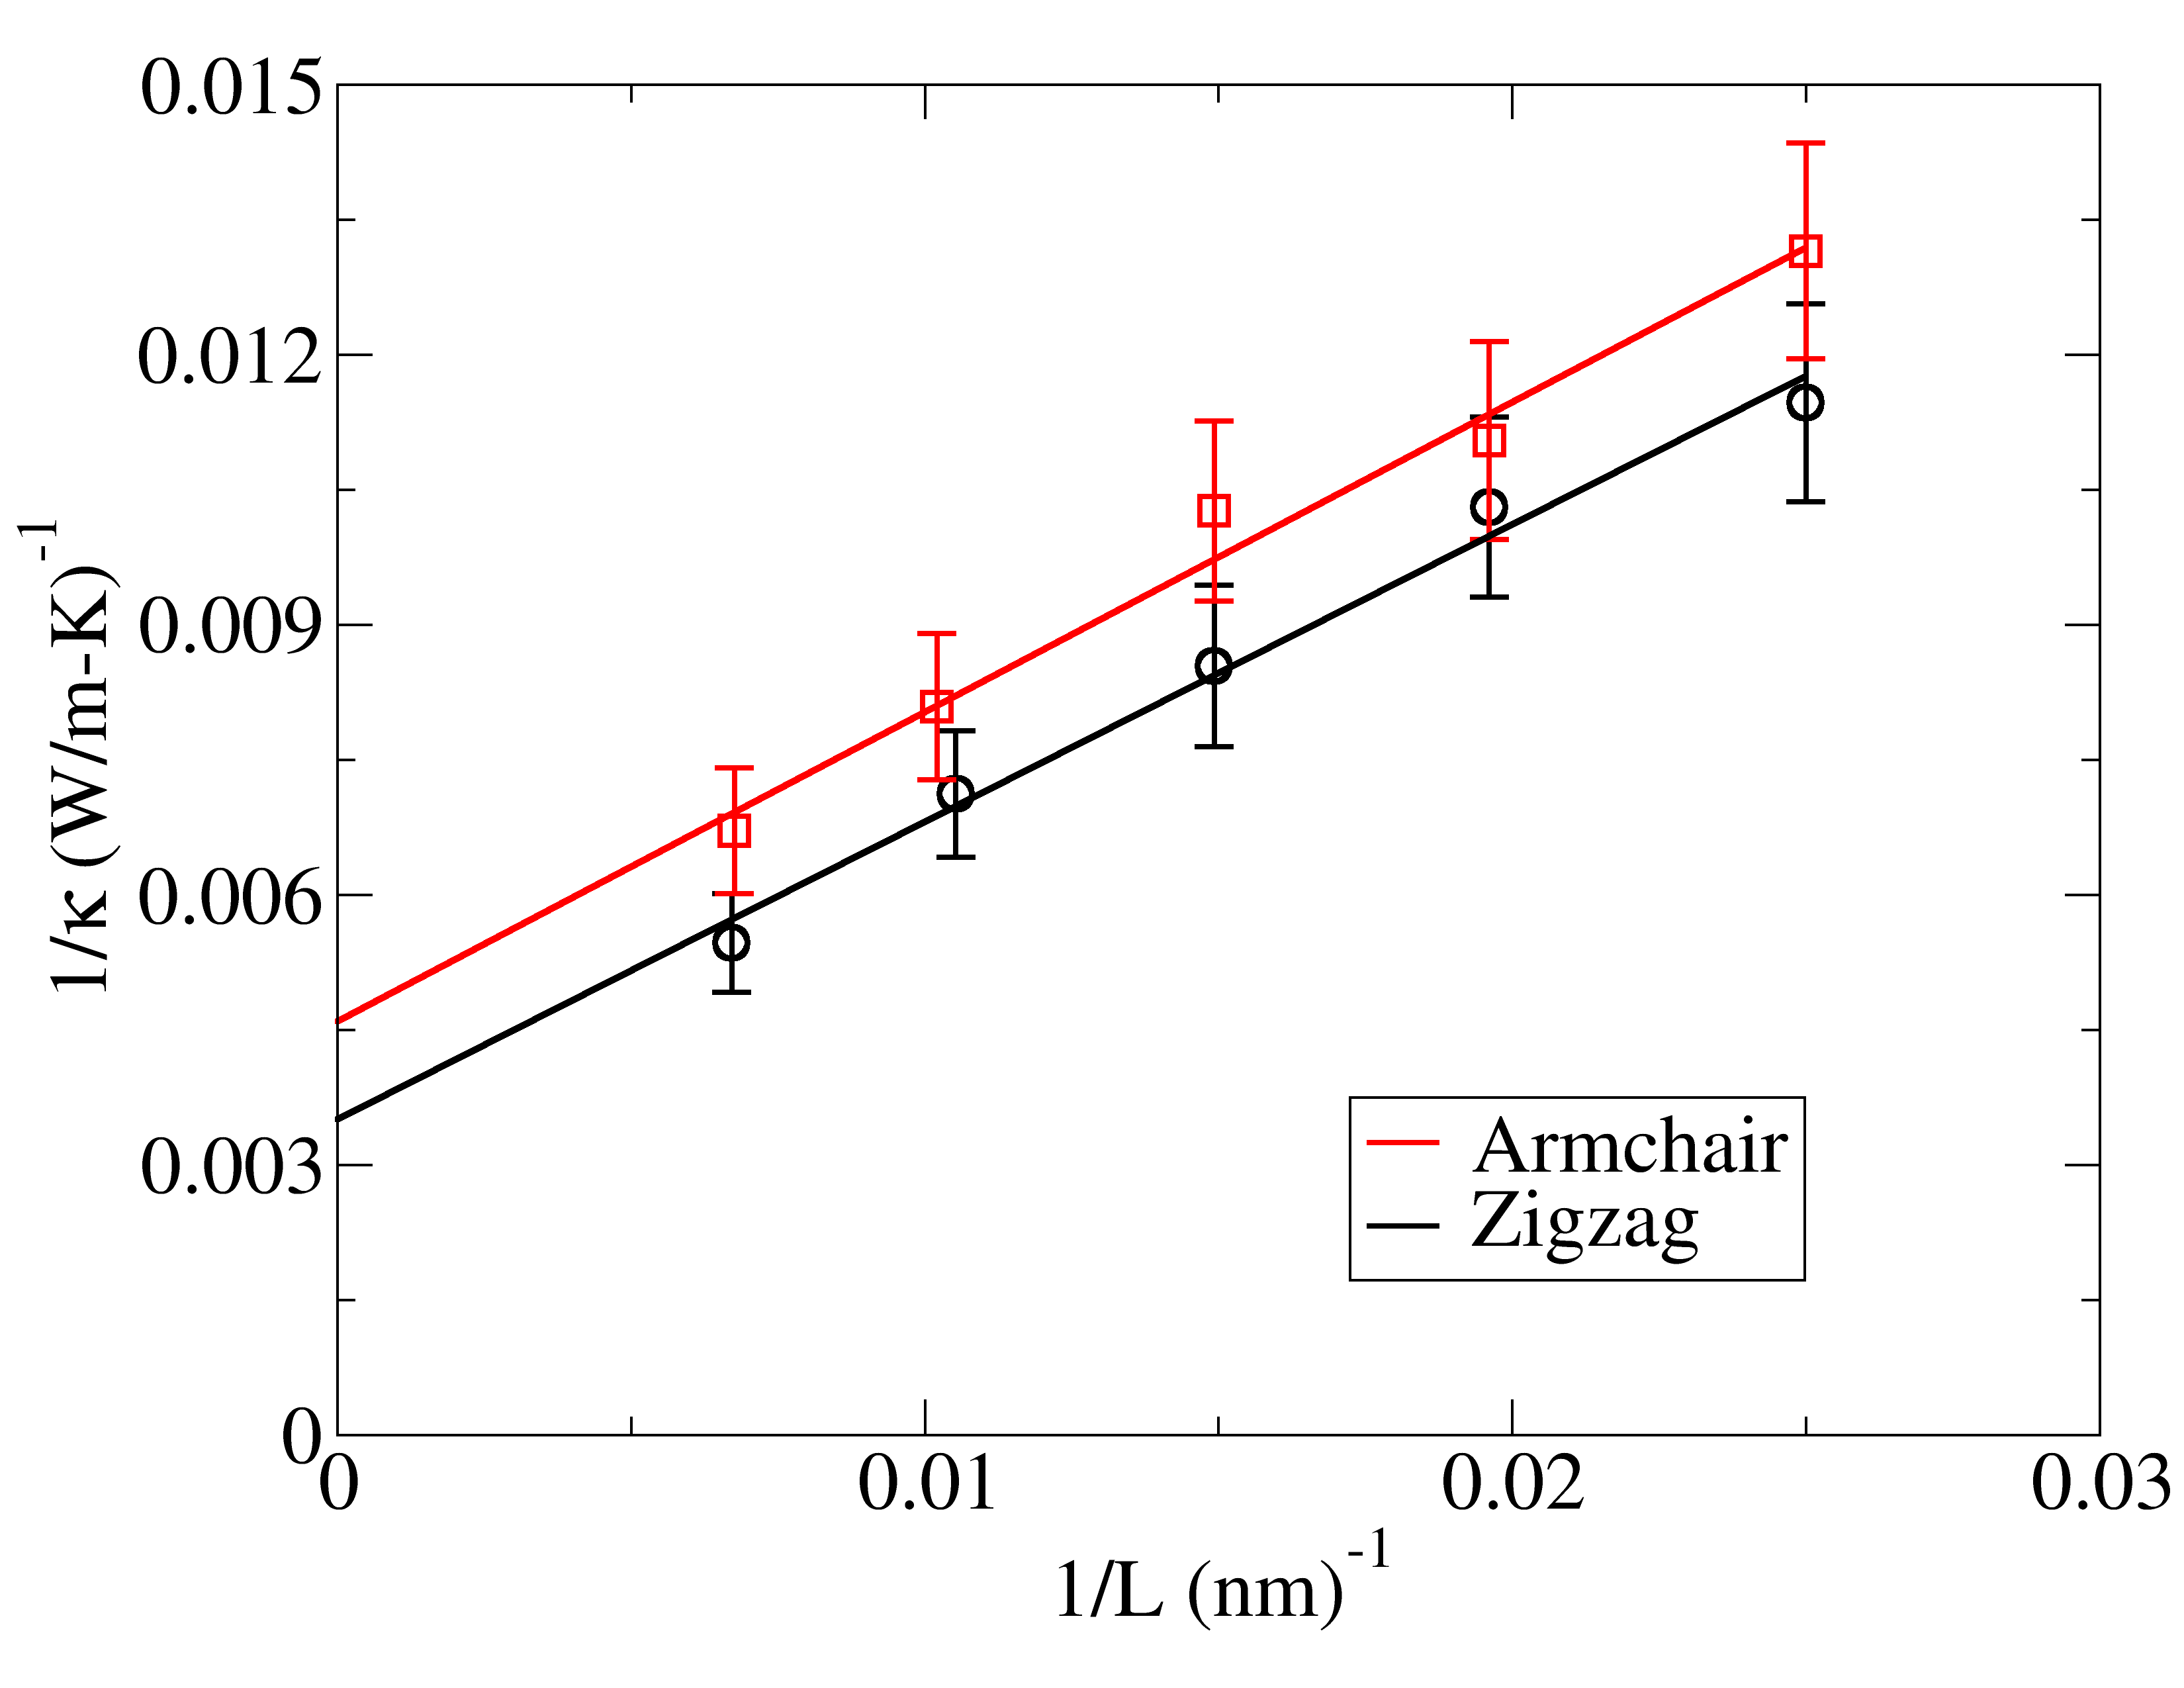
The thermal conductivity is expected to present strong size-effects when the system length is smaller or comparable to the mean free path (MFP) of the heat carriers of the material 31, 32. In the case of graphene, this behavior has been observed in NEMD simulations and even compared to experimental data 12. In order to investigate this behavior in phagraphene, we performed NEMD simulations with cells of increasing length, and calculated their thermal conductivity along armchair and zigzag directions independently. The size-dependence of is shown in Fig. 3, which also predicts that the thermal conductivity along armchair and zigzag directions are not equal. The in-plane thermal conductivity of phragraphene is anisotropic, with a higher conductivity along the zigzag direction indicated in Fig. 1. This anisotropic behavior of is in contrast to what has been observed for similar carbon-based materials such pristine graphene 17, penta-graphene 33, 34, amorphized graphene 23 and nitrogenated holey graphene 25.
In general, the size-dependent thermal conductivity is related to the intrinsic thermal conductivity of the material, via 31, 35
| (4) |
where is an effective phonon MFP and is the system length. Within this description, the effective MFP corresponds to the length at which equals % of . Fitting the above expression to the NEMD data we can determine an intrinsic thermal conductivity of W/m-K and an effective phonon MFP of nm along the armchair direction, and W/m-K and nm along the zigzag direction. In either direction, the thermal conductivity of phagraphene is at least one order of magnitude smaller when compared to W/m-K obtained for pristine graphene with the same empirical potential 20. By fitting Eq. 4 to the graphene data set obtained in the previous study 20, we can estimate its effective MFP to be nm. The difference in and between graphene and phagraphene can be qualitatively understood in terms of the higher phonon scattering due to the presence of pentagons and heptagons in phagraphene. These 5- and 7-membered rings behave as defects in the hexagonal structure of pristine graphene, giving rise to scattering of heat carriers by defects in the case of phagraphene, therefore decreasing its thermal conductivity. A similar decrease in thermal conductivity relative to graphene has also been predicted for penta-graphene via molecular dynamics simulations 33 and lattice dynamics 34. The thermal conductivity of ultra-fine grained graphene was also predicted to be one order of magnitude smaller than pristine single-crystal graphene because of increased phonon scattering along grain boundaries 19.
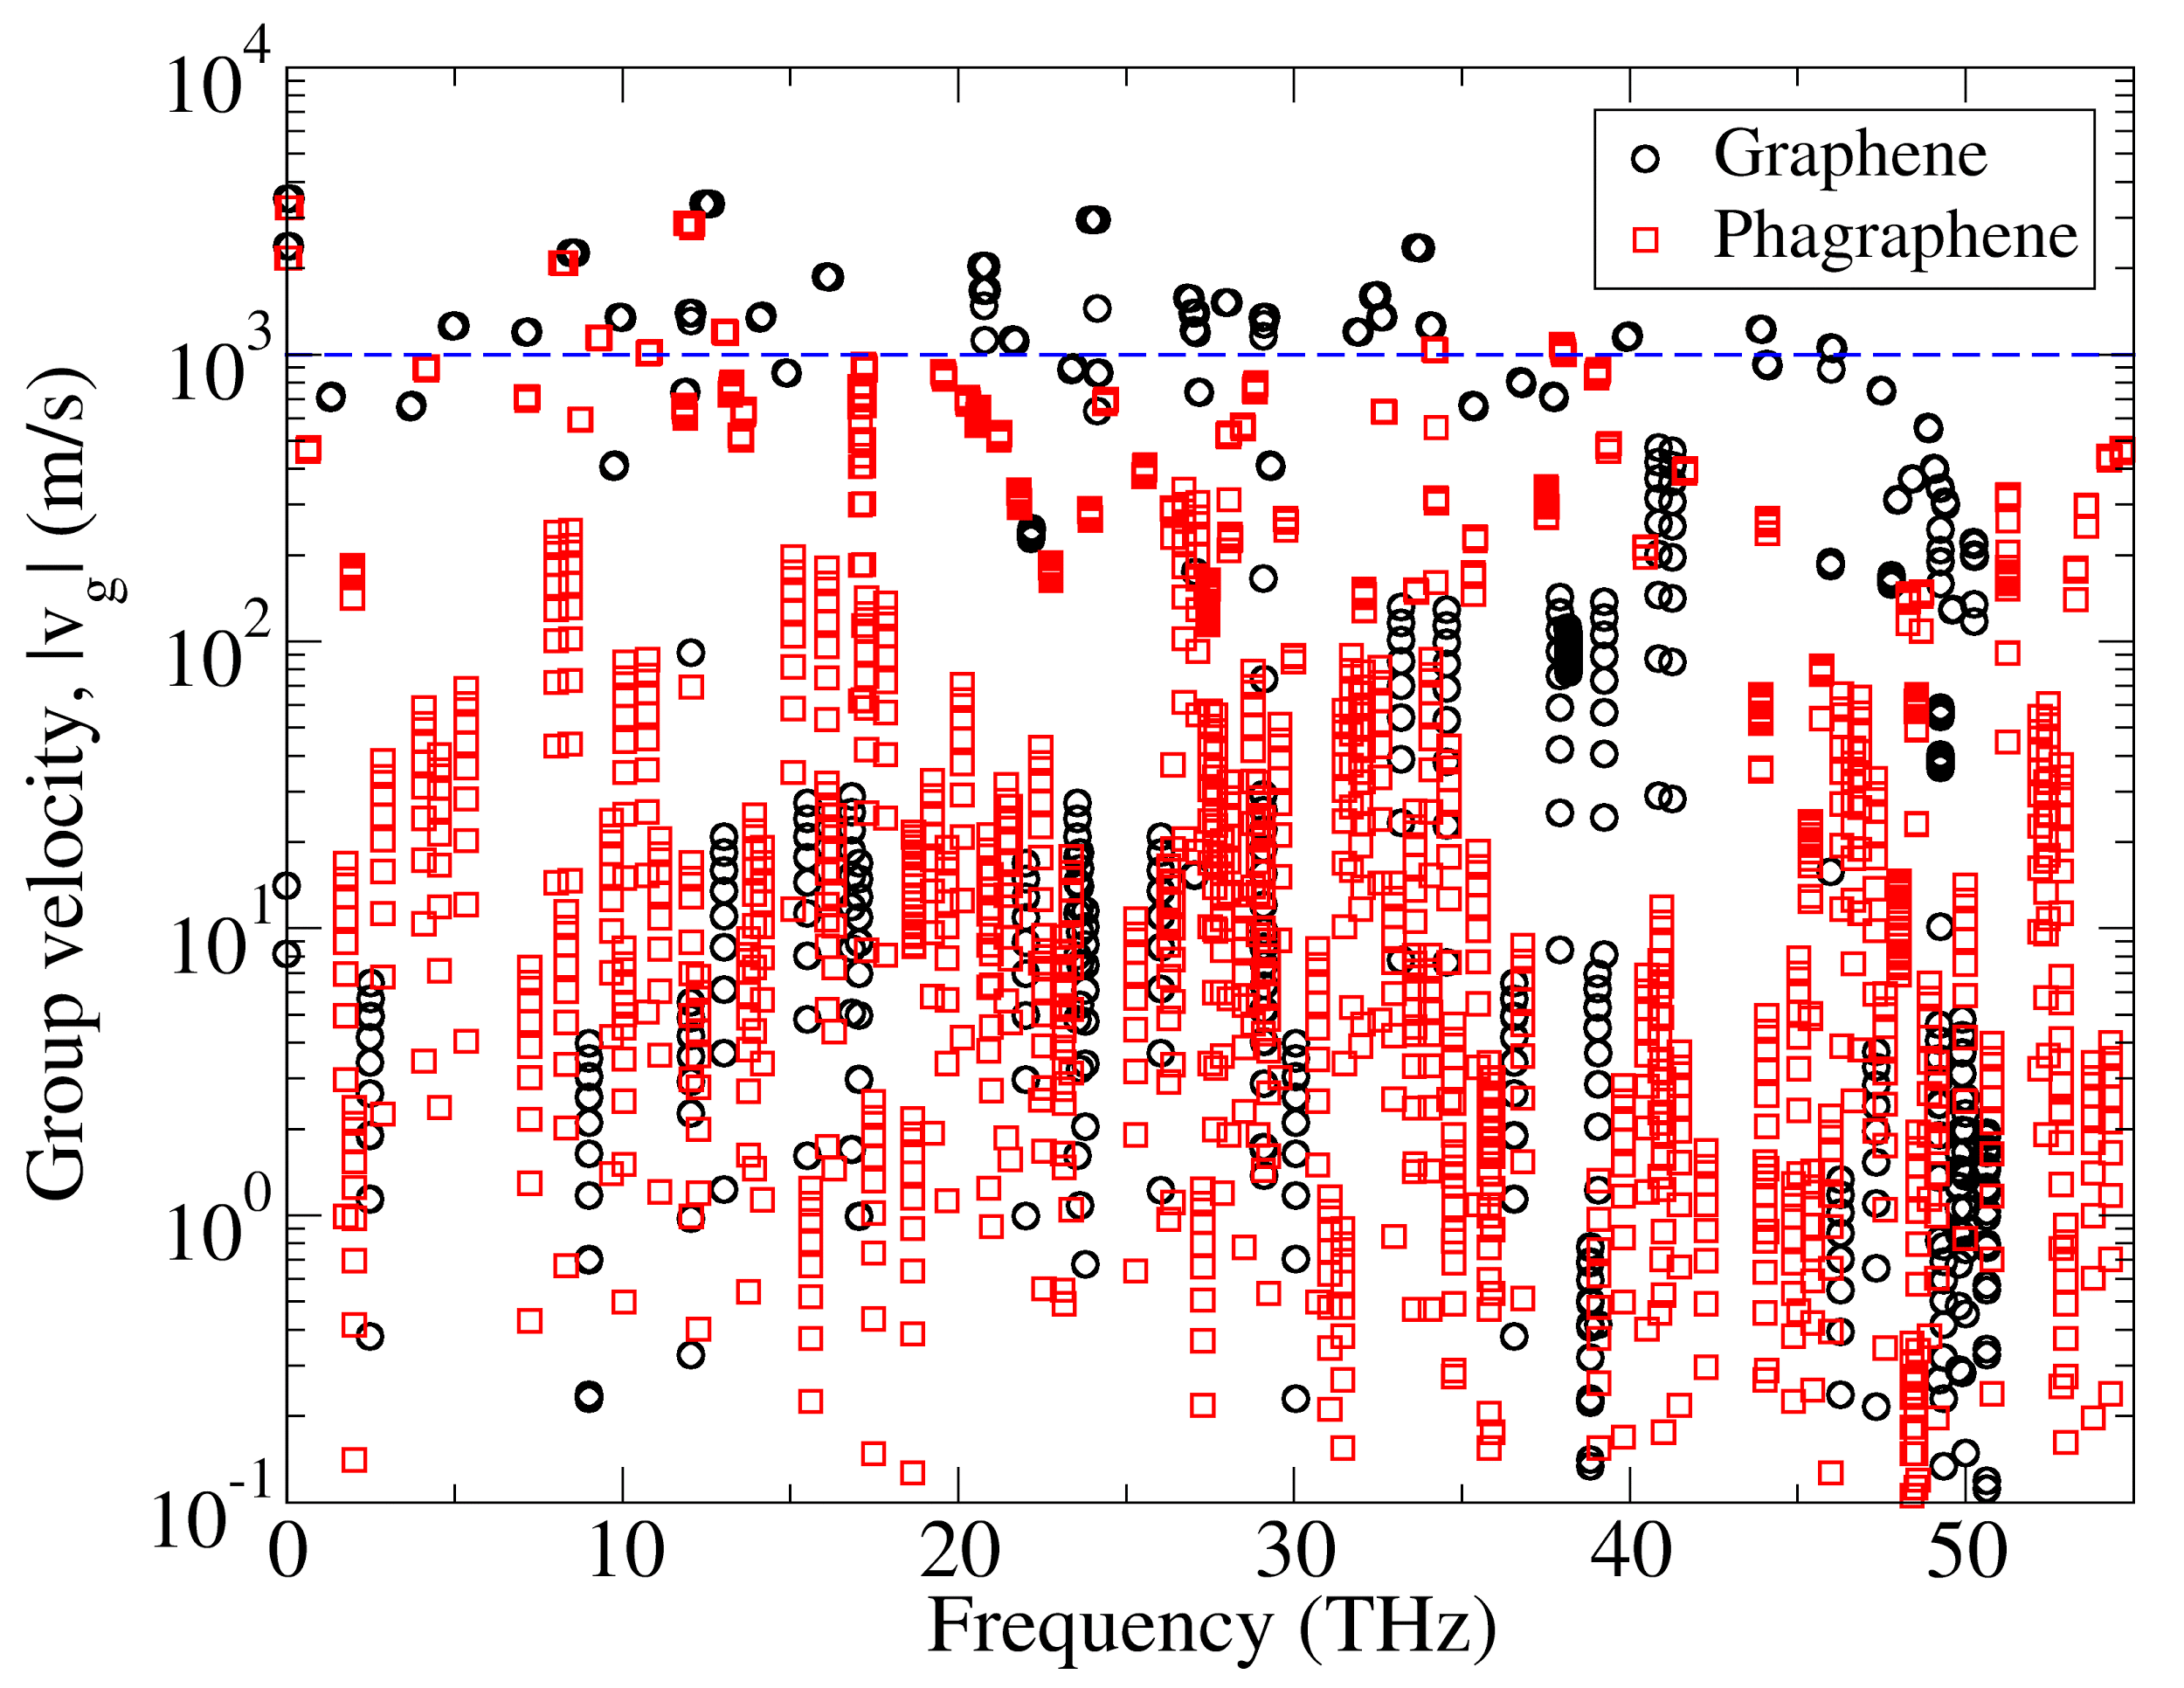
In order to better understand the difference between thermal conductivities of graphene and phagraphene, we have also calculated phonon group velocities from the phonon dispersions of each material. The group velocities are shown in Fig. 4 as a function of phonon frequencies, obtained from unit cells with approximately the same dimensions ( atoms for graphene and atoms for phagraphene). Although the difference in group velocities for the acoustic modes is not so pronounced (notice the modes at THz), for higher frequency modes the group velocities are consistently larger for graphene, as evidenced by the dashed horizontal line. Considering all phonon frequencies in Fig. 4 we can calculate an average group velocity of m/s for graphene, while the equivalent average for phagraphene yields only m/s. This reduction in phonon group velocities is not the only reason for the lower thermal conductivity of phagraphene relative to graphene, but it provides further insight in to the origin of the conductivity reduction. Interestingly, the lower thermal conductivity of phagraphene along with its predicted electronic properties suggests that phagraphene could be a better candidate than graphene in future carbon-based thermoelectric devices 8, 36, 37.
3.2 Mechanical Properties
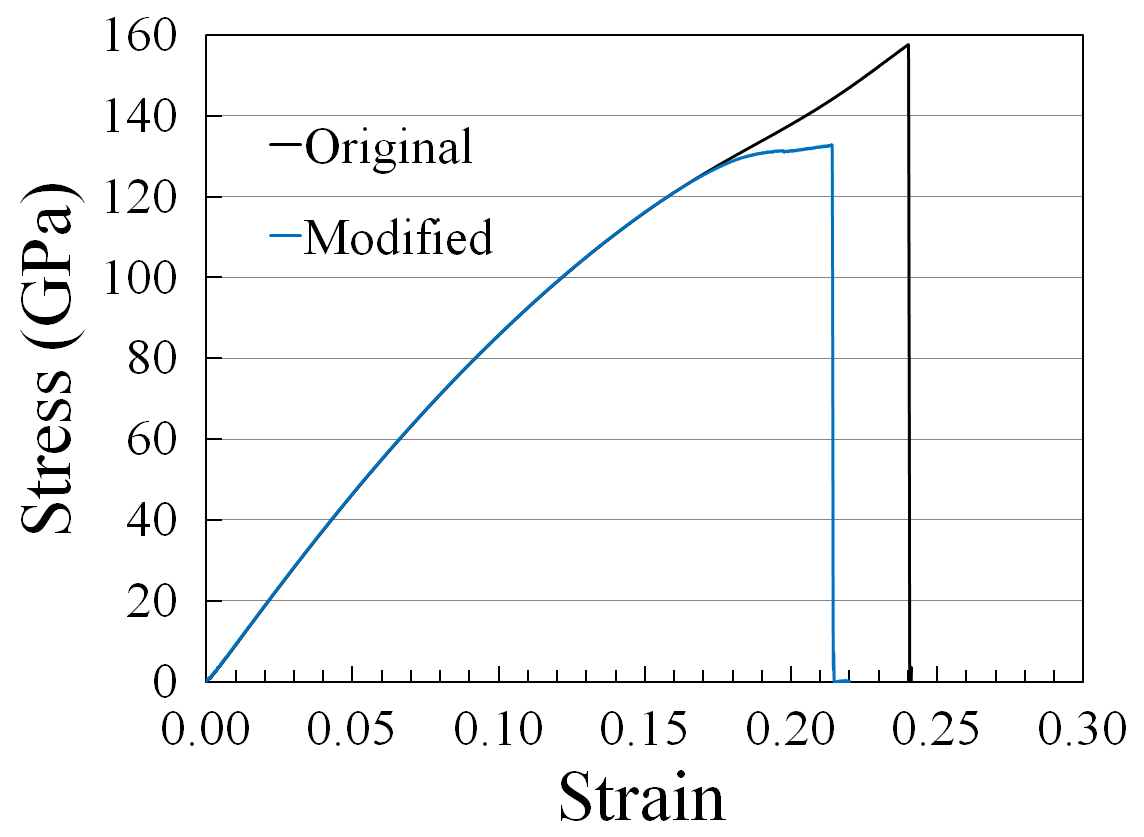
In Fig. 5 we plot the stress-strain response of pristine graphene at room temperature using the parameter set of the optimized Tersoff potential 15, 16. For strain levels higher than an unphysical strain hardening can be observed in stress values. Similar behavior has previously been reported with the AIREBO 38 empirical potential in simulations investigating the tensile deformation of graphene 39, 40. In the case of AIREBO, the unphysical stress hardening can be removed by increasing the potential cutoff from nm to nm 40. In analogy to this situation, we also increased the cutoff of the optimized Tersoff potential from nm to , and the results obtained with this modification are also presented in Fig. 5. In accordance with the results using AIREBO, the stress-strain curves calculated with the optimized Tersoff potential and its cutoff-modified version agree for strain levels up to . However, for strain values larger than , the unphysical behavior is no longer produced by the modified potential. For pristine graphene, the modified potential yields an elastic modulus of GPa and a tensile strength of GPa. These values are in remarkable agreement with experimental results of GPa for elastic modulus and GPa for tensile strength of pristine graphene 14.
The stress-strain response curves of phagraphene along armchair and zigzag directions are presented in Fig. 6, where an anisotropy in the stress-strain curves along zigzag and armchair directions is apparent. Our simulations predict an elastic modulus of GPa along the armchair direction and GPa along the zigzag direction. We also predict a remarkable tensile rigidity of GPa for phagraphene, which is % of the value for pristine graphene and larger than the corresponding values for graphynes 41. Interestingly, our simulations show that the tensile strength of phagraphene is direction independent, as indicated by points a3 and z3 in Fig. 6.
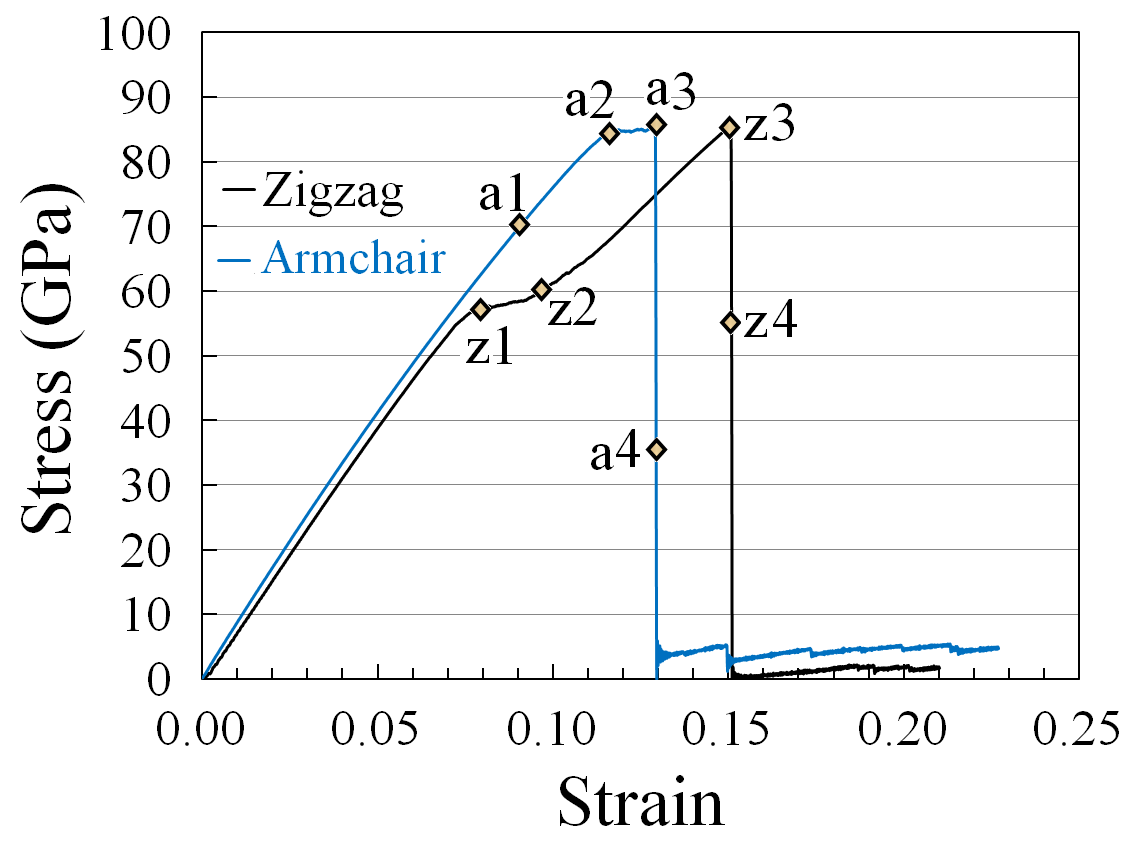
For pristine graphene, the cutoff-modified optimized Tersoff potential predicts that the sample extends uniformly during uniaxial tensile loading and that it remains free of defects up to its tensile strength. At that point, the first debonding occurs between two adjacent carbon atoms. This results in the formation of a crack that rapidly grows and eventually leads to sample rupture. Therefore, for pristine graphene the initial void formation and subsequent failure occur at almost the same strain level, which suggests a brittle failure mechanism.
In Fig. 7, the deformation and breakage process of phagraphene sheets along zigzag and armchair directions is depicted. For phagraphene under tensile loading along the zigzag direction, we observe the initial bond ruptures at strain levels of (Fig. 7z1). These debonding events do not happen in pentagon-heptagon pairs but occur in bonds that connect two hexagons consequently forming ten-membered rings from two carbon hexagons (Fig. 7z1). We observe that at the initial stages of loading, when the sample is stretched along the zigzag direction there are contraction and tension stresses in the sample. In this case we found that the stress around pentagon and bonds connecting two hexagons are contraction and tension stress, respectively. These diverse stress conditions result in a non-uniform stress distribution and cause stress concentration in specific parts of the samples. Consequently the high tensile stress around bonds connecting two hexagons leads to local bond ruptures (Fig. 7z1 and Fig. 7z2) forming a more uniform stress distribution. These void initiations can be identified in stress-strain curves at the point in which the slope of the stress-strain curve decreases (point z1 in Fig. 6). Increasing the strain level along the zigzag direction, leads to more bond breakage and ten-membered rings extend through the entire sample (Fig. 7z2). After this point, the defect concentration along the sample remain almost unchanged and formation of new ten-membered rings slows down. In this case, the density of defects is approximately uniform throughout the structure and the sample starts to extend uniformly. This process is distinguishable from the stress-strain response through an increase in the slope of stress-strain curve (Fig. 7z2 and z2 point in Fig. 6). The ultimate tensile strength happens at the point when the defect coalescence happens (Fig. 7z3) forming a crack that grows and leads to the sample rupture (Fig. 7z4). Meanwhile, our simulations reveal that when phagraphene is under tensile loading along the armchair direction, it remains defect-free up to high stages of the loading (Fig. 7a1). In this case, bonds connecting two hexagons are almost perpendicular to the loading direction and by increasing the strain level their bond length does not change considerably so the stress distribution is much more uniform in this case in comparison to the zigzag direction. A more uniform stress distribution therefore postpone the first bond breakage in the structure. Nevertheless, at strain levels higher than , ten-membered rings start to form along the sample, which gradually extend throughout the structure (Fig. 7a2). Similarly to our results along the zigzag direction, the coalescence of ten-membered rings results in the formation of a crack and subsequent rupture of the sample (Fig. 7a4).
Unlike pristine graphene, in phagraphene the initial debonding and subsequent rupture happen at distinctly different strain levels, which suggests a ductile failure mechanics for phagraphene. It is worth noticing that, based on our simulations, phagraphene presents a higher ductile failure mechanism along the zigzag direction when compared to its armchair direction. In this case we found that during the tensile deformation and up to sample rupture, phagraphene stretched along the zigzag direction can absorb around % more energy than when stretched along the armchair direction. In addition, along the zigzag direction phagraphene’s failure strain is found to be while this is around for the armchair direction.
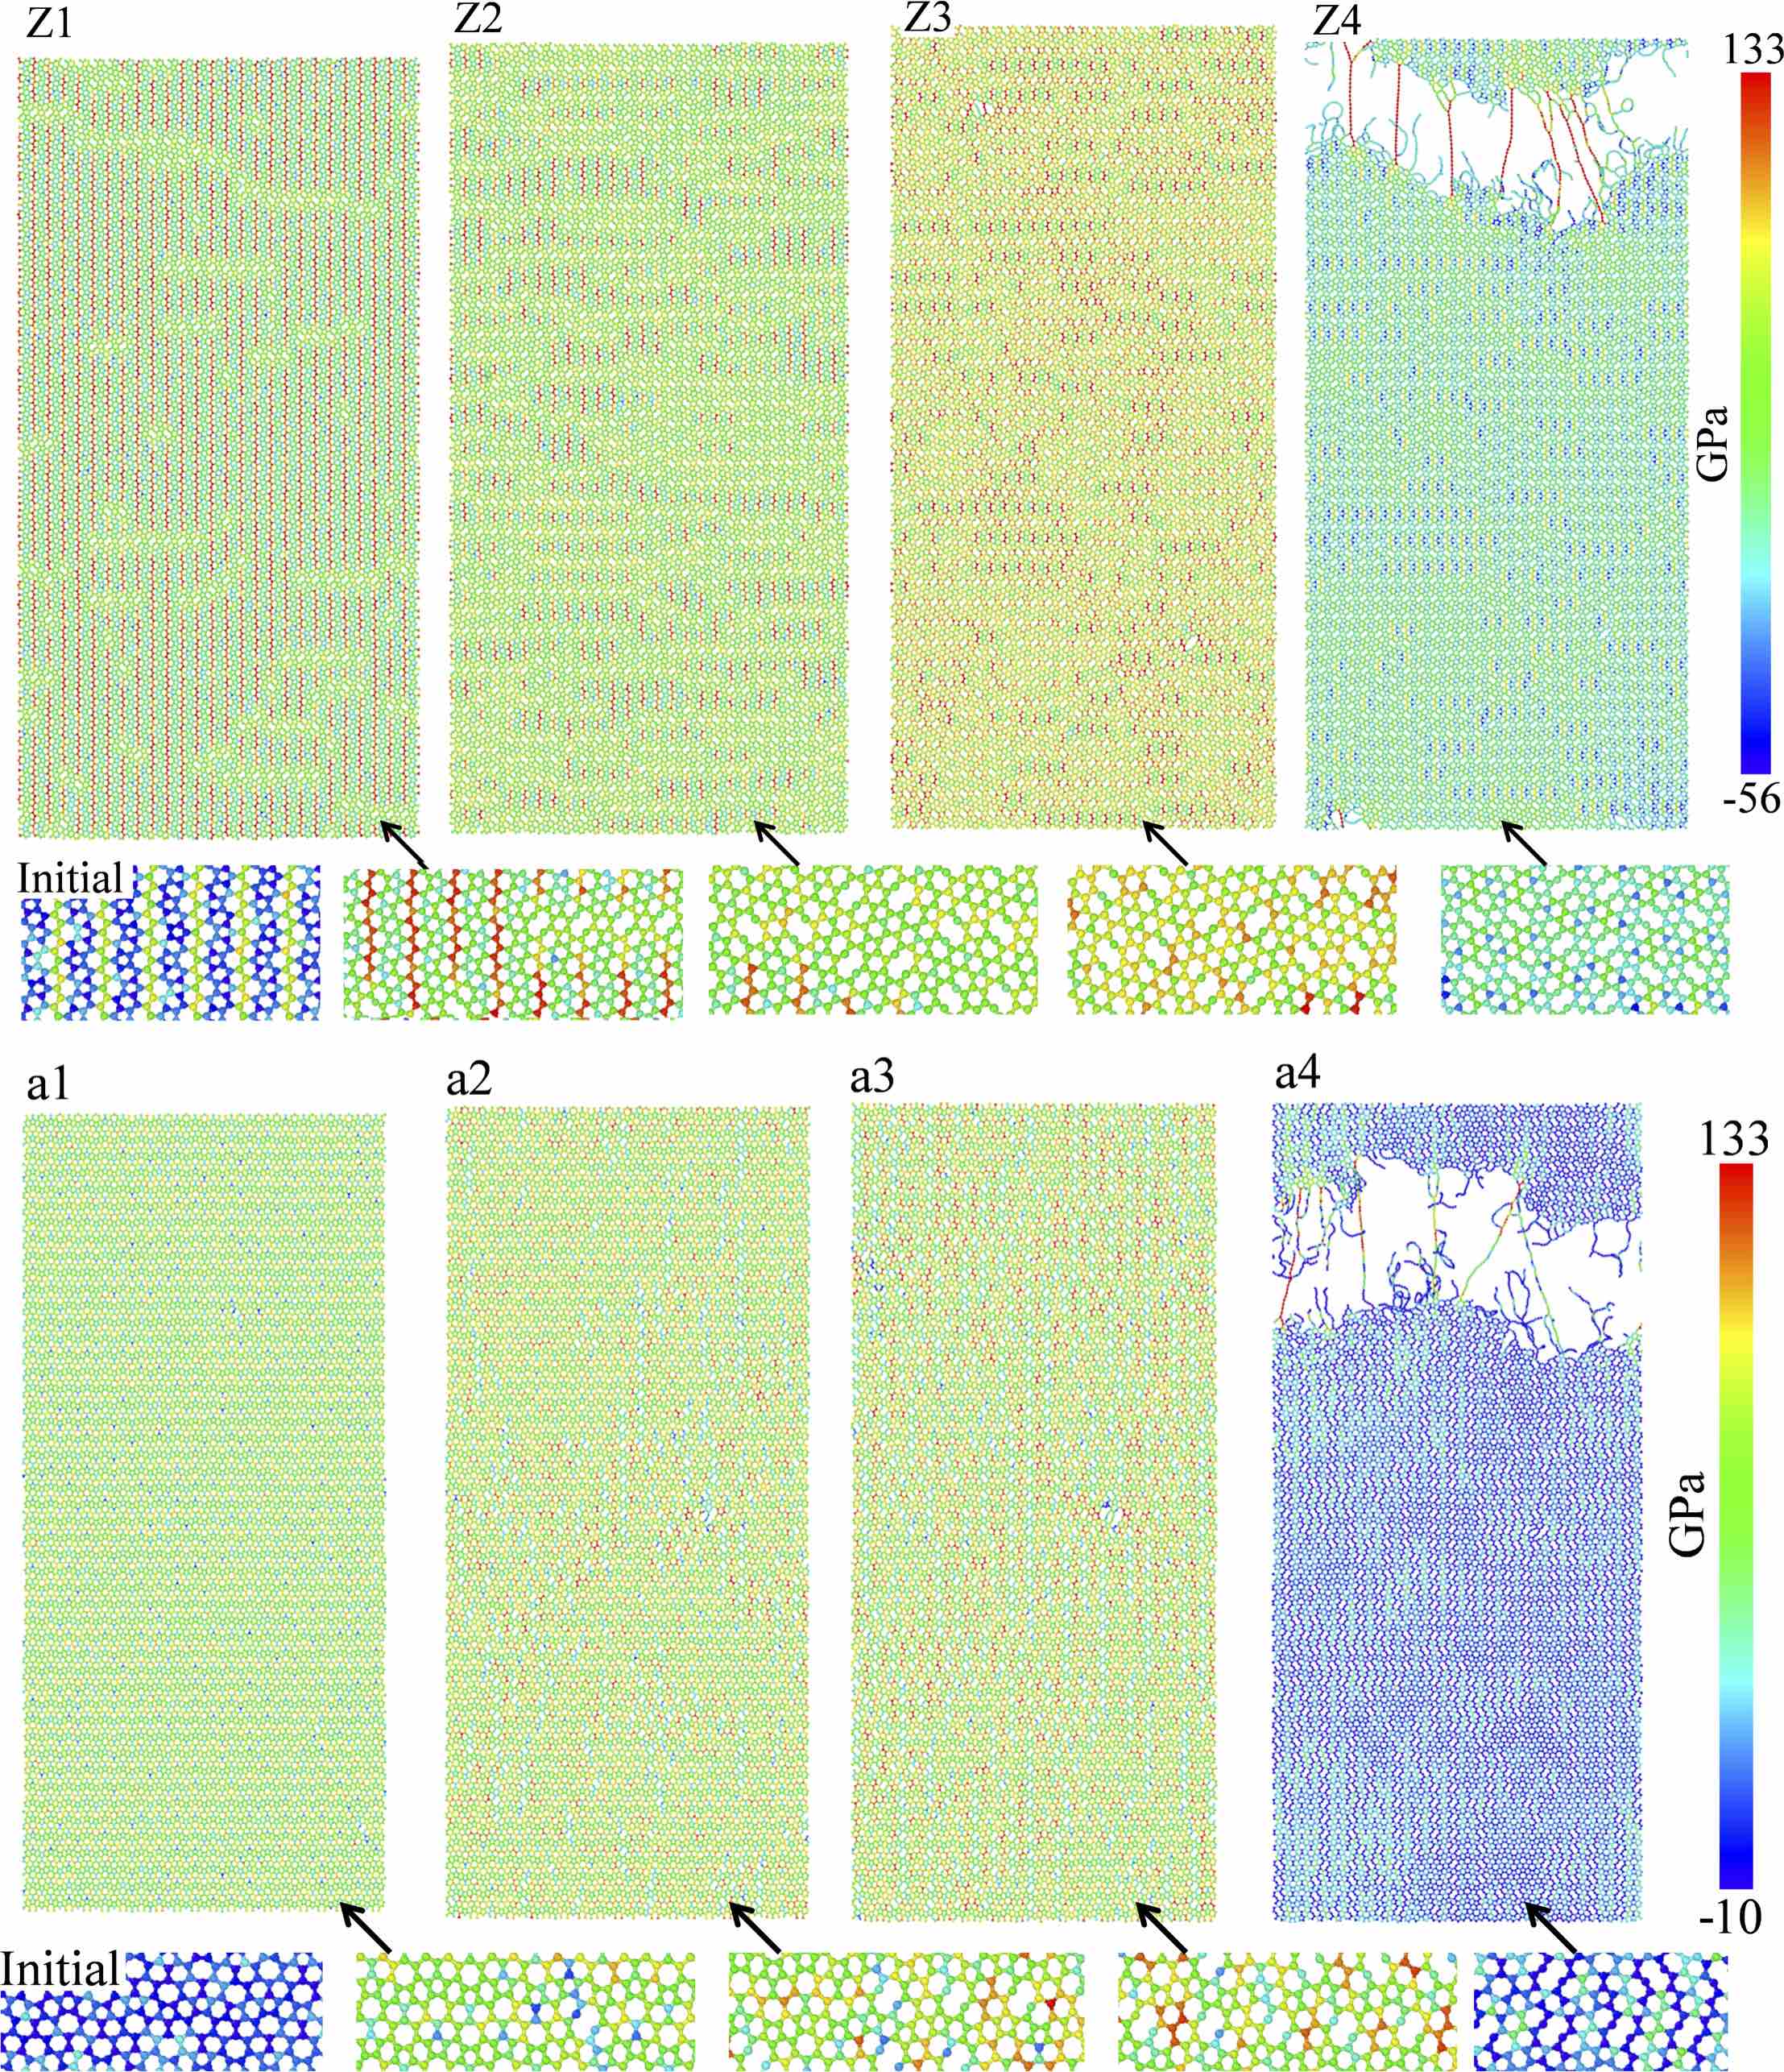
Table 1 summarizes the predicted thermal transport and mechanical properties of phagraphene, along with the values obtained for pristine graphene with the same empirical potential. While graphene presents anisotropic (in-plane) thermal transport and mechanical properties, phagraphene presents a clear anisotropy for the same properties. Interestingly, while the thermal conductivity and the effective phonon MFP are predicted to be larger along the zigzag direction, the elastic modulus is predicted to be higher along the armchair direction. Nonetheless, while along the zigzag direction is % larger than along the armchair direction, the elastic modulus along the armchair direction is less than % larger than along the zigzag direction. Furthermore, while we are very confident in our predicted anisotropic thermal conductivity, it is possible that the anisotropy observed in tensile strength is an artefact of our simulations, particularly due to the chosen empirical potential which was not explicitly fitted to structures such as phagraphene.
| Graphene | Phagraphene | ||
|---|---|---|---|
| Armchair | Zigzag | ||
| (W/m-K) | |||
| (nm) | |||
| Elast. Mod. (GPa) | |||
| Tens. Strength (GPa) |
4 Summary
Thermal conductivity and mechanical response of phagraphene at room temperature were investigated via classical molecular dynamics simulations, along armchair and zigzag directions. NEMD simulations were performed to predict the thermal conductivity of phagraphene, which was found to be anisotropic for in-plane directions. We predict a room temperature thermal conductivity of W/m-K along the armchair direction and W/m-K along the zigzag direction, with effective MFP of nm and nm, respectively. The predicted in-plane thermal conductivities of phagraphene are one order of magnitude smaller than that of the pristine graphene, while effective phonon MFP are smaller by a factor of . Analysis of phonon group velocities also shows a significant reduction in this quantity for phagraphene in comparison to graphene. We have also investigated the mechanical properties of phagraphene via uniaxial tensile tests. It was found that the cutoff modified optimized Tersoff potential predicts accurate mechanical properties for pristine graphene, in agreement with experiments. The elastic modulus of phagraphene along the armchair and zigzag directions are calculated to be GPa and GPa, respectively. In addition, the tensile strength of phagraphene is predicted to be around GPa, independent of loading direction. Furthermore, the failure process of phagraphene was shown to be more ductile in comparison to pristine graphene. Our modeling results show that while the mechanical properties of phagraphene are comparable to graphene, its thermal conductivity is significantly smaller. Finally, our simulations show that the thermal conductivity and the elastic modulus of phagraphene are direction dependent, presenting an in-plane anisotropy not observed in the case of other two-dimensional carbon-based materials. The lower thermal conductivity coupled with its predicted electronic properties makes phagraphene a more promising candidate for carbon-based thermoelectric devices than graphene.
Acknowledgments
The authors thank Raphael Matozo Tromer for a critical reading of the manuscript. LFCP acknowledges financial support from Brazilian government agency CAPES for project “Physical properties of nanostructured materials” (grant number 3195/2014) via its Science Without Borders program. BM and TR greatly acknowledge the financial support by European Research Council for COMBAT project (grant number 615132).
References
- Novoselov et al. 2004 K. S. Novoselov, A. K. Geim, S. V. Morozov, D. Jiang, Y. Zhang, S. V. Dubonos, I. V. Grigorieva and A. A. Firsov, Science (80-. )., 2004, 306, 666.
- Novoselov et al. 2005 K. S. Novoselov, D. Jiang, F. Schedin, T. J. Booth, V. V. Khotkevich, S. V. Morozov and A. K. Geim, Proc. Natl. Acad. Sci., 2005, 102, 10451–10453.
- Geim and Novoselov 2007 A. K. Geim and K. S. Novoselov, Nat. Mater., 2007, 6, 183.
- Li et al. 2014 Y. Li, L. Xu, H. Liu and Y. Li, Chem. Soc. Rev., 2014, 43, 2572.
- Mahmood et al. 2015 J. Mahmood, E. K. Lee, M. Jung, D. Shin, I.-y. Jeon, S.-m. Jung, H.-j. Choi, J.-m. Seo, S.-y. Bae, S.-d. Sohn, N. Park, J. H. Oh, H.-j. Shin and J.-b. Baek, Nat. Commun., 2015, 6, 6486.
- Kotakoski et al. 2015 J. Kotakoski, C. Brand, Y. Lilach, O. Cheshnovsky, C. Mangler, M. Arndt and J. C. Meyer, Nano Lett., 2015, 15, 5944–5949.
- Zhang et al. 2015 S. Zhang, J. Zhou, Q. Wang, X. Chen, Y. Kawazoe and P. Jena, Proc. Natl. Acad. Sci., 2015, 112, 2372–2377.
- Wang et al. 2015 Z. Wang, X.-F. Zhou, X. Zhang, Q. Zhu, H. Dong, M. Zhao and A. R. Oganov, Nano Lett., 2015, 15, 6182–6186.
- Castro Neto et al. 2009 A. H. Castro Neto, F. Guinea, N. M. R. Peres, K. S. Novoselov and A. K. Geim, Rev. Mod. Phys., 2009, 81, 109–162.
- Yazyev and Louie 2010 O. Yazyev and S. G. Louie, Nat. Mater., 2010, 9, 806–809.
- Balandin et al. 2008 A. A. Balandin, S. Ghosh, W. Bao, I. Calizo, D. Teweldebrhan, F. Miao and C. N. Lau, Nano Lett., 2008, 8, 902.
- Xu et al. 2014 X. Xu, L. F. C. Pereira, Y. Wang, J. Wu, K. Zhang, X. Zhao, S. Bae, C. Tinh Bui, R. Xie, J. T. L. Thong, B. H. Hong, K. P. Loh, D. Donadio, B. Li and B. Özyilmaz, Nat. Commun., 2014, 5, 3689.
- Fugallo et al. 2014 G. Fugallo, A. Cepellotti, L. Paulatto, M. Lazzeri, N. Marzari and F. Mauri, Nano Lett., 2014, 14, 6109–6114.
- Lee et al. 2008 C. Lee, X. Wei, J. W. Kysar and J. Hone, Science (80-. )., 2008, 321, 385–388.
- Lindsay and Broido 2010 L. Lindsay and D. A. Broido, Phys. Rev. B, 2010, 81, 205441.
- Lindsay and Broido 2010 L. Lindsay and D. A. Broido, Phys. Rev. B, 2010, 82, 209903.
- Pereira and Donadio 2013 L. F. C. Pereira and D. Donadio, Phys. Rev. B, 2013, 87, 125424.
- Pereira et al. 2013 L. F. C. Pereira, I. Savić and D. Donadio, New J. Phys., 2013, 15, 105019.
- Mortazavi et al. 2014 B. Mortazavi, M. Pötschke and G. Cuniberti, Nanoscale, 2014, 6, 3344–52.
- Mortazavi and Rabczuk 2015 B. Mortazavi and T. Rabczuk, Carbon N. Y., 2015, 85, 1–7.
- Mortazavi et al. 2015 B. Mortazavi, L. F. C. Pereira, J.-W. Jiang and T. Rabczuk, Sci. Rep., 2015, 5, 13228.
- Fan et al. 2015 Z. Fan, L. F. C. Pereira, H.-Q. Wang, J.-C. Zheng, D. Donadio and A. Harju, Phys. Rev. B, 2015, 92, 094301.
- Mortazavi et al. 2016 B. Mortazavi, Z. Fan, L. F. C. Pereira, A. Harju and T. Rabczuk, Carbon N. Y., 2016, 103, 318–326.
- Mortazavi and Cuniberti 2014 B. Mortazavi and G. Cuniberti, R. Soc. Chem. Adv., 2014, 4, 19137.
- Mortazavi et al. 2016 B. Mortazavi, O. Rahaman, T. Rabczuk and L. F. C. Pereira, Carbon N. Y., 2016, 106, 1–8.
- Gale 1997 J. D. Gale, J. Chem. Soc. Faraday Trans., 1997, 93, 629–637.
- Gale and Rohl 2003 J. D. Gale and A. L. Rohl, Mol. Simul., 2003, 29, 291–341.
- Plimpton 1995 S. J. Plimpton, J. Comput. Phys., 1995, 117, 1–19.
- Nosé 1984 S. Nosé, J. Chem. Phys., 1984, 81, 511–519.
- Hoover 1985 W. G. Hoover, Phys. Rev. A, 1985, 31, 1695–1697.
- Schelling et al. 2002 P. K. Schelling, S. R. Phillpot and P. Keblinski, Phys. Rev. B, 2002, 65, 144306.
- Sellan et al. 2010 D. P. Sellan, E. S. Landry, J. E. Turney, A. J. H. McGaughey and C. H. Amon, Phys. Rev. B, 2010, 81, 214305.
- Xu et al. 2015 W. Xu, G. Zhang and B. Li, J. Chem. Phys., 2015, 143, 154703.
- Wang et al. 2016 F. Q. Wang, J. Yu, Q. Wang, Y. Kawazoe and P. Jena, Carbon N. Y., 2016, 105, 424–429.
- Zhang et al. 2014 X. Zhang, H. Xie, M. Hu, H. Bao, S. Yue, G. Qin and G. Su, Phys. Rev. B, 2014, 89, 054310.
- Chang and Nikolic 2012 P.-H. Chang and B. K. Nikolic, Phys. Rev. B, 2012, 86, 1–5.
- Sevinçli et al. 2013 H. Sevinçli, C. Sevik, T. Cain and G. Cuniberti, Sci. Rep., 2013, 3, 1228.
- Stuart et al. 2000 S. J. Stuart, A. B. Tutein and J. A. Harrison, J. Chem. Phys., 2000, 112, 6472.
- Pei et al. 2010 Q. Pei, Y. Zhang and V. Shenoy, Carbon N. Y., 2010, 48, 898–904.
- Chen et al. 2015 M. Chen, S. Quek, Z. Sha, C. Chiu, Q. Pei and Y. Zhang, Carbon N. Y., 2015, 85, 135–146.
- Zhang et al. 2012 Y. Y. Zhang, Q. X. Pei and C. M. Wang, Appl. Phys. Lett., 2012, 101, 081909.
- Stukowski 2010 A. Stukowski, Model. Simul. Mater. Sci. Eng., 2010, 18, 015012.