One-Armed Spiral Instability in Double-Degenerate Post-Merger Accretion Disks
Abstract
Increasing observational and theoretical evidence points to binary white dwarf mergers as the origin of some if not most normal Type Ia supernovae (SNe Ia). In this paper, we discuss the post-merger evolution of binary white dwarf (WD) mergers, and their relevance to the double-degenerate channel of SNe Ia. We present 3D simulations of carbon-oxygen (C/O) WD binary systems undergoing unstable mass transfer, varying both the total mass and the mass ratio. We demonstrate that these systems generally give rise to a one-armed gravitational spiral instability. The spiral density modes transport mass and angular momentum in the disk even in the absence of a magnetic field, and are most pronounced for secondary-to-primary mass ratios larger than . We further analyze carbon burning in these systems to assess the possibility of detonation. Unlike the case of a C/O WD binary, we find that WD binary systems with lower mass and smaller mass ratios do not detonate as SNe Ia up to outer dynamical times. Two additional models do however undergo net heating, and their secular increase in temperature could possibly result in a detonation on timescales longer than those considered here.
=5
1 Introduction
Type Ia supernovae (SNe Ia) serve an important role as standardizable cosmological candles (Riess et al., 1998; Perlmutter et al., 1999). However, we still lack an explanation of their origin and progenitors. Hence, the observed homogeneity of their light curves, which play a key role in the determination of the cosmological parameters, is based on purely empirical grounds. Two pathways are frequently discussed as possible progenitors of SNe Ia. Firstly, a white dwarf (WD) may accrete mass from a main sequence or red giant companion until it reaches the Chandrasekhar mass through the single-degenerate (SD) channel (Whelan & Iben, 1973). Secondly, two WDs may merge and give rise to an SN Ia through the double-degenerate (DD) channel (Iben & Tutukov, 1984; Webbink, 1984). Contrary to previous expectations, it now appears likely that the SD scenario may account for a wide range of 56Ni yields, encompassing subluminous through overluminous SNe Ia (Fisher & Jumper, 2015; Childress et al., 2015). A variety of observational constraints, including the delay-time distribution (DTD), favors the DD channel (Maoz & Badenes, 2010). Although progress is rapidly being made both observationally and theoretically, there are still many unresolved questions surrounding both channels (Maoz et al., 2013). For this reason, other evolutionary paths that might produce a SN Ia outburst have been proposed as alternatives to the SD and the DD scenarios. Among these possible channels are the core-degenerate (CD) channel (Sparks & Stecher, 1974; Livio & Riess, 2003; Kashi & Soker, 2011; Ilkov & Soker, 2013; Aznar-Siguán et al., 2015), and the collisional scenario, in which two WDs collide in a dense stellar environment (Raskin et al., 2009; Rosswog et al., 2009; Thompson, 2011; Kushnir et al., 2013; Aznar-Siguán et al., 2013). Additionally, the possibility of developing a double detonation in the carbon-oxygen core of a massive WD through the detonation of a He buffer atop the carbon-oxygen core, and the subsequent shock convergence has also been proposed (Woosley & Weaver, 1994; Livne, 1990; Livne & Arnett, 1995)
About 10% of C/O WD binary mergers have a total system mass which exceeds the Chandrasekhar mass (Badenes & Maoz, 2012). Out of ten such super-Chandrasekhar WD binaries, one will merge within a Hubble time via loss of angular momentum by gravitational waves (Nelemans et al., 2001). Toonen et al. (2012) report super-Chandrasekhar WD binaries to be 1.2% - 4.3% of the total number of WD binaries in their binary population models. These super-Chandrasekhar mass binary mergers have been hypothesized to produce a variety of end states – including SNe Ia (Iben & Tutukov, 1984), accretion-induced collapse (AIC) to neutron stars or anomalous X-ray pulsars (Saio & Nomoto, 1985; Miyaji et al., 1980; Rueda et al., 2013). Some spherically-symmetric models suggested that WD mergers would lead to an off-centered ignition and an AIC (Shen et al., 2012; Yoon et al., 2007). However, multidimensional simulations reveal a more complex picture of the merger – namely, a cold WD core surrounded by a disk generated by the tidal disruption of the secondary (Guerrero et al., 2004; Lorén-Aguilar et al., 2009; Pakmor et al., 2012a; Raskin et al., 2012a; Schwab et al., 2012), which may possibly lead to a SN Ia. In the most thoroughly-explored scenario, two C/O WDs of nearly equal mass generate sufficient tidal heating to ignite carbon and detonate a sufficiently massive primary (Pakmor et al., 2010, 2012b, 2013). In the violent merger scenario, a carbon detonation is argued to arise shortly after the tidal disruption of the secondary. The detonation conditions in this case are typically assumed to arise at the location of the maximum temperature in a smoothed particle hydrodynamics (SPH) simulation following the binary through merger, and introduced artificially in a subsequent evolution on an Eulerian grid simulation. However, other authors (Raskin et al., 2012b) do not find detonation conditions under similar circumstances. Moreover, synthetic light curves and spectra obtained from these violent mergers show a strong dependence upon viewing angle, in tension with observations (Moll et al., 2014).
In a previous paper (Kashyap et al., 2015), we followed the evolution of a C/O WD binary beyond the initial stages of evolution resulting from a violent merger. In that paper we found that gravitational instability becomes possible in the disk formed by the tidally-disrupted material of the secondary star that surrounds the primary. Using both analytic arguments and numerical simulations, we demonstrated that the disk is particularly susceptible to a one-armed spiral mode instability. This spiral gravitational instability gives rise to spiral shocks, which carry angular momentum outward, and matter inwards (Blaes & Hawley, 1988). The accreted matter in turn drives a detonation front through the primary WD. More recent work has similarly found spiral shocks contribute significantly to the angular momentum transport in CVs, even when the magnetorotational instability is active (Ju et al., 2016).
In the linear regime, an axisymmetric perturbation analysis yields the classic criterion that the disk becomes unstable when the Toomre parameter . In this expression, is the sound speed, is the epicyclic frequency with being angular velocity and is the cylindrical radial distance, is the disk surface density, and is the gravitational constant. Previous numerical and analytic studies have extended the classic axisymmetric Toomre condition to non-axisymmetric perturbations. For instance, in a pioneering study, Adams et al. (1989) and Shu et al. (1990) demonstrated that the criterion for the instability to develop the spiral mode is that the Toomre parameter should be smaller than 3 at corotation. Two key questions to be addressed in this paper are the following ones. To what extent is the development of the eccentric one-armed spiral instability a general outcome of binary WD mergers? Under what circumstances may this instability lead to detonation of the C/O WD core? In our previous paper, we argued from general principles that the inner portion of the WD disk is marginally susceptible to gravitational instability over a wide range of mass ratios, and completely independent of the total system mass. However, while we conducted a careful set of simulations varying the numerical resolution and timestep criteria in Kashyap et al. (2015), we studied just one WD merger model of a C/O WD binary. In this paper, we present the hydrodynamical evolution of several C/O WD mergers with different masses and mass ratios over several outer dynamical timescales, with the goal of analyzing the development of the spiral mode instability in these systems, and investigating their prospects to produce SN Ia.
The plan of the paper is as follows. In §2, we present our numerical methodology and suite of binary WD models. In §3, we present and discuss the results of the full nonlinear numerical evolution of these binary WD mergers. We then consider the possibility of carbon ignition with the set of initial conditions of the models considered. Lastly, in §4, we summarize our findings and elaborate our conclusions.
2 Methodology
We conducted a suite of simulations of merging C/O WDs, which initially had equal abundances of carbon and oxygen, and with masses , , , and . For these simulations, we used the SPH code employed in our previous studies (Lorén-Aguilar et al., 2010), with a resolution of SPH particles. The SPH simulations utilizes a nuclear -network which incorporates 14 nuclei: He, C,
O, Ne, Mg, Si, S, Ar, Ca, Ti, Cr, Fe, Ni, and Zn. The reactions
considered are captures and their associated back
reactions, C-C and C-O fusion reactions, and a quasi-equilibrium reduced -network for temperatures higher than K (Hix et al., 1998). All reaction rates are taken from
the REACLIB database (Cyburt et al., 2010). Neutrino losses are also taken into account, using Itoh et al. (1996).
The initial SPH conditions to simulate the merger of the two white dwarfs in a synchronized binary orbit closely follow the procedure outlined in Dan et al. (2011). In particular, we first set the coalescing white dwarfs in the co-rotating frame at a sufficiently large distance, to avoid premature mass transfer. Afterwards, the orbital separation is slowly decreased in such a way that the orbital shrinkage time is always substantially longer than the dynamical timescale of the secondary. As soon as the first SPH particle of the secondary white dwarf reaches the inner Lagrangian point (or, equivalently, the secondary fills its Roche lobe) the relaxation process is stopped, and the simulation of the merger starts. In this way we obtain accurate initial separations for our simulations. The distances between the centers of mass of the merging white dwarfs when mass transfer begins, as well as some other details, are listed in Table 1.
We introduce a lower limit for the density ( g cm), corresponding to a maximum smoothing length of km. This density limit was introduced into our SPH code in order to prevent large velocity dispersions in particles being ejected during the merging process, and a consequent greatly-reduced timestep. This maximum smoothing length is in a sense analogous to the base level grid of an adaptive mesh refinement code, which imposes a coarsest possible mesh size to a grid-based calculation. The amount of matter affected by the density limit is extremely small when compared with the mass present in the main body of the merger, so its impact on the development of the spiral instability is minimal. However, one must be cautious when interpreting the outermost regions of each disk, since the density profile inevitably becomes underresolved at some radius.
Our SPH simulation results are in good overall agreement with other similar models up to the point of merger (Lorén-Aguilar et al., 2009) although our peak temperatures are somewhat higher than those of Dan et al. (2011). Most previous SPH calculations of the coalescence of white dwarfs obtain the temperature following the evolution of the internal energy. From the newly-computed internal energy, the temperature can be obtained by inverting the equation of state. However, since a large portion of the merging white dwarfs is degenerate, this procedure can produce poor results in some cases. To avoid such spurious results we follow the evolution of the temperature simultaneously using the specific heat – see Eqs. (5) and (6) of Aznar-Siguán et al. (2013). Specifically, we always evolve the temperature using both prescriptions, and if the difference between the temperatures is larger than 5%, and the degeneracy parameter is sufficiently large so that the electrons can be considered as partially degenerate, we consider that the temperature determination obtained employing the specific heat is more reliable, and we adopt this value. Otherwise, if this is not the case, we compute the temperature in the standard way: that is, inverting the equation of state. Using this dual energy description, total energy is best conserved, and the numerical results are more reliable than an internal energy description.
| Primary Mass | Secondary Mass | Mass ratio | at | Initial Distance | |
|---|---|---|---|---|---|
| () | () | (K) | ( gm/cm3) | R⊙ | |
| 1.1 | 1.0 | 0.91 | 3.2 | 6.7 | 2.327 |
| 1.0 | 0.9 | 0.90 | 1.0 | 3.3 | 2.594 |
| 0.8 | 0.6 | 0.75 | 1.3 | 0.7 | 2.561 |
| 0.8 | 0.5 | 0.63 | 0.4 | 0.7 | 3.067 |
| 1.0 | 0.6 | 0.60 | 0.7 | 1.4 | 2.761 |
We subsequently mapped the SPH data at about 1.5 outer disk dynamical times, or 40 s after merger, onto a 3D Eulerian grid using the adaptive mesh refinement (AMR) code FLASH 4.1 (Fryxell et al., 2000; Calder et al., 2002; Dubey et al., 2009). This time of remapping defines in this paper. Our domain extends from cm to cm in each direction. At the time of remapping, the maximum temperature is typically K. We refine spatial regions in which any cell has a mass exceeding g. Both the SPH and FLASH models employ an identical equation of state which includes contributions from electrons, nuclei, and photons, and considers an arbitrary degree of special relativistic and degeneracy effects for the electrons (Timmes & Swesty, 2000). The use of the same EOS in both cases avoids spurious (and undesirable) effects introduced by the remapping procedure. The FLASH models include nuclear energy generation using a 19 isotope -chain reaction network (Timmes, 1999). FLASH incorporates both multigrid and multipole solvers to model self-gravity. In this paper, we use an improved multipole solver (Couch et al., 2013) with isolated boundary conditions and including terms through in the multipole expansion for our FLASH simulations. In Kashyap et al. (2015), we found excellent agreement between the accuracy of the multipole and multigrid solvers for this application, which justifies the selection of the multipole solver in this paper. Fluid boundary conditions follow a diode boundary condition, which assumes zero hydrodynamic gradients across the outer domain boundaries while also enforcing zero inwardly-directed hydrodynamic fluxes across the domain boundary.
The early phases of the merger are challenging to accurately treat with mesh-based codes, which experience larger advection errors in the presence of strong density gradients than SPH codes (Tasker et al., 2008), and suffer additional artifacts such as spurious torques aligning disks with the Cartesian axes (Hahn et al., 2010). Additionally, fluid instabilities and shocks are notoriously difficult to accurately simulate using SPH techniques, possibly leading to non-convergence in some instances (Springel, 2010). Our approach to simulating WD mergers therefore combines the two approaches in the regimes in which they are best suited: SPH during the early phases of the merger up to the formation of the tidally-disrupted disk, and AMR in the later stages subsequent to disk formation, in which accurate treatment of the disk spiral instabilities are crucial. The transition is made at peak compression in the SPH simulation.
We follow the system evolution for 430 s subsequent to merger, which corresponds to 8 – 22 outer dynamical times for the models presented here. Detailed results of the C/O WD binary have been presented in our previous publication (Kashyap et al., 2015). Here, we compare this model with other models of lower system mass and mass ratios. In particular, we analyze the time evolution of midplane density and temperature structure of all models. We present the results of these analyses in the next section.
3 Results
The eccentric instability is driven by the gravitational tug of the indirect potential of the primary by the disk produced by the tidally-disrupted secondary (Adams et al., 1989). Based on theoretical considerations, we expect the gravitational instability to decrease as the secondary WD mass becomes significantly smaller than that of the primary (Kashyap et al., 2015). We now consider how this expectation is borne out using fully multidimensional simulations of a suite of binary WD mergers, and explore the development of the instability as a function of the system mass, , and of the mass ratio, .
In §3.1, we analyze the growth of density perturbations by taking density slices in the midplane. To quantify the growth of the instability, we plot the Fourier modes as a function of time for different mass ratios. We consider the stability of the disks in our model at using Toomre’s parameter, which was defined previously in §1. In §3.2, we then present the evolution of the nuclear energy output and of the maximum temperature as the result of the spiral instability and resultant angular momentum transport and mass accretion, in the disk. In §3.3, we employ an analytic criterion for carbon ignition to assess the prospects for detonation of the primary WD.
3.1 Midplane Structure and Global Quantities
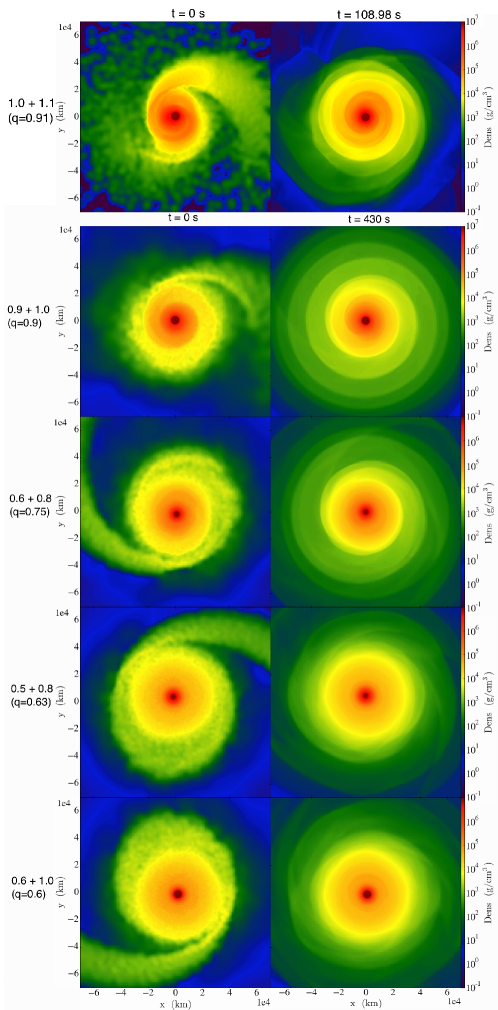
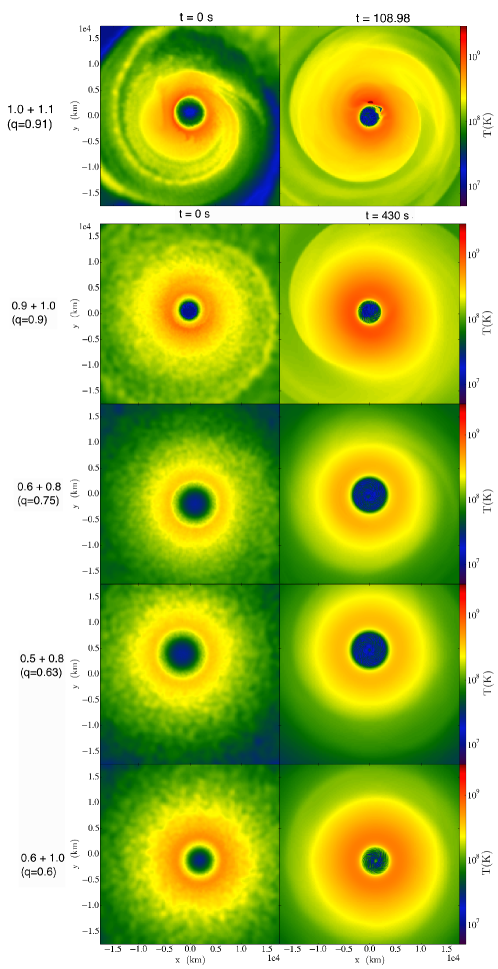
We observe the development of spiral structures in the disk caused by the eccentric spiral mode gravitational instability. Figure 1 shows the initial and the final (at s) density structure at the disk midplane for the four new models considered here. Models are presented for decreasing mass ratios, from top to bottom. Models with higher mass ratios produce more tightly wound spirals than lower mass ratios. Overall, the structure is symmetric with respect to the plane.
In Kashyap et al. (2015), we found that the spiral modes cause matter to be accreted onto the primary WD and angular momentum to be transported outward. We quantify the growth of the spiral structure by decomposing the Fourier components of the surface disk density into the lowest-order azimuthal modes. The disk surface density is the vertically-integrated mass density over scale height, :
| (1) |
We then define the Fourier coefficients of the surface density over azimuthal angle:
| (2) |
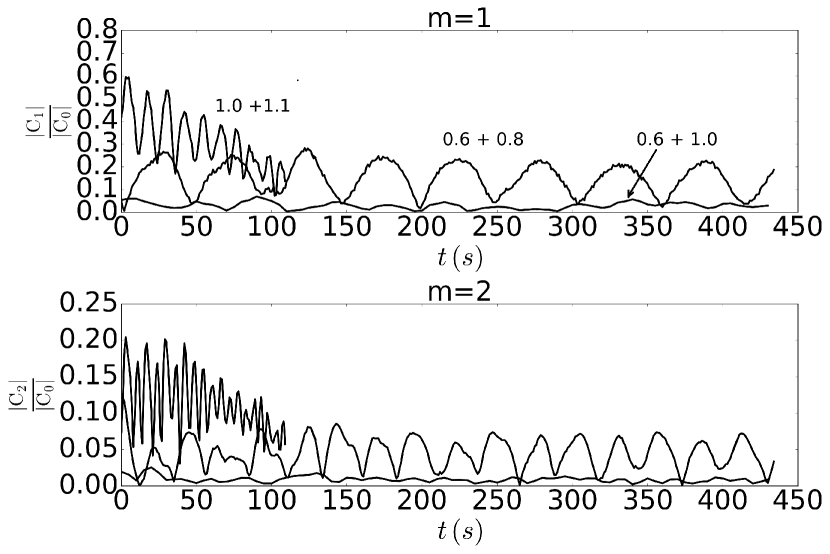
The normalization is chosen so that simply represents the total mass of the disk. Here is taken to be tidal radius of respective models and is the domain boundary. The tidal radius is defined to be the distance at which the tidal force of the primary star overcomes the self-gravity force of the secondary, and is given by where is the mass-ratio and is the radius of the secondary WD. The higher-order coefficients represent the amplitude of each mode. We plot the coefficients, normalized to the disk mass, , as a function of time for the first four modes to 4 (Figure 3). The evolution of the coefficients in time depends sensitively upon both, total mass and mass ratios. However, the strength of the time averaged , 2, 3 and 4 modes is found, in general, to increase with mass ratio (see Table 2).
Semi-periodic oscillations in the amplitudes of the and higher-order modes are clearly seen in figure 3, with the frequency of the oscillations increasing with the inner orbital frequency of the disk. Semi-periodic oscillations in spiral mode amplitudes have been noted previously in the literature e.g. figure 17 of Nelson et al. (1998). The time-variability of the mode amplitude has been interpreted as arising due to the intrinsically non-stationary nature of mode-mode interactions with higher-order modes within the disk. Laughlin et al. (1997) modeled the mode-mode interactions using analytic governing equations, and confirmed the time evolution obtained analytically using fully hydrodynamic models. As a consequence, the non-linear development growth and saturation of spiral modes as seen here generally lead to a more complex, non-steady time evolution than is captured in simplified analytic linear growth models.
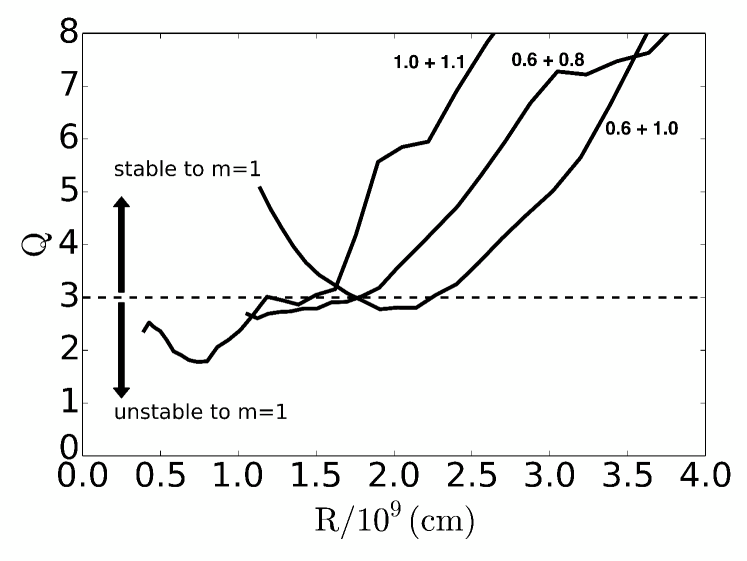
In Figure 4, the Toomre parameter is plotted for all models extending in the disk region, starting from their respective tidal radii. The growth of the modes depends on the fraction of the disk that is below , which is largest in the case of a + binary system consistent with the theoretical model. For systems with lower mass ratios, smaller portions of the disk are unstable by this criterion. Thus, the nonlinear evolution of these systems leads to the development of a spiral-mode instability in the resulting disks, as predicted from their initial properties.
3.1.1 Numerical Issues Regarding Disk Dynamics
As mentioned in the methodology section, simulating disks in a Cartesian geometry on an Eulerian mesh can lead to a number of numerical issues. These numerical issues become particularly important when studying non-axisymmetric modes for many outer-disk orbital times, as we do here. For instance, Krumholz et al. (2004) found that spurious advection in a disk simulated in Cartesian geometry leads to a number of numerical artifacts, including the numerically-driven viscous spreading of a thin ring, and the rapid evacuation of the innermost zones of a disk. Additionally, angular momentum conservation is generally an issue with a simulation on an Cartesian geometry Eulerian mesh (Truelove et al., 1998). Here, we describe how we have addressed these concerns by building upon and extending our convergence tests published in Kashyap et al. (2015) by exploring the behavior of the mode in one of our simulations, consisting of the WD merger.
The numerical and artificial viscosities in modern hydrodynamic codes like FLASH are nonlinear and generally unknown functions of resolution and the state of the gas. However, a key property which both numerical and artificial viscosity share is that they both must be functions of the resolution. Specifically, if the angular momentum transport leading to the mode generation seen here is numerically-driven, the angular momentum transport will be a strong and generally monotonic function of spatial resolution. That is, if the mode is artificial, as the mesh is coarsened, the mode will generally increase in amplitude. Further, if the mode is artificial, then as the mesh spacing goes to zero, so too will the amplitude of the mode. Conversely, if the results are physical, then as the mesh spacing goes to zero, the amplitude of the mode will converge to a single value at a given time.
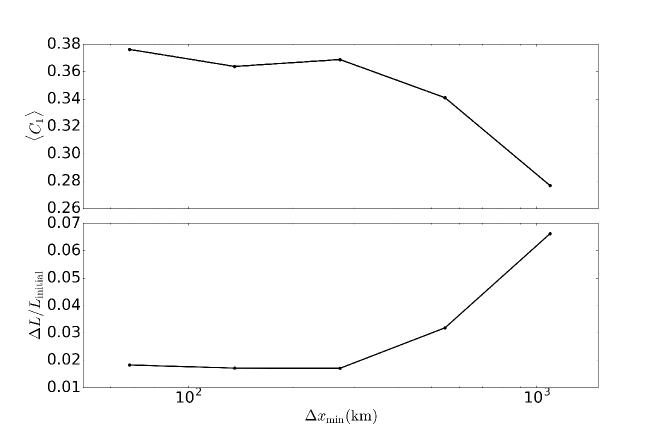
We first address to what extent the angular momentum is conserved over the duration of the simulations considered. We have monitored the angular momentum in the course of evolution to test spatial convergence, and find that deviation of angular momentum conservation from start to finish is always better than , and is typically at the level for the finest resolutions considered. A convergence study of the angular momentum conservation is plotted for the model in figure 2. Note that this plot shows the angular momentum error as a function of finest grid resolution, with the finest resolution models approaching error. The reason why this error does not asymptote to zero is due to the construction of the resolution study, which keeps the coarser grids at the same level of resolution while only refining the center-most regions.
We next examine the convergence behavior of the mode. In figure 2, we plot the time-averaged RMS amplitude of the mode over four doublings in maximum spatial resolution, while maintaining the same coarse mesh structure. It is evident that as the resolution is increased, so too is the amplitude of the mode, which is opposite of the behavior one would expect from angular momentum transport driven by numerical artifacts. Additionally, the time-averaged RMS amplitude converges to within at the highest resolutions considered. This convergence study supports the conclusion that our findings are driven by disk physics and not numerics.
3.2 Heating and Nuclear Burning
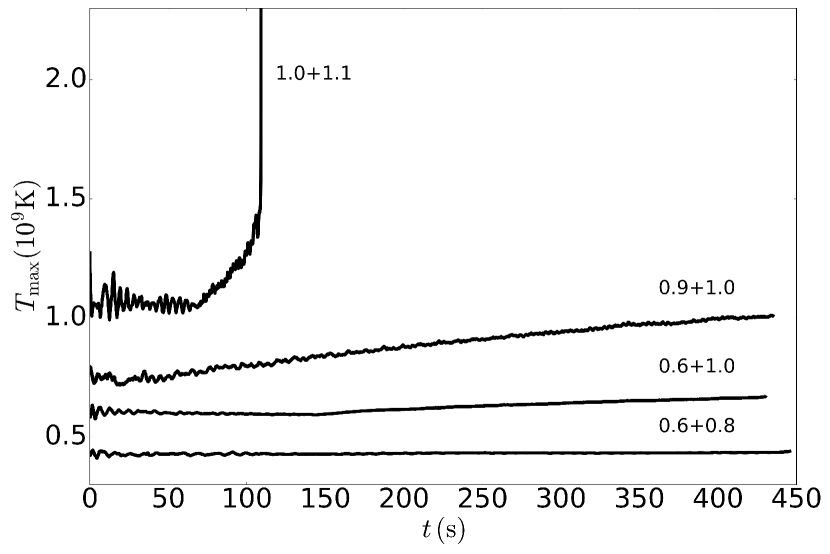
Figure 5 shows the midplane temperature slices at two points in the evolution, and s for all models, apart from the detonating + model, which is shown at the onset of detonation at s. As can be seen in these plots, the tidally-heated disk surrounds the cold primary, which remains almost intact. The maximum temperature always occurs just outside the surface of the primary star, consistent with a virial estimate (Kashyap et al., 2015). Typically the maximum temperature is K at . The typical density at the location of maximum temperature is g cm-3. The temporal evolution of the maximum temperature is shown in Fig. 6 for all models. The maximum temperature increases with increasing total mass – namely, the configurations resulting from the mergers of the + , + and + systems. However, only the first of these models shows a prominent increase of the maximum temperature as a consequence of mass accretion due to the spiral instability. This effect is seen most clearly in the disk region in the first slice. The rest of the systems show modest temperature increases. Finally, the models with the smallest total masses do not experience any marked increase of the maximum temperature. The increase of temperature in the C/O WD surface, as hot disk material is accreted, leads for the first of our models to the conditions necessary for C to detonate – K at densities g cm-3 (Kashyap et al., 2015; Seitenzahl et al., 2009). We find that a detonation arises only in the systems with large mass ratios that have higher maximum temperature and density at (Kashyap et al., 2015). However unlike previous results (Dan et al., 2014), we find an increase of maximum temperature which in this case can be attributed to the spiral mode instability, whose saturated amplitude depends sensitively upon the mass ratio (see Table 2 and Fig. 3).
We emphasize that systems with the same primary masses but differing mass ratios evolve distinctly under the action of the spiral instability. For instance, consider the temperature slices in the first and last rows of Fig. 5 (corresponding to the and simulations). They have the same primary masses but, owing to their different mass ratios, they exhibit different behaviors. For example, the mode strength and temperature in the disk region is larger for the case. There is a larger increase of the maximum temperature for the case when compared to the model. Similarly, we find that the growth rate of the instability for the model is greater than that of the system.
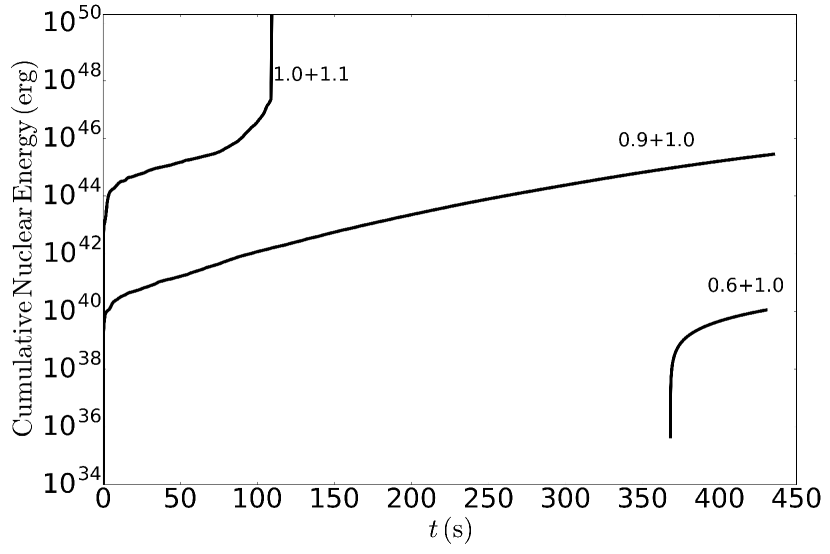
To explain these results we integrated the nuclear energy released during the evolution and computed the cumulative nuclear energy yield as a function of time. The evolution of the cumulative energy release, including neutrino losses, is shown in Fig. 7. Of all the models considered here, we find that only the cases of and have a positive energy balance at all times during its evolution. The model resulting from the merger of a binary system has positive energy output at later times. We analyzed the time evolution of mass and internal energy fluxes in different cylindrical radial bins for the 1.0+0.6 model. In this model, heating from the compression in the inner disk, which is concentrated within the spiral shocks, advects hot material inwards towards the primary and is responsible for the slow secular increase in temperature, while the other cases, and have negative energy balances (due to neutrino cooling) and hence show slight decreases of the total internal energies and maximum temperatures (see Fig. 6).
| Primary Mass | Secondary Mass | Mass ratio | ||||
|---|---|---|---|---|---|---|
| () | () | |||||
| 1.1 | 1.0 | 0.91 | 0.4694 | 0.1865 | 0.0674 | 0.0689 |
| 1.0 | 0.9 | 0.90 | 0.1593 | 0.0570 | 0.0209 | 0.0082 |
| 0.8 | 0.6 | 0.75 | 0.1650 | 0.0494 | 0.0171 | 0.0073 |
| 0.8 | 0.5 | 0.63 | 0.0440 | 0.0121 | 0.0060 | 0.0042 |
| 1.0 | 0.6 | 0.60 | 0.0331 | 0.0097 | 0.0062 | 0.0042 |
3.3 Ignition
The slow secular increase of the maximum temperature observed in some of our merger models poses a key question: Under what conditions will carbon ignite, and lead to a subsequent detonation of the underlying CO WD core? Carbon requires high temperatures ( K at densities g cm-3) to ignite, which are very difficult to achieve naturally in sub-Chandrasekhar models, including double-degenerate mergers. Indeed, this difficulty in reaching carbon ignition conditions has been a primary motivation in pursuing the violent merger scenario itself, and in pursuing alternatives to violent mergers, including head-on WD collisions (Raskin et al., 2009; Pakmor et al., 2010, 2012b; Kushnir et al., 2013), and tidal disruption of WDs around intermediate-mass black holes (MacLeod et al., 2015).
The Zel’dovich mechanism, which invokes the development of a subsonic burning front as it accelerates into a detonation front across a temperature gradient, is the primary mechanism for the initiation of a detonation front in an unconfined medium (Zel’dovich et al., 1970). A full analysis yields the critical length scale as a function of density and temperature, with a somewhat weaker dependence on the functional form of the temperature profile, e.g. linear or Gaussian (Seitenzahl et al., 2009). At low densities and temperatures, the critical length scale is comparable to the size of the star itself, making any such detonation implausible. However, because of the extreme sensitivity of the nuclear burning rates to temperature, at sufficiently high temperatures, the critical length scale drops by many orders of magnitude. Consequently, when the critical length scale of the detonation becomes smaller than the hydrodynamic scales of interest, any small portion of the flow with a well-ordered temperature gradient is likely to form a detonation front.
We develop a simple local runaway criteria by comparing the burning timescale () with the dynamical timescale (). Here we take the dynamical time where is density of the cell. Following other authors (Dan et al., 2014), we develop an analytic form for for carbon burning using a single-reaction rate. Here is nuclear energy generation rate, is specific heat capacity at constant pressure and is the temperature. The locus of these points satisfying yields the desired detonation condition as a curve in the density-temperature plane. We plot the detonation criteria curve in Fig. 8, along with our simulation data. In the production of the analytical curves, it has been assumed that the nuclear reaction timescale is set by 12C (12C,) 20 N (Blinnikov & Khokhlov, 1987; Caughlan & Fowler, 1988).
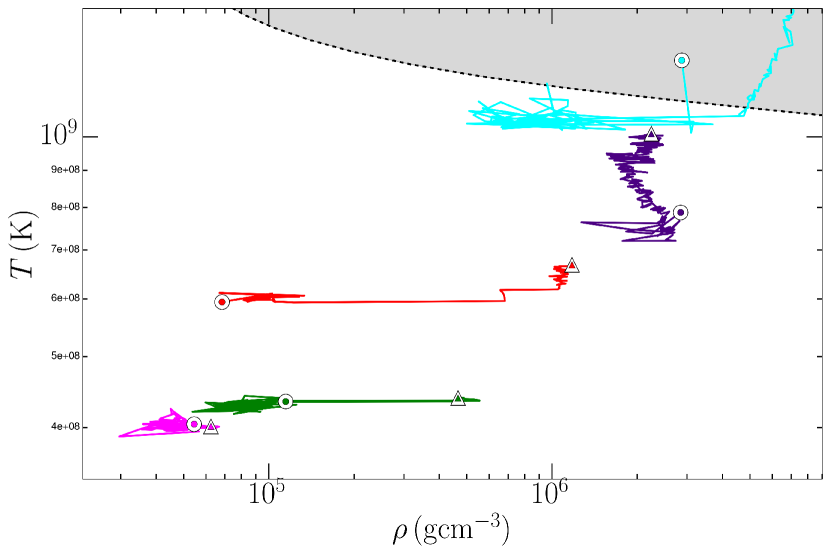
As mentioned previously, in the models presented here, the maximum temperature is found to be just outside the surface of the primary WD (see Fig. 5). In the spiral mechanism, the hot material accretes at the surface of the white dwarf, mixing with the cold degenerate material and driving the temperature towards C ignition. Hence, we examine the temperature and density at the location of the maximum temperature in relation to the detonation criterion. We find that three lower mass models (,,) are outside the C-ignition region (see Fig. 8). Because of their significant nuclear energy production, the , and models generally experience an increase in their peak temperature. That is, these three models evolve towards higher temperature in the plane in figure 8. We also observe that the region containing the hotspot lies inside the tidal radii of the mergers. We find mass accretion driven by the spiral modes accumulates mass near the surface of the white dwarf. As a result, the hotspots also move towards higher densities for models in figure 8. The increase in density at peak temperature location is smaller for models with weaker spiral modes as shown for three of the lower mass models in figure 8. However, two of the higher-mass models also have significant nuclear energy production which tends to lower their density at the location of peak temperature. These findings demonstrate the potential for the spiral mechanism to drive WD mergers towards carbon ignition, and possible detonation, even when prompt detonation fails. Further studies are required to fully understand the long-term secular evolution in such post-merger sub-Chandrasekhar binary WD models.
A preliminary estimation using maximum temperature and cumulative nuclear energy graph shows that the models and will reach the carbon detonation condition in 145 and 58 inner disk dynamical times respectively. We assume that the temperature-density condition for carbon detonation would be same for all of the high mass systems ( ).
4 Summary and Conclusions
We have examined the hydrodynamical evolution of binary white dwarf mergers with accretion disks formed from the disruption of the secondary WD. We find that binary WD systems undergoing unstable mass transfer with comparable masses generally develop a spiral mode instability subsequent to merger. The accretion disk around the primary WD is subject to the eccentric gravitational instability, which leads to an spiral mode. We observe that the strength of all modes considered, from through , sensitively depends upon and grows with increasing mass ratios of the binary WD system. We also have found that the temperature and density conditions do not reach carbon ignition condition over dynamical times for system masses less than . However, the slow secular increase of the maximum temperature in the model resulting from the merger of the and binary systems suggest that they could reach carbon detonation on longer timescales than explored in this study.
We have analyzed our results using an analytical criterion for runaway carbon burning. However, it has been shown using extended nuclear reaction network including additional -capture reaction pathways that the mass of the He layer required for detonation could be as small as to for WDs with masses to , respectively (Shen & Moore, 2014). Thus it may be the case that C/O WDs including such thin He layers, and modeled using an extended reaction network may result in qualitatively different outcomes than found here. The detonation of the He layer may lead to the detonation of the C/O core, or otherwise lead to a ‘.Ia’ SN. Future work is needed to determine the outcome of these systems.
Our previous paper (Kashyap et al., 2015) showed that a model with a total system mass produces of 56Ni, which results in a normal, slowly-declining SN Ia similar to SN 2001ay (van Rossum et al., 2016). In light of these previous findings, if lower-mass binary WD models are able to detonate, either through a slow secular onset as suggested in this paper, or through the ignition of thin He layers, they might span a range of luminosities and decline rates covering the full range of normal SNe Ia. Such double-degenerate mergers may provide a broader pathway for double-degenerate merger to contribute to the total SNe Ia rate, and help resolve outstanding issues regarding the trigger mechanism and the rates of double-degenerate SNe Ia.
Acknowledgements We thank James Guillochon, Daan Van Rossum, Chris Byrohl, and Pranav Dave for useful discussions. We also would like to thank the anonymous reviewer for their useful comments and insights. The work of EG-B, GA-S and PL-A was partially funded by MINECO AYA2014-59084-P grant and by the AGAUR. The software used in this work was in part developed by the DOE NNSA-ASC OASCR Flash Center at the University of Chicago. This work used the Extreme Science and Engineering discovery Environment (XSEDE), which is supported by National Science Foundation grant number ACI-1053575. Simulations at UMass Dartmouth were performed on a computer cluster supported by NSF grant CNS-0959382 and AFOSR DURIP grant FA9550-10-1-0354. RTF thanks the Institute for Theory and Computation at the Harvard-Smithsonian Center for Astrophysics, and the Kavli Institute for Theoretical Physics, supported in part by the national Science Foundation under grant NSF PHY11-25915, for visiting support during which this work was completed. This research has made use of resources from NASA’s Astrophysics Data System and the yt astrophysics analysis software suite (Turk et al., 2011).
References
- Adams et al. (1989) Adams, F. C., Ruden, S. P., & Shu, F. H. 1989, ApJ, 347, 959
- Aznar-Siguán et al. (2013) Aznar-Siguán, G., García-Berro, E., Lorén-Aguilar, P., José, J., & Isern, J. 2013, MNRAS, 434, 2539
- Aznar-Siguán et al. (2015) Aznar-Siguán, G., García-Berro, E., Lorén-Aguilar, P., Soker, N., & Kashi, A. 2015, MNRAS, 450, 2948
- Badenes & Maoz (2012) Badenes, C., & Maoz, D. 2012, ApJ, 749, L11
- Blaes & Hawley (1988) Blaes, O. M., & Hawley, J. F. 1988, ApJ, 326, 277
- Blinnikov & Khokhlov (1987) Blinnikov, S. I., & Khokhlov, A. M. 1987, Pisma v Astronomicheskii Zhurnal, 13, 868
- Calder et al. (2002) Calder, A. C., Fryxell, B., Plewa, T., et al. 2002, ApJS, 143, 201
- Caughlan & Fowler (1988) Caughlan, G. R., & Fowler, W. A. 1988, Atomic Data and Nuclear Data Tables, 40, 283
- Childress et al. (2015) Childress, M. J., Hillier, D. J., Seitenzahl, I., et al. 2015, ArXiv e-prints, arXiv:1507.02501
- Couch et al. (2013) Couch, S. M., Graziani, C., & Flocke, N. 2013, ApJ, 778, 181
- Cyburt et al. (2010) Cyburt, R. H., Amthor, A. M., Ferguson, R., et al. 2010, ApJS, 189, 240
- Dan et al. (2014) Dan, M., Rosswog, S., Brüggen, M., & Podsiadlowski, P. 2014, MNRAS, 438, 14
- Dan et al. (2011) Dan, M., Rosswog, S., Guillochon, J., & Ramirez-Ruiz, E. 2011, ApJ, 737, 89
- Dubey et al. (2009) Dubey, A., Antypas, K., Ganapathy, M. K., et al. 2009, Parallel Computing, 35, 512
- Fisher & Jumper (2015) Fisher, R., & Jumper, K. 2015, ApJ, 805, 150
- Fryxell et al. (2000) Fryxell, B., Olson, K., Ricker, P., et al. 2000, ApJS, 131, 273
- Guerrero et al. (2004) Guerrero, J., García-Berro, E., & Isern, J. 2004, A&A, 413, 257
- Hahn et al. (2010) Hahn, O., Teyssier, R., & Carollo, C. M. 2010, MNRAS, 405, 274
- Hix et al. (1998) Hix, W. R., Khokhlov, A. M., Wheeler, J. C., & Thielemann, F.-K. 1998, ApJ, 503, 332
- Iben & Tutukov (1984) Iben, Jr., I., & Tutukov, A. V. 1984, ApJS, 54, 335
- Ilkov & Soker (2013) Ilkov, M., & Soker, N. 2013, MNRAS, 428, 579
- Itoh et al. (1996) Itoh, N., Hayashi, H., Nishikawa, A., & Kohyama, Y. 1996, ApJS, 102, 411
- Ju et al. (2016) Ju, W., Stone, J. M., & Zhu, Z. 2016, ApJ, 823, 81
- Kashi & Soker (2011) Kashi, A., & Soker, N. 2011, MNRAS, 417, 1466
- Kashyap et al. (2015) Kashyap, R., Fisher, R., García-Berro, E., et al. 2015, ApJ, 800, L7
- Krumholz et al. (2004) Krumholz, M. R., McKee, C. F., & Klein, R. I. 2004, ApJ, 611, 399
- Kushnir et al. (2013) Kushnir, D., Katz, B., Dong, S., Livne, E., & Fernández, R. 2013, ApJ, 778, L37
- Laughlin et al. (1997) Laughlin, G., Korchagin, V., & Adams, F. C. 1997, ApJ, 477, 410
- Livio & Riess (2003) Livio, M., & Riess, A. G. 2003, ApJ, 594, L93
- Livne (1990) Livne, E. 1990, ApJ, 354, L53
- Livne & Arnett (1995) Livne, E., & Arnett, D. 1995, ApJ, 452, 62
- Lorén-Aguilar et al. (2009) Lorén-Aguilar, P., Isern, J., & García-Berro, E. 2009, A&A, 500, 1193
- Lorén-Aguilar et al. (2010) Lorén-Aguilar, P., Isern, J., & García-Berro, E. 2010, MNRAS, 406, 2749–2763
- MacLeod et al. (2015) MacLeod, M., Guillochon, J., Ramirez-Ruiz, E., Kasen, D., & Rosswog, S. 2015, ArXiv e-prints, arXiv:1508.02399
- Maoz & Badenes (2010) Maoz, D., & Badenes, C. 2010, MNRAS, 407, 1314
- Maoz et al. (2013) Maoz, D., Mannucci, F., & Nelemans, G. 2013, ArXiv e-prints
- Miyaji et al. (1980) Miyaji, S., Nomoto, K., Yokoi, K., & Sugimoto, D. 1980, PASJ, 32, 303
- Moll et al. (2014) Moll, R., Raskin, C., Kasen, D., & Woosley, S. E. 2014, ApJ, 785, 105
- Nelemans et al. (2001) Nelemans, G., Yungelson, L. R., Portegies Zwart, S. F., & Verbunt, F. 2001, A&A, 365, 491
- Nelson et al. (1998) Nelson, A. F., Benz, W., Adams, F. C., & Arnett, D. 1998, ApJ, 502, 342
- Pakmor et al. (2010) Pakmor, R., Kromer, M., Röpke, F. K., et al. 2010, Nature, 463, 61
- Pakmor et al. (2012a) Pakmor, R., Kromer, M., Taubenberger, S., et al. 2012a, ApJ, 747, L10
- Pakmor et al. (2012b) —. 2012b, ApJ, 747, L10
- Pakmor et al. (2013) Pakmor, R., Kromer, M., Taubenberger, S., & Springel, V. 2013, ApJ, 770, L8
- Perlmutter et al. (1999) Perlmutter, S., Aldering, G., Goldhaber, G., et al. 1999, ApJ, 517, 565
- Raskin et al. (2012a) Raskin, C., Scannapieco, E., Fryer, C., Rockefeller, G., & Timmes, F. X. 2012a, ApJ, 746, 62
- Raskin et al. (2012b) —. 2012b, ApJ, 746, 62
- Raskin et al. (2009) Raskin, C., Timmes, F. X., Scannapieco, E., Diehl, S., & Fryer, C. 2009, MNRAS, 399, L156
- Riess et al. (1998) Riess, A. G., Filippenko, A. V., Challis, P., et al. 1998, AJ, 116, 1009
- Rosswog et al. (2009) Rosswog, S., Kasen, D., Guillochon, J., & Ramirez-Ruiz, E. 2009, ApJ, 705, L128
- Rueda et al. (2013) Rueda, J. A., Boshkayev, K., Izzo, L., et al. 2013, ApJ, 772, L24
- Saio & Nomoto (1985) Saio, H., & Nomoto, K. 1985, A&A, 150, L21
- Schwab et al. (2012) Schwab, J., Shen, K. J., Quataert, E., Dan, M., & Rosswog, S. 2012, MNRAS, 427, 190
- Seitenzahl et al. (2009) Seitenzahl, I. R., Meakin, C. A., Townsley, D. M., Lamb, D. Q., & Truran, J. W. 2009, ApJ, 696, 515
- Shen et al. (2012) Shen, K. J., Bildsten, L., Kasen, D., & Quataert, E. 2012, ApJ, 748, 35
- Shen & Moore (2014) Shen, K. J., & Moore, K. 2014, ApJ, 797, 46
- Shu et al. (1990) Shu, F. H., Tremaine, S., Adams, F. C., & Ruden, S. P. 1990, ApJ, 358, 495
- Sparks & Stecher (1974) Sparks, W. M., & Stecher, T. P. 1974, ApJ, 188, 149
- Springel (2010) Springel, V. 2010, ARA&A, 48, 391
- Tasker et al. (2008) Tasker, E. J., Brunino, R., Mitchell, N. L., et al. 2008, MNRAS, 390, 1267
- Thompson (2011) Thompson, T. A. 2011, ApJ, 741, 82
- Timmes (1999) Timmes, F. X. 1999, ApJS, 124, 241–263
- Timmes & Swesty (2000) Timmes, F. X., & Swesty, F. D. 2000, ApJS, 126, 501
- Toonen et al. (2012) Toonen, S., Nelemans, G., & Portegies Zwart, S. 2012, A&A, 546, A70
- Truelove et al. (1998) Truelove, J. K., Klein, R. I., McKee, C. F., et al. 1998, ApJ, 495, 821
- Turk et al. (2011) Turk, M. J., Smith, B. D., Oishi, J. S., et al. 2011, ApJS, 192, 9
- van Rossum et al. (2016) van Rossum, D. R., Kashyap, R., Fisher, R., et al. 2016, ApJ, 827, 128
- Webbink (1984) Webbink, R. F. 1984, ApJ, 277, 355
- Whelan & Iben (1973) Whelan, J., & Iben, Jr., I. 1973, ApJ, 186, 1007
- Woosley & Weaver (1994) Woosley, S. E., & Weaver, T. A. 1994, ApJ, 423, 371
- Yoon et al. (2007) Yoon, S.-C., Podsiadlowski, P., & Rosswog, S. 2007, MNRAS, 380, 933
- Zel’dovich et al. (1970) Zel’dovich, Y. B., Librovich, V. B., Makhviladze, G. M., & Sivashinskil, G. I. 1970, Journal of Applied Mechanics and Technical Physics, 11, 264