acmlicensed \isbn123-4567-24-567/08/06 \acmPrice$15.00
acmlicensed \isbn978-1-4503-4335-0/17/03\acmPrice$15.00 http://dx.doi.org/10.1145/2998181.2998321
Quantifying Search Bias: Investigating Sources of Bias
for Political Searches in Social Media
Abstract
Search systems in online social media sites are frequently used to find information about ongoing events and people. For topics with multiple competing perspectives, such as political events or political candidates, bias in the top ranked results significantly shapes public opinion. However, bias does not emerge from an algorithm alone. It is important to distinguish between the bias that arises from the data that serves as the input to the ranking system and the bias that arises from the ranking system itself. In this paper, we propose a framework to quantify these distinct biases and apply this framework to politics-related queries on Twitter. We found that both the input data and the ranking system contribute significantly to produce varying amounts of bias in the search results and in different ways. We discuss the consequences of these biases and possible mechanisms to signal this bias in social media search systems’ interfaces.
doi:
http://dx.doi.org/10.475/123_4category:
H.1.2 User / Machine Systems Human information processingcategory:
H.3.3 Information Search and Retrieval Search processcategory:
H.3.5 On-line Information Services Web-based serviceskeywords:
Search Bias; Search Bias Quantification; Sources of Search Bias; Social Media Search; Political Bias Inference; Twitter;1 Introduction
As algorithmic decision making systems pervade our daily lives, there is a growing concern about their lack of transparency and their potential for offering biased or discriminatory results to their users [11]. Search engines are one of these systems that users rely on for a variety of daily tasks from locating specific websites or content to learning broadly about events, people, or businesses unfamiliar to them. When a user is trying to “learn” or gather information about a topic [46], search engines could influence the user’s opinions about the topic by preferentially ranking results that correspond to one particular perspective on the topic above others. This possibility is particularly troubling in the context of informational queries about polarizing topics like political debates or politicians, where contrasting perspectives exist. Recently conducted field studies have shown that not only do users place greater trust in higher ranked search results [30], but also that user opinions about political candidates can be manipulated by biased rankings of search results [9].
Characterizing the bias present in a search system can be quite challenging. Search engines employ a ranking system to retrieve a list of results from a corpus of data (i.e., collection of web pages or user posts like tweets) based on their relevance to a user’s query. So, when quantifying the bias of a search engine in response to a query, it is useful to distinguish (i) the bias that arises from the data corpus that acts as input to the ranking system of the search engine, from (ii) the bias that arises from the ranking system itself. In this paper, we shed light on these challenges by answering the following research questions:
-
•
RQ1: How can we quantify the different sources of search engine bias?
-
•
RQ2: How biased are the search results for political topics on social media sites like Twitter? Where does this bias in the search results come from?
We address these questions for political queries related to the 2016 US Presidential primaries using Twitter Search. We chose a social media search engine because people are increasingly relying on social media for their news. In recent elections, it has become common for people to search for information about political candidates and events on social media sites [41]. Furthermore, in August 2015, the Pew Research Center announced that approximately two thirds of American adults received their news from Twitter—and they continued to follow news threads on Twitter as they progressed [26].
To answer our first question, we first propose a search bias quantification framework that quantifies the bias of the output results of a search engine. Moreover, this framework also discerns to what extent this output bias is due to the input data set that feeds into the ranking system and how much is due to the bias introduced by the ranking system. Our framework requires a methodology for inferring political bias of individual search results. Hence, we also developed a method to infer the political bias of individual data items on Twitter with high accuracy and coverage.
To address the second question, we gathered data for 25 political queries in Twitter search in December 2015 during a week in which two presidential debates occurred—one Republican debate and one Democratic debate. Applying our quantification method on the collected data, we found that both the input data and the ranking system contribute significantly in producing the bias in the resulting Twitter search results. For example, while the Twitter stream containing our selected queries (the input data) contributed to the output data by adding a democratic bias on average, the ranking system shifted or in some cases altered the polarity of this bias, resulting in a substantially different political bias in the final search results.
This collective contribution of the input data and the ranking system in producing the output bias can noticeably affect a user’s search experience. We observed, for instance, that the Twitter input data stream for the most popular candidates in a party were more biased towards the opposing political perspective. However, the manner in which the ranking system altered the input to produce the output, and therefore its bias, was different for the popular candidates from each political party. While the ranking system mitigated the opposing bias in the search results for the most popular democratic candidate, it enhanced it for the most popular republican candidate. Simply put, if a user searches for the most popular republican candidate, she will get more tweets from the opposing political party than if she searched for the most popular democratic candidate. This may be less than desirable for a popular republican candidate if the users with the opposing polarity primarily post negative tweets about the candidate that result in negatively biased search results for her or him. Additionally, we also observed that differently phrased but similar queries (referring to the same debate event) can yield significantly different biases.
Lastly, we call for raising the awareness of search engine users by signaling the bias in the search results. We briefly discuss two possible solutions of either incorporating the bias in the ranking systems itself or incorporating it in search engine designs by making the bias in the search results transparent to users.
2 Related Work
2.1 Bias in Web Search
In recent years, there has been a growing interest in studying the bias in Web search engines results [40, 42, 12, 43, 27]. Much of this work has been motivated by the concern that dominant search engines like Google might favor certain websites over others when ranking relevant search results. For example, Google might preferentially rank videos from YouTube (owned by Google) over videos from competing sites. Whereas, exploring geographical bias, [43] measured whether sites from certain countries are covered more than sites from other countries in search results.
Several studies have explored political bias in Web search results and search queries. While Weber et al [44] inferred political leanings of search queries by linking the queries with political blogs, Epstein and Robertson [9] studied how bias in search rankings can influence people’s candidate selection in elections. They asked people unaware of the political candidates in an election to search for the candidates and form an opinion based on the results. By biasing the search results in a controlled manner, they showed that search rankings could impact their voting preferences in an election by or more. Their observations demonstrate the potential impact of search results on the political opinion of users, and thus provide the motivation for our present study.
A complementary line of work has studied the differences or biases in Web search results due to personalization, i.e., the differences in the results seen by different users for the same query. [15, 19] studied differences in search results due to the geo-location of users. [20] studied how the information-seeking behavior of users changes due to a major event such as a shooting incident, and found that most people use search engines to access information that they agree with. These studies are performed from the viewpoint of particular users, whereas the present work shows that political biases exist even in non-personalized search results in the context of social media.
2.2 Measuring Political Bias on Social Media
While there have been prior attempts to infer the political bias of textual content in online forums, such as blogs and news articles [2, 47, 52] or hashtags on Twitter [45], to our knowledge, no work has measured the political bias of a tweet based on its textual content, particularly due to its very small size. Instead, many previous studies have tried to infer the bias of a tweet’s source (the user who posted it), by modeling the language usage of the users from different political polarities [33, 24] or by leveraging the social links that a user has with other Twitter users with known biases [14, 7]. Conover et al. [6] inferred the political alignment of Twitter users, based on the tweets or hashtags posted by the users, as well as the community structure of diffusion networks (via retweets) of political information, observing that the mechanism relying on social network performs better. In [51], the authors automatically measure the impartiality of the social media posts based on how discernible the affiliation of the author is.
While all the aforementioned studies try to infer a Twitter user’s bias, they rely on the assumption that the political leaning of a user is explicit in either her language or her social network. This may not be the case with many users who either do not post political content frequently or do not connect to other political users directly, but might still have political leanings. To account for this constraint, we build upon these prior studies to propose a new methodology to infer the bias of a user by including other factors correlated with the political affiliation of a user, namely her interests.
2.3 Cross-Ideological Interactions on Social Media
With the rising popularity of social media sites like Twitter and Facebook, users are increasingly relying on them to obtain news[22], real-time information about ongoing events and public opinion on celebrities[41]. While some researchers envisaged increased democratization through social media usage, with higher engagement between users who do not share the same political ideology [36], some others argued that social media usage can result in selective exposure by providing a platform that reinforces users’ existing biases [23]. By examining cross-ideological exposure through content and network analysis, [18] showed that political talk on Twitter is highly partisan and users are unlikely to be exposed to cross-ideological content through their friendship network. Other studies have also confirmed these results by demonstrating users’ higher willingness to communicate with other like-minded social media users [23, 38] and their inability to engage in meaningful discussions with different-minded users [48] .
To understand the political bias in social media better, many researchers have studied political polarization on Twitter through analyzing different groups’ behavior. [7] showed that Twitter users usually retweet the users who have the same political ideology as themselves, making the retweeting network structure highly partitioned into left- and right-leaning groups with limited connections between them. Liao et al. [21] investigated political polarization in the context of a majority and minority group on a political topic (pro-snowden vs. anti-snowden), finding that while the Twitter population is more likely to be pro-snowden, the minority group (anti-snowden) uses some features of the biased environment such as retweeting to mitigate this existing bias.
Instead of studying the interactions between cross-ideological users, our current study explores the problem of measuring political bias of social media search engine and unpacking the sources of bias. While many studies have shown the existence of political bias in social media, to our knowledge none have characterized the sources of this bias. Little is known about how much bias is inherent in the data and whether and how the search system enhances or mitigates this bias. Our study tries to shed light on these questions through investigating the sources of political bias in the context of 2016 US presidential election on Twitter.
2.4 Auditing Algorithms
Today, algorithms that curate and present information in online platforms can affect users’ experiences significantly – creating discriminatory ads based on gender [8] or race [39], showing different prices for the same products/services to different users [16] and mistakenly labeling a black man as an ape by an image tagging algorithm [17] – are some such examples. These issues have lead researchers, organizations and even governments towards a new avenue of research called “auditing algorithms”, which endeavors to understand if and how an algorithmic system can cause biases, particularly when they are misleading or discriminatory to users [35, 11].
Besides the algorithm design, biased input data to an algorithm can also result in a biased output. This insight is particularly crucial in this digital era where many algorithms are trained using huge amounts of data [3]. Therefore, distinguishing whether a bias in an algorithmic system’s output is caused by its input or the algorithm itself, is of prime importance. This work is a first step towards tackling this challenge in the area of search systems.
3 RQ1: Quantifying Search Engine Bias
This section focuses on our first research question – the quantification of search bias. In this paper, we quantify the search bias for the Twitter social media search engine in the context of the US political scenario, where there are two main political parties: the Democratic party and the Republican party.
We first propose a framework to capture the different stages of a search process and then discuss metrics to measure the biases at each stage (RQ1a). This framework requires a methodology for inferring the bias of individual search items, and later in the section we present such a methodology in the context of Twitter search (RQ1b).
3.1 RQ1a: Search Engine Bias Quantification Framework
Figure 1 gives an intuitive illustration of the main stages of retrieving information via an algorithmic search system. The search system retrieves information from a corpus of data items. Each of these data items has a bias associated with it, given by the bias score (computed as described in the next section: RQ1b). When a user submits a search query, a set of data items that is relevant to the query is first retrieved (selected out of all data items in the entire corpus). Then, the set of retrieved relevant items constitutes the input data to the ranking system which produces a ranked list of the relevant items, and this ranked list is shown to the user as the search output.111The framework can also be generalized to modern-day IR systems which perform retrieval and ranking together, such as systems using topic modeling. We comment on this issue in the Discussion section. The users generally give much more attention and importance to the top-ranked items in the list than the lower-ranked items [25].
In the case of Twitter search engine, the data corpus comprises of the set of all tweets. When a query like ‘Bernie Sanders’ is issued to Twitter search, all the tweets containing ‘Bernie Sanders’ are selected as relevant items. This set of relevant tweets serves as the input to the ranking system, which orders them to output a ranked list of tweets which are displayed to the user.
In our framework, we quantify three different biases for a search system, in terms of the biases of the individual data items: (i) input bias: the bias in the set of retrieved items relevant to the query (filtered out of the whole corpus), that serves as the input data to the ranking system, (ii) ranking bias: the bias introduced by the ranking system, and (iii) output bias: the cumulative bias in the ranked list output by the search system. In the remainder of the section, we discuss the metrics we use to quantify these biases for Twitter search in the context of US politics.
| Rank | Bias till rank | Value |
| 1 | ||
| 2 | ||
| 3 | ||
| 4 | ||
| 5 | ||
| Output bias at rank 5 | ||
Bias of an individual data item: As mentioned earlier, the search scenario that we are considering is one of the US politics, where there are mainly two political parties. Each data item (i.e., a tweet) can be positively biased (i.e., supporting) or negatively biased (i.e., opposing) or neutral towards each of these two parties, and the bias score of each item (indicated by in Figure 1) captures the degree to which the item is biased with respect to the two parties. In the next section (RQ1b), we describe a methodology for measuring the bias score of items in the context of US political searches on Twitter social media.
We next define metrics for the input bias, output bias and ranking bias, in terms of the bias scores of the individual data items.
Input Bias: When a user issues a query to the search system, a set of items that are relevant to the query is selected out of the whole corpus, and provided as input to the ranking system. This input data captures the bias introduced by the query by filtering the relevant items from the whole corpus of data. Therefore, we measure the input bias for a query as the aggregate bias of all items relevant to the query, that become the input to the ranking system. Put differently, input bias gives a measure of what bias a user would have observed, had she been shown random items relevant to the query, instead of a list ranked by the ranking system.
Specifically, the Input Bias for query is the average bias of all data items that are relevant to
| (1) |
where the summation is over all the bias scores () of the data items found relevant to . For instance, for the query shown in Figure 1, the input bias is simply .
Output Bias: The output bias is the effective bias presented to the user (who issued the search query) via the final ranked list from the search engine. While quantifying search bias, it must be noted that, whereas the input bias was for an unordered set of items, the output search bias is to be measured over a ranked list. The higher ranked items should be given more importance, since not only are the users more likely to browse through the top search results [25], but they also tend to have more trust in them [30]. Hence, we propose a metric for output search bias, that is inspired by the well-known metric Average Precision [25] from the Information Retrieval literature.
For a given search query , we first define the bias till a particular rank in the ranked results (i.e., the aggregate bias of the top results). The bias till rank of the output ranked list is defined as
| (2) |
where the summation is over the top items in the ranked list. For instance, with respect to the situation shown in Fig. 1, Table 1 (first five rows) shows the bias till ranks 1, 2, …, 5.
Next, we extend the above definition to define the Output Search Bias for the query at rank .
| (3) |
For instance, the last row of Table 1 computes at rank with respect to the situation shown in Figure 1. Note that the bias score of the top-ranked item is given the highest weight, followed by the bias score of the second-ranked item , and so on. This follows the intuition that bias in the higher ranked items are likely to influence the user more than bias in the lower ranked items.222In case the bias score of a particular item in the ranked list cannot be inferred, this item can be ignored and the rankings can be re-computed. This is similar to how missing relevance judgements are handled in the Information Retrieval literature [49].
Ranking Bias: The ranking bias is intended to capture the additional bias introduced by the ranking system, over the bias that was already present in the set of relevant items (i.e., relevant to ) input to the ranking system. If possible, ranking bias could be measured by auditing the exact ranking system being deployed by the search engines. However, for any commercial search engine deployed in the real-world, it is infeasible to know the internal details of the ranking system. Hence, we view the ranking system as a “black box” where we only observe the inputs and outputs.
Thus, we define the Ranking Bias for the query as simply the difference between the output bias and the input bias for (as defined earlier).
| (4) |
Time-Averaged Bias: To capture the overall trend in the bias, we collect multiple snapshots of search results, compute the different bias metrics for each snapshot, and then compute the time-averaged values of the aforementioned metrics. For instance we compute the time-averaged output search bias as the average of the (given by Equation 3) values measured at various instants of time. Similarly, we define and as the time-averaged input bias and time-averaged ranking bias for query respectively.
3.2 RQ1b: Measuring the Political Bias of an Individual Twitter Search Result
For applying our search bias quantification framework to Twitter search in our chosen context of US politics, we require an automated method for inferring the political bias of an individual Twitter search result – a tweet. To measure the bias of a tweet, we have two options (i) we can measure the source bias, i.e. the bias of the author of the tweet, or (ii) we can measure the content bias, i.e., the bias of the content of the tweet. Especially, since the content of the tweet is quite short (only 140 characters), attempting to judge the bias from the short content may not always be accurate; therefore, in this paper we choose to use the source bias to measure the political bias of an individual Twitter search result.
In the rest of this section, we start by present our methodology for inferring source bias of a tweet and then evaluate how well it works. Finally, we end with a brief analysis of how well the source bias and content bias match each other in practice in the context of political search queries.
Source Bias - Inferring Political Bias of Twitter Users
It has been reported that people’s political affiliation is correlated with their various attributes.333http://2012election.procon.org/view.resource.php?resourceID=004818 In this work, we leverage this insight to infer political affiliations of users on Twitter based on their interests. Our methodology for inferring the political bias of a given Twitter user is based on the following steps – (i) generating two representative sets of users who are known to have a democratic or republican bias, (ii) inferring the topical interests of , and (iii) examining how closely ’s interests match with the interests of the representative sets of democratic and republican users.
Generating representative sets of democratic and republican users: The first step in our methodology involves getting representative sets of democratic and republican users. One option would be to collect a dataset of users who report their political affiliations on Twitter. However, such a dataset would suffer from self-reportage problem, while also being biased towards the group of users who have self reported. Instead, we use the methodology in [37, 13], which infers the topical attributes of a user by mining the Twitter Lists that other users have included in. Thus, we rely on what other people are reporting about a user, and not what she is identifying herself as. Using this method, we extracted a seed set 865 users who have been labelled with the topic “democrats” and a seed set of 1,348 users labelled with the topic “republicans”. These seed sets of users include politicians (e.g., Steny Hoyer, Matt Blunt), political organizations (e.g., DCCC, Homer Lkprt Tea-party) as well as regular users.
Inferring topical interests of a user: After obtaining the representative sets of democratic and republican users, the next step is to infer a user’s interests on Twitter. To address this challenge, we rely on the methodology in [4], which for a user , returns a list of topics of interest of along with the frequency of each topic. Here the frequency of a topic indicates the number of users whom follows, who have been labelled with this topic using the aforementioned method in [37, 13]. For instance, if a user follows 3 users tagged with “politics” and 4 users tagged with “music”, then the returned list would be {politics: 3, music: 4}. We convert this topic, frequency list into a weighted vector for user , where the -s are computed considering the interest lists of all the users in our dataset. We refer to this vector as the interest-vector of the user . Specifically, if a user follows users on a particular topic, then the corresponding entry in the interest-vector of is computed using and , where is the number of all users in our dataset, and is the number of users who follow at least one user tagged with this topic.
Note that, if we are unable to get the followings of a user (due to her account being protected, or her following no one), or if she follows too few users (less than 10), we are not able to infer her interests and hence political leaning. However, the study [4] showed that this methodology of inferring interests is applicable for a very large fraction of active users in Twitter.
Matching interests of user to interests of democrats and republicans: Using the aforementioned formulation, we also obtain the interest vectors of all the users in the two seed sets. Then, we construct a normalized aggregate interest vector for the democrat seed set () and the republican seed set (), by aggregating the interest vectors of all users in the set and normalizing such that each aggregate vector sums up to 1.0. Some of the top terms in are [progressive, democrats, obama, dems, policy, liberals, p2, activists, dc, international] while those in are [patriots, conservative, tcot, right, gop, republican, tea party, republicans, fox news, pundits], where the terms are ranked in decreasing order of their scores. We observe that apart from terms related to politics, the two vectors also differ in terms of their emphasis on other topics, for example gives higher weight to sports-related terms, while gives higher weight to terms related to technology and entertainment. Thus, these vectors can be used to infer the likely political bias of a wide range of users, even if they are not explicitly following politicians on Twitter, or even if they are following politicians from both parties.
Finally, given a user whose political bias is to be inferred, we obtain the interest-vector of (as described above), and compute the cosine similarity of with and . Then the bias score of user is given by,
| (5) |
We max-min normalize these differences in similarity, such that the bias score of a user lies in the range . A bias score closer to indicates that is more democratic leaning, and a score closer to indicates that is more republican leaning.
Public deployment of the source bias inference methodology: We have publicly deployed the aforementioned source bias inference methodology in the form of a Twitter application, at http://twitter-app.mpi-sws.org/search-political-bias-of-users/. One can login to the application using her Twitter credentials, and see their inferred political affiliation. One can also search for other Twitter users to check out their inferred political leaning.
Evaluation of Political Bias Inference Methodology
To check whether the source bias inference methodology works well for whole spectrum of politically interested users, we carry out the evaluation considering three test sets of Twitter users – (i) politically interested common users, selected randomly from the set of users who have retweeted the two parties’ accounts on Twitter, (ii) the current US senators, for whom it is well known which political party they represent, and (iii) self-identified common users, each having fewer than 1000 followers, who have themselves indicated their political ideology in their Twitter account bios.
We first use the set of politically interested common users to evaluate how good our inferred bias score is. After establishing that our bias score works, we define thresholds on the score to categorize users into three distinct categories – republican, neutral, democratic. Finally we present how well our inference methodology works for the senators and self identified common users.
We evaluate the methodology with respect to two metrics: (i) coverage – for what fraction of Twitter users can the methodology infer the political bias, and (ii) accuracy – for what fraction of users is the inference correct.
Evaluation for politically interested common users
To identify a set of politically interested common users, we followed the methodology given in [23]. We used the Twitter accounts of democratic (@TheDemocrats) and republican (@GOP) parties as seed accounts, and collected up to 100 retweeters of each of the most recent 3,200 tweets posted by the two accounts. Doing so, we collected 98,955 distinct users who retweeted @TheDemocrats and 71,270 distinct users who retweeted @GOP. Out of these users, we randomly selected 100 retweeters each of the democratic and republican account, giving us a test set of 200 common users who are politically interested.
Judging the ground truth bias of test users: To get the bias annotations for political leanings of these 200 users, we conducted an Amazon Mechanical Turk (AMT) survey where human workers were shown a link to a user’s Twitter profile, and asked to label the user as either pro-democratic, pro-republican, or neutral, based on the user’s profile attributes and the tweets posted by the user. We got judgements from 50 distinct AMT workers for each test user. The AMT bias score of each user was computed by adding for each pro-democratic judgement, for each pro-republican judgement and for each neutral judgement, and then normalizing by the total number of judgements. Thus, the AMT bias score for a user lies in the range , where a more positive score indicates a stronger democratic bias (with more AMT workers labelling the user as pro-democratic), whereas a more negative score indicates a stronger republican bias (with more AMT workers labelling the user as pro-republican).
Evaluating our inferred score: Our methodology could infer the bias of all the 200 selected users (coverage = 100%). To quantify the accuracy of the methodology, we check whether our inferred bias scores correlate well with the AMT bias scores.
To verify this, we present Table 2 and Table 3. In Table 2, we bin our inferred bias scores for these test users into three ranges [-1.0, -0.5], (-0.5, 0.5) and [0.5, 1.0], and then we compute the average AMT bias scores for users in each bin. As can be seen from Table 2, the average AMT bias score for Bin 1 (corresponding to users inferred to be strongly republican) is strongly republican leaning (), while the average AMT bias score for Bin 3 (corresponding to users inferred to be strongly democratic) is strongly democratic leaning (). Similar results are seen when we bin the users based on AMT bias scores and then compute the average inferred bias score for the users in each bin (as shown in Table 3), demonstrating that our inferred bias scores are well correlated with the AMT bias scores.
| Inferred bias score bins | Avg. AMT bias score |
|---|---|
| Inferred Bin 1 [-1.0, -0.5] | |
| Inferred Bin 2 (-0.5, 0.5) | 0.14 |
| Inferred Bin 3 [0.5, 1.0] | 0.93 |
| AMT bias score bins | Avg. Inferred bias score |
|---|---|
| AMT Bin 1 [-1.0, -0.5] | |
| AMT Bin 2 (-0.5, 0.5) | |
| AMT Bin 3 [0.5, 1.0] | 0.14 |
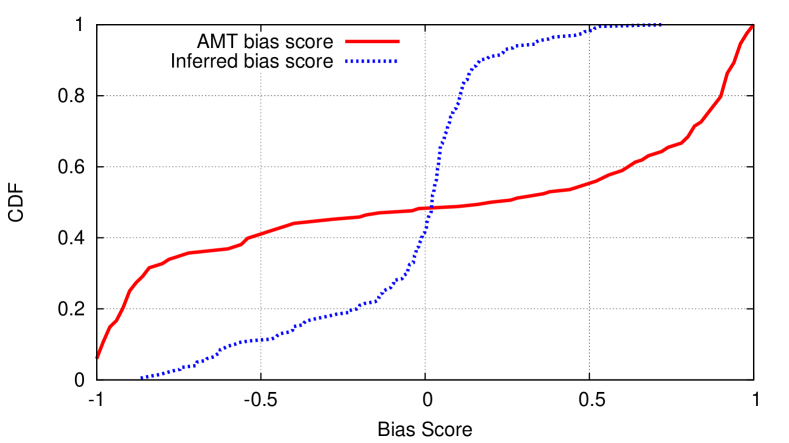
We also observe that, though there is high correlation between the AMT bias scores and our inferred scores, the spread of the distribution of the two scores in the interval are quite different. This difference is shown in Figure 2 which plots the CDF of the two scores. We observe that while many of the AMT bias scores are close to the boundaries of the interval, most of the inferred scores lie within . This difference in the spread of the distributions motivated us to discretize our inferred bias score, and categorize users into three classes – democratic-leaning, republican-leaning, or neutral.
Discretizing the bias score into categories: Having established that our inferred bias score correlates well with the AMT bias score, we now want to categorize users according to their bias. To do so, we take the conservative approach of labelling a user as democratic or republican only when we have high confidence, otherwise to label them as neutral. To achieve this categorisation, we decided to fix a suitable threshold , and label the users with inferred bias score lying within as neutral, the users having inferred bias score in the range as republicans, and the users having inferred bias score in the range as democrats. We experimented with several choices for the threshold = 0.01, 0.03, 0.05, 0.08 and 0.1. For each choice, we computed a confusion matrix of the match between AMT bias scores and the inferred bias scores. For instance, Table 4 depicts the confusion matrix of the match between AMT bias scores and the inferred bias scores for . We found that the threshold of maximizes the sum of the diagonal of the confusion matrix. In the later sections of the paper, we will label users as democrats or republicans, only when their inferred score falls outside of the neutral zone .
Inclusion of a neutral zone has both pros and cons. While now we have higher confidence in our labels of democrats and republicans, some of the users who are marginally democratic or republican may now get labelled as neutral. But we make this conservative choice for our analyses, so as to not overestimate the bias in the search results.
| AMT bias score | Inferred Rep | Inferred Neutral | Inferred Dem |
|---|---|---|---|
| AMT Bin 1 | 84.05% | 13.04% | 2.89% |
| AMT Bin 2 | 18.18% | 45.45% | 36.36% |
| AMT Bin 3 | 3.89% | 12.98% | 83.11% |
| Political Bias | Coverage | Accuracy |
| Current US Senators | ||
| Democratic (n=45) | 97.78% | 86.36% |
| Republican (n=54) | 98.15% | 98.11% |
| Average | 97.96% | 92.23% |
| Self-identified common users | ||
| Democratic (n=426) | 92.01% | 88.52% |
| Republican (n=675) | 90.22% | 82.95% |
| Average | 91.12% | 85.73% |
Evaluation for popular users (US senators)
The performance of the methodology for the 100 current US senators is summarized in Table 5. The methodology has a very high coverage for the US senators, and failed to infer the political bias for only two senators, one from each party. Further investigation showed that one of these senators did not follow anyone on Twitter, while the other followed only one other user; hence, we could not infer their topical interests. In terms of accuracy, our methodology correctly identified the political bias of 98.1% of the Republican senators for whom bias could be inferred, and 86.4% of the Democrat senators whose bias could be inferred.
Evaluation for self-identified common users:
For our final test set, we chose users who have themselves indicated their political ideology in their Twitter account biography. Using the service Followerwonk (http://moz.com/followerwonk), we obtained users located in the United States, with fewer than 1000 followers (to ensure that we get common users), whose bios contained certain keywords matching democrats (“democrat”, “liberal”, “progressive”) and republicans (“republican”, “conservative”, “libertarian”, “tea party”). The bio of each user was then manually inspected, and we retained only those users whose bios actually reflected their political ideology. For instance, users having bios like “I am a #conservative #Christian who is neither a #Democrat nor a #Republican, but an #Independent voter” and “We hate Politicians - Democrats, Republicans, all of them.” were discarded. Finally we obtained 426 self-identified democratic users and 675 self-identified republican users.
The performance of the proposed bias detection methodology on these users with self-identified biases is also indicated in Table 5. The coverage is 91.12% on average, across democratic and republican users. Closer inspection of the users for whom we could not infer the bias revealed that they were either protected accounts, or they followed too few accounts, and as a result their interests could not be inferred.
The interest vectors of correctly inferred self-identified democratic users contain political terms like “liberal”, “progressive”, and “dem”, as well as other terms like “gay”, “lgbt”, “science”, and “tech”. In contrast, those for self-identified republican users contain political terms like “tea”, “gop”, and “palin” along with other related terms like “patriots”, “military”, and “vets”. On the other hand, many of the users for whom we inferred the incorrect leaning either have opposite leaning tags in their interest vectors, or their non-political interests end up matching the interests of the opposite side more than their own. However, the overall accuracy of bias inference for these self-identified common users is also high (85.73% on average across democratic and republican users), as shown in Table 5.
Match between Source Bias & Content Bias
As stated earlier, we use the source bias (i.e., the bias of the user who posted a tweet) to quantify the bias of a tweet, instead of using content bias. In this section, we investigate how closely source bias and content bias of a tweet reflect each other.
Judging the content bias: For each of our selected queries like “democratic debate”, “republican debate”, “hillary clinton” and “donald trump” (more details on query selection in the next section), we considered two Twitter search snapshots – one during the republican debate on December 15, 2015 and another during the democratic debate on December 19, 2015. In each snapshot we collected the first page (20 tweets) of search results, leading to a total of 881 distinct tweets, which we use to analyze the extent to which source bias and content bias match each other.
To get the content bias annotations for these 881 tweets, we conducted an Amazon Mechanical Turk (AMT) survey where human workers were shown each tweet (but not the user who posted it), and they were asked to label the tweet as pro-democratic, pro-republican, or neutral. We got judgements from 10 distinct workers for each tweet. The content bias score of each tweet was computed in the same manner as described in the earlier section titled “Evaluation for politically interested common users”.
| Content Bias | Fraction | Source Bias | ||
|---|---|---|---|---|
| of tweets | Frac | Frac | Frac | |
| Dem | Rep | Neu | ||
| Strongly rep | 13.85% | 74.59% | 10.66% | 14.75% |
| Moderately rep | 22.02% | 55.73% | 13.02% | 31.25% |
| Weakly rep | 10.33% | 22.22% | 22.22% | 55.56% |
| Neutral | 5.68% | 20.41% | 8.16% | 71.43% |
| Weakly dem | 10.44% | 23.33% | 13.33% | 63.33% |
| Moderately dem | 23.16% | 16.5% | 16.0% | 67.5% |
| Strongly dem | 14.53% | 9.76% | 9.76% | 80.49% |
To what extent do source bias and content bias match each other? For studying the match between source bias and content bias, we divide the range of content bias scores into 7 bins, as shown in Table 6, varying from neutral to strongly biased on both sides. The first thing to note from Table 6 is that when the content is strongly biased, the match between the source and content bias is high (about 75% or more), irrespective of whether the content is biased towards the democrat or the republican perspective. This indicates that strongly biased content is mostly produced by the users with the same source bias. On the other hand, when the content is weakly biased, our inferred source bias has little or no correlation with the content bias, since such weakly biased / neutral content is equally likely to be produced by users with either bias.
Next we present the results of applying our bias quantification framework, using the source bias inference methodology, for analyzing political searches on Twitter.
4 RQ2: Characterizing Political Bias in Social Media Search
To characterize the bias in Twitter search results via our framework, we first describe the queries we selected and the data we gathered from Twitter for our chosen context of US presidential primaries. We then analyze the collected data to understand the possible sources of bias in Twitter Search (RQ2a) and the interplay between the input data and the ranking system that produces the output bias – the bias in the search results observed by Twitter users (RQ2b).
The Selection of Search Queries: In order to study search bias via the proposed framework, it would be ideal to have access to the actual search queries that people are using on Twitter to get information about the 2016 US Presidential primary debates. However, as researchers we did not have access to this proprietary dataset. We, therefore, followed the two step methodology used in [20] of first identifying a seed set of queries and then expanding them to satisfy two properties. Our seed set of queries is comprised of the terms “democratic debate”, and “republican debate”, and their shortened versions “dem debate” and “rep debate” that are popular on Twitter to accommodate the short length of tweets.
Next we expanded our query set to include other likely related queries that satisfied two properties: (i) the queries should be used by many users, and (ii) the queries should not be biased to a particular party. To satisfy the first property, we used hashtags to expand our query set, since hashtags are used extensively on Twitter by users to tag and follow discussions about political topics [6]. Moreover, hashtags act as recommended queries on Twitter; when a user clicks on a hashtag, a Twitter search page for that hashtag is presented to her. To identify such hashtags, we collected the Twitter search results for our four seed queries during the November 2015 republican and democratic debates. We then identified the most frequently occurring hashtags containing the term “debate” to ensure that they are related to the presidential debates. We found 57 hashtags related to the democratic debate and 63 related to the republican debate. From these, we selected the top 10 hashtags popular within each political party. This resulted in 15 distinct hashtags.
In addition to being popular, we wanted the queries in our expanded set to be unbiased to avoid over estimating the bias in search results. We, therefore, removed biased search queries (e.g., #debatewithbernie, #hillarycantdebate), and only retained queries for whom its difficult to estimate the political leaning of the poster. This approach resulted in the following queries: democratic debate, dem debate, #democraticdebate, #demdebate, republican debate, rep debate, #republicandebate and #gopdebate. In addition, given that politically interested users (irrespective of their leaning) can search for any candidate by name, we also included the names of the 17 presidential candidates to our set of queries. We use our quantification framework with these 25 queries to measure the bias for political searches on Twitter.
Data Collection: For our analysis, we selected a one week time period that contained both a republican and a democratic debate – December 14 - 21, 2015. The Republican debate aired on December 15, and the Democratic debate aired on December 19. Our goal was to capture a representative collection of tweets from Twitter Search that represented both parties at similar points in time and for a similar event. From this time period, we collected Twitter search results for each of the selected queries.
Twitter search provides different filters on the search results including “top”, “live”, “news”, “photos” and “videos”.444https://twitter.com/search-home The default, “top” results, contain the tweets chosen by the proprietary Twitter ranking system based on many factors, including the number of users that engaged with a tweet555https://support.twitter.com/articles/131209. This filter provides us with the output set for a given search query. To collect the output set, we collected the top 20 search results on the first page for each query at 10-minute intervals for the whole aforementioned time period. The political bias of this set is the Output Bias defined in our quantification framework. In total, across all the selected queries, we collected 28,800 snapshots that included 34,904 distinct tweets made by 17,624 distinct users.
To collect the input data to the ranking algorithm, we used Twitter’s streaming API to collect all of the tweets that contained our selected queries during our data collection period and used this chronologically ordered tweet stream to calculate the Input Bias. Overall, across all the queries, we collected more than 8.2 million tweets posted during this time period, by 1.88 million distinct users which comprise of the input data for our selected queries.
De-Personalizing the Search Results: Our objective is to investigate possible bias created by the ranking of presented tweets. Because bias may be introduced by personalization features associated with the Twitter user issuing the query, we focused on the consistent, non-personalized ranking of results shown to every user to examine bias. To mitigate personalization effects (e.g., geographical personalization based on IP addresses), all search queries were made without logging in to Twitter, and from the same IP subnet.
| Query | Output Bias | Input Bias | Ranking Bias |
|---|---|---|---|
| (TOB) | (TIB) | (TRB) | |
| Queries Related to Democratic Candidates | |||
| Hillary Clinton | 0.21 | 0.03 | 0.18 |
| Bernie Sanders | 0.71 | 0.55 | 0.16 |
| Martin O’Malley | 0.64 | 0.57 | 0.07 |
| Average | |||
| Queries Related to Republican Candidates | |||
| Donald Trump | 0.29 | 0.19 | 0.10 |
| Ted Cruz | |||
| Marco Rubio | |||
| Ben Carson | 0.46 | 0.20 | 0.26 |
| Chris Christie | 0.27 | ||
| Jeb Bush | 0.09 | ||
| Rand Paul | |||
| Carly Fiorina | 0.16 | 0.38 | |
| John Kasich | 0.04 | ||
| Mike Huckabee | 0.30 | 0.12 | 0.18 |
| Rick Santorum | 0.18 | ||
| Lindsey Graham | 0.07 | ||
| George Pataki | 0.09 | ||
| Jim Gilmore | |||
| Average | |||
| Queries related to democratic debate | |||
| democratic debate | 0.43 | 0.38 | 0.05 |
| dem debate | 0.52 | 0.29 | 0.23 |
| #democraticdebate | 0.28 | 0.19 | 0.07 |
| #demdebate | 0.57 | 0.56 | 0.01 |
| Average | 0.45 | 0.35 | |
| Queries related to republican debate | |||
| republican debate | 0.53 | 0.27 | 0.26 |
| rep debate | 0.31 | 0.40 | |
| #republicandebate | 0.39 | 0.34 | 0.05 |
| #gopdebate | 0.04 | 0.10 | |
| Average | 0.32 | 0.28 | |
4.1 RQ2a: Where Does the Bias Come from?
It is Not Always the Ranking System: Input Data Matters
Table 7 shows the three biases (output, input, and ranking) for the selected queries. It reveals that queries related to democratic and republican candidates as well as democratic and republican debates have a democratic-leaning input bias (larger than 0) on average. This observation implies that the full tweet stream containing these query-terms, without any interference from the ranking system, contains a more democratic slant – although, the democratic bias for queries related to the republican debate and candidates is lower than that related to the democratic debate and candidates, on average.
It is important to note that there exists a pre-existing bias in the input data to the ranking system, and that this input bias can have a significant effect on the final output search bias seen by the end user. In the case of Bernie Sanders, for example, the output search bias is very democratic (); only a small fraction of this bias comes from the Twitter ranking system, while the majority originates from the input data, indicating that most of the Twitter population that discusses Bernie Sanders on Twitter has a democratic leaning. The effect of input data on the search results’ bias highlights the importance of incorporating the input data when auditing algorithms, and teasing out how much of the bias is present in the data itself and how much is contributed by the algorithmic system.
The democratic leaning input bias on Twitter for a large majority of the queries can be explained by the bias of overall Twitter corpus. We measure the bias of the Twitter corpus in two ways: (i) User population bias: The bias of 1000 Twitter users selected randomly from the Twitter userid space (i.e., the user-ids were randomly selected from the range of 1 through the id assigned to a newly created account in December 2015), and (ii) Full tweet stream bias: The bias of 1000 tweets selected randomly from Twitter’s 1% random sample for December 2015. For measuring the corpus bias in both cases, we applied the same methodology as used for measuring the input bias, i.e., measuring the bias of the users and the source bias of the tweets. These two approaches resulted in a population bias of and a full tweet stream bias of . These positive bias values show that the population of Twitter users is democratic-leaning, and this bias is even more democratic-leaning when we consider the active users whose tweets have been included in the full tweet stream (measured using Twitter’s 1% random sample). These findings are in-line with prior studies [32] which have shown that Twitter has a high fraction of democratic leaning users.
It is important to note that, though the Twitter corpus has a democratic-leaning bias, the input bias (TIB) of the different queries varies across the spectrum (as shown in Table 7). This variation is because each query acts as a filter to extract a subset of Twitter users whose tweets are relevant to that queries, and the sets of users filtered out by different queries have differing biases. Therefore, athough the corpus bias of Twitter is uniform, the specific query being considered determines the input data set and hence the input bias, which in turn affects the final output bias observed by the user.
The Power of the Ranking System
The ranking biases in Table 7 show that while data has a major role in the search results’ bias, the ranking system still plays a significant role by shifting the bias or even changing its polarity. Comparing the output bias and the input bias for the democratic and republican candidate queries reveals an interesting discovery—on average, the ranking system shifts the bias of each category towards that party’s leaning. For democratic candidate queries, on average, the ranking system enhanced the democratic bias of the input by , making the output results more democratic (. On the other hand, for queries related to republican candidates, on average, the ranking system increased the republican bias of the input by —to the point that it changed the polarity of the output bias making the final results republican (), even though the average input bias had a democratic leaning.
This change of polarity of bias via the ranking system is more noticeable for some republican candidates. For instance, for Chris Christie, Jeb Bush and Lindsey Graham, while the input bias was positive, indicating that more democratic leaning users tweeted about them, the ranking system switched the leaning of the output results to republican. These shifts in the bias caused by the ranking system (that can also result in a polarity change), exhibit the ranking systems power in altering the inherent bias of the input data.
| TRB of Ranking Strategies | |||
| Query | Twitter’s | Most | Most |
| Ranking | Retweeted | Favorited | |
| First | First | ||
| Queries Related to Democratic Candidates | |||
| Hillary Clinton | 0.18 | 0.33 | 0.25 |
| Bernie Sanders | 0.16 | 0.22 | 0.16 |
| Martin O’Malley | 0.07 | 0.001 | 0.1 |
| Queries Related to Republican Candidates | |||
| Donald Trump | 0.10 | 0.06 | 0.09 |
| Ted Cruz | |||
| Marco Rubio | |||
| Ben Carson | 0.26 | 0.23 | 0.25 |
| Chris Christie | |||
| Jeb Bush | |||
| Rand Paul | |||
| Carly Fiorina | |||
| John Kasich | 0.04 | 0.04 | 0.11 |
| Mike Huckabee | 0.18 | 0.11 | 0.19 |
| Rick Santorum | |||
| Lindsey Graham | |||
| George Pataki | |||
| Jim Gilmore | |||
| Queries related to democratic debate | |||
| democratic debate | 0.05 | 0.21 | 0.12 |
| dem debate | 0.23 | 0.22 | 0.22 |
| #democraticdebate | 0.07 | 0.08 | 0.14 |
| #demdebate | 0.01 | 0.01 | |
| Queries related to republican debate | |||
| republican debate | 0.26 | 0.274 | 0.268 |
| rep debate | |||
| #republicandebate | 0.05 | 0.08 | 0.17 |
| #gopdebate | |||
The ranking of posts in social media search systems is influenced by a number of factors, including the content’s popularity (e.g., number of retweets or favorites), the author’s popularity (e.g., number of followers or lists), as well as the recency of the post. To gain some insight into the extent to which different factors contribute to the overall observed bias, we construct rankings “solely” based on individual factors and examine the bias of these rankings. Table 8 shows the time averaged ranking bias of Twitter’s ranking, as well as, the bias for two ranking strategies, each based on a single measure of posts’ popularity, namely the number of retweets and the number of favorites, respectively.
Table 8 shows that the ranking biases of the three strategies are quite similar to each other, indicating that popularity of the post can explain much of the observed bias in Twitter’s ranking. For instance, for Chris Christie, Jeb Bush and Lindsey Graham, even though most of the users tweeting about them are democratic leaning (as shown by positive values in Table 7), most of the popular tweets about them are made by republican leaning users (as shown by the negative values for popularity based ranking strategies in Table 8). However, in some cases like Martin O’Malley, John Kasich, democratic debate and #republicandebate, the difference in the values between Twitter’s ranking and the popularity based rankings indicate that, while popularity of posts is a factor that could explain a large part of the observed bias in Twitter search results, there are probably other factors that contribute to the overall bias of the search results. Note that the above experiment is just a first step towards unpacking the influence of the different factors on the overall bias of search results in a social media like Twitter, and we defer a more in-depth analysis for the future.
4.2 RQ2b: The Collective Contribution of the Input Data and the Ranking System
Given the impact of the input data and the influence of the ranking system on the bias of Twitter search results, we were curious to explore the dynamics between the input data and the ranking system when producing the output bias. While Table 7 shows a variance of output biases across the queries as a result of the interplay between the two, we particularly looked for the cases where the resulting output bias could affect a user’s search experience noticeably. Below, we describe two of these cases by first analyzing the output bias and then exploring the input data’s and the ranking system’s contribution to the resulting output bias for each of these cases.
The Case of Popular Candidates
Examining the Output Bias: Comparing the output bias of the candidates in Table 7, we found a noticeable trend in the output bias of popular candidates compared to the rest of the candidates with the same political leaning – the search results for the more popular candidates have a higher bias towards the opposing perspective.666The popularity of a candidate is estimated from the polling data obtained from [34] for December 2015. For instance, the top search results for Hillary Clinton, the most popular democratic candidate during this time, contained fewer democratic results () than the search results for other democratic candidates. Similarly, the search results for the query Donald Trump, the most popular republican candidate during this time, contained fewer republican results () when compared to the search results of other republican candidates. Therefore, if a user searches for popular candidate names in Twitter search, the top results have much higher bias toward the opposing perspective, while this is not as extreme for the less popular candidates.
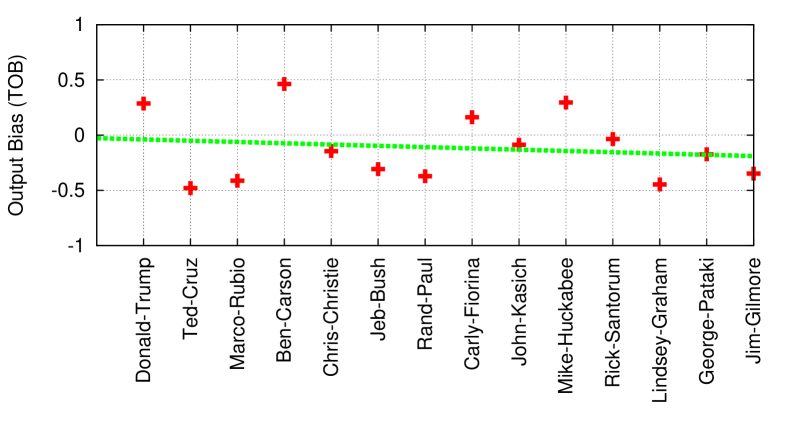
In Figure 3, we plotted the output bias for the search results of republican candidates ranked by their popularity to examine if there is a correlation between the popularity of a candidate and his output bias.777We did not perform this test for democratic candidates because there were only three of them. The negative slope of the line of best fit in Figure 3 supports the observation that the more popular a candidate is, the more is the opposing perspective reflected in his or her top search results.
This situation may be undesirable for popular candidates, especially if users from the opposite perspective are more likely to speak negatively about the candidate. We illustrate this case using Table 9, which shows tweets randomly sampled from the set of tweets posted by users with an opposing polarity when compared to the candidate. These tweets were included in the top search results for the queries Hillary Clinton and Donald Trump, and they all either criticize or attempt to ridicule the candidates. If an unbiased and potentially undecided voter searches for information about a popular presidential candidate, she would very likely see negative tweets posted by users of opposing leaning about the candidate. Similar to the findings of[9], this situation can be undesirable for the candidates as these negative tweets may impact the perceptions of these undecided voters.
| Randomly selected tweets from “Hillary Clinton” search results, which are posted by a republican leaning user | Randomly selected tweets from “Donald Trump” search results, which are posted by a democratic leaning user |
|---|---|
| WT: Watchdog wants federal ethics probe of Clinton, possible improprieties http://bit.ly/1NvlrPA | Williamsburg, #Brooklyn Dec 15 #trump2016 #MussoliniGrumpycat #MakeAmericaHateAgain #DonaldTrump @realDonaldTrump pic.twitter.com/Hj6DC7M7V1 |
| The Clintons both Bill and Hillary have a very long history of framing others while they commit the Crimes. History has destroyed the proof | Scotland defeats Trump on clean energy. Hopefully hell have a lot of time for golfing soon [url] |
| @CarlyFiorina: @realDonaldTrump is a big Christmas gift wrapped up under the tree for @HillaryClinton. [url] | Dirty little secret: Donald Trump is not a good debater. |
| @CNN @HillaryClinton @BernieSanders hell no shes a murderer pic.twitter.com/zGQwR7dLZj | http://MLive.com - Where Donald Trumps Michigan campaign donations come from http://ow.ly/39hCWt |
| I dont care if youre a Democrat or Republican, how can you trust a word Hillary Clinton says and how can you consider voting for her?? | Enjoy the sweet music of Donald Trump in Carol of the Trumps [url] |
The Contribution of Different Sources of Bias: Given the differing output bias trend for popular candidates compared to other candidates and the potential side effects, we explored if this differential output bias is inherent in the input tweets made by Twitter users or if it results from the ranking algorithm. To understand this, we compared the input and output bias for the queries Hillary Clinton and Donald Trump. We found that the input bias for these queries leaned towards the opposite political view (similar to what we found in the output bias), indicating that the twitter users who talk about popular candidates are likely from the opposite political leaning than users who talk about the less popular candidates.
However, the manner in which the ranking system altered the input to produce the output and accordingly its bias was different for the two most popular candidates. While Hillary Clinton is discussed by republican users more than the other democratic candidates (), the ranking system mitigated this undesirable situation by increasing the democratic output bias of the search results by a factor of seven as compared to the input bias. That is, the ranking system directed the search results for Hillary Clinton towards the perspective of her own party. For Donald Trump the situation is the opposite. More democratic leaning users tweet about him () than the other republican candidates, and the ranking system enhanced this input bias resulting in more democratic tweets in the output search results. So, while the ranking system mitigated the opposite bias in the search results for Hillary Clinton, it enhanced it for Donald Trump.
This means that if a user searches for most popular candidates from each political party, the results favor Hillary Clinton over Donald Trump, while this was not the case in the input data. These opposing dynamics between the input data and the ranking system, while inadvertent, can have serious implications, especially for the candidate for whom the ranking system enhanced the view points of the opposite leaning users.
Different Phrasings of Similar Queries
Examining the Output Bias: Different users who seek information about a certain topic might phrase their queries differently; e.g., for the event republican debate, the queries could be republican debate, rep debate, #republicandebate or #gopdebate. While these differently phrased queries refer to the exact same event, the search results might differ substantially, particularly in the situation when users of different leanings selectively use different keywords and hashtags in their tweets to refer to the same event. This difference in search results for slightly differently phrased queries is common in many search engines, but whether the results for these similar queries exhibit different political biases is an open question.
To answer this question, in Table 7, we compare the output biases of similarly phrased queries referring to the same event. We found that the output bias of two similar search queries for the same event can differ noticeably. For example, the output results for the query republican debate have approximately twice the democratic leaning bias () as compared to the the output bias of the query rep debate (). Similar noticeable differences also exist in the output bias for the queries related to the event democratic debate (e.g., democratic debate vs #democraticdebate).
The Contribution of Different Sources of Bias: To understand the sources of these differences between the output bias of similarly phrased queries, we compared the contributions of the input data and the ranking system to their output bias. As seen in Table 7, the input data contributes more to the output bias for similarly phrased queries. In a few cases, however, the ranking system affects the input data noticeably, leading to two similarly phrased queries with similar input biases to have search results with very different output biases. For example, comparison of the biases of the queries republican debate () and rep debate () reveals that while the input bias for these queries is similar, the ranking system altered their bias in opposing directions. That is, while the ranking system increased the bias of the republican debate query by making it more democratic, it decreased the bias of the rep debate query by , making it more republican. Even when the input bias of these two queries was similar, the ranking system made one query significantly more democratic than the other. This example illustrates the influence a search system exerts on the input data, by curating search results with different biases for two similar queries with similar input biases.
These examples illustrate the interplay between the input data and the ranking system which produces different output biases for similarly phrased queries and for queries on popular political candidate. These observations lead to new questions for search engine design: How do these complex interactions between the input data and the ranking system affect the users’ search experience and how can we make users aware of these effects? In the next section, we briefly discuss solutions for signaling bias in search results to the users.
5 Discussion
5.1 Generalizability of the Bias Quantification Framework
Extending to other search engines: Our proposed framework can be applied to other search engines (e.g., web search engines, other social media search engines) to quantify the bias in the search results even if the search algorithm hides within a black box and the internal details of the retrieval and ranking algorithms are not known (which is almost always the case for real-world proprietary search engines). The only pre-requisite for applying the framework is that a methodology for measuring the bias of individual data items (e.g., web-pages, tweets) is available.
Our bias quantification framework (shown in Figure 1) works well for social media search, where it is possible to separate the contributions of the input data and the ranking algorithm to the final output bias. However, in many modern-day IR systems, data items in the corpus are directly ranked based on their relevance to the query, without generating any intermediate set of relevant items. In such systems, it is hard to disentangle the bias introduced by the input data from the bias added by the ranking process. But, we can still compare the relative biases of different ranking systems, under the assumption that both operate upon similar data corpora. For instance, the ranking algorithms of Bing and Google search could be compared with each other by observing their output biases for the same set of queries.
Extending to multiple perspectives scenario: Even though we have applied our quantification framework for a two-perspective scenario of US politics, our framework can be extended to multiple perspectives by having a bias vector for each item, rather than a scalar score as we have now. For instance, if the search scenario under consideration has different perspectives associated with each query (such as queries related to a political election contested by political parties), then each data item (e.g., a tweet) can be represented as a -dimensional bias vector. Formally, the bias vector for the -th data item would be given by = [, ,…, ], where gives a measure of how biased the -th data item is along the -th perspective, with values in the range of . A value of indicates that the item supports the -th perspective, indicates that the item opposes the perspective, whereas indicates that the item is neutral with respect to that perspective. Then Equations 2 to 5 can be converted to their vector addition formulations, to measure the input, output and ranking biases. A challenging aspect of extending to a -dimensional scenario would be to develop a methodology to capture these bias vectors, and it would be interesting to explore this in the future.
5.2 Signaling Political Bias in Search Results
While our analyses show that social media search results have varying amounts of political bias, how this bias can be tackled is still an open question. In this section, we briefly discuss some potential solutions to this question, but their in-depth exploration is left for future work.
Incorporating Bias into the Ranking System: One solution for controlling bias could be to develop a ranking mechanism that considers bias as a metric and trades-off relevance and bias of the search results. For instance, a minimal value of average bias of the search results could be achieved by interleaving results from the various perspectives of a search query, using methods similar to those proposed to inject diversity in search results [50, 46]. However, finding a suitable equilibrium between bias and other ranking factors is challenging, specially because the trade-off point is likely to be domain and user specific. Additionally, including bias as a factor in the ranking systems might lead to a degradation of the top search results along relevancy, popularity, recency, or other metrics.
Making bias transparent: Given the aforementioned problems with changing the ranking of the search results, an alternative method of addressing the bias can be to incorporate the bias into the front-end of the search engine (by visualizing the bias of search result), rather than into the ranking algorithm itself. Through this method, while the search algorithm’s efficiency is not compromised, users can be made aware of the possible biases in their search results by marking each search result with its political bias. Such a nudging practice has been used widely in the literature for purposes like delivering multiple aspects of news in social media [31] and encouraging reading of diverse political opinions [29, 28].
A hybrid approach of the above two methods could also be proposed, which not only shows the bias of each search result, but also separates the results of the two political perspectives (republican and democratic) and shows them as distinct ranked lists, with each distinct list retaining the ranking of the results in the original ranked list. By preserving the original search engine’s ranking within each list, this methodology ensures that the quality of the top search results does not degrade across other metrics such as relevance, popularity, and recency.
Developing tools to signal political bias in search results, and conducting user studies to understand how users interact with such alternative search interface designs are important, and are left for future work.
5.3 Auditing Black Boxes
Recently, the rise of algorithmic platforms’ influence on users’ online experience has motivated many studies to audit these platforms and understand their biases. While some of these algorithmic systems’ functionalities are open to the public, making the auditing process easier, most of them are not. The walls of intellectual proprietary, high complexity of these algorithms and the perils of gaming a system via malicious users put these algorithms in a black box, making it almost infeasible to have access to an algorithm’s specifications from outside, like in our study. While we know about a few general factors that a search engines takes into account in curating the search results (such as relevancy, popularity, and recency), there are hundreds of other features that are hidden in a blackbox, preventing us as researchers from being able to pin-point the exact feature(s) of the algorithm which might be leading to the bias being introduced in the search results.
Therefore, building on previous studies that have adopted this “black box” view for an algorithmic system while auditing it [10, 21, 16, 15, 5], we characterized the bias of the ranking algorithm in Twitter’s search platform, without knowing its internals. Our proposed auditing framework can help users, system designers and researchers to become aware of possible biases of a search process, while they might not be aware of the details of the process itself. For users, this awareness can result in more intelligent use of a system, knowing that their search results can be far from neutral in some cases. For system designers, such auditing platforms can be used to investigate the algorithm’s specifications, particularly when the bias has been introduced by the algorithm and not the system input. And finally, researchers and watchdog organizations can actively utilize such auditing platforms to measure bias and compare it among different search platforms, making the research community and the system designers aware of potentially misleading biases.
5.4 Distinguishing the Sources of Bias: From Development to Design
Our study has proposed a first step towards distinguishing the different sources of bias in a search engine. The observation that a significant part of the bias comes from the input data in some cases (without the interference of the ranking system) highlights the need to add data-driven perspective to algorithm audit studies, such that not only the output data is observed to understand the algorithm’s discriminatory or biased behavior, but also the potential biases in the input data are investigated.
Although a part of the output bias stems from the input data, our study revealed that an algorithm can influence the inherent bias of the input data significantly, to the extent of even changing its polarity. This algorithmic power is of great importance particularly when a design choice in the interface gives higher visibility to the algorithm’s results than the input data. Twitter search, for example, provides users with “top” and “live” search results, where the former is the ranked list of tweets output by the search system and the latter is simply all the tweets containing the search query in reverse chronological order, i.e. the input data. This means that a user looking for information about a topic is able to see both the input data (which might be more representative of the full Twitter data) and the output data in Twitter search if she wants. However, to give people more relevant results in a shorter amount of time, Twitter has made the top results (the ranking systems’s output) the default option rather than the live results (the input data). This design choice, while legitimate, gives the ranked results more visibility, making the output bias and accordingly the ranking system’s influence more highlighted than the input bias in the design. These design choices, along with the significant effect of ranking system on the final output search bias, suggest a new avenue of research for studying when and how the influence of the ranking system (particularly when it is more visible in the design), might result in showing a totally different side of a story to a user than what the input data would show to her.
6 Limitations
In this study, we focussed on a limited set of queries that were either related to a political event or a political candidate, due to the limitation on the number of queries we could submit via Twitter API. Given the variation of bias over different queries, we believe extending our query set to more general political queries on controversial topics such as gun control and abortion would strengthen our analysis, and we hope to pursue this in the future. Another limiting factor in our study was using the simplifying assumption of considering a user as either neutral, pro-democratic or pro-republican. Under this assumption we can not have a user who is partially both pro-republican and pro-democrat. However, we should clarify that for doing this classification, we still considered two scores for each user, one the similarity to republicans and the other similarity to democrats. Currently to give the user a final leaning, we consider the difference of these similarities. However, in the future, we can use these two similarities to determine the extent to which a user is pro-democratic as well as pro-republican to have a more nuanced view of political leanings of users. And lastly, while we have discussed some potential solutions for signaling political bias in search results, we have not as yet implemented our proposed solutions and evaluated the effect of this signaling on the users’ search experience. This exploration would be a good follow up of our current study.
7 Conclusion
To our knowledge, the present study developed the first framework to quantify bias of ranked results in a search process, while being able to distinguish between different sources of bias. Via this ability, our framework not only measures the bias in the output ranked list of search results, but is also able to capture how much of this bias is due to the biased set of input data to the ranking system and how much is contributed by the ranking system itself. In the earlier search engine bias studies, these two factors have not been separated out. Our analyses revealed the significant effect of both input data and the ranking algorithm in producing considerable bias in Twitter search results based on various factors such as the topic of a query or how the query is phrased.
As more and more users are relying on social media search to follow live events and news on personalities [41], the varying biases in search results can have significant impact on the impression that users form about the different events and personalities [30, 9]. We end by calling for mechanisms to make users more aware of the potential biases in search results, e.g., by presenting the results in a way that makes the different perspectives transparent to the user. Giving the users more control over the bias beyond just making them more aware of its existence could be a potential next step. For example, users could be given controls or filters to re-rank the search results to adjust for search biases – just as they can in ranking of products and services on sites like Amazon or Yelp.
References
- [1]
- [2] Lada A. Adamic and Natalie Glance. 2005. The Political Blogosphere and the 2004 U.S. Election: Divided They Blog. In Proc. LinkKDD.
- [3] Solon Barocas and Andrew D Selbst. 2014. Big data’s disparate impact. Available at SSRN 2477899 (2014).
- [4] Parantapa Bhattacharya, Muhammad Bilal Zafar, Niloy Ganguly, Saptarshi Ghosh, and Krishna P. Gummadi. 2014. Inferring User Interests in the Twitter Social Network. In Proc. ACM RecSys.
- [5] Le Chen, Alan Mislove, and Christo Wilson. 2015. Peeking beneath the hood of uber. In In Proc. of the 2015 ACM Conference on Internet Measurement Conference. ACM, 495–508.
- [6] M. Conover, B. Gonçalves, J. Ratkiewicz, A. Flammini, and F. Menczer. 2011a. Predicting the Political Alignment of Twitter Users. In Proc. IEEE SocialCom.
- [7] M. Conover, J. Ratkiewicz, Matthew Francisco, B Gonçalves, F. Menczer, and A. Flammini. 2011b. Political Polarization on Twitter. In Proc. AAAI ICWSM.
- [8] Amit Datta, Michael Carl Tschantz, and Anupam Datta. 2014. Automated Experiments on Ad Privacy Settings: A Tale of Opacity, Choice, and Discrimination. Choice, and Discrimination. arXiv. org (2014).
- [9] Robert Epstein and Ronald E. Robertson. 2015. The search engine manipulation effect (SEME) and its possible impact on the outcomes of elections. Proc. of the National Academy of Sciences (PNAS) 112, 33 (2015), E4512–E4521.
- [10] Motahhare Eslami, Aimee Rickman, Kristen Vaccaro, Amirhossein Aleyasen, Andy Vuong, Karrie Karahalios, Kevin Hamilton, and Christian Sandvig. 2015. I always assumed that I wasn’t really that close to [her]: Reasoning about Invisible Algorithms in News Feeds. In In Proc. of the 33rd Annual ACM Conference on Human Factors in Computing Systems. ACM, 153–162.
- [11] USA Executive Office of the President. 2016. Big Data: A Report on Algorithmic Systems, Opportunity,and Civil Rights. http://tinyurl.com/Big-Data-White-House. (2016).
- [12] S. Fortunato, A. Flammini, F. Menczer, and A. Vespignani. 2006. Topical interests and the mitigation of search engine bias. Proc. of the National Academy of Sciences (PNAS) 103, 34 (2006), 12684–12689.
- [13] Saptarshi Ghosh, Naveen Sharma, Fabricio Benevenuto, Niloy Ganguly, and Krishna Gummadi. 2012. Cognos: Crowdsourcing Search for Topic Experts in Microblogs. In Proc. ACM SIGIR.
- [14] Jennifer Golbeck and Derek Hansen. 2011. Computing Political Preference Among Twitter Followers. In ACM SIGCHI.
- [15] Aniko Hannak, Piotr Sapiezynski, Arash Molavi Kakhki, Balachander Krishnamurthy, David Lazer, Alan Mislove, and Christo Wilson. 2013. Measuring Personalization of Web Search. In Proc. WWW.
- [16] Aniko Hannak, Gary Soeller, David Lazer, Alan Mislove, and Christo Wilson. 2014. Measuring price discrimination and steering on e-commerce web sites. In In Proc. of the 2014 conference on internet measurement conference. ACM, 305–318.
- [17] Alex Hern. 2015. Flickr faces complaints over ‘offensive’ auto-tagging for photos. http://tinyurl.com/Flickr-AutoTagging. (2015).
- [18] Itai Himelboim, Stephen McCreery, and Marc Smith. 2013. Birds of a feather tweet together: Integrating network and content analyses to examine cross-ideology exposure on Twitter. Journal of Computer-Mediated Communication 18, 2 (2013), 40–60.
- [19] Chloe Kliman-Silver, Aniko Hannak, David Lazer, Christo Wilson, and Alan Mislove. 2015. Location, Location, Location: The Impact of Geolocation on Web Search Personalization. In Proc. ACM IMC.
- [20] Danai Koutra, Paul N. Bennett, and Eric Horvitz. 2015. Events and Controversies: Influences of a Shocking News Event on Information Seeking. In Proc. WWW.
- [21] Q Vera Liao, Wai-Tat Fu, and Markus Strohmaier. 2016. # Snowden: Understanding Biases Introduced by Behavioral Differences of Opinion Groups on Social Media. In In Proc. of the 2016 CHI Conference on Human Factors in Computing Systems. ACM, 3352–3363.
- [22] Joseph Lichterman. 2010. New Pew data: More Americans are getting news on Facebook and Twitter. (2010). http://tinyurl.com/News-on-Social-Media.
- [23] Zhe Liu and Ingmar Weber. 2014. Is Twitter a public sphere for online conflicts? A cross-ideological and cross-hierarchical look. In International Conference on Social Informatics. Springer, 336–347.
- [24] Aibek Makazhanov and Davood Rafiei. 2013. Predicting Political Preference of Twitter Users. In Proc. ASONAM.
- [25] Christopher D. Manning, Prabhakar Raghavan, and Hinrich Schutze. 2008. Introduction to Information Retrieval. Cambridge University Press.
- [26] Amy Mitchell and Dana Page. 2015. The Evolving Role of News on Twitter and Facebook. Pew Research Center (2015).
- [27] Abbe Mowshowitz and Akira Kawaguchi. 2005. Measuring search engine bias. Information Processing and Management 41, 5 (2005), 1193–1205.
- [28] Sean A Munson, Stephanie Y Lee, and Paul Resnick. 2013. Encouraging Reading of Diverse Political Viewpoints with a Browser Widget.. In ICWSM.
- [29] Sean A Munson and Paul Resnick. 2010. Presenting diverse political opinions: how and how much. In In Proc. of the SIGCHI conference on human factors in computing systems. ACM, 1457–1466.
- [30] Bing Pan, Helene Hembrooke, Thorsten Joachims, Lori Lorigo, Geri Gay, and Laura Granka. 2007. In Google We Trust: Users’ Decisions on Rank, Position, and Relevance. Journal of Computer-Mediated Communication 12 (2007), 801–823. Issue 3.
- [31] Souneil Park, Seungwoo Kang, Sangyoung Chung, and Junehwa Song. 2009. NewsCube: delivering multiple aspects of news to mitigate media bias. In Proc. ACM CHI.
- [32] Pew Research 2013. Twitter Reaction to Events Often at Odds with Overall Public Opinion. http://www.pewresearch.org/2013/03/04/twitter-reaction-to-events-often-at-odds-with-overall-public-opinion/. (2013).
- [33] Matthew Purver and Sylwester Karolina. 2015. Twitter Language Use Reflects Psychological Differences between Democrats and Republicans. PLoS ONE 10, 9 (2015), e0137422.
- [34] Real Clear Politics 2015. RealClearPolitics – Election 2016 – 2016 Republican Presidential Nomination. http://tinyurl.com/us-republican-polling-data. (2015).
- [35] Christian Sandvig, Kevin Hamilton, Karrie Karahalios, and Cedric Langbort. 2014. Auditing algorithms: Research methods for detecting discrimination on internet platforms. Data and Discrimination: Converting Critical Concerns into Productive Inquiry (2014).
- [36] Bryan C Semaan, Scott P Robertson, Sara Douglas, and Misa Maruyama. 2014. Social media supporting political deliberation across multiple public spheres: towards depolarization. In In Proc. of the 17th ACM conference on Computer supported cooperative work & social computing. ACM, 1409–1421.
- [37] Naveen Sharma, Saptarshi Ghosh, Fabricio Benevenuto, Niloy Ganguly, and Krishna Gummadi. 2012. Inferring Who-is-Who in the Twitter Social Network. In Proc. ACM WOSN.
- [38] Laura M Smith, Linhong Zhu, Kristina Lerman, and Zornitsa Kozareva. 2013. The role of social media in the discussion of controversial topics. In Social Computing (SocialCom), 2013 International Conference on. IEEE, 236–243.
- [39] Latanya Sweeney. 2013. Discrimination in online ad delivery. Queue 11, 3 (2013), 10.
- [40] Herman Tavani. 2014. Search Engines and Ethics. In The Stanford Encyclopedia of Philosophy (spring 2014 ed.), Edward N. Zalta (Ed.).
- [41] Jaime Teevan, Daniel Ramage, and Merredith Ringel Morris. 2011. #TwitterSearch: a comparison of microblog search and web search. In Proc. ACM WSDM.
- [42] Elizabeth Van Couvering. 2010. Search engine bias: the structuration of traffic on the World-Wide Web. Ph.D. Dissertation. The London School of Economics and Political Science.
- [43] Liwen Vaughan and Mike Thelwall. 2004. Search Engine Coverage Bias: Evidence and Possible Causes. Information Processing and Management 40, 4 (May 2004), 693–707.
- [44] Ingmar Weber, Venkata Rama Kiran Garimella, and Erik Borra. 2012. Mining Web Query Logs to Analyze Political Issues. In Proc. ACM WebSci.
- [45] Ingmar Weber, Venkata Rama Kiran Garimella, and Asmelash Teka. 2013. Political hashtag trends. In European Conference on Information Retrieval. Springer, 857–860.
- [46] Michael J. Welch, Junghoo Cho, and Christopher Olston. 2011. Search Result Diversity for Informational Queries. In Proc. WWW.
- [47] Tae Yano, Philip Resnik, and Noah A. Smith. 2010. Shedding (a Thousand Points of) Light on Biased Language. In Proc NAACL HLT Workshop on Creating Speech and Language Data with Amazon’s Mechanical Turk (CSLDAMT).
- [48] Sarita Yardi and Danah Boyd. 2010. Dynamic debates: An analysis of group polarization over time on twitter. Bulletin of Science, Technology & Society 30, 5 (2010), 316–327.
- [49] Emine Yilmaz and Javed A. Aslam. 2006. Estimating Average Precision with Incomplete and Imperfect Judgments. In Proc. ACM CIKM.
- [50] Elad Yom-Tov, Susan Dumais, and Qi Guo. 2013. Promoting Civil Discourse Through Search Engine Diversity. Social Science Computer Review 32 (2013), 145–154. Issue 2.
- [51] Muhammad Bilal Zafar, Krishna P. Gummadi, and Cristian Danescu-Niculescu-Mizil. 2016. Message Impartiality in Social Media Discussions. In Proc. AAAI ICWSM.
- [52] Daniel Xiaodan Zhou, Paul Resnick, and Qiaozhu Mei. 2011. Classifying the Political Leaning of News Articles and Users from User Votes. In Proc. AAAI ICWSM.