Cubic lead perovskite PbMoO3 with anomalous metallic behavior
Abstract
A previously unreported Pb-based perovskite PbMoO3 is obtained by high-pressure and high-temperature synthesis. This material crystallizes in the cubic structure at room temperature, making it distinct from typical Pb-based perovskite oxides with a structural distortion. PbMoO3 exhibits a metallic behavior down to 0.1 K with an unusual -sub linear dependence of the electrical resistivity. Moreover, a large specific heat is observed at low temperatures accompanied by a peak in around 10 K, in marked contrast to the isostructural metallic system SrMoO3. These transport and thermal properties for PbMoO3, taking into account anomalously large Pb atomic displacements detected through diffraction experiments, are attributed to a low-energy vibrational mode, associated with incoherent off-centering of lone pair Pb2+ cations. We discuss the unusual behavior of the electrical resistivity in terms of a polaron-like conduction, mediated by the strong coupling between conduction electrons and optical phonons of the local low-energy vibrational mode.
pacs:
72.15.-v, 72.80.Ga, 75.40.Cx, 61.05.cfI Introduction
Insulating oxides with a stereochemically active lone pair of Pb2+ and Bi3+ cations have been the subject of long-standing interest due to large remnant polarization and high temperature structural/electronic transitions, as found in Pb(Zr,Ti)O3 with a coherent displacement of Zr/Ti atoms Setter and Cross (1993); Jaffe et al. (1971). A surge of interest in multiferroics over the last decade has led to numerous studies of BiFeO3 Wang et al. (2003) targeting applications in ferroelectric non-volatile memory devices with high working temperature. More recently, there has been a growing attention in ferroelectric-like structural distortion or transition in metallic compounds Anderson and Blount (1965); Sergienko et al. (2004); Sakai et al. (2016); Kozii and Fu (2015); Shi et al. (2013). This is because unprecedented behaviors can appear distinct from conventional metals, such as an enhanced thermoelectric property in (Mo,Nb)Te2 Sakai et al. (2016) and possible odd-parity superconductivity proposed in Cd2Re2O7 and doped SrTiO3 heterostructures Kozii and Fu (2015).
The concept of introducing polar distortion in a metallic phase has been recently demonstrated in a material of the LiNbO3-structure type, LiOsO3 Shi et al. (2013). It is discussed that large thermal vibration or incoherent disorder of Li and O ions allows cooperative order upon cooling. A ferroelectric-type structural phase transition occurs at K, where the metallic conduction associated with Os half-filled states is retained across . In this context, compounds with stereochemically active lone-pair electrons can be considered as an alternative path for designing ferroelectric-like metal or a new class of metal, since the lone pair electrons may promote a certain structural distortion Sidgwick (1927); Shimoni-Livny et al. (1998). However, the research seeking for novel properties from metallic materials with Pb2+ or Bi3+ cations is rather limited Kimber et al. (2009); Cheng et al. (2009); Goodenough and Zhou (2015).
In this paper, we report the synthesis of a Pb-based perovskite PbMoO3 crystalizing in the cubic structure, despite the presence of Pb2+ cations. While this material shows an orthorhombic distortion with coherent octahedral tiltings at low temperature, it retains a metallic behavior down to 0.1 K. We found an unusual temperature dependence of the electrical resistivity and a large specific heat accompanied by a peak in . These unusual behaviors are likely originated from a low-energy vibrational mode induced by the incoherent off-centering of lone pair Pb2+ cations as suggested from structural refinements. The weak dependence of is presumably understood in terms of incoherent transport driven by the formation of the polaron-like conduction.
II Experimental
Polycrystalline samples of Pb1-xSrxMoO3 (), were synthesized by a high-pressure and high-temperature technique. Stoichiometric mixtures of PbO, SrO, and MoO2 were reacted at 1000 ∘C and 7 GPa for 30 min using a multianvil press. SrMoO3 () was synthesized by heating SrMoO4 (prepared by a solid-state reaction) at 1000 ∘C for 12 h in H2/Ar flow as reported in Ref. Hayashi and Aoki, 1979.
X-ray powder-diffraction (XRD) experiments were performed with Cu radiation at room temperature (RT). For an additional structural study of PbMoO3, synchrotron X-ray powder diffraction (SXRD) experiments were performed at RT on the BL02B2 beam line at SPring-8. The wavelength of the incident beam was Å. Neutron diffraction experiments of PbMoO3 were performed at RT and 5 K using the high resolution powder diffractometer BT-1 at the NIST center for Neutron Research. Incident neutrons of wavelength Å monochromated by vertical-focused Cu (311) monochromator was used. The structural refinements were performed using the FullProf and RIETAN-FP softwares Rodriguez-Carvajal (1993); Izumi and Momma (2007). The sample was also characterized using transmission electron microscopy (TEM). The data were acquired on an aberration-corrected FEI Titan 80-300 microscope at 300 kV. The chemical composition was analyzed by an energy dispersive X-ray spectroscopy (EDS). The valence was checked by the X-ray absorption near edge structure (XANES) spectroscopy at the Mo -edge. The spectra of PbMoO3, SrMoO3, MoO2 and MoO3 were measured at RT on the BL01B1 beamline at SPring-8. The XANES spectra were recorded in a transmittance mode, using Si (111) and Si (311) double crystal monochromator.
The specific heat () and dc magnetic susceptibility () were measured, respectively, with a commercial calorimeter (Quantum Design, PPMS) and a SQUID magnetometer (Quantum Design, MPMS). The electrical resistivity was measured by means of a standard four-probe method using rectangular samples cut out from pellets. Gold wires were attached to samples with silver paste, and the samples were then cooled down to 0.1 K using an adiabatic demagnetization refrigerator installed in PPMS. Note that the density of the polycrystalline sample pellet is 8.7 g/cm3 for PbMoO3, 7.4 g/cm3 for Pb0.5Sr0.5MoO3, and 5.4 g/cm3 for SrMoO3. These values correspond to 89–97% of the calculated ones estimated from the RT crystal structures, suggesting that the difference in density provides only small effect on the absolute values of in these compounds.
III Results and discussion
| X-ray (RT) | neutron (RT) | neutron (5 K) | |
|---|---|---|---|
| Cell parameters and positions | |||
| Space group | |||
| (Å) | 3.999(3) | 3.9986(1) | 5.6348(2) |
| (Å) | 7.9680(3) | ||
| (Å) | 5.6508(2) | ||
| Pb | 0.5 | 0.5 | 0.0 |
| Pb | 0.5 | 0.5 | 0.25 |
| Pb | 0.5 | 0.5 | 0.5008(17) |
| O1 | 0.5 | 0.5 | 0.0 |
| O1 | 0.0 | 0.0 | 0.25 |
| O1 | 0.0 | 0.0 | 0.0259(12) |
| O2 | 0.25 | ||
| O2 | -0.0128(5) | ||
| O2 | 0.25 | ||
| (Å2) | |||
| Pb | 2.08(6) | 2.58(5) | 1.2(2) |
| Mo | 0.30(6) | 0.64(4) | 0.36(4) |
| O1 | 0.8(3) | 0.99(6) | 0.6(2) |
| O2 | 0.42(8) | ||
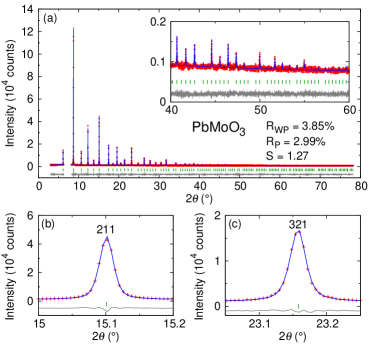
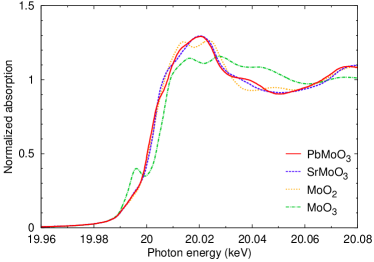
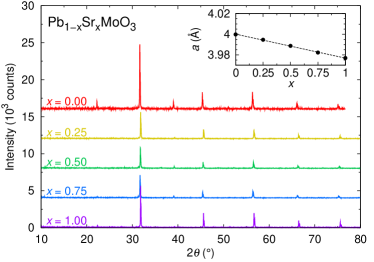
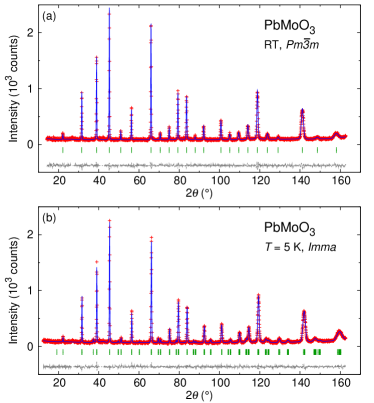
Figure 1 shows the powder SXRD pattern of PbMoO3 recorded at RT. Observed peaks are indexed in a cubic unit cell, without any splitting and shoulder indicating symmetry lowering (see, for example, 211 and 321 reflections in Figs. 1(b) and 1(c)). This result demonstrates the absence of any distortions from the cubic symmetry at RT. The Rietveld refinement assuming the ideal cubic perovskite (space group: ) converged resulting in the lattice parameter of Å and factors of %, %, %, and %. The goodness-of-fit parameter, , was , indicating excellent quality of the fitting. The solid solution Pb1-xSrxMoO3 was successfully obtained in the entire range, with the lattice constant decreasing linearly with increasing (Fig. 1 of the Supplemental Material [sup, ]). These results ensure a continuous change in the -site composition. Refining the occupancy factor of each atomic site did not improve the overall fit, indicating the stoichiometric composition of the title compound at least for the heavy atoms on the and sites. The Mo -edge XANES spectra of PbMoO3 (Fig. 2), measured together with other Mo compounds, indicate that the formal valence in PbMoO3 is Mo4+ (thus yielding Pb2+), which is consistent with the result of bond valence sum calculations based on the RT structure, giving Mo4.08+ and Pb1.74+. EDS experiments verified the compositional ratio between Pb and Mo, for example, Pb/Mo = 1.01(6) for the sample.
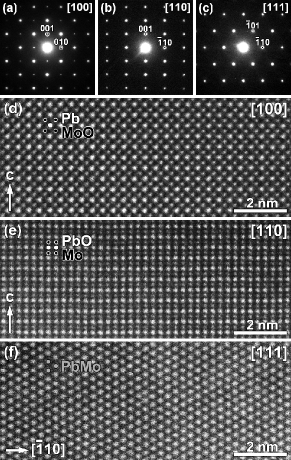
Interestingly, a large atomic displacement parameter (ADP) of Pb was obtained (isotropic root-mean-square displacement of 0.15(1)Å), suggesting unusually large thermal vibration of Pb ions and/or random displacements of Pb away from the ideal position. Given the presence of stereochemically active 6 electrons of Pb2+, the obtained cubic structure in PbMoO3 is unusual and contrasts markedly with other reported Pb-based perovskites with a distortion from the cubic symmetry Goodenough and Zhou (2015). In order to gain more insight into the RT crystal structure for PbMoO3, we performed TEM experiments. As shown in Figs. 3(a)–(c), electron diffraction patterns can be consistently indexed on the cubic perovskite structure with the symmetry. They do not contain any extra reflections or diffuse intensities associated with long or short range ordered structure deformations due to the Pb off-center displacements. Also, high-angle-annular-dark-field scanning-transmission-electron microscopy (HAADF-STEM) images in Figs. 3(d)–(f) do not show any notable discrepancy from the ideal cubic perovskite structure. No anomaly associated with Pb disorder is observed in any principle directions of the cubic structure, [100], [110], and [111]. These results suggest that the Pb off-center displacements, if present, are random at RT, and the local cooperative structure related to correlated disorder Keen and Goodwin (2015) or the formation of polar nano region for relaxor phenomena of Pb-based complex perovskites Burns and Dacol (1983); Vakhrushev et al. (1989); Hirota et al. (2002) is absent.
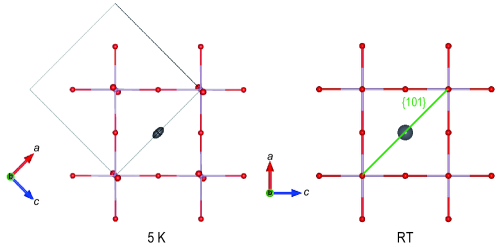
Rietveld refinement of the RT neutron diffraction data gave a consistent result compared to the SXRD data, confirming the full occupancy of the anionic site, while at K we found a orthorhombic distortion with additional peaks corresponding to a cell (Fig. 2 of the Supplemental Material [sup, ]): a preliminary SXRD experiment shows the structural phase transition appears at K. This superstructure is presumably related to a structural transition as observed in SrMoO3 below 125 K involving the softening of a phonon mode that results in MoO6 octahedral tilting Macquart et al. (2010). Indeed, a successful structural refinement at 5 K was conducted assuming a low-temperature structural phase analogous to SrMoO3 (space group: ): details are given in Tables 1 and the Supplemental Material [sup, ]. It is notable that, unlike SrMoO3, the displacement parameter of the Pb site is still quite large even at 5 K (root-mean-square displacement of 0.15 Å along the axis and Å along the and axes), suggesting a strong “statically” remaining incoherent Pb off-centering. It is worth underlining that the difference in with for Pb between RT and 5 K is at least three times higher than that for Mo in PbMoO3 or for Sr in SrMoO3 Macquart et al. (2010), additionally revealing an unusual thermal behavior possibly related to the dynamic component of lead disorder. We will discuss the effect of the Pb off-centering on physical properties in the next section. As will be shown below, the absence of any anomalies related to the structural transition in , and may be related to the associated subtle octahedral tilt of about along the axis.
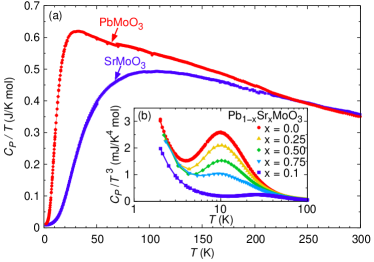
It is expected that the off-centered Pb2+ derived from lone pair electrons in PbMoO3 may provide essential influence on physical properties. In fact, of PbMoO3 is much larger than that of SrMoO3 below 150 K. Moreover, the vs. plot for PbMoO3 clearly exhibits a peak centered at about 10 K, which is however absent in SrMoO3 (see the inset of Fig. 4). This low-temperature peak cannot be explained in terms of the structural phase transition of PbMoO3 and the simple Debye law with , and hence implies a significant contribution of a low-energy vibrational mode to the specific heat Ramirez and Kowach (1998); Barron and White (1999). It is also seen that Sr-for-Pb substitution does not alter the peak position (temperature), while reducing only its intensity. It can thus be deduced that this peak originates from the incoherent displacement of Pb ions by the lone-pair electrons, revealed by the large ADP of Pb, since conventional disorder is known to shift the peak temperature Pohl and Swartz (1985); Safarik et al. (2006); Melot et al. (2009). The peak for PbMoO3 can be roughly reproduced by the Einstein specific heat with an Einstein temperature K which corresponds to the value estimated from the ADP value of Pb at RT sup . An upturn of observed in Pb1-xSrxMoO3 systems below 5 K is ascribed to the electronic specific heat , and we obtained mJ/K2-mol for PbMoO3 and mJ/K2-mol for SrMoO3, the latter being in agreement with the previous estimation Ikeda and Shirakawa (2000); Nagai et al. (2005). The Wilson ratio is obtained as 1.8 and 2.2 for PbMoO3 and SrMoO3, respectively, using the Pauli paramagnetic susceptibility after diamagnetic correction for PbMoO3 and from the report on SrMoO3 Ikeda and Shirakawa (2000); sup . The values of for both compounds are close to 2 as expected in Fermi liquids within the strong correlation limit Kronmller and Parkin (2007).
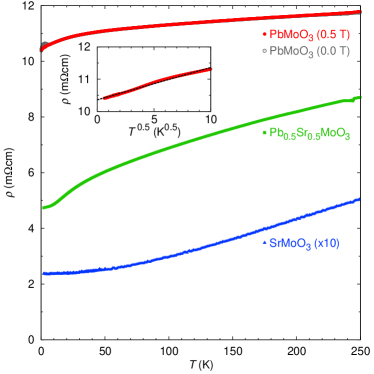
Temperature dependence of the electrical resistivity of PbMoO3 (Fig. 5) shows a metallic behavior down to 0.1 K (apart from a tiny contribution of the superconductivity (SC) from the Pb impurity below 7 K). This SC contribution can be removed by applying a magnetic field of 0.5 T, which is above the critical field of the SC transition of Pb. The resulting is almost identical with the zero-field data, implying that the magnetoresistance is negligible. Interestingly, of PbMoO3 exhibits an unusual -sub linear dependence in a wide temperature range below 100 K, where the fitting with to the data yielded (the inset of Fig. 5). Moreover, the resistive change in temperature is rather small, with a residual resistivity ratio . These features are distinct from of typical non-magnetic metals, where or due to the electron-phonon scattering with the weak electron-phonon coupling Ziman (1960); Allen and Schulz (1993) and/or due to the electron-electron scattering are observed at low temperature Mackenzie and Maeno (2003); Kadowaki and Woods (1986). Note that SrMoO3 shows below 140 K (the main panel of Fig. 5) owing to the enhanced electron-electron correlation Nagai et al. (2005). We also observed that is recovered by substituting Pb ions by Sr ions at low temperatures for the sample. Therefore, it appears that incoherent off-centered Pb2+ ions disturb the electrical conduction. It is known that a weak coupling between optical phonons and conduction electrons gives rise to a -super linear dependence with () Allen and Schulz (1993); Masui et al. (2002). It is thus possible that the observed polaron-like incoherent transport is mediated by strong coupling between conduction electrons and optical phonons of the local low-energy vibrational mode for PbMoO3, as proposed theoretically by Millis et al. Millis et al. (1996) It was suggested that can appear in the critical regime around the crossover from Fermi liquid to polaron behaviors.
IV Conclusion
To summarize, we have synthesized a novel lead perovskite PbMoO3 using a high-pressure and high-temperature reaction. This lead-based compound represents a rare case with the cubic structure at room temperature, despite the presence of Pb2+ cations with lone pair electrons. We observed an unusual -sub linear dependence in as well as large specific heat at low temperatures, which could be explained in terms of a low-energy vibrational mode mediated by the incoherent off-centering of Pb2+ cations as experimentally indicated by anomalously large Pb atomic displacements. Furthermore, the weak dependence of implies a polaron-like conduction, mediated by the strong trapping of conduction electrons by local phonon vibration.
Note added. Recently, we became aware of the work on Pb2Cr1+xMo1-xO6 reporting a synthesis for ( means PbMoO3), yet with no structural refinement (thus no indication of Pb off-centering) or detailed physical properties Zhao et al. (2017).
Acknowledgment
This work was supported by CREST and JSPS KAKENHI Grants No. 25249090, No. 24248016, No. 26106514, and No. 26400336. The synchrotron radiation experiments, performed at the BL02B2 of SPring-8, were supported by the approval of the Japan Synchrotron Radiation Research Institute (JASRI) (Proposal No. 2014B1360).
References
- Setter and Cross (1993) N. Setter and E. L. Cross, Ferroelectric Ceramics (Birkhauser Verlag AG, Basel, 1993).
- Jaffe et al. (1971) B. Jaffe, W. R. Cook, and H. Jaffe, Piezoelectric Ceramics (Elsevier Science & Technology, New York, 1971).
- Wang et al. (2003) J. Wang, J. B. Neaton, H. Zheng, V. Nagarajan, S. B. Ogale, B. Liu, D. Viehland, V. Vaithyanathan, D. G. S. U. V. Waghmare, N. A. Spaldin, et al., Science 299, 1719 (2003).
- Anderson and Blount (1965) P. W. Anderson and E. I. Blount, Phys. Rev. Lett. 14, 217 (1965).
- Sergienko et al. (2004) I. A. Sergienko, V. Keppens, M. McGuire, R. Jin, J. He, S. H. Curnoe, B. C. Sales, P. Blaha, D. J. Singh, K. Schwarz, et al., Phys. Rev. Lett. 92, 065501 (2004).
- Sakai et al. (2016) H. Sakai, K. Ikeura, M. S. Bahramy, N. Ogawa, D. Hashizume, J. Fujioka, Y. Tokura, and S. Ishiwata, Sci. Adv. 2, e1601378 (2016).
- Kozii and Fu (2015) V. Kozii and L. Fu, Phys. Rev. Lett. 115, 207002 (2015).
- Shi et al. (2013) Y. Shi, Y. Guo, XiaWang, A. J. Princep, D. Khalyavin, P. Manuel, Y. Michiue, A. Sato, K. Tsuda, S. Yu, et al., Nat. Mat. 12, 1024 (2013).
- Sidgwick (1927) N. V. Sidgwick, The Electronic Theory of Valency (Oxford University Press, UK, 1927).
- Shimoni-Livny et al. (1998) L. Shimoni-Livny, J. P. Glusker, and C. W. Bock, Inorg. Chem. 37, 1853 (1998).
- Kimber et al. (2009) S. A. J. Kimber, J. A. Rodgers, H. Wu, C. A. Murray, D. N. Argyriou, A. N. Fitch, D. I. Khomskii, and J. P. Attfield, Phys. Rev. Lett. 102, 046409 (2009).
- Cheng et al. (2009) J. G. Cheng, J. S. Zhou, and J. B. Goodenough, Phys. Rev.B 80, 174426 (2009).
- Goodenough and Zhou (2015) J. B. Goodenough and J. Zhou, Sci. Technol. Adv. Mater. 16, 036003 (2015).
- Hayashi and Aoki (1979) S. Hayashi and R. Aoki, Mat. Res. Bull. 14, 409 (1979).
- Rodriguez-Carvajal (1993) J. Rodriguez-Carvajal, Physica B 192, 55 (1993).
- Izumi and Momma (2007) F. Izumi and K. Momma, Solid State Phenom. 130, 15 (2007).
- (17) Supplemental Material of this paper for the powder XRD data of Pb1-xSrxMoO3, and for the detailed structure analysis for the neutron diffraction data, and for the analysis of the specific heat and magnetic susceptibility of PbMoO3.
- Keen and Goodwin (2015) D. A. Keen and A. L. Goodwin, Nature 521, 303 (2015).
- Burns and Dacol (1983) G. Burns and F. H. Dacol, Solid State Commun. 48, 853 (1983).
- Vakhrushev et al. (1989) S. B. Vakhrushev, B. E. Kvyatkovsky, A. A. Naberezhnov, N. M. Okuneva, and B. P. Toperverg, Ferroelectrics 90, 173 (1989).
- Hirota et al. (2002) K. Hirota, Z. G. Ye, S. Wakimoto, P. M. Gehring, and G. Shirane, Phys Rev B 65, 104105 (2002).
- Macquart et al. (2010) R. B. Macquart, B. J. Kennedy, and M. Avdeev, J Solid State Chem. 183, 249 (2010).
- Ramirez and Kowach (1998) A. P. Ramirez and G. R. Kowach, Phys. Rev. Lett. 80, 4903 (1998).
- Barron and White (1999) T. H. K. Barron and G. K. White, Heat Capacity and Thermal Expansion at Low Temperatures (Springer, New York, 1999).
- Pohl and Swartz (1985) R. O. Pohl and E. T. Swartz, J. Non-Cryst. Solids 76, 117 (1985).
- Safarik et al. (2006) D. J. Safarik, R. B. Schwarz, and M. F. Hundley, Phys. Rev. Lett. 96, 195902 (2006).
- Melot et al. (2009) B. C. Melot, R. Tackett, J. O’Brien, A. L. Hector, G. Lawes, R. Seshadri, and A. P. Ramirez, Phys. Rev. B 79, 224111 (2009).
- Ikeda and Shirakawa (2000) S. Ikeda and N. Shirakawa, Physica C 341, 785 (2000).
- Nagai et al. (2005) I. Nagai, N. Shirakawa, S. Ikeda, R. Iwasaki, H. Nishimura, and M. Kosaka, Applied Physics Letters 87, 024105 (2005).
- Kronmller and Parkin (2007) H. Kronmller and S. Parkin, Handbook of Magnetism and Advanced Magnetic Materials (Wiley-Interscience, USA, 2007).
- Ziman (1960) J. M. Ziman, Electrons and Phonons (Oxford University Press, New York, 1960).
- Allen and Schulz (1993) P. B. Allen and W. W. Schulz, Phys. Rev. B 47, 14434 (1993).
- Mackenzie and Maeno (2003) A. P. Mackenzie and Y. Maeno, Rev. Mod. Phys. 75, 657 (2003).
- Kadowaki and Woods (1986) K. Kadowaki and S. B. Woods, Solid State Commun. 58, 507 (1986).
- Masui et al. (2002) T. Masui, K. Yoshida, S. Lee, A. Yamamoto, and S. Tajima, Phys. Rev. B 65, 214513 (2002).
- Millis et al. (1996) A. J. Millis, R. Mueller, and B. I. Shraiman, Phys. Rev. B 54, 5389 (1996).
- Zhao et al. (2017) H. F. Zhao, L. P. Cao, Y. J. Song, S. M. Feng, X. Shen, X. D. Ni, Y. Yao, Y. G. Wang, R. M. Wang, C. Q. Jin, et al., J. Solid. State Chem. 246, 92 (2017).
Supplemental Material: Cubic lead perovskite PbMoO3 with anomalous metallic behavior
I Abstract
In this supplemental material, we describe the synthesis of solid solutions of Pb1-xSrxMoO3 () with these powder X-ray diffraction (XRD) data. We also show the result of neutron diffraction measurements and the analysis of the specific heat as well as the result of magnetic susceptibility for the sample of PbMoO3.
II Synthesis of Pb1-xSrxMoO3
Samples of Pb1-xSrxMoO3 were obtained by the same method for the synthesis of PbMoO3. XRD patterns of these samples obtained through a laboratory X-ray machine at room temperature (RT) represent the same pattern of PbMoO3 (Fig. S1), indicating that the samples crystalize into the cubic structure in the entire range. The estimated lattice parameters linearly decrease with increasing (the inset of Fig. S1), which ensures the stoichiometric mixture of the samples. It is observed that impurity peaks such as PbMoO4 and Pb appear in the XRD patterns, however those concentrations are estimated to be small enough ().
Neutron diffraction measurements on the sample at 5 K show an additional peak or splitting of peaks from the cubic symmetry observed at RT (e.g., around 70∘ in Fig. S2). These peaks are not magnetic in the origin, because magnetic susceptibility experiments did not show any signature of magnetic phase transition. We therefore analyzed the low-temperature crystal structure, assuming the structure which is the orthorhombic space group (SG) of the highest symmetry: this choice is reasonable because other orthorhombic SGs of lower symmetry, fulfilling the observed -centering, such as , , , , , , , and are incompatible with the extinction conditions. We also reexamined the RT structural model of the synchrotron XRD analysis by the Rietveld refinement against neutron data. The resulting curves are shown in Fig. S2, and the obtained structural parameters are presented in Table I of the main text. The factors of the Rietveld refinement are %, %, %, % for RT, and %, %, %, % for 5 K. The goodness-of-fit parameter, , was and 0.940 for RT and 5 K, indicating excellent quality of fittings.
The key feature of the low temperature structe in PbMoO3 lies in the elongated shape of the Pb anisotropic displacement parameters along the axis that corresponds to the [101] direction of the high temperature cubic unit cell (Fig. S3). This result is also supported by using difference Fourier syntheses and maximum entropy method (MEM) calculations. These analyses clarify that the Pb nuclear density is homogeneously elongated along the axis without any maximum density on each side of the Wyckoff site.
III Analysis of specific heat
| Two Debye and one Einstein model [Fig. S4(a)] | ||
| Mode | , (K) | , |
| D1 | 560 | 9.92 |
| D2 | 154 | 3.99 |
| E1 | 47.4 | 1.09 |
| Two Debye and two Einstein model [Fig. S4(b)] | ||
| Mode | , (K) | , |
| D1 | 560 | 11.4 |
| D2 | 129 | 2.15 |
| E1 | 55.9 | 1.23 |
| E2 | 36.9 | 0.19 |
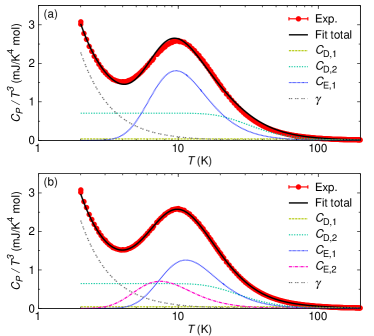
In order to analyze the anomalous behavior of the peak observed in PbMoO3, we have fitted the data as follows.
The phonon contribution to the low temperature specific heat, , can be modeled as a sum of Debye and Einstein terms Ramirez and Kowach (1998); Barron and White (1999), and , i.e.,
| (S1) |
where and are fitting parameters representing the number of the Debye and Einstein modes for the - and -th contributions. The sum of these coefficients represents the total number of lattice dynamical modes in the unit cell, i.e., for PbMoO3. and represent the contribution of Debye phonons and Einstein phonons to the specific heat, expressed as
| (S2) | |||
| (S3) |
where is the gas constant, and and are fitting parameters representing Debye and Einstein temperatures, respectively. We tentatively used these formulations for the specific heat analysis for PbMoO3, in reference to other systems Ramirez and Kowach (1998); Keppens et al. (1998); Yamamura et al. (2002); Tachibana et al. (2009); Melot et al. (2009); Takatsu et al. (2007); Barron and White (1999).
The least-squares fitting was carried out using the data between 2 and 100 K, and the relation
| (S4) |
with taking into account the electronic specific heat constant mJ/K4 mol for PbMoO3. In the primary fit, we considered two Debye and one Einstein modes (, ) and obtained reasonable fitting results reproducing experimental features as shown in Fig S4(a). It is seen that the peak is reproduced by the Einstein specific heat with K. This value agrees well with the estimation of the Einstein temperature K from the isotropic atomic displacement parameter of Pb at RT for the relation between and Tritt (2000), i.e., , where and are the Planck and Boltzmann constants, respectively, and is the atomic mass. This implies the close relation between the local vibrational mode mediated by incoherent off-centered Pb2+ cations and large low-temperature specific heat featured by the peak at about 10 K. The obtained fitting parameters are listed in Table 1. Note that the high-temperature part from one Debye contribution with K provides a reasonable value for high-temperature mode in oxides which mainly contributes to the data for K. It is worth noting that the model with two Debye and two Einstein modes can slightly improve the fitting as shown in Fig. S4(b), and the obtained fitting parameters are listed in Table 1. This result suggests that a low-energy optical mode of PbMoO3 is weakly dispersive.
IV Magnetic susceptibility of PbMoO3
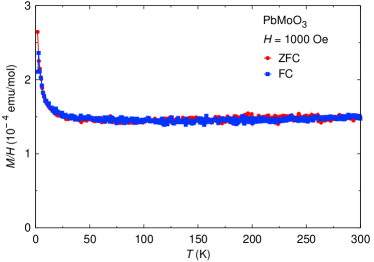
The temperature dependence of of PbMoO3 measured at Oe does not show any signature of the phase transition and hysteresis between zero-field cooling and field cooling runs (Fig. S5). A tiny diamagnetic signal accompanied by the superconducting transition of Pb impurities was observed in low field below 7 K, however its amount is less than 1% in our samples. Note that in particular, the estimated impurity amount for the sample used in the resistivity measurements is less than 0.1%. In accordance with a slight enhancement of Pauli paramagnetic susceptibility, of PbMoO3 is -independent in a wide temperature range above 20 K, while the Curie-type increase below 20 K corresponds to small amount (about 0.1%) of free impurity spins. The Pauli paramagnetic susceptibility is estimated as emu/mol after the correction of the diamagnetic susceptibility of emu/mol. This value of is similar to the value reported in SrMoO3 Ikeda and Shirakawa (2000); Zhang et al. (2006); Zhao et al. (2007).
References
- Ramirez and Kowach (1998) A. P. Ramirez and G. R. Kowach, Phys. Rev. Lett. 80, 4903 (1998).
- Barron and White (1999) T. H. K. Barron and G. K. White, Heat Capacity and Thermal Expansion at Low Temperatures (Springer, New York, 1999).
- Keppens et al. (1998) V. Keppens, D. Mandrus, B. C. Sales, B. C. Chakoumakos, P. Dai, R. Coldea, M. B. Maple, D. A. Gajewski, E. J. Freeman, and S. Bennington, Nature 395, 876 (1998).
- Yamamura et al. (2002) Y. Yamamura, N. Nakajima, T. Tsuji, Y. Iwasa, K. Saito, and M. Sorai, Solid State Commun. 121, 213 (2002).
- Tachibana et al. (2009) M. Tachibana, K. Sasame, H. Kawaji, T. Atake, and E. Takayama-Muromachi, Phys. Rev. B 80, 094115 (2009).
- Melot et al. (2009) B. C. Melot, R. Tackett, J. O’Brien, A. L. Hector, G. Lawes, R. Seshadri, and A. P. Ramirez, Phys. Rev. B 79, 224111 (2009).
- Takatsu et al. (2007) H. Takatsu, S. Yonezawa, S. Mouri, S. Nakatsuji, K. Tanaka, and Y. Maeno, J. Phys. Soc. Jpn. 76, 104701 (2007).
- Tritt (2000) T. M. Tritt, Recent Trends in Thermoelectric Materials Research, Part Two, Semiconductors and Semimetals, Volume 70 (Academic Press, New York, 2000).
- Ikeda and Shirakawa (2000) S. Ikeda and N. Shirakawa, Physica C 341, 785 (2000).
- Zhang et al. (2006) S. B. Zhang, Y. P. Sun, B. C. Zhao, X. B. Zhu, and W. H. Song, Solid State Commun. 138, 123 (2006).
- Zhao et al. (2007) B. C. Zhao, Y. P. Sun, S. B. Zhang, W. H. Song, and J. M. Dai, J. Appl. Phys. 102, 113903 (2007).