Received on XXXXX; revised on XXXXX; accepted on XXXXX
Associate Editor: XXXXXXX
SANA NetGO: A combinatorial approach to using Gene Ontology (GO) terms to score network alignments
Abstract
Gene Ontology (GO) terms are frequently used to score alignments between protein-protein interaction (PPI) networks. Methods already exist to measure the GO similarity between two proteins in isolation, and network alignment GO measures typically take the mean of pairwise similarities across aligned pairs of proteins. However, pairs of proteins in a network alignment are not isolated, because each pairing is implicitly dependent upon every other pairing via the alignment itself, which is constructed globally. Furthermore, taking a mean of pairwise scores fails to take into account the frequency of GO terms across the networks. Some GO terms are very infrequent and thus very informative to the alignment, while others are so common that even a random alignment will match a decent number of them. Existing network alignment GO scoring methods attempt to account for this in an ad hoc fashion by imposing arbitrary rules on when to “allow” GO terms based on their location in the GO hierarchy, rather than using readily available frequency information in the PPI networks themselves. Here we develop a new measure, NetGO, that naturally weighs infrequent, informative GO terms more heavily than frequent, less informative GO terms, without requiring arbitrary cutoffs. In particular, NetGO downweights the score of frequent GO terms according to their frequency in the networks being aligned. This is a global measure applicable only to alignments, independent of pairwise GO measures, in the same sense that the edge-based EC or scores are global measures of topological similarity independent of pairwise topological similarities. We demonstrate the superiority of NetGO by creating alignments of predetermined quality based on homologous pairs of nodes and show that NetGO correlates with alignment quality much better than any existing GO-based alignment measures. We also demonstrate that NetGO provides a measure of taxonomic similarity between species, consistent with existing taxonomic measures—a feature not shared with existing GO-based network alignment measures. Finally, we re-score alignments produced by almost a dozen aligners from a previous study and show that NetGO does a better job than existing measures at separating good alignments from bad ones.
1 Contact:
name@bio.comname@bio.com
2 Introduction
In the past decade, the alignment of protein-protein interaction (PPI) networks has received much attention, with more than a dozen alignment algorithms introduced (Singh et al., 2008; Kuchaiev et al., 2010; Kuchaiev and Pržulj, 2011; Memisevic and Pržulj, 2012; Milenković et al., 2010; Aladağ and Erten, 2013; Neyshabur et al., 2013; Chindelevitch et al., 2013; Patro and Kingsford, 2012; Hashemifar and Xu, 2014; Sun et al., 2015; Crawford and Milenković, 2015; Vijayan et al., 2015; Malek et al., 2016; El-Kebir et al., 2011; Clark and Kalita, 2015; Malod-Dognin and Pržulj, 2015; Mamano and Hayes, 2017). The goal of such alignments is to discover “similar” proteins across species, in the hopes that information from better-understood proteins in one species can be transferred to less-well-studied proteins in another. Although sequence information is commonly used for this purpose (NCBI, 2016), there is strong evidence that network topology also encodes significant biological information (Kuchaiev et al., 2010; Davis et al., 2015).
The large number of network alignment algorithms are a testament both to its perceived importance, as well as to its difficulty: network alignment is NP-complete (Cook, 1971), being a generalization of the subgraph isomorphism problem. Thus, approximate heuristics must be used, and the approximations produce sub-optimal solutions whose quality must be carefully assessed. Alignments (and the algorithms used to create them) are scored in many different ways, depending upon what one wishes to emphasize. Some scoring functions are used to guide the creation of alignments, while others are used to evaluate an alignment after-the-fact. Most alignment algorithms use some sort of network topology to help guide the alignment since network topology has been shown to recover such information as phylogeny (Kuchaiev et al., 2010) and correlate to function (Davis et al., 2015). Usually protein sequence similarity is also used to guide the alignment, in a trade-off with topological information.
The Gene Ontology (The Gene Ontology Consortium, 2008) is a large, hierarchical corpus of descriptive terms describing various biological processes (BP), cellular components (CC), and molecular functions (MF) that occur in a cell. For our purposes, we note that each protein in a PPI network is typically annotated with various GO terms. Near the top of the GO hierarchy, terms are very general (such as the BP term “cell division” or CC term “nucleus”) and many (sometimes thousands) of proteins can carry those annotations. As one descends the hierarchy, terms get more specific, and fewer proteins are annotated with them. Some proteins are more well-understood and have many GO terms, while other proteins are less-well understood and have few (or no) GO terms associated with them. It is for this reason that network alignment is useful: a well-annotated protein in one species may be able to help annotate a less-well-understood protein in another species, if the quality of the network alignment warrants it.
Since network alignment is still in its infancy, the plethora of algorithms must be evaluated against each other based on the biological information they recover, and using GO terms after-the-fact is a common way to measure the quality of alignments. The hope in a network alignment is that proteins from one network are aligned to similar proteins in the other, as independently measured by GO terms. (Of course some day we may wish to use GO terms to guide the creation of alignments, but for now their primary use is to evaluate alignment algorithms that do not use GO terms to aid creating the alignment.)
Using GO terms to evaluate the similarity between a pair of proteins is tricky for many reasons (see Pesquita et al. (2009) for a comprehesive survey). First, GO annotations of proteins are noisy, containing both false positives and false negatives. Second, quantifying the information conveyed by any one GO term in the complex hierarchy is so difficult that over a dozen methods have been proposed, with no clear winner (Pesquita et al., 2009). Third, the above problem becomes even more difficult if we wish to quantify the semantic similarity between two GO terms. Fourth, the difficulty is multiplied yet again when we wish to evaluate the semantic similarity between two proteins that are each annotated with multiple GO terms. Again, many methods have been proposed, with no clear winner and no agreed-upon gold standard (Pesquita et al., 2009).
Finally—and this is the topic of this paper—all existing methods of evaluating protein similarity using GO terms are designed to be applied to just two proteins in isolation (Pesquita et al., 2009); the “GO similarity” of a network alignment is typically computed as the mean GO similarity across all pairs of aligned proteins. The problem with this approach is that a network alignment is not a set of independent, isolated pairs of proteins. Instead, each pair of aligned proteins is implicitly dependent on every other aligned pair via the alignment itself, which is constructed globally. No existing GO measure takes this global dependency into account. Furthermore, the high frequency (and low specificity) of some GO terms cause even random network alignments to appear high quality unless one discards these low specificity GO terms. Typically, some arbitrary cutoff is applied to discard terms that are high (close to the root) in the GO hierarchy. While such a cutoff may make sense when comparing two proteins in isolation, a network alignment provides a more natural way to discount common GO terms: we can simply scale the utility of a GO term inversely with the frequency it appears across the networks being aligned. Thus, a GO term that appears only once in each network is appropriately viewed as a strong indicator that those two proteins should be aligned as a pair; and a GO term that appears almost everywhere in both networks has its utility (for the purpose of alignment evaluation) suitably scaled down to almost zero.
The paper is organized as follows. Section 3 describes the GO system and similarity measures in more detail. Section 4 introduces our new alignment-based measure (and several minor variations). Section 5 presents comparisons of all the measures as a function of alignment “quality” based on network alignments of “known” quality. Finally, section 6 presents some discussion and conclusions.
3 Pairwise GO scoring
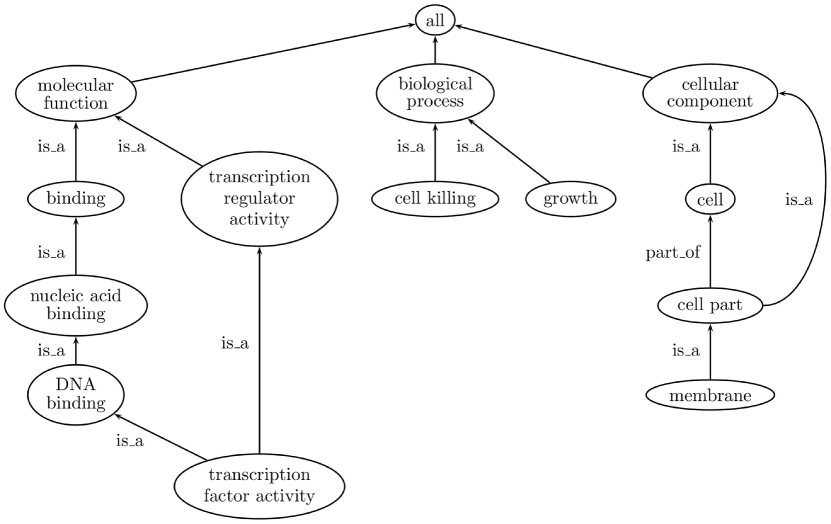
This section draws heavily from Pesquita et al. (2009), which provides an excellent and comprehensive survey of GO similarity measures. Figure 1 depicts a small portion of the GO hierarchy. All existing measures are designed to perform pairwise comparison, either between two GO terms, or between two “gene products”, of which proteins are an example. To evaluate these measures we will be using the Python package FastSemSim (Guzzi et al., 2012), using measures listed in Table 1.
| Measure | Source |
|---|---|
| Cosine | Chabalier et al. (2007); Popescu et al. (2006) |
| Dice | Dice (1945); Popescu et al. (2006) |
| Czekanowski-Dice | Martin et al. (2004) |
| Jaccard | Popescu et al. (2006) |
| Jiang-Conrath | Jiang and Conrath (1997) |
| Lin | Lin et al. (1998) |
| NTO | Mistry and Pavlidis (2008) |
| Resnik | Resnik (1995) |
| SimGIC | Pesquita et al. (2008) |
| SimIC | Li et al. (2010) |
| SimRel | Schlicker et al. (2006) |
| SimUI | Falcon and Gentleman (2007) |
3.1 Comparing two GO terms
When comparing two GO terms, one can use edges and paths in the GO hierarchy to measure distance by the path length between two terms (Rada et al., 1989), or a similarity by the common path between the two terms traced back to the root (Wu and Palmer, 1994). However, both of these methods rely on the assumption that edges at the same level of the hierarchy correspond to equivalent semantic distances between terms, and that nodes at the same level have roughly equal specificity. Unfortunately, neither assumption holds in the GO hierarchy (Pesquita et al., 2009).
Comparing GO terms using the nodes themselves involves comparing the terms, their ancestors, or their descendants in the hierarchy. The specificity of a particular GO term is typically measured by its information content IC() = where is the probability of ’s occurrence in a specific corpus (such as the UniProt database). Then, one measure of the similarity between two GO terms is the IC of their most informative common ancestor (MICA), which is their common ancestor with the highest IC (this method is the popular method by Resnik (1995); Resnik et al. (1999)), or by the more recent disjoint common ancestor (DCA) method (Couto et al., 2005), which considers only common ancestors with disjoint descendant sets.
Node-based GO term comparisons are less sensitive to hierarchical assumptions than edge-based ones since they make no assumptions about level in the hierarchy. However, they are biased by current research trends in biomedical research because terms related to current areas of scientific interest may be over-represented (Pesquita et al., 2009). Still, node based measures are likely to be more useful than edge-based ones because (to directly quote Pesquita et al. (2009)), “they make sense probabilistically because it is more probable (and less meaningful) that two gene products share a commonly used term than an uncommonly used term, regardless of whether that term is common because it is generic or because it is related to a hot research topic”. In other words, IC methods appropriately down-weight common GO terms, no matter the reason they are common.
3.2 Comparing two proteins
Gene products such as proteins can be annotated with several GO terms, from all three of the categories MF, CC, and BP. Thus, comparing two proteins involves comparing two sets of GO terms. There are two major methods of comparing the two sets of GO terms: pairwise, and groupwise. Pairwise methods look at pairs of GO terms (one from each protein), and choose either an average, or a maximum, similarity between the GO terms as representative of the similarity between the proteins.
Groupwise comparisons are broken into three categories: (i) setwise, in which set similarity (or difference) methods are used to compare the two sets of terms; (ii) graph-wise, in which subgraphs related to the two sets of terms are extracted from the GO hierarchy and then the two subgraphs are compared; and (iii) vector-wise, in which a vector space is created representing the presence or absence of terms in the two sets, and then a vector similarity function (such as dot product) is used.
4 Scoring network alignments with GO terms
As mentioned previously, the typical method for scoring PPI network alignments using GO terms is to pick one of the many methods that score pairs of proteins, and then simply take the mean score across all pairs of aligned proteins. Until now, this has been the only reasonable method, because all GO-scoring methods only work with pairs of individual proteins, and the mean score across the alignment seemed the only feasible way to use the existing methods.
To understand the need for a GO-based method designed specifically for evaluating network alignments, consider the following simple example. Assume there are two networks , each with many nodes. Consider 4 proteins that all share a particular GO term : and . There are two 1-to-1 alignments that could each be considered “correct” with respect to the GO term : and . Since there are two equally valid alignments according to , does not impose a unique alignment. Now assume another GO term occurs only once in each network, say and ; then there is only one “correct” alignment of —it must be aligned to . Thus, imposes a more restrictive constraint on the aligment than does , and so we consider more informative to the alignment than . Thus, aligning to should be worth more, from the alignment perspective, than either of the two pairings of to . In general, correctly aligning rare GO terms should be worth more than correctly aligning frequently occurring GO terms.
To make this example more concrete, consider GO terms shared between the BioGRID PPI networks of rat and mouse, including only experimentally curated terms—ie. no IEA (inferred electronically) terms. There are exactly 87 GO terms that appear exactly once in each network, and so we can construct a unique alignment among these 87 pairs of proteins. The mean Resnik semantic similarity score among these 87 pairs is 10.53. Now consider GO terms that appear exactly twice in each network. There are exactly 253 such GO terms; since each one of them annotates exactly 2 proteins in each network, each GO term introduces a 2-way ambiguity in which way we should align the 2 proteins in one network with the 2 similarly annotated proteins in the other. Across all possible alignments, the mean Resnik similarity is 10.65—slightly higher than for the uniquely defined pairings. Although this suggests that all possible pairings carry reasonable functional similarity, our point is that in terms of defining the alignment, the doubly-occuring GO terms impose less of a constraint on the alignment and therefore those GO terms should be weighted less—not that the protein pairs should be weighted less, but the GO terms that annotate them should count for less in scoring the alignment. (Technically, there could be as many as “correct” alignments across these 253 pairs, and one can hardly claim that somehow all of these are as well-defined as the unique alignment imposed by the 87 uniquely-occurring GO terms.) Interestingly, the two lists of proteins are not disjoint: there are 51 pairs of rat–mouse proteins that share a unique GO term and also share a (different) doubly-occurring GO term. Clearly, a unique alignment is imposed upon these 51 pairs that is not implied by the doubly-occurring GO terms, again underscoring how less-frequent GO terms are more powerful.
Of course one may argue that all of the possible above alignments convey significant value since they likely align proteins of high functional similarity even if they do not isolate homologous proteins. This is of course correct—and in the absense of the unique proteins, the Combinatorial NetGO score (COGO in all our Figures) still would give any of the alignments about half the score of the unique ones, which is still a very respectable score reflecting high functional similarity. As such, if one is truly interested only in mean functional similarity, then certainly a “mean semantic similarity” score may be sufficient.
Some GO terms appear thousands of times across both networks and thus contribute virtually nothing towards constraining the alignment. In contrast, other GO terms may appear only once in each network. This extreme diversity in frequency is not sufficiently accounted for by existing schemes that down-weight common terms based only on their level in the GO hierarchy. For example, more that 5,000 (out of about 15,000) proteins in each of rat and mouse are annotated with the GO term nucleus. Most of these proteins are also annotated with other, less-frequent GO terms. In the context of network alignment, infrequent GO terms are far more informative than common ones.
4.1 NetGO: the basic idea
In the following sections, we look at an alignment from the perspective of GO terms, rather than the perspective of proteins. Assume a particular GO term appears times in one network and times in the other, with . We say an alignment aligns the GO term “correctly” if all proteins that have it in one network are aligned with one of the proteins that have it in the other network. We assign each GO term one “unit” of score, and spread that unit across some set of proteins or alignments, depending upon how severely we want to penalize common GO terms. We offer two methods of spreading the score below, although others could easily be concocted.
4.2 Combinatorial NetGO score
Given GO term , we distribute the one unit of its score equally among all possible alignments that align it correctly. There are generally an exponential number of such alignments, and so this method of down-weighting common GO terms is very Draconian, exponentially down-weighting common GO terms according to their frequency. In particular, there are ways to align correctly in the sense of having all proteins in one network align to the proteins in the other. Hence, if alignment aligns all of the proteins to into the corresponding proteins in the other network that share , then contributes a total of
| (1) |
to the Combinatorial NetGO score of . If only aligns of the proteins that have in one network to proteins in the other network that also have the term , then contributes
| (2) |
to the Combinatorial NetGO score of . In other words, For GO terms that are very frequent, even aligning all of them “correctly” gets you almost nothing—becasue doesn’t really tell you much about which individual proteins should align to each other. The total GO score of is the sum of the contribution of each GO term . Again, note that this is a sum over GO terms in the alignment, not a sum over proteins in the alignment. This is what we mean by the scoring being GO-centered rather than protein-centered.
Finally we normalize the combinatorial GO score by dividing the sum above by the score of an alignment that, at least in principle, aligns every GO term correctly (even though such an alignment may not exist). For each GO term , let and denote the number of times that appears in the two networks and assume in each case that . Then, the normalization factor is
4.3 Inverse Frequency GO (Inverse Frequency NetGO) score
A slightly less Draconian scoring is the Inverse Frequency GO score: given a particular GO term that appears times in one network and times in the other, we again assign exactly 1 unit of score to , and assign a value of to each pair of nodes sharing that are aligned together. The reason we choose to be the denominator rather than, for example, the or the sum, is because we want to assign the maximum score of 1 for only if the same number of nodes in both networks share , and each of them is correctly aligned to a node in the other network that also has . The general theme is that the only way to attain the maximum score for GO term is via a perfect alignment of all nodes in both networks that share . If then the maximum conceivable score allotted for is . Using this method, if the total number of distinct GO terms appearing across both networks is , then we sum the scores across all GO terms , and then divide by , giving a total score in the range [0,1].
This second scoring method is also easily generalizable to multiple network alignment, as follows. Assume we are aligning different networks. Given a particular GO term , it will still possess exactly 1 point to be spread across the entire multi-alignment. Let be the number of nodes in network that share , and let (the maximum number of times appears in any one network). Then we allot a score of to each node in every network that has . However, any particular node is only given its value if there is at least one other node in its cluster that also shares —and in that case all nodes in the cluster that share get to allocate their score to the total score222There are myriad other possibilities. For example perhaps the proteins should only be allowed to contribute a fraction of their value, the fraction increasing as more proteins in that cluster share . Studying this issue is an area of future work.. Just as in pairwise alignment, will obtain its maximum possible score of 1 only if every network has exactly the same number of nodes sharing (ie., nodes share in every network), and every node that shares is in a cluster where every other node in the cluster also shares . This would constitute a perfect alignment of all nodes that share . Again, the normalizing factor (ie., denominator) will be the total number of distinct GO terms that appear across all networks. This implies, for example, that if any network has fewer than nodes that have , then by the pigeon hole principle at least one cluster sharing nodes with contains at least one node that does not share with all the other nodes in said cluster, and so a perfect score with respect to is not possible.
4.4 Discussion
If there is reason to believe there is a truly “correct” 1-to-1 mapping of nodes, then the Combinatorial NetGO score will highly score only those alignments that have a significant fraction of the nodes aligned “correctly”. If, on the other hand, one wishes to emphasize only functional similarity, then the Inverse Frequency NetGO score is probably more appropriate, since it will provide a good score even to common GO terms , as long as all the possible nodes in one network that share are mapped to nodes in the other network that also share .
One could imagine many variations on this theme. For example, one could penalize frequent terms even less severely, such as by the logarithm of their frequency. Or, in Equations (1) or (2), one could choose a numerator according to an existing measure of semantic similarity (such as Resnik) rather than just 1. We have not yet explored these possibilities.
| SP | CE | MM | SC | AT | DM | HS | |
|---|---|---|---|---|---|---|---|
| RN | 1257 | 2729 | 17021 | 1130 | 1546 | 3891 | 15803 |
| SP | 873 | 1286 | 1677 | 806 | 1056 | 1284 | |
| CE | 2832 | 773 | 915 | 2434 | 2860 | ||
| MM | 1163 | 1600 | 4045 | 16482 | |||
| SC | 720 | 948 | 1164 | ||||
| AT | 1225 | 1598 | |||||
| DM | 4059 |
5 Results
To compute semantic similarities for all the measures listed in Table 1, we use the python package FastSemSim333https://pypi.python.org/pypi/fastsemsim (Guzzi et al., 2012). It implements pairwise scores between 2 proteins for the methods listed in Table 1.
5.1 Alignments with known correct mapping
In order to compare our method of scoring alignments, we need to create alignments that have some sort of a priori known amount of “correctness”. To do this, we used the NCBI homologene database (NCBI, 2016), which contains a list of known (or highly probable) homologous genes across a large array of species. Given a gene in one species, we can thus look for homologous genes in different species. Some genes have multiple homologs in other species; for our purposes, we eliminated such pairings and allowed only 1-to-1 homologs between species so that we can uniquely create a “correct” alignment, even though it contains only a subset of all the proteins in each species. Table 2 displays the number of 1-to-1 homologs between 8 pairs of BioGRID species, according to the Homologene database. To create partially correct alignments, we randomly permute some fraction of those pairs; the correctness of the alignment is then defined to be .
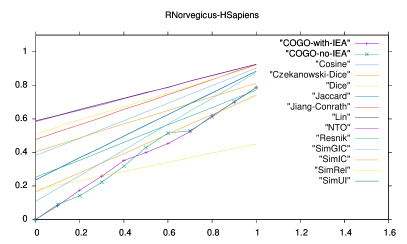
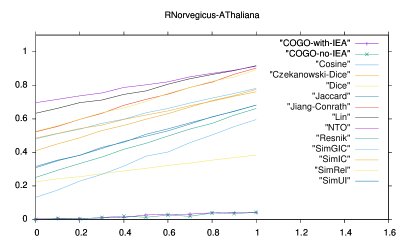
Figure 2 depicts the scores of all the methods for the two pairs of species: R.norvegicus vs. H.sapiens, and R.norvegicus vs. A.thaliana. As can be seen, all of the measures correlate with correctness. However, none of them give an appropriately low score to alignments that are completely random. Combinatorial NetGO, on the other hand, gives such alignments a score very close to zero because the only pairs of aligned proteins that share any GO terms at all, share only the frequently occurring GO terms—the terms that are so common that even a random alignment is likely to have pairs of proteins sharing such terms. As the correctness of the alignment increases, Combinatorial NetGO scales roughly linearly, because more homologous (and thus functionally very similar) proteins are being correctly aligned.
| COGO | SimGIC | Jaccard | SimUI | Dice | Cosine | Resnik | SimIC | SimRel | Jiang | NTO | Lin | Cz.-Dice | |
|---|---|---|---|---|---|---|---|---|---|---|---|---|---|
| Spearman | 0.60 | 0.08 | -0.01 | -0.01 | -0.01 | -0.02 | 0.08 | -0.17 | -0.24 | -0.27 | -0.37 | -0.36 | -0.40 |
| Pearson | 0.88 | 0.56 | 0.46 | 0.46 | 0.33 | 0.31 | 0.25 | -0.04 | -0.13 | -0.14 | -0.21 | -0.22 | -0.55 |
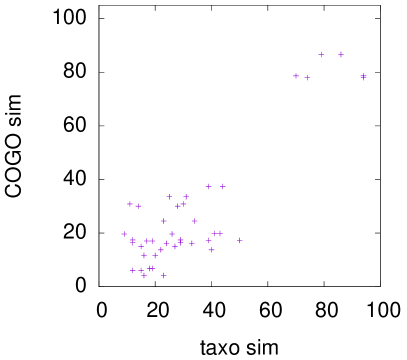
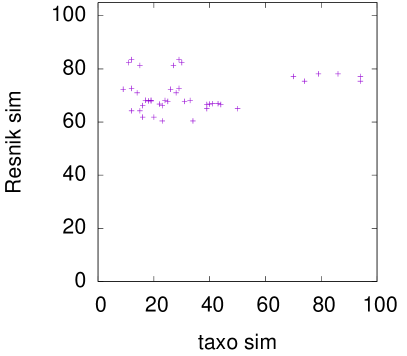
Even more interesting is that the slope of the linear correlation of Combinatorial NetGO with alignment correctness is steeper for rat–human (which are both mammals) than rat–cress (which are much more distantly related). In fact, if we look at the Combinatorial NetGO score of the “perfect” alignments of both of these pairs, we find that they agree very closely to an independent measure of phylogenetic similarity (Gilbert, 2002): both give rat–human a score in the vicinity of 0.8, and both give rat–cress a score in the vicinity of 0.05. Figure 3 shows that this correlation extends across all 28 pairs of the 8 BioGRID species we consider. We see that the Combinatorial NetGO score of perfect alignments has a much stronger linear correlation with taxonomic similarity than the Resnik score of those alignments, even though the Resnik score has become recently popular for scoring PPI network alignments. In fact we see that the Resnik score is completely incapable of distinguishing mammal-mammal alignments from alignments of more distantly related species, where the Combinatorial NetGO score easily separates them. Table 3 shows that the Combinatorial NetGO score is the only score that has a high correlation between the score and the taxonomic similarity; none of the other network alignment scores comes even remotely close, and in fact many have a zero or even negative correlation, showing that they may be inappropriate for use in a network alignment context.
5.2 Evaluating several aligners for functional similarity
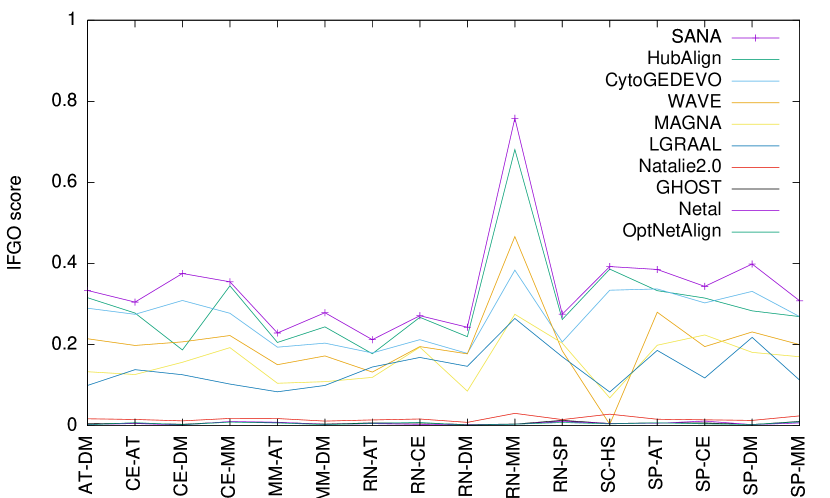
In Mamano and Hayes (2017), we evaluated alignments produced by a dozen different aligners using the Resnik semantic similarity. Among a dozen aligners, all scores were cramped in the range 2–4, and the top 5 aligners (SANA, SPINAL, CytoGEDEVO, HubAlign, and WAVE, in that order) had mean Resnik semantic similarities across 16 pairs of networks that were within 10% of each other, with no clear-cut winner. In Figure 4, we replot the aligners using the Inverse Frequency NetGO score (which scores functional similarity rather than “correct” alignments). As can be seen, SANA scores highest, although HubAlign is a close second while CytoGEDEVO, WAVE, MAGNA, and LGRAAL also have respectable scores. All the other aligners (NATALIE, GHOST, Netal, and OptNetAlign) uniformly score almost zero. Although the ordering of the quality of these aligners is almost identical to that presented by the Resnik score in Mamano and Hayes (2017), the Inverse Frequency NetGO score much more clearly separates decent alignments from worthless ones.
6 Discussion and Conclusions
We have presented NetGO, a novel method of using Gene Ontology terms to score alignments of PPI networks. NetGO has several advantages: it is independent of the GO hierarchy, depending only upon the frequency of GO terms in the networks being aligned; it produces scores that scale well with existing methods of taxonomic similarity between species; it appropriately assigns a score near zero to random alignments, a property which no other method currently shares; it more clearly separates high from low quality alignments; and it is easily extensible to alignments between multiple PPI networks, which is a fast-growing area of biological network alignment.
NetGO is the first GO-centered measure (as opposed to protein-centered), which means that the score is computed as the sum of the contribution of each GO term, rather than the sum of the contribution of each pair of aligned proteins. This new approach to evaluating biological similarity better reflects the global nature of a network alignment, rather than considering it as a set of independent pairs of proteins.
Similarly to how topological measures can be divided into global ones (S3, EC, WEC, etc.) and local ones (graphlet similarity, importance, etc.), so far all biological measures were strictly local. NetGO is the first global biological measure, and as in the case of topological ones, it proves to be superior to local ones in evaluating entire alignments.
Acknowledgement
NM was supported by the Balsells fellowship.
References
- Aladağ and Erten (2013) Aladağ, A. E. and Erten, C. (2013). Spinal: scalable protein interaction network alignment. Bioinformatics, 29(7), 917–924.
- Chabalier et al. (2007) Chabalier, J., Mosser, J., and Burgun, A. (2007). A transversal approach to predict gene product networks from ontology-based similarity. BMC bioinformatics, 8(1), 235.
- Chindelevitch et al. (2013) Chindelevitch, L., Ma, C.-Y., Liao, C.-S., and Berger, B. (2013). Optimizing a global alignment of protein interaction networks. Bioinformatics, 29(21), 2765–2773.
- Clark and Kalita (2015) Clark, C. and Kalita, J. (2015). A multiobjective memetic algorithm for ppi network alignment. Bioinformatics, 31(12), 1988–1998.
- Cook (1971) Cook, S. A. (1971). The complexity of theorem-proving procedures. In Proceedings of the Third Annual ACM Symposium on Theory of Computing, STOC ’71, pages 151–158, New York, NY, USA. ACM.
- Couto et al. (2005) Couto, F. M., Silva, M. J., and Coutinho, P. M. (2005). Semantic similarity over the gene ontology: family correlation and selecting disjunctive ancestors. In Proceedings of the 14th ACM international conference on Information and knowledge management, pages 343–344. ACM.
- Crawford and Milenković (2015) Crawford, J. and Milenković, T. (2015). Great: graphlet edge-based network alignment. In Bioinformatics and Biomedicine (BIBM), 2015 IEEE International Conference on, pages 220–227. IEEE.
- Davis et al. (2015) Davis, D., Yaveroğlu, O. N., Malod-Dognin, N., Stojmirovic, A., and Pržulj, N. (2015). Topology-function conservation in protein-protein interaction networks. Bioinformatics.
- Dice (1945) Dice, L. R. (1945). Measures of the amount of ecologic association between species. Ecology, 26(3), 297–302.
- El-Kebir et al. (2011) El-Kebir, M., Heringa, J., and Klau, G. W. (2011). Lagrangian relaxation applied to sparse global network alignment. In IAPR International Conference on Pattern Recognition in Bioinformatics, pages 225–236. Springer.
- Falcon and Gentleman (2007) Falcon, S. and Gentleman, R. (2007). Using gostats to test gene lists for go term association. Bioinformatics, 23(2), 257–258.
- Gilbert (2002) Gilbert, D. G. (2002). eugenes: a eukaryote genome information system. Nucleic acids research, 30(1), 145–148.
- Guzzi et al. (2012) Guzzi, P. H., Mina, M., Guerra, C., and Cannataro, M. (2012). Semantic similarity analysis of protein data: assessment with biological features and issues. Briefings in bioinformatics, 13(5), 569–585.
- Hashemifar and Xu (2014) Hashemifar, S. and Xu, J. (2014). HubAlign: an accurate and efficient method for global alignment of protein–protein interaction networks. Bioinformatics, 30(17), i438–i444.
- Jiang and Conrath (1997) Jiang, J. J. and Conrath, D. W. (1997). Semantic similarity based on corpus statistics and lexical taxonomy. arXiv preprint cmp-lg/9709008.
- Kuchaiev and Pržulj (2011) Kuchaiev, O. and Pržulj, N. (2011). Integrative network alignment reveals large regions of global network similarity in yeast and human. BIOINFORMATICS, 27, 1390–1396.
- Kuchaiev et al. (2010) Kuchaiev, O., Milenković, T., Memišević, V., Hayes, W., and Pržulj, N. (2010). Topological network alignment uncovers biological function and phylogeny. Journal of The Royal Society Interface, 7(50), 1341–1354.
- Li et al. (2010) Li, B., Wang, J. Z., Feltus, F. A., Zhou, J., and Luo, F. (2010). Effectively integrating information content and structural relationship to improve the go-based similarity measure between proteins. arXiv preprint arXiv:1001.0958.
- Lin et al. (1998) Lin, D. et al. (1998). An information-theoretic definition of similarity. In ICML, volume 98, pages 296–304. Citeseer.
- Malek et al. (2016) Malek, M., Ibragimov, R., Albrecht, M., and Baumbach, J. (2016). Cytogedevo—global alignment of biological networks with cytoscape. Bioinformatics, 32(8), 1259–1261.
- Malod-Dognin and Pržulj (2015) Malod-Dognin, N. and Pržulj, N. (2015). L-graal: Lagrangian graphlet-based network aligner. Bioinformatics.
- Mamano and Hayes (2017) Mamano, N. and Hayes, W. (2017). Sana: Simulated annealing far outperforms many other search algorithms for biological network alignment. Bioinformatics, 0(0), 8.
- Martin et al. (2004) Martin, D., Brun, C., Remy, E., Mouren, P., Thieffry, D., and Jacq, B. (2004). Gotoolbox: functional analysis of gene datasets based on gene ontology. Genome biology, 5(12), R101.
- Memisevic and Pržulj (2012) Memisevic, V. and Pržulj, N. (2012). C-graal: Common-neighbors-based global graph alignment of biological networks. Integr. Biol., 4, 734–743.
- Milenković et al. (2010) Milenković, T., Ng, W. L., Hayes, W., and Pržulj, N. (2010). Optimal network alignment with graphlet degree vectors. Cancer Informatics, 9, 121–137.
- Mistry and Pavlidis (2008) Mistry, M. and Pavlidis, P. (2008). Gene ontology term overlap as a measure of gene functional similarity. BMC bioinformatics, 9(1), 327.
- NCBI (2016) NCBI, R. C. (2016). Database resources of the national center for biotechnology information. Nucleic acids research, 44(D1), D7.
- Neyshabur et al. (2013) Neyshabur, B., Khadem, A., Hashemifar, S., and Arab, S. S. (2013). Netal: a new graph-based method for global alignment of protein–protein interaction networks. Bioinformatics, 29(13), 1654–1662.
- Patro and Kingsford (2012) Patro, R. and Kingsford, C. (2012). Global network alignment using multiscale spectral signatures. Bioinformatics, 28(23), 3105–3114.
- Pesquita et al. (2008) Pesquita, C., Faria, D., Bastos, H., Ferreira, A. E., Falcão, A. O., and Couto, F. M. (2008). Metrics for go based protein semantic similarity: a systematic evaluation. BMC bioinformatics, 9(5), S4.
- Pesquita et al. (2009) Pesquita, C., Faria, D., Falcao, A. O., Lord, P., and Couto, F. M. (2009). Semantic similarity in biomedical ontologies. PLoS comput biol, 5(7), e1000443.
- Popescu et al. (2006) Popescu, M., Keller, J. M., and Mitchell, J. A. (2006). Fuzzy measures on the gene ontology for gene product similarity. IEEE/ACM Transactions on computational biology and bioinformatics, 3(3), 263–274.
- Rada et al. (1989) Rada, R., Mili, H., Bicknell, E., and Blettner, M. (1989). Development and application of a metric on semantic nets. IEEE transactions on systems, man, and cybernetics, 19(1), 17–30.
- Resnik (1995) Resnik, P. (1995). Using information content to evaluate semantic similarity in a taxonomy. arXiv preprint cmp-lg/9511007.
- Resnik et al. (1999) Resnik, P. et al. (1999). Semantic similarity in a taxonomy: An information-based measure and its application to problems of ambiguity in natural language. J. Artif. Intell. Res.(JAIR), 11, 95–130.
- Schlicker et al. (2006) Schlicker, A., Domingues, F. S., Rahnenführer, J., and Lengauer, T. (2006). A new measure for functional similarity of gene products based on gene ontology. BMC bioinformatics, 7(1), 302.
- Singh et al. (2008) Singh, R., Xu, J., and Berger, B. (2008). Global alignment of multiple protein interaction networks with application to functional orthology detection. Proceedings of the National Academy of Sciences, 105(35), 12763–12768.
- Sun et al. (2015) Sun, Y., Crawford, J., Tang, J., and Milenkovic̀, T. (2015). Simultaneous optimization of both node and edge conservation in network alignment via WAVE. In M. Pop and H. Touzet, editors, Algorithms in Bioinformatics, volume 9289 of Lecture Notes in Computer Science, pages 16–39. Springer Berlin Heidelberg.
- The Gene Ontology Consortium (2008) The Gene Ontology Consortium (2008). The gene ontology project in 2008. Nucleic Acids Research, 36(suppl 1), D440–D444.
- Vijayan et al. (2015) Vijayan, V., Saraph, V., and Milenković, T. (2015). Magna++: Maximizing accuracy in global network alignment via both node and edge conservation. Bioinformatics, page btv161.
- Wu and Palmer (1994) Wu, Z. and Palmer, M. (1994). Verbs semantics and lexical selection. In Proceedings of the 32nd annual meeting on Association for Computational Linguistics, pages 133–138. Association for Computational Linguistics.