A deg2 blind survey for Cii], Ciii] and Civ at . II:
luminosity functions and cosmic average line ratios
Abstract
Recently, the Ciii] and Civ emission lines have been observed in galaxies in the early Universe (), providing new ways to measure their redshift and study their stellar populations and AGN. We explore the first blind Cii], Ciii] and Civ survey (, respectively) presented in Stroe et al. (2017). We derive luminosity functions (LF) and study properties of Cii], Ciii] and Civ line emitters through comparisons to the LFs of H and Ly emitters, UV selected star forming (SF) galaxies and quasars at similar redshifts. The Cii] LF at is equally well described by a Schechter or a power-law LF, characteristic of a mixture of SF and AGN activity. The Ciii] LF () is consistent to a scaled down version of the Schechter H and Ly LF at their redshift, indicating a SF origin. In stark contrast, the Civ LF at is well fit by a power-law, quasar-like LF. We find that the brightest UV sources () will universally have Ciii] and Civ emission. However, on average, Ciii] and Civ are not as abundant as H or Ly emitters at the same redshift, with cosmic average ratios of to H and to intrinsic Ly. We predict that the Ciii] and Civ lines can only be truly competitive in confirming high redshift candidates when the hosts are intrinsically bright and the effective Ly escape fraction is below 1 per cent. While Ciii] and Civ were proposed as good tracers of young, relatively low-metallicity galaxies typical of the early Universe, we find that, at least at , Civ is exclusively hosted by AGN/quasars, especially at large line equivalent widths.
keywords:
galaxies: high redshift, star formation active, luminosity function, quasars: emission lines, cosmology: observations1 Introduction
The star formation (SF) rate density of the Universe grows significantly from , reaching a peak at , but is then measured to decline steeply into the epoch of reionisation (e.g. Lilly et al., 1996; Madau et al., 1996; Hopkins & Beacom, 2006; Bouwens et al., 2011; Khostovan et al., 2015). Quasars undergo a similar number density evolution: the density of quasars increases up to , only to plummet at higher redshifts (e.g. Dunlop & Peacock, 1990; Warren et al., 1994; Richards et al., 2006; McGreer et al., 2013).
| Line | Volume | All | Comments | ||||||
|---|---|---|---|---|---|---|---|---|---|
| (Å) | (eV) | at FWHM | ( Mpc) | ( Mpc3) | (without ) | ||||
| Cii] | 2326 | 11.3 | 4.14 | 3 | 13 | 22 | SF at lower luminosities, AGN at higher luminosities | ||
| Ciii] | 1907, 1909 | 24.4 | 7.04 | 4 | 30 | 43 | mostly produced in SF galaxies | ||
| Civ | 1549, 1551 | 47.9 | 11.17 | 14 | 3 | 28 | almost exclusively trace quasars |
To track the evolution of galaxies across cosmic time, ideally one would use a single tracer of SF activity. Intrinsically the brightest emission line in Hii regions, the Ly line has been traditionally associated to SF activity and has a high excitation (13.6 eV, Veilleux, 2002). However, Ly is scattered by neutral hydrogen, making it easily absorbed by dust and difficult to escape the host galaxy (for a review see Hayes, 2015; Matthee et al., 2016; Sobral et al., 2017). While Ly emitters are typically thought to be low mass, blue, star-forming galaxies, AGN can also be powerful Ly sources. Indeed, there is mounting evidence that a large fraction of luminous Ly emitters are powered by AGN, especially at (Ouchi et al., 2008; Nilsson et al., 2009; Cowie et al., 2010; Matthee et al., 2017).
Across redshifts, Ly line has been widely used to select both SF galaxies and AGN. Ly has also been the prime way to spectroscopically confirm high-redshift candidates (e.g. Ono et al., 2012; Sobral et al., 2015; Zitrin et al., 2015b) and is used to obtain large samples through the narrow band (NB) technique (e.g. Ouchi et al., 2008; Konno et al., 2014; Matthee et al., 2015; Trainor et al., 2015; Konno et al., 2016; Santos et al., 2016). However, only a fraction of the emitter population selected through the NB technique are actual Ly at high redshift, while the remaining line emitters can be low-z contaminants. Historically, [Oiii] and [Oii] were considered the most important contaminants for Ly surveys at (e.g. Ouchi et al., 2008; Matthee et al., 2014), because they can have high (observed) equivalent widths (EW). However, this is much less of an issue for Ly surveys at , because the volume for e.g. [Oii] is very small. The most notable contaminants for Ly searches instead are Cii]2326 (from now on Cii]), Ciii]1907,1909 (from now on Ciii]) and Civ1549,1551 (from now on Civ) emitters (Sobral et al., 2017). Additionally, interpreting Ly-selected samples and studying their properties can be challenging because of Ly resonant scattering. It is therefore difficult to obtain physical characteristics of galaxies from Ly, such as correlating Ly luminosity with a SF rate (SFR) or BH accretion rate (BHAR) (e.g. Matthee et al., 2016, Calhau et al. in prep.).
The Ly escape fraction at fixed radius drops sharply towards the highest redshifts (over the range, e.g. Tilvi et al., 2016), which is explained by scattering through a partially neutral intergalactic medium (e.g. Treu et al., 2013; Dijkstra, 2014), making Ly emission much more extended (Santos et al., 2016). The scattering of Ly at the very highest redshifts effectively means Ly slit spectroscopy might not be the best choice for confirming candidates selected with the Lyman-break technique. For example, Vanzella et al. (2014) invested h of Very Large Telescope time on a single ‘normal’ Lyman-break galaxy without any detection of Ly. Most high redshift candidates are selected from deep, but small area fields, and are not bright enough in emission lines to be followed up efficiently with spectroscopy.
After being detected in a handful of high redshift sources (up to , all of which were also Ly emitters), Ciii] (ionisation potential of 24.4 eV, Veilleux, 2002) and Civ (47.9 eV) were proposed by Stark et al. (2015a) as an alternative way to identify galaxies at the highest redshifts () with upcoming telescopes such as the James Webb Space Telescope. Therefore, even though Ciii] and Civ lines are on average weaker than Ly, they seem to be sufficiently prominent in young, sub-solar metallicity () galaxies expected at high redshift and will not suffer from scattering by neutral hydrogen at , thus boosting the observed Ciii]/Ly and Civ/Ly ratios (for single-star, ‘normal’ stellar populations at solar metallicity).
Theory predicts that carbon emission lines, such as Cii], Ciii] and Civ, should mainly be produced in the broad line region of active galactic nuclei (AGN, Osterbrock & Ferland, 2006). However more recent work suggests a different origin for these lines. Models and observations show that Ciii] and Civ are the brightest UV lines after Ly in SF galaxies at redshift (Shapley et al., 2003; Stark et al., 2014; Gutkin et al., 2016; Feltre et al., 2016). While Ciii] is mainly fostered in lower-metallicity, lower-mass SF galaxies or starbursts (Bayliss et al., 2014; Rigby et al., 2015; Jaskot & Ravindranath, 2016; Du et al., 2017), Civ can in principle be produced by massive stars in a very young SF galaxy (Stark et al., 2014; Mainali et al., 2017; Schmidt et al., 2017).
However, our knowledge of the statistical properties of Cii], Ciii] and Civ emitters is still very limited since observations mostly targeted either lensed sources, spectroscopically selected sources or sources whose redshift was already known from Ly. Furthermore, no sources have been found at high redshift using just the Ciii] or Civ line emission. If the Ciii] and Civ lines are to be used in the future to select high redshift galaxies, we should also aim to understand what they actually trace and how strong we can expect them to be. It is thus crucial to unveil their luminosity functions (LF) and cosmic evolution of these emitters.
We have embarked on a project to survey Cii], Ciii] and Civ emitters in a blind, uniform way, over the COSMOS and UDS field. In Stroe et al. (2017a), we study the properties of individual Cii], Ciii] and Civ sources and characterise their nature. We find that Cii] emission at is produced in disky, SF galaxies at fainter fluxes, while at larger fluxes Cii] is triggered in Seyfert-like galaxies, with a stellar disk and AGN core. Our work unveils that Ciii] emitters have SF morphologies and have UV and optical colours consistent with a general SF population, while Civ emitters are all young, blue, actively-accreting quasars.
After presenting our sample in Stroe et al. (2017a) and discussing its reliability and source properties, in this paper (Paper II), we focus on the other statistical properties of Cii], Ciii] and Civ emitters. We present the first LFs, which enable us to compare the number densities of Cii], Ciii] and Civ emitters with the distribution of H and Ly emitters, UV-selected galaxies and quasars. We also discuss the implications of these high ionisation lines at high redshift and provide cosmic average ratios.
Our paper is structured in the following way: in Sections 2, 3 and 4 we present the sample of Cii], Ciii] and Civ emitters, while in Section 5 we study the LFs and compare them to the H, Ly, galaxy and quasar LFs. In Section 6 we discuss the implications of our statistical results for Cii], Ciii] and Civ detections. Our conclusions can be found in Section 7.
We use a flat CDM cosmology with km s-1 Mpc-1, and . Magnitudes are in the AB system.
2 Parent sample
The sample of Cii], Ciii] and Civ emitters is drawn from the CALYMHA survey, which was designed to mainly study Ly emitters at (Matthee et al., 2016; Sobral et al., 2017). The data we are using comes from a NB filter (NB392, central wavelength Å and width Å) mounted on Wide Field Camera on the Isaac Newton Telescope111http://www.ing.iac.es/Astronomy/telescopes/int/ to survey an area of deg2 across the COSMOS and UDS fields. CALYMHA captured many lines at lower redshift apart from the target Ly, down to a limiting flux of erg s-1 cm-2 and a limiting observed EW limit of 16 Å. As was also noted in Sobral et al. (2017), in Stroe et al. (2017a), we demonstrated that a good fraction of the emitters selected through the NB survey are actually Cii], Ciii] and Civ emitters. Apart from Ly, Cii], Ciii] and Civ, the sample also contains emitters such as [Oii] (), Mgi and Mgii] () in lower numbers (for details see Sobral et al., 2017).
3 Selecting Cii], Ciii] and Civ emitters
In Stroe et al. (2017a), we selected Cii], Ciii] and Civ emitters using spectroscopic and photometric redshifts (see Table 1; Ilbert et al., 2009; Cirasuolo et al., 2010). It is important to note that our selection was favouring purity of the sample, rather than completeness. We therefore had conservative photometric redshift ranges and removed any sources that were chosen through colour-colour selections as Ly by Sobral et al. (2017).
Our final sample includes Cii], Ciii] and Civ emitters chosen based on or . The nature of sources without spectroscopic or photometric redshifts is uncertain (a total of 171 sources). Photometric redshifts are not available, for example, for sources which are faint in the continuum, sources in masked areas around bright stars in deep optical data (in the ancillary catalogues) or for faint sources with unusual colours because they are AGN. Deriving photometric redshifts for AGN is challenging. In the COSMOS field, the availability of medium band filters increased the reliability of photometric redshift for AGN powered sources such as some of the Cii] emitters and Civ. However, in UDS such medium band filter measurements are not available to help constrain the fit.
In order to increase our completeness for the purpose of building reliable LFs, in addition to our secure sources with and , we need to estimate how many of sources without colour information might be Cii], Ciii] or Civ emitters. We therefore derive fractions to describe the probability of a source to be a Cii], Ciii] or Civ when no secure redshift information is available. In building emitter LFs, these fractions are employed when adding sources to luminosity bins (see Section 4), but we also show our results are not sensitive (within error bars), when we restrict the analysis to the most secures sources.
3.1 Cii], Ciii], Civ fractions as function of observed flux
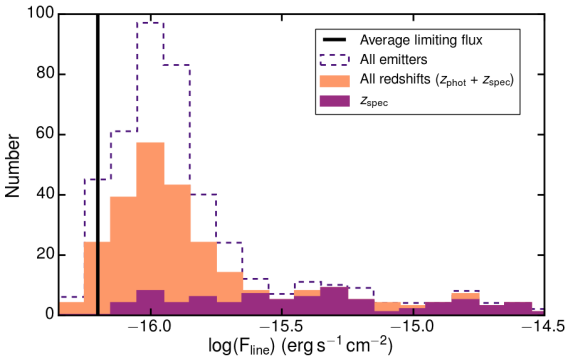
By using the photometric and spectroscopic redshifts, we study how the fraction of emitters which are Cii], Ciii] and Civ depends on the observed line flux, in a similar fashion to the statistical method of Stroe et al. (2014). The fraction of a particular C emitter is calculated as the number of this particular emitter type in a flux bin divided by the total number of emitters including all lines. For example for Cii] emitters in a particular bin, this is calculated as . At the brightest fluxes we are close to spectroscopic completeness ( erg s-1 cm-2), while at the fainter fluxes a large fraction of sources has photometric or spectroscopic redshifts (see Fig. 1). This investigation is most relevant for faint sources, to attain a higher completeness in LFs at faint fluxes and avoid selection incompleteness.
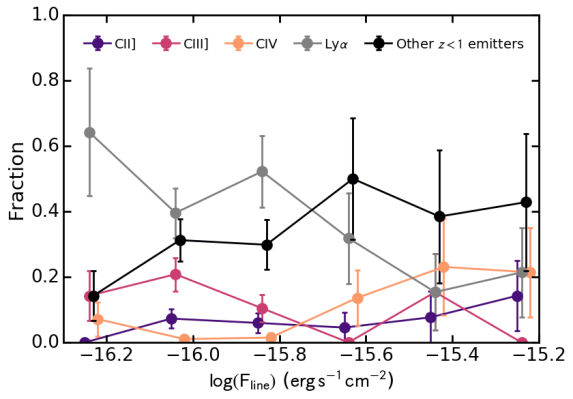
We separate the emitter population into secure Cii], Ciii] and Civ and group the other emitters together. We note that some of the ‘other’ emitters could still be C emitters, given our conservative redshift cuts. We focus on the fluxes below erg s-1 cm-2, where the number statistics in each flux bin are good enough to derive reliable fractions (Fig. 2). At large fluxes of erg s-1 cm-2, Carbon species represent per cent of the population (see also Sobral et al., 2017). There is a trend of increasing Cii] and Civ fractions and almost constant Ciii] fraction with increasing line flux. We extrapolate the fractions for the few sources without redshifts at fluxes erg s-1 cm-2.
Fractions are only valid for studying statistical, average properties such as LFs, and cannot be used to describe properties of individual sources. Our results depend little on the way we extrapolate the results to higher luminosities or if we vary the fractions within the error bars. We tested a few ways of extrapolating at bright luminosities: we applied a function fit to the available bins, we used the values in the bins directly and for the bright luminosities simply used the value in the brightest bin and also applied fractions to all the UDS emitters, given their less reliable photometric redshifts in classifying the emitters (see also Section 3). We found that this did not significantly affect the results and use the function fit to the fractions when deriving LFs.
4 Methods
We derive the line luminosity for the Cii], Ciii] and Civ sources from the line flux:
| (1) |
where line is Cii], Ciii] or Civ and is the luminosity distance at the redshift of each line of interest (see Table 1). We note that some of our emitters have large EWs possibly caused by offsets between the main line emitting regions and the underlying stellar light (Stroe et al., 2017a). However, one of the main aims of this work is to study LFs and our samples are ideal for this purpose, since they are flux/luminosity selected, irrespective of the continuum. Therefore, the measurement of fluxes and luminosities is a more reliable measurement compared to EW, as it does not depend on geometrical effects in the same way the EW estimates do (see discussion in Stroe et al., 2017a).
For the purpose of building LFs, we bin the emitters based on their luminosity. For the sources with either photometric or spectroscopic redshifts, we add them to the bin with a weight of 1. For the other emitters, the sources were added with a weight according to the fractions from Fig. 2. The total number of line emitters, obtained by adding the number of secure Cii], Ciii] and Civ emitters as well as the number obtained through the fractions, is listed in Table 1.
We derive LFs for the Cii], Ciii] and Civ emitters down to 30 per cent completeness. We correct the LF for incompleteness using the completeness curves as function of line flux from Sobral et al. (2017), as well as correct the volumes for the real shape of the filter profile, using the method described in Sobral et al. (2012) and Sobral et al. (2017).
We obtain number density values by dividing the binned numbers of sources by the correct cosmic volume at the emitter redshift (see Table 1). To test the effects of the binning choice, we also resample the data with random choices of bin centres and widths. We settle on the binning choice which best reproduces the average shape of the individual binning choices. The final choice of bin width for all three emitter types is , given the low number statistics.
We use a Schechter (1976) function to fit the number densities using a least-squares approach. The errors are Poissonian, with 20 per cent added to account for imperfect fractions and for completeness and filter profile correction errors.
| (2) |
where is the faint end slope of the LF, is the characteristic number density of the emitters and is the characteristic emitter luminosity. Given the depth of our data, we also fix the faint end slope of the fit to . A steep faint end slope of was found appropriate for the Ly LF though-out redshifts since as well as the H LF at (e.g. Cowie et al., 2010; Sobral et al., 2013; Gómez-Guijarro et al., 2016; Konno et al., 2016; Sobral et al., 2017).
We also fit with a power-law, when the data enables it:
| (3) |
where is the slope of the power-law and is the intercept at 0 number density.
Note that a power-law fit to the fainter luminosity bins should be consistent with the faint-end slope of the Schechter fit. Because of the different definitions of the two functions the relationship between the two slopes is .
As mentioned before (Section 3.1), we tested a few ways to set the weights for the sources with fractions (direct values, interpolation, fitting a curve) and found no significant influence on the LF: the fit parameters for all the choices were within error bars. We also produced LFs using only the COSMOS data (which has a volume about 7 times than UDS) and found that removing the UDS data does not affect the results.
5 Luminosity functions
Here we present the Cii], Ciii] and Civ LFs and compare theme with the H, Ly, galaxy and quasar UV LFs. We use such comparisons to further investigate the nature of the sources as a whole.
5.1 Cii] luminosity function
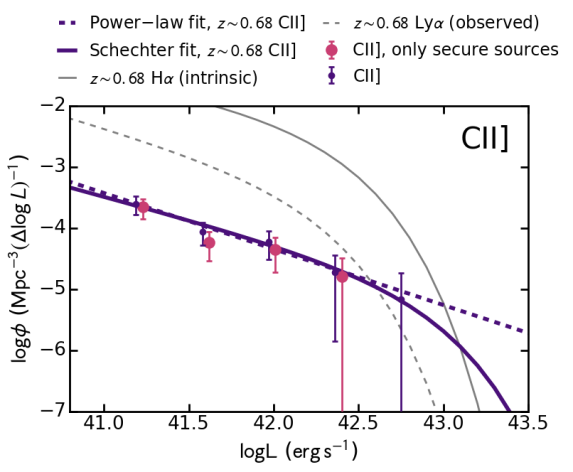
We fit our Cii] LF with a Schechter function (reduced , see Fig. 3), however we cannot constrain the bright end very well, as the usual Schechter number density drop might be located beyond luminosities we can directly probe ( erg s-1). Note the low number statistics in these bright regimes: we have an equivalent of sources between and erg s-1. Sources added through fractions cannot be responsible for the high densities at these bright luminosities, as 2 sources are spectroscopically confirmed and 1 has a photometric redshift. The bright end behaviour therefore does not change if we only consider the secure sources (see Fig. 3). Given the shape of the number density distribution, the Cii] bins are also well fit by a power-law with slope with . For most binning choices we explored, the for the power-law and the Schechter fit were within per cent of each other.
| Line | ||||
|---|---|---|---|---|
| (Mpc-3) | (erg s-1) | |||
| Cii] | ||||
| Ciii] |
5.2 Ciii] luminosity function
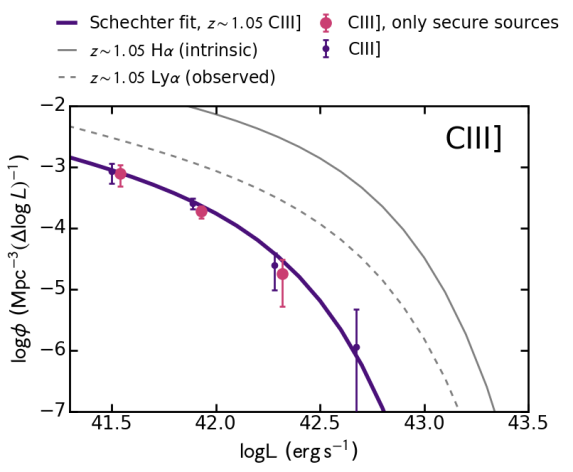
The Ciii] LF is well fit by a Schechter function (, see Table 2 and Fig. 4). Given the large number densities and smaller Poissonian errors, the Ciii] Schechter fit is the most secure out of all three Carbon emitters types, having the smaller errors on the LF parameters. The robustness of the bright sources above erg s-1 is confirmed through spectroscopy or photometric redshifts. Note the high and completeness of Ciii] emitters with 34 confirmed sources and the low overall expected fraction ( per cent) of Ciii] emitters compared to the entire emitter population selected with the CALYMHA NB survey. Because of this, including or excluding the uncertain sources through fractions does not significantly affect the results.
For completeness, we also fit a power-law function to the Ciii] data which for most of the binning choices does not converge and in all other cases the is a factor of a few worse than the Schechter fit.
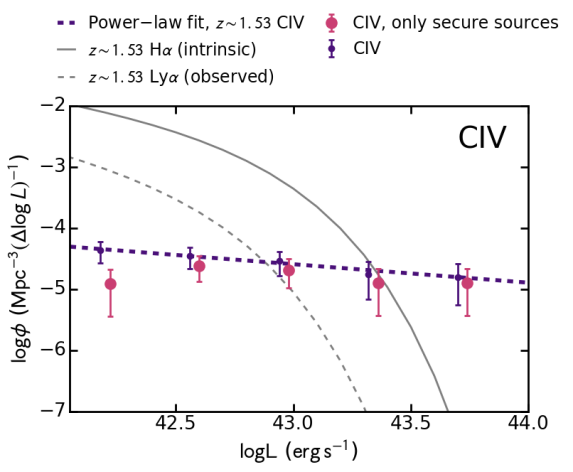
5.3 Civ luminosity function
A Schechter function with fixed to fits poorly the Civ data at . Due to the lack of a drop in number density at bright luminosities attempting to fit Schechter function resulted in a completely unconstrained characteristic and density . Our minimisation did not converge and we were not able to find a minimum over the wide parameter space we probed (from of to and in the range).
| Line | |||
|---|---|---|---|
| (erg s-1) | |||
| Cii] | |||
| Civ |
| Line | Fit type | range | Cosmic line ratio | ||||
|---|---|---|---|---|---|---|---|
| (erg s-1 Mpc-3) | (erg s-1) | C/H (observed) | C/Ly (observed) | C/Ly (intrinsic) | |||
| Cii] | Schechter | full | |||||
| Schechter | |||||||
| Power-law | 0.025 | 0.24 | 0.003 | ||||
| Ciii] | Schechter | full | |||||
| Schechter | |||||||
| Civ | Schechter† | full | |||||
| Schechter† | |||||||
| Power-law | 0.086 | 0.71 | 0.010 | ||||
-
•
† Given the very flat power-law fit to the Civ LF, we decided, for the purposes of calculating cosmic densities, to also fit a Schechter fit. This avoids overestimating the luminosity density through the contribution of rare sources in a luminosity regime we are not directly probing.
The LF is well described by a power-law with (, see Fig. 5), similarly to the LF of quasars which are also power-law like (see also Section 5.6). Using the slope of the power-law fit as input for the faint end slope of the Schechter function, we get a fit of similar to the power law fit, however with an erg s-1, which is beyond the range we can probe. Over the range of luminosities we measure, families of best-fit Schechter functions are indistinguishable from a power-law, while there is a single, well determined solution for a power-law. Hence, a power law is a simpler fit to the data.
We note that not including unclassified sources through fractions slightly changes the values of the density bins. The most affected sources are those fainter in the BB. As discussed in Section 3, it is not surprising that fainter Civ sources might not have photometric redshifts. At the bright end however, most sources are spectroscopically confirmed. The flat power law fit () might suggest the existence of Civ sources beyond erg s-1. However given the volume of our survey, the power-law LF indicates that at maximum 1 source per luminosity bin can be expected, which is in line with our non-detections beyond erg s-1. We have also fitted a power law by excluding the lower luminosity bin which might be affected by incompleteness and found that the fit parameters are perfectly consistent with those from the fit with all bins. A NB survey of a larger volume would clarify the number densities of the brightest emitters.
5.4 Comparison with H and Ly
We interpolate between the H LFs at from Stroe & Sobral (2015) and from Sobral et al. (2013) to the redshifts of our Cii], Ciii] and Civ emitters. We leave out the data point from Sobral et al. (2013), since the volume was small, resulting in a larger uncertainty. Gómez-Guijarro et al. (2016) present a sample of faint H emitters at a very similar redshift to our Cii] sample ( versus ). The authors constrain the faint end slope of the H LF at to which is between the values at measured by Shioya et al. (2008) and that at measured by Sobral et al. (2013) and close to the value we derive through interpolation ( versus ). Note that these LFs are corrected for intrinsic dust extinction of the H line, as well as for all incompleteness.
For Ly, we interpolate to our reference redshifts, using the results at from Cowie et al. (2010), (Barger et al., 2012), from Konno et al. (2016) and Sobral et al. (2017) and and from Ouchi et al. (2008). We corrected the to fall on the expected evolution of and as shown in Konno et al. (2016). We note that our Ly LFs are observed quantities. The effect of the escape fraction of Ly is further discussed in Section 5.5. Note that we do not show the Ly power law component at high luminosities (Konno et al., 2016; Sobral et al., 2017; Matthee et al., 2017), but we do include it in the luminosity densities in the next section. The interpolated H and Ly LF parameters can be found in Table 5.
At fluxes corresponding to , the number densities of Cii] emitters are consistent with the Schechter component of Ly emitters at the same redshift, but significantly below those of H. If the power-law nature of the LF is valid for luminosities beyond those we can probe with our data, that would imply that bright Cii] emitters could be just as numerous than H and Ly, which also have strong power-law components. This however is quite surprising and physically hard to explain. It is thus likely that a Schechter function would provide a better fit at the brightest luminosities which we cannot probe with our current data. Assuming that H and Ly at this redshift are mostly produced in SF galaxies, the prevalence of bright Cii] could indicate a different origin, that of AGN powering.
At , our Ciii] emitters have 20 per cent of the number density of Ly and only about 3 per cent that of H emitters. This could indicate that Ciii] emission originates in SF galaxies such as those producing Ly and H, but affected by typical line ratios expected from SF galaxies of a few per cent in relation to e.g. H.
At the brightest luminosities, given the very flat LF, Civ number densities exceed those predicted by the Schechter component of the H and Ly, further suggesting a quasar origin for the emission. At , the Ly and H LF have a power-law distribution beyond , similar to the Civ distribution (e.g. Sobral et al., 2016; Matthee et al., 2017). This is consistent with the typical joint detections of Ly, H and Civ tracing AGN at bright luminosities.
5.5 Observed cosmic average line ratios to H and Ly
We integrate the LFs to obtain cosmic average ratios with respect to H and Ly. These are useful for estimating the average relative emission line ratios of Cii], Ciii] and Civ emitters to H and Ly and to compare with theoretical predictions from AGN, SF models and with observations of individual sources.
The Ly LF has been shown to have a power-law bright end tail which for simplicity we did not included in our LFs (Konno et al., 2016; Matthee et al., 2017; Sobral et al., 2017). However, for the purpose of luminosity densities and cosmic ratios, this contribution is important. We therefore use the results at from Sobral et al. (2017), to estimate as function of limiting integration luminosity, how much the power-law component contributes to the total luminosity density of Ly. We use these values to correct our Schechter .
Ly is scattered by neutral hydrogen and/or easily absorbed by dust and thus only a fraction escapes the galaxies. Sobral et al. (2017) computed the cosmic average Ly escape fraction of per cent at for the arcsec apertures we are using in this paper (see also e.g. Hayes et al., 2010). This was achieved by comparing the ratios of the Ly and H luminosity densities versus the case B recombination value of 8.7. Since the escape fraction has been shown to evolve with redshift, we use the same method as Sobral et al. (2017) to estimate the Ly escape fraction at our redshifts of interest using the interpolated LFs and find values of per cent. These are in line with the redshift dependent parametrisation of the Ly escape fraction that Hayes et al. (2011) derived using UV and emission line luminosity functions. We use our derived escape fractions to correct the observed luminosity densities of Ly to intrinsic ones. We therefore also obtained line ratios between Cii], Ciii] and Civ to intrinsic values of Ly.
We list the luminosity densities in Table 4, where we integrate the LFs fully and also within ranges probed directly by our data.
Note that the cosmic ratio values are quite uncertain, because of the unknowns in deriving the LF parameters as well as the interpolation performed for H and Ly to obtain LFs at our redshifts of interest. For the Schechter fits, we derive errors as ranges in allowed by the error bars of the luminosity densities . Note that we assume that the H and Ly densities are perfectly known, so the errors reported for the comic ratios are underestimated.
We find a typical ratio between Cii] and H of , while the observed Cii] to Ly ratio is higher at . This latter value is higher than the average for quasars which is (Vanden Berk et al., 2001). Cii] is therefore very weak in quasars compared to Ly, indicating our Cii] are not quasars, but probably slightly less active AGN.
The average Ciii] line is weak compared to H (ratio of ), in line with expectations for SF and well below AGN predictions from cloudy (v 13.03) photo-ionisation modelling (Alegre et al. in prep). However, Ciii] is non-negligible compared to observed Ly with a ratio of . The observed cosmic average line ratio of Ciii] to Ly is consistent with the average for quasars (0.16, Vanden Berk et al., 2001) and a bit lower compared to results from and studies (Erb et al., 2010; Stark et al., 2015b, 2017). See however our discussion in Section 6, where we show that once we take into account the Ly escape fraction the values are consistent. Especially at the bright end where the quasar ratios are measured, Ciii] might therefore be produced in AGN, however at the faint-end, another powering source, such as SF, would be necessary to maintain such a high cosmic ratio to Ly.
Civ at is weak compared to H (ratios of ). Our Civ/H ratios are much higher than those implied for SF from cloudy modelling (with expected values of , Alegre et al. in prep). Our average ratios to Ly are relatively large, in the range of , depending on the range for integration, but consistent with those measured for quasars (0.25, Vanden Berk et al., 2001). This further supports a scenario where Civ is mainly powered by AGN. If the high number densities of bright Civ compared to Ly are maintained at high redshift, large area surveys of Civ could find suitable bright candidates for spectroscopic follow up.
5.6 Comparison with the quasar and galaxy UV luminosity functions
Motivated by the distinct quasar-like properties unveiled for our Civ and possible AGN nature of bright Ciii] emitters, we further investigate their nature by comparing their UV magnitudes to other galaxy/AGN populations.
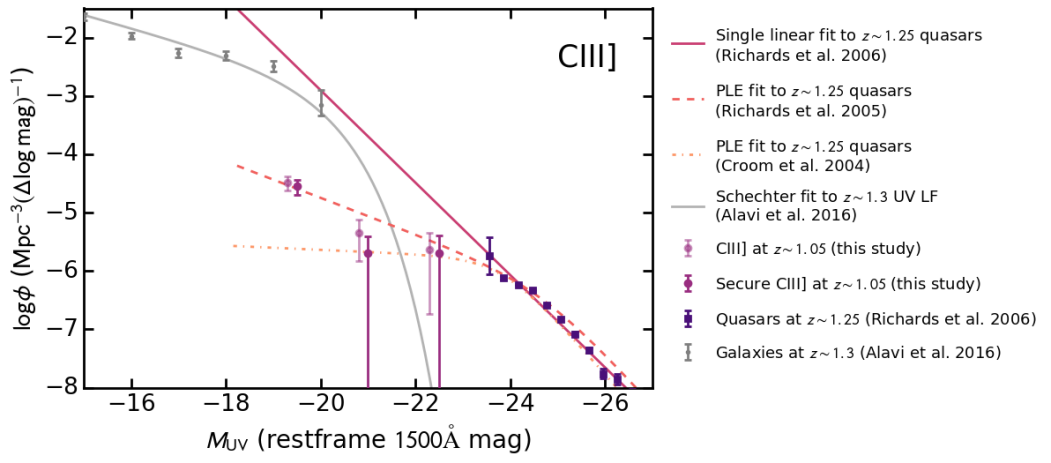
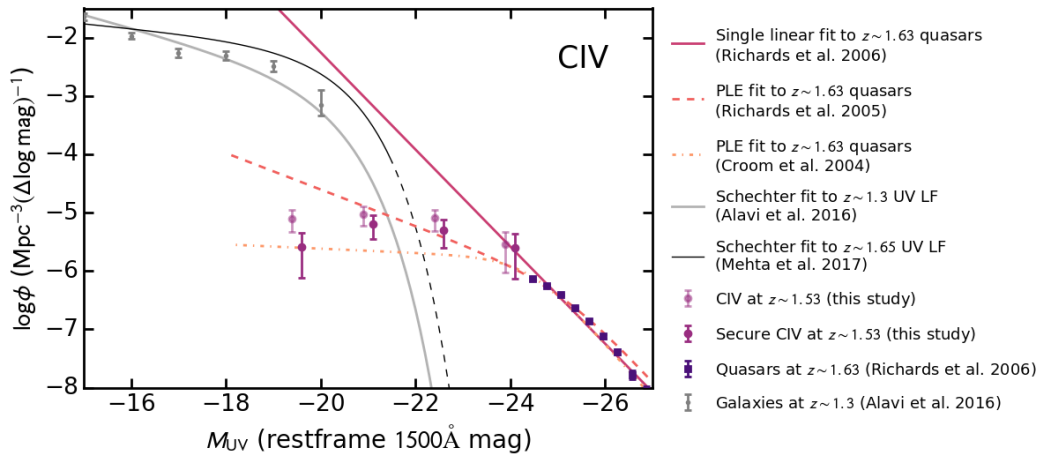
We build a Ciii] and Civ restframe UV LF, using the method described in Section 4. We use band (equivalent to about 1500 Å restframe wavelength) as all our emitters have a measured magnitude in this band. We apply our line flux completeness curve and restrict the LF to the range where the detections are per cent complete, i.e. apparent magnitudes brighter than 222This was chosen following http://terapix.iap.fr/cplt/T0007/table_syn_T0007.html. The resulting Ciii] LF can be seen in Fig. 6 and the Civ LF in Fig. 7.
For comparison, we use the binned quasar values from Richards et al. (2006) at and for Ciii] and Civ, respectively, transformed into the restframe Å magnitude using the relation provided in the paper (eq. 3). We also compare to the single power-law fit from Richards et al. (2006) and the broken power law fits from Croom et al. (2004) and Richards et al. (2005), which assume a pure luminosity evolution (PLE). Over the range probed by the data from Richards et al. (2006), all three models fit well, as their predictions differ mostly at the faint end. We also overplot the UV galaxy LF at from Alavi et al. (2016) and at from Mehta et al. (2017).
In the case of Ciii], including the sources added through fractions does not significantly affect the results. Note however that since we used observed band data for Ciii], this translates to a slightly redder restframe magnitude than the data we use for comparison. Our Ciii] UV LF is slightly below the PLE fit to quasar densities (Richards et al., 2006), but probes a much fainter regime characteristic of SF galaxies. At magnitudes below , the fraction of SF galaxies that have Ciii] above our EW threshold drops from 100 per cent at , down sharply to about 2 per cent at mag. This means that UV sources which are intrinsically bright, with UV luminosities brighter than will also be Ciii] emitters. These results could further support the scenario emerging from the optical, X-ray and FIR data presented in Stroe et al. (2017a) that Ciii] is consistent with SF, but the brightest emitters are powered by AGN.
When compared to the quasar luminosity densities inferred from the large, but shallow SDSS survey from Richards et al. (2006), our Civ data match well, but cover fainter restframe UV magnitudes. Our Civ data points best match a broken power law PLE LF. Not including the sources with uncertain Civ nature, which are added through fractions, affects the density values. This leads to a flattening at the faint magnitudes, further supporting our supposition in Section 5 that the sources without photometric redshifts are preferentially those which are faint in the continuum. Some of our fainter (UV luminosities from to ) Civ emitters are in the galaxy regime probed by Alavi et al. (2016), but have much lower number densities (at least 2 orders of magnitude lower at magnitudes fainter than ). The typical ratios to the UV galaxy densities at magnitudes fainter than are of the order of per cent. This means that Civ will only be produced in a very small fraction of faint galaxies at . At faint magnitudes, Civ might therefore be produced in SF but in very small fractions. This is in line with theory which suggests massive stars can contribute modestly to Civ production (e.g. Feltre et al., 2016). The difference between the Civ and Lyman break, UV selected LF further suggests Civ is not a common occurrence in all galaxies and is not produced in large quantities in normal, SF galaxies at least at . The bright magnitude distribution however, indicates that Civ traces a very similar population to quasars.
6 Discussion
After unveiling the nature of Cii], Ciii] and Civ emitters from the point of view of individual multiwavelength properties in Stroe et al. (2017a), here we investigate their abundance by comparing to similar measurements for better studied emission lines, along with the galaxy and quasar UV luminosity functions.
6.1 Cii] emitters at
The Cii] LF can be fit with either a Schechter-like LF or a power-law fit, which might suggest that Cii] emitters may be a mix of a SF population and AGN activity (Fig. 3). Especially at the bright end, a power-law shape of an LF has been shown to describe the data better in the case of mixed population of SF at fainter fluxes and AGN at bright fluxes as in the case of high-redshift Ly and H emitters (e.g. Konno et al., 2016; Sobral et al., 2016, 2017; Matthee et al., 2017). As we discussed in Stroe et al. (2017a), Cii] emitters at fainter fluxes are most likely dominated by SF, given their UV and optical colours and morphologies, while the bright Cii] emitters have Seyfert-like optical morphologies, with a disk and a bright nucleus and also have X-ray detections, which clearly indicate they host an AGN. Therefore, the mixed population nature of Cii] emitters at is not only supported by individual properties, but is also revealed in the relative numbers of emitters found at each luminosity range.
The number densities of Cii] sources are much smaller than Ly and H (Fig. 3). The cosmic average line ratio of Cii] is only about per cent of H and about per cent of the intrinsic Ly (Table 4, Fig. 3). At higher redshifts a power law tail is indeed observed in the distribution of bright H and Ly emitters and can be associated with AGN. However, this effect has not yet been seen at lower redshifts with large surveys designed to capture the bright end well (e.g. H LF at and , Stroe & Sobral, 2015; Sobral et al., 2013). This might indicate that at these moderate redshifts, Cii] can be significantly triggered in the shocks around more evolved, ‘maintenance-mode’ galaxies which are accreting at smaller rates (e.g. such as active galaxies with radio jets De Breuck et al., 2000). This is also supported by the very high ratio of Cii] to Ly, which is high when compared to averages for quasars. This again might suggest that Cii] is not triggered in the quasar phase. We could interpret as a delayed effect of AGN activity: Cii] might respond much at a phase where the nucleus is not actively accreting, but is in a maintenance mode. A large, shallow NB survey capturing the brightest, rarest Cii] emitters and spectroscopic follow-up will allow significant progress.
6.2 Ciii] emitters at
In Stroe et al. (2017a) we showed that the vast majority of sources selected through their Ciii] emission trace a similar population to H selected SF galaxies with a range of properties (potentially including both low dust and dust-obscured sources). In this work, we find that a Schechter function fits the number densities of Ciii] emitters well (Fig. 4). This suggests a SF nature for these sources and reinforces our results from Stroe et al. (2017a).
The LF is close to a scaled down version of the H (by a factor of ) and Ly (by a factor of ) LFs at , which might indicate that Cii] emission is produced in the same type of SF galaxies, but at a lower level (Fig. 4, Table 2, Table 5), in line with photoionisation models (e.g. Gutkin et al., 2016). Ciii] line emission is only about per cent of H and per cent of Ly (Table 4). Assuming Ciii] traces SF galaxies in a similar fashion to H or Ly, this indicates that down to the same flux limit, a Ciii] survey will be incomplete compared to these other two lines. To be able to obtain a similar number of emitters, a survey targeting Ciii] would therefore have to be deeper by a factor of a few to be able to detect as many galaxies as an H or Ly survey.
There is mild evidence at the bright end, that Ciii] can be produced at similar levels at H and Ly, which leads us to suggest that bright SF galaxies will universally have Ciii] emission (Figs. 4, 6). This is in good agreement with the follow-up of some of the brightest high redshift UV selected galaxies, that have revealed Ciii] detections (Stark et al., 2014, 2015a).
Our average intrinsic Ciii]/Ly cosmic line ratio is per cent (Table 4). It is likely that because our measurements are cosmic averages, they will be lower than measurements of individual galaxies. In order to compare to the literature (Erb et al., 2010; Stark et al., 2015b, 2017), we transform the observed Ciii] to Ly ratios into intrinsic values by estimating the escape fraction. We do this by using the relationship between Ly EW (which the papers list) and its escape fraction as derived in Sobral et al. (2017). We find that in these single galaxies at the intrinsic Ciii]/Ly ratio is in the per cent range, but these are the few detections, and thus they represent the highest values over the galaxy population, meaning the majority of other galaxies have lower ratios. Our value is therefore lower than literature samples, however the differences can be explained once we take into account the numerous non-detections of Ciii] in Ly detected galaxies (e.g. Stark et al., 2017). Note that many of the Ciii] upper limits were in galaxies with Ly just as strong as in those with Ciii] detections. Once accounting for the lower Ciii] to Ly fractions of these galaxies undetected in Ciii], our results are in agreement with the literature.
The ratio of Ciii] to observed Ly in our SF galaxies is similar to that of quasars. We have to keep in mind however, as discussed in the introduction, that Ly escape fraction is expected to be very high in quasars, which are young, dust-free objects with a blue UV continuum (e.g. Bajtlik et al., 1988; Haiman & Rees, 2001). The intrinsic ratio of Ciii] to Ly in our galaxies is therefore probably smaller than in quasars. These perceived inconsistencies between cosmic ratios further reveal the stringent need for estimates of the Ly escape fraction (as discussed in the introduction), as observed ratio to Ly cannot be interpreted directly without knowledge of the host galaxy type, powering sources of Ly, amount of dust etc.
6.3 Civ emitters at
The power-law shape of the LF, similar to quasars (Fig. 5), is consistent with the individual properties of the galaxies in the sample with point-like optical morphologies and high X-ray luminosities (Stroe et al., 2017a). The power-law fit to the Civ number densities has a slope which is flatter than the quasar UV LF function at bright UV luminosities (), which has a very steep slope of (Croom et al., 2004; Richards et al., 2005, 2006). However, it has been shown that the quasar LF is better described by a broken power-law with a shallower faint-end. For example, (Richards et al., 2005) found a faint-end slope of , while (Croom et al., 2004) find . These two values bracket very well our power-law Civ slope ( which translates to in the definition in these papers).
Our LFs indicate that, at bright fluxes, Civ emitters are more preponderant than Ly and H. For the fainter luminosities, Civ is weak compared to H and produced in only a fraction of UV selected SF galaxies, however a high fraction of Civ emitters are located in the quasar range of UV luminosities (Figs. 5, 7). Therefore, Civ will be produced in a vast majority of bright quasars, but conversely Civ is unlikely in normal SF galaxies.
The cosmic average ratio of Civ to the observed Ly fluxes at is just below 1 (Table 4, with values close to those measured for quasars. Given that all the results point towards a scenario where Civ host are quasars, then not only the cosmic average ratio to observed Ly will be similar to quasars, but also the intrinsic ones.
Therefore, from the point of view of properties and distribution, our data lends greater support to an actively accreting, young AGN powering source for Civ. As theoretically predicted (Osterbrock & Ferland, 2006), Civ is most probably triggered in the broad line region of young AGN. At least some of the fainter Civ emitters are located in the ‘galaxy’ regime (Fig. 7), which in line with more recent work, could be excited in strong ionising field in young galaxies (Feltre et al., 2016).
6.4 Prospects for observations at higher redshift
Ciii] and Civ have been suggested as a possible alternative for spectroscopically confirming high-redshift galaxies. Our results, however, indicate that Ciii] and Civ are intrinsically very weak compared to Ly. In the epoch of reionisation, Ciii] and Civ could be an avenue to pursue only in the case of extremely low Ly fractions. For example, even for a per cent Ly escape fraction as assumed in this paper, Ciii] still has a cosmic ratio of only compared to Ly. A rough calculation indicates that only in the case of escape fractions per cent, would Ciii] and Civ become more efficient than Ly. However, in spite of the low effective Ly escape fractions expected at high redshift, a source would still need to be intrinsically bright to have strong Ciii] emission such that it can be spectroscopically followed up.
Another point to consider is the population that Ciii] and Civ trace. A number of studies proposed that Ciii] and Civ can be used to trace low mass, young, metal-free galaxies at high redshifts (e.g. Stark et al., 2014, 2015a, 2015b; Mainali et al., 2017; Schmidt et al., 2017). However, our results indicate that while Ciii] emission indeed traces a general population of SF galaxies, Civ at seems to be almost universally produced in quasars, not SF galaxies. We speculate that the galaxies detect in Ciii] or Civ at high redshift might be the ones with lower Ly escape fraction (e.g. the ones with relatively low Ly EWs).
It is therefore crucial to perform a blind survey similar to the one in this paper, but at high redshift to assess the redshift evolution of the distribution and nature of Cii], Ciii] and Civ.
7 Conclusions
The brightest restframe UV lines after Ly, Ciii] and Civ have been proposed as a promising way to spectroscopically confirm and study high redshift galaxies in the epoch of reionisation, where Ly is expected to become harder to observe. However, to date, no comprehensive survey has been performed to identify the nature and abundance of hard ionisation lines such as Cii], Ciii] and Civ. Using the uniformly selected samples from Stroe et al. (2017a), we estimate the statistical properties of Cii], Ciii] and Civ emitters for the first time. By studying lower redshift emitters, Cii] at , Ciii] at and Civ at , we can obtain accurate photometric redshifts to distinquish from Ly emitters and study their properties in greater details than possible at high redshift. Our results are as follows:
-
•
The Cii] LF is well by either a Schechter or a power law (Fig. 3), consistent with a mixed population of SF at fainter fluxes and AGN at brighter fluxes in line with properties of individual sources from Stroe et al. (2017a). The Cii] line emission is on average weaker than H and Ly, with a cosmic average line ratio of and , respectively.
-
•
The Ciii] LF is well described by a Schechter function with parameters and , when the faint end slope is fixed to (Fig. 4). While tracing a similar population of SF galaxies, Ciii] emitters at are relatively rare compared to typical Ly and H emitting sources. While, the average line ratio of Ciii] to H is , the ratio to Ly is about . Our results indicate that all bright UV selected galaxies as well as bright quasars will have Ciii] emission (, Fig. 6).
-
•
By contrast, the Civ LF is best described by a single, quasar-like power-law (Fig. 5). As revealed by our data, Civ is produced in only a small fraction of UV selected, H and Ly SF galaxies, but is pervasive in quasars (Fig. 5, 7). As expected from simulations, the cosmic average ratio of Civ to Ly is relatively large (), with the highest ratios for the most luminous sources.
To conclude, a consistent picture about the nature and powering source of Cii], Ciii] and Civ emission is emerging from the individual properties unveiled in Stroe et al. (2017a) and the statistical behaviour studied here. As shown in Stroe et al. (2017a), Cii] emitters at have morphologies and colours consistent with SF at lower luminosities, while bright sources X-ray detections reveal relatively active central black holes. The statistical properties of the sample, including the shape of the LF and the ratios to lines such as H and Ly, confirm the scenario of a mixed population. At , Ciii] emitters have optical morphologies and colours characteristic of either isolated or interacting SF galaxies Stroe et al. (2017a). In many cases, the peak of the line emission is offset from the main UV region, which can explain the large EWs these emitters have. Interactions could for example be responsible for triggering Ciii] emission away from the main stellar disk. In this work, we find that indeed Ciii] emitters have a luminosity distribution consistent with a SF origin and they probably trace a similar population with H emission. However, Ciii] has a relatively low ratio to H. Through their relatively flat, power-law luminosity density distributions, point-like optical morphologies, blue colours, steep UV slopes and strong X-ray detections indicative of high black hole accretion, Civ emitters at in our sample are quasars almost in entirety.
Our statistical study indicates that, while Cii], Ciii] and Civ are indeed not uncommon occurrences at , they are much rarer than Ly or H emitters for a fixed flux limit. Ciii] and Civ lines might prove to be a suitable avenue for spectroscopic confirmation of the highest redshift galaxies only if Ly is heavily attenuated and less than 1 per cent escapes within the slit aperture. Other concerns are raised regarding the population traced by Ciii] and Civ. While a Ciii] selected sample might trace a part of the SF population, Civ will most likely be biased towards quasars. Unless the properties of Ciii] emitters evolve strongly with redshift, our prospects for Ciii] and Civ detections of typical SF galaxies at the highest redshifts are less optimistic compared to the small number statistics studies performed through lensed sources at by Stark et al. (2015a) and simulations by Shimizu et al. (2016).
Acknowledgements
We would like to thank the anonymous referee for her/his valuable input that helped improve the clarity and interpretation of our results. DS acknowledges financial support from the Netherlands Organisation for Scientific research (NWO), through a Veni fellowship. IO acknowledges support from the European Research Council in the form of the Advanced Investigator Programme, 321302, cosmicism. CALYMHA data is based on observations made with the Isaac Newton Telescope (proposals 13AN002, I14AN002, 088-INT7/14A, I14BN006, 118-INT13/14B, I15AN008) operated on the island of La Palma by the Isaac Newton Group in the Spanish Observatorio del Roque de los Muchachos of the Instituto de Astrofísica de Canarias. Also based on data products from observations made with ESO Telescopes at the La Silla Paranal Observatory under ESO programme IDs 098.A-0819 and 179.A-2005. We extensively used the cosmology calculator presented in Wright (2006). We would like to thank the authors of NumPy (van der Walt et al., 2011), SciPy (Jones et al., 2001), Matplotlib (Hunter, 2007) and AstroPy (Astropy Collaboration et al., 2013) for making these packages publicly available. This research has made use of the NASA/IPAC Extragalactic Database (NED) which is operated by the Jet Propulsion Laboratory, California Institute of Technology, under contract with the National Aeronautics and Space Administration. This research has made use of NASA’s Astrophysics Data System. This research has made use of the VizieR catalogue access tool, CDS, Strasbourg, France. The original description of the VizieR service was published in Ochsenbein et al. (2000). This research has made use of “Aladin sky atlas” developed at CDS, Strasbourg Observatory, France (Bonnarel et al., 2000; Boch & Fernique, 2014).
References
- Alavi et al. (2016) Alavi, A., Siana, B., Richard, J., et al. 2016, ApJ, 832, 56
- Astropy Collaboration et al. (2013) Astropy Collaboration, Robitaille, T. P., Tollerud, E. J., et al. 2013, A&A, 558, A33
- Bajtlik et al. (1988) Bajtlik, S., Duncan, R. C., & Ostriker, J. P. 1988, ApJ, 327, 570
- Baldwin (1977) Baldwin, J. A. 1977, MNRAS, 178, 67P
- Barger et al. (2012) Barger, A. J., Cowie, L. L., & Wold, I. G. B. 2012, ApJ, 749, 106
- Bayliss et al. (2014) Bayliss, M. B., Rigby, J. R., Sharon, K., et al. 2014, ApJ, 790, 144
- Bertin (2006) Bertin, E. 2006, Astronomical Data Analysis Software and Systems XV, 351, 112
- Boch & Fernique (2014) Boch, T., & Fernique, P. 2014, Astronomical Data Analysis Software and Systems XXIII, 485, 277
- Bonnarel et al. (2000) Bonnarel, F., Fernique, P., Bienaymé, O., et al. 2000, A&A, 143, 33
- Bouwens et al. (2011) Bouwens, R. J., Illingworth, G. D., Oesch, P. A., et al. 2011, ApJ, 737, 90
- Cirasuolo et al. (2010) Cirasuolo, M., McLure, R. J., Dunlop, J. S., et al. 2010, MNRAS, 401, 1166
- Chabrier (2003) Chabrier, G. 2003, PASP, 115, 763
- Cowie et al. (2010) Cowie, L. L., Barger, A. J., & Hu, E. M. 2010, ApJ, 711, 928
- Croom et al. (2004) Croom, S. M., Smith, R. J., Boyle, B. J., et al. 2004, MNRAS, 349, 1397
- Dahle (2006) Dahle, H. 2006, ApJ, 653, 954
- Dijkstra (2014) Dijkstra, M. 2014, PASA, 31, e040
- De Breuck et al. (2000) De Breuck, C., Röttgering, H., Miley, G., van Breugel, W., & Best, P. 2000, A&A, 362, 519
- Du et al. (2017) Du, X., Shapley, A. E., Martin, C. L., & Coil, A. L. 2017, ApJ, 838, 63
- Dunlop & Peacock (1990) Dunlop, J. S., & Peacock, J. A. 1990, MNRAS, 247, 19
- Erb et al. (2010) Erb, D. K., Pettini, M., Shapley, A. E., et al. 2010, ApJ, 719, 1168
- Feltre et al. (2016) Feltre, A., Charlot, S., & Gutkin, J. 2016, MNRAS, 456, 3354
- Gómez-Guijarro et al. (2016) Gómez-Guijarro, C., Gallego, J., Villar, V., et al. 2016, A&A, 591, A151
- Gutkin et al. (2016) Gutkin, J., Charlot, S., & Bruzual, G. 2016, MNRAS, 462, 1757
- Haiman & Rees (2001) Haiman, Z., & Rees, M. J. 2001, ApJ, 556, 87
- Hayes et al. (2010) Hayes, M., Östlin, G., Schaerer, D., et al. 2010, Nature, 464, 562
- Hayes et al. (2011) Hayes, M., Schaerer, D., Östlin, G., et al. 2011, ApJ, 730, 8
- Hayes (2015) Hayes, M. 2015, PASA, 32, e027
- Hopkins & Beacom (2006) Hopkins, A. M., & Beacom, J. F. 2006, ApJ, 651, 142
- Hunter (2007) Hunter, J. D. 2007, Computing In Science & Engineering, 9, 3, 90–95
- Ilbert et al. (2009) Ilbert, O., Capak, P., Salvato, M., et al. 2009, ApJ, 690, 1236
- Jaskot & Ravindranath (2016) Jaskot, A. E., & Ravindranath, S. 2016, ApJ, 833, 136
- Jones et al. (2001) Jones, E., Oliphan, T., Peterson, P. et al. 2001
- Kennicutt (1998) Kennicutt, R. C., Jr. 1998, ARA&A, 36, 189
- Khostovan et al. (2015) Khostovan, A. A., Sobral, D., Mobasher, B., et al. 2015, MNRAS, 452, 3948
- Konno et al. (2014) Konno, A., Ouchi, M., Ono, Y., et al. 2014, ApJ, 797, 16
- Konno et al. (2016) Konno, A., Ouchi, M., Nakajima, K., et al. 2016, ApJ, 823, 20
- Lilly et al. (1996) Lilly, S. J., Le Fevre, O., Hammer, F., & Crampton, D. 1996, ApJL, 460, L1
- Madau et al. (1996) Madau, P., Ferguson, H. C., Dickinson, M. E., et al. 1996, MNRAS, 283, 1388
- Mainali et al. (2017) Mainali, R., Kollmeier, J. A., Stark, D. P., et al. 2017, ApJL, 836, L14
- Matthee et al. (2014) Matthee, J. J. A., Sobral, D., Swinbank, A. M., et al. 2014, MNRAS, 440, 2375
- Matthee et al. (2015) Matthee, J., Sobral, D., Santos, S., et al. 2015, MNRAS, 451, 400
- Matthee et al. (2016) Matthee, J., Sobral, D., Oteo, I., et al. 2016, MNRAS, 458, 449
- Matthee et al. (2017) Matthee, J., Sobral, D., Best, P., et al. 2017, arXiv:1702.04721
- McGreer et al. (2013) McGreer, I. D., Jiang, L., Fan, X., et al. 2013, ApJ, 768, 105
- Mehta et al. (2017) Mehta, V., Scarlata, C., Rafelski, M., et al. 2017, ApJ, 838, 29
- Nilsson et al. (2009) Nilsson, K. K., Tapken, C., Møller, P., et al. 2009, A&A, 498, 13
- Ochsenbein et al. (2000) Ochsenbein, F., Bauer, P., & Marcout, J. 2000, A&A, 143, 23
- Ono et al. (2012) Ono, Y., Ouchi, M., Mobasher, B., et al. 2012, ApJ, 744, 83
- Osterbrock & Ferland (2006) Osterbrock, D. E., & Ferland, G. J. 2006, Astrophysics of gaseous nebulae and active galactic nuclei, 2nd. ed. by D.E. Osterbrock and G.J. Ferland. Sausalito, CA: University Science Books, 2006,
- Ouchi et al. (2008) Ouchi, M., Shimasaku, K., Akiyama, M., et al. 2008, ApJS, 176, 301-330
- Richards et al. (2005) Richards, G. T., Croom, S. M., Anderson, S. F., et al. 2005, MNRAS, 360, 839
- Richards et al. (2006) Richards, G. T., Strauss, M. A., Fan, X., et al. 2006, AJ, 131, 2766
- Rigby et al. (2015) Rigby, J. R., Bayliss, M. B., Gladders, M. D., et al. 2015, ApJL, 814, L6
- Santos et al. (2016) Santos, S., Sobral, D., & Matthee, J. 2016, MNRAS, 463, 1678
- Schechter (1976) Schechter, P. 1976, ApJ, 203, 297
- Schmidt et al. (2017) Schmidt, K. B., Huang, K.-H., Treu, T., et al. 2017, ApJ, 839, 17
- Shapley et al. (2003) Shapley, A. E., Steidel, C. C., Pettini, M., & Adelberger, K. L. 2003, ApJ, 588, 65
- Shimizu et al. (2016) Shimizu, I., Inoue, A. K., Okamoto, T., & Yoshida, N. 2016, MNRAS, 461, 3563
- Shioya et al. (2008) Shioya, Y., Taniguchi, Y., Sasaki, S. S., et al. 2008, ApJS, 175, 128
- Sobral et al. (2012) Sobral, D., Best, P. N., Matsuda, Y., et al. 2012, MNRAS, 420, 1926
- Sobral et al. (2013) Sobral, D., Smail, I., Best, P. N., et al. 2013, MNRAS, 428, 1128
- Sobral et al. (2015) Sobral, D., Matthee, J., Darvish, B., et al. 2015, ApJ, 808, 139
- Sobral et al. (2016) Sobral, D., Kohn, S. A., Best, P. N., et al. 2016, MNRAS, 457, 1739
- Sobral et al. (2017) Sobral, D., Matthee, J., Best, P., et al. 2017, MNRAS, 466, 1242
- Stark et al. (2014) Stark, D. P., Richard, J., Siana, B., et al. 2014, MNRAS, 445, 3200
- Stark et al. (2015a) Stark, D. P., Richard, J., Charlot, S., et al. 2015a, MNRAS, 450, 1846
- Stark et al. (2015b) Stark, D. P., Walth, G., Charlot, S., et al. 2015b, MNRAS, 454, 1393
- Stark et al. (2017) Stark, D. P., Ellis, R. S., Charlot, S., et al. 2017, MNRAS, 464, 469
- Stroe et al. (2014) Stroe, A., Sobral, D., Röttgering, H. J. A., & van Weeren, R. J. 2014, MNRAS, 438, 1377
- Stroe & Sobral (2015) Stroe, A., & Sobral, D. 2015, MNRAS, 453, 242
- Stroe et al. (2017a) Stroe, A., Sobral, D., Matthee, J., Calhau, J., & Oteo, I. 2017, arXiv:1703.10169
- Tilvi et al. (2016) Tilvi, V., Pirzkal, N., Malhotra, S., et al. 2016, ApJL, 827, L14
- Trainor et al. (2015) Trainor, R. F., Steidel, C. C., Strom, A. L., & Rudie, G. C. 2015, ApJ, 809, 89
- Treu et al. (2013) Treu, T., Schmidt, K. B., Trenti, M., Bradley, L. D., & Stiavelli, M. 2013, ApJL, 775, L29
- Vanzella et al. (2014) Vanzella, E., Fontana, A., Pentericci, L., et al. 2014, A&A, 569, A78
- Vanden Berk et al. (2001) Vanden Berk, D. E., Richards, G. T., Bauer, A., et al. 2001, AJ, 122, 549
- van der Walt et al. (2011) van der Walt, S., Colbert, S. C., Varoquaux, G. 2011, Computing in Science & Engineering, 13, 2
- Veilleux (2002) Veilleux, S. 2002, IAU Colloq. 184: AGN Surveys, 284, 111
- Warren et al. (1994) Warren, S. J., Hewett, P. C., & Osmer, P. S. 1994, ApJ, 421, 412
- Wright (2006) Wright, E. L. 2006, PASP, 118, 1711
- Zitrin et al. (2015b) Zitrin, A., Labbé, I., Belli, S., et al. 2015b, ApJL, 810, L12
Appendix A Interpolated H and Ly values
We use data from the literature at redshifts in the range to derive H (Sobral et al., 2013; Stroe & Sobral, 2015) and and observed Ly (Cowie et al., 2010; Barger et al., 2012; Konno et al., 2016; Sobral et al., 2017; Ouchi et al., 2008). LFs at our redshifts of interest for Cii], Ciii] and Civ. Note that the values are for reference only and should not be considered as actual LF parameters at the interpolated redshifts.
| (Mpc-3) | (erg s-1) | ||
| Interpolated H | |||
| Interpolated Ly | |||
Appendix B Number densities and number of sources for the LF fits
| Cii] | ||
|---|---|---|
| 41.21 | 9 | |
| 41.60 | 6 | |
| 41.99 | 4 | |
| 42.38 | 1 | |
| 42.77 | 1 | |
| Ciii] | ||
| 41.52 | 8 | |
| 41.91 | 30 | |
| 42.30 | 3 | |
| 42.69 | 1 | |
| Civ | ||
| 42.20 | 7 | |
| 42.58 | 7 | |
| 42.96 | 6 | |
| 43.34 | 4 | |
| 43.72 | 3 | |
| Ciii] | ||
|---|---|---|
| -22.4 | 1 | |
| -20.9 | 2 | |
| -19.4 | 17 | |
| -17.9 | 28 | |
| Civ | ||
| -24.0 | 2 | |
| -22.5 | 6 | |
| -21.0 | 7 | |
| -19.5 | 6 | |
| -18.0 | 5 | |