Competing spin density wave, collinear, and helical magnetism in Fe1+xTe
Abstract
The Fe1+xTe phase diagram consists of two distinct magnetic structures with collinear order present at low interstitial iron concentrations and a helical phase at large values of with these phases separated by a Lifshitz point. We use unpolarized single crystal diffraction to confirm the helical phase for large interstitial iron concentrations and polarized single crystal diffraction to demonstrate the collinear order for the iron deficient side of the Fe1+xTe phase diagram. Polarized neutron inelastic scattering show that the fluctuations associated with this collinear order are predominately transverse at low energy transfers, consistent with a localized magnetic moment picture. We then apply neutron inelastic scattering and polarization analysis to investigate the dynamics and structure near the boundary between collinear and helical order in the Fe1+xTe phase diagram. We first show that the phase separating collinear and helical order is characterized by a spin-density wave with a single propagation wave vector of ( 0.45, 0, 0.5). We do not observe harmonics or the presence of a charge density wave. The magnetic fluctuations associated with this wavevector are different from the collinear phase being strongly longitudinal in nature and correlated anisotropically in the (H,K) plane. The excitations preserve the symmetry of the lattice, but display different widths in momentum along the two tetragonal directions at low energy transfers. While the low energy excitations and minimal magnetic phase diagram can be understood in terms of localized interactions, we suggest that the presence of density wave phase implies the importance of electronic and orbital properties.
I Introduction
The discovery of unconventional superconductivity in the iron based pnictides Kamihara et al. (2008) and chalcogenides Hsu et al. (2008), and the subsequent materials effort, has lead to the founding of a number of magnetic iron-based materials which are proximate to superconductivity, or strongly correlated electronic phases. Dai (2015); Inosov (2016); Ishida et al. (2009); Green and Paglione (2010); Johnston (2010); Stock and McCabe (2016); Wen et al. (2011); Dai et al. (2012); Lumsden and Christianson (2010) However, identifying and understanding the parent phases of these systems remains an unresolved challenge. Unlike the case of the cuprate high temperature superconductors Birgeneau et al. (2006); Kastner et al. (1998), where a Mott insulating phase is parent to high temperature superconductivity, parent phases of iron based supercondutors appear to be semi or poorly metallic and it remains unclear if these parent compounds are based on localized magnetic order or more metallic, itinerant behavior. Also, unlike in the cuprates which appear to derive from a single electronic band, multi band Raghu et al. (2008); Graser et al. (2009); Lei et al. (2012) and orbital effects Kruger et al. (2009); Lv et al. (2010) appear to be required to understand the electronics and magnetism of iron based systems.
The single layered chalcogenide superconducting system Fe1+xTe (where =Se or S) is important owing to its relatively simple crystal structure based on a single FeTe layer Fruchart et al. (1975); Hsu et al. (2008); Sales et al. (2009); Deguchi et al. (2012); Rosler et al. ; Mizuguchi and Takano (2010) and also because it displays a strongly localized electronic character in comparison to other iron based systems. Yin et al. (2011) Fe1+xTe also allows two chemical variables to control magnetic, structural, and electronic properties: represents the amount of interstitial iron disordered throughout the crystal, and the amount of anion substitution. However, several studies have found that these two variables ( and ) are correlated and both are central in determining superconducting properties. McQueen et al. (2009); Stock et al. (2012); Vivanco and Rodriguez (2016) In particular, structurally, the role of the tetrahedral bond angles have been identified as being tuned with interstitial iron. Rodriguez et al. (2011a); Xu et al. (2016) Magnetically, interstitial iron has been implicated as the origin of several doping induced magnetic and structural phase transitions. Tang et al. (2016); Thampy et al. (2012) Because of this strong correlation between anion and interstitial iron doping, it is important to understand the parent Fe1+xTe phase diagram where a single variable is tuned.
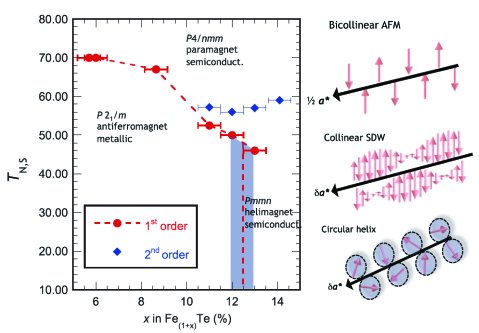
The combined magnetic and structural phase diagram for Fe1+xTe is illustrated in Fig. 1 (taken from Refs. Rodriguez et al., 2013, 2011b; Koz et al., 2013). The phase diagram is divided into two key sections by the concentration 0.12. For low interstitial iron concentrations, a commensurate and collinear magnetic phase is present characterized by a “double-stripe” structure with magnetic moments aligned along the axis and magnetic Bragg peaks at (0.5, 0, 0.5) or (, 0). Bao et al. (2009) The transition to this collinear magnetic phase as a function of temperature is first order Li et al. (2009) and accompanied by a transition from a semi/poorly metallic state at high temperatures to a metallic phase at low temperature. Chen et al. (2009a); Rodriguez et al. (2013) The second region is at large interstitial iron concentrations where helical magnetic order is present and also characterized by a second order phase transition. The resistivity in this region of the phase diagram is semi/poorly metallic at all temperatures. Structurally, the low- collinear magnetic phase is characterized by a low temperature monoclinic unit cell () where the helical high- phase has an orthorhombic unit cell () at low temperatures. The order parameters and critical scattering was investigated in Ref. Rodriguez et al., 2013 and the it was concluded (based on critical exponents) that the order parameters were decoupled in these two extremes of the interstitial iron phase diagram.
The point separating this line of first and second order transitions is defined as a Lifshitz point. Collins (2002) The magnetic phase near this point has been investigated in several studies Rodriguez et al. (2011b, 2013) and is unusual in several regards in comparison to the two extreme phases discussed above. First, while the wavevector characterizing magnetic order near this point is incommensurate at ( 0.45, 0, 0.5), the magnetic structure is collinear as proven through polarized neutron scattering with the magnetic moments aligned along the axis. Second, the phase is long-ranged (determined by the resolution of the neutron diffractometer) along , but short-range along . Third, the critical exponents defining the structural and magnetic phase transitions were the same within error suggesting the structural and magnetic order parameters were coupled. This phase was recently the subject of a theoretical study Materne et al. (2015) where it was suggested the origin was based upon localized topological defects (termed “Solitonic spin-liquid”) derived from a combined Mossbauer and theoretical analysis. The localized topological defects have parallels with proposed structures for the spin-glass phase in the lamellar cuprates. Hasselmann et al. (2004)
Perhaps most relevant to superconductivity, the magnetic phase associated with this incommensurate wave vector has been observed to compete and even coexist with superconducting phases in anion doped materials. Temperature dependent studies of the magnetic fluctuations in Fe1+xSeyTe1-y have observed static magnetic correlations peaked at wavevectors less than the commensurate H=0.5 position. Xu et al. (2010) Though interpreted as commensurate correlations, the data reported in Figure 3 of Ref. Xu et al., 2010 is consistent with short range incommensurate correlations. Incommensurate correlations near the superconducting transition as a function of Se doping were also identified in Ref. Bendele et al., 2010. More correlated, in momentum, incommensurate scattering at (0.46, 0, 0.5) was reported in superconducting samples of Fe1.02Te0.75Se0.25. Wen et al. (2009) Studies of Fe1-zCuzTe observe that this short range incommensurate order at ( 0.42, 0, 0.5) seems to be stabilized with copper doping. Wen et al. (2012) All of these studies illustrate that short-range incommensurate order at ( 0.45, 0, 0.5) competes and even coexists with superconductivity and also the two distinct collinear and helical magnetic phases described above in the absence of anion doping.
A key underlying question surrounding this is whether the ground state of the parent phase Fe1+xTe can be understood in terms of an itinerant metal Mazin (2010); Hirayama et al. (2013); Akbari et al. (2011); Han and Savrasov (2009); Singh (2010); Han and Savrasov (2010); Ding et al. (2013); Chubukov and Xing (2016) or whether a localized magnetic state based on Heisenberg interactions through the Te band Ma et al. (2009); Ducatman et al. (2012); Chen et al. (2013); Hu et al. (2012) is more relevant. Itinerant models would point to density wave phases with the length of the magnetic spin varying while localized models would propose spatially localized defects and competitions between localized structures where the length of the spin is preserved. Initial studies on superconducting Fe1+xTe0.6Se0.4 suggested the importance of itinerant effects Argyriou et al. (2010); Lumsden et al. (2010) however neutron inelastic scattering have more recently been interpreted in terms of a localized model Lipscombe et al. (2011) with competing spin states. Zaliznyak et al. (2011) Other high energy neutron inelastic scattering work has observed an hour glass type of dispersion with spectral weight extending up to 200 meV and the total integrated spectral weight be short of expectations based on a purely localized picture. Stock et al. (2014)
Here, we investigate the question of itinerant vs electronic effects near the Lifshitz point in Fe1+xTe using a combination of neutron elastic and inelastic scattering. We investigate the magnetic fluctuations in the collinear phase and show that the low-energy fluctuations are primarily transverse indicating a strong localized character at low-energies. For large interstitial iron concentrations, we investigate the magnetic structure using single crystals and confirm the helical phase and also the magnetic structure of the interstitial sites. We then investigate the incommensurate short-range order in single crystals for 0.12, at the boundary between collinear and helical magnetic phases.
II Experimental
The single crystals discussed here are the same samples used in previous studies where the preparation techniques are outlined in detail. Rodriguez et al. (2013, 2011b) The interstitial iron concentration was determined with single crystal x-ray and also powder neutron diffraction as discussed previously. Rodriguez et al. (2011b)
The magnetic fluctuations in the collinear magnetic phase were studied on single crystals of Fe1.057(7)Te. The temperature dependence of the magnetic fluctuations was investigated using the MAPS chopper spectrometer (ISIS, UK). The sample was aligned such that Bragg positions of the form (H0L) lay within the horizontal scattering plane with the -axis aligned parallel to the incident beam. The chopper was spun at a frequency of 50 Hz and phased to remove high energy neutrons from the target. A “sloppy” Fermi Chopper was used to monochromate the incident beam with Ei=75 meV, and the Fermi chopper was spun at a frequency of 200 Hz (with an elastic energy resolution of 4.0 meV at full width half maximum). The sample was cooled with a bottom loading closed cycle refrigerator.
As noted previously and discussed in the supplementary information of Ref. Stock et al., 2014, with the axis parallel to the incident beam , the H and K axes are projected onto the MAPS detectors providing a good experimental configuration to measure the momentum dependence in this plane. However, the value of L, or the projection along , changes as a function of energy transfer and also coordinates (H,K). This has been discussed in previous works on cuprate superconductors and used in the case of the bilayer YBa2Cu3O6.5 to extract magnetic optic and acoustic fluctuations. Stock et al. (2005) With our configuration of Ei=75 meV, (H,K,L)=(0.5,0.5,0.5) is found at 8-10 meV, near the peak in the magnetic intensity measured with a triple axis spectrometer where all three parameters are determined.
For studying the helical magnetic structure in single crystals of Fe1.141(5)Te, we utilized the HB-3A four-circle diffractometer at the High-flux Isotope Reactor (HFIR) at Oak Ridge National Laboratory (Oak Ridge, USA). Both nuclear and magnetic reflections were measured using the Si(220) monochromator with a wavelength of 1.5424 Å.
To study the short-range incommensurate collinear magnetic phase we investigated single crystals of Fe1.124(5)Te. Neutron diffraction measurements were performed on the Wide Angle Neutron Diffractometer (WAND) located at the HIFR Reactor (Oak Ridge, USA). WAND is configured in an energy integrating “2-axis” mode with Ei=36.3 meV using Ge(113). An oscillating collimator is used after the detector to limit backgrouund. Further studies searching for harmonics and also establishing the magnetic wavevector were performed at the MACS cold triple-axis spectrometer at NIST (Gaithersburg, USA). Rodriguez et al. (2008) The final energy was fixed at Ef=3.6 meV and the elastic scattering plane was measured using the 20 double-bounce PG(002) analyzing crystals and detectors. Each detector channel was collimated using 90′ Soller slits before the analyzing crystal. The sample was aligned in the (H0L) scattering plane and cooled in a closed cycle refrigerator (WAND) and orange-cryostat (MACS).
Polarized neutron inelastic scattering Shirane et al. (2002) was performed on the 4F1 triple-axis spectrometer located at the LLB (Saclay, France) to study the magnetic fluctuations in Fe1.057(7)Te. The incident beam was polarized with a supermirror and analyzed with a Heusler crystal, A Beryllium filter was used on the scattered side to remove higher order contamination of the beam. The final energy was fixed to Ef=5.0 meV (with an energy resolution of 0.23 meV, full width at half maximum). The measured flipping ratio, with the sample, of 8 is significantly reduced owing to the presence of ferromagnetic iron on the surface of the sample which depolarizes the neutron beam. For this reason, polarized neutron experiments were unsuccessful for high interstitial iron concentrations, where a helical magnetic structure is found, owing to the large amount of ferromagnetic iron on the surface of the sample.
III x=0.057(7) - Collinear magnetism and stripy fluctuations
We first discuss the temperature dependent magnetic dynamics in the collinear phase of the Fe1+xTe phase diagram by studying single crystals of Fe1.057(7)Te. Fe1.057(7)Te is placed on the iron deficient side of the phase diagram shown in Fig. 1 and has a first order transition at 75 K to a collinear magnetic phase accompanied by a structural transition from a tetragonal (space group ) to monoclinic (space group ) unit cell. We first show how the magnetic fluctuations change in the (H,K) plane as a function of temperature and then study the anisotropy of these temperature dependent fluctuations using polarized neutrons.
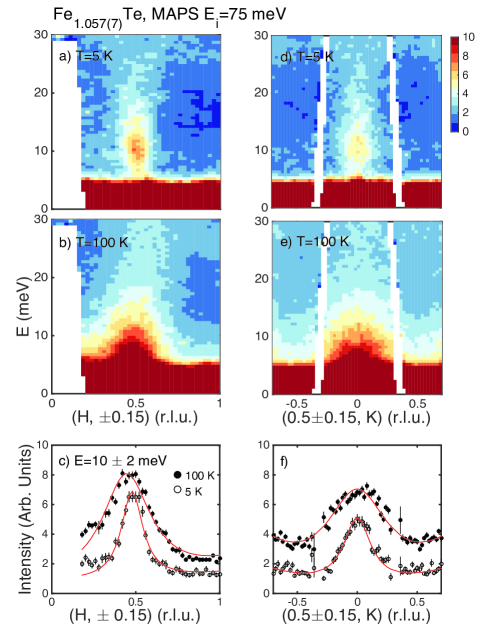
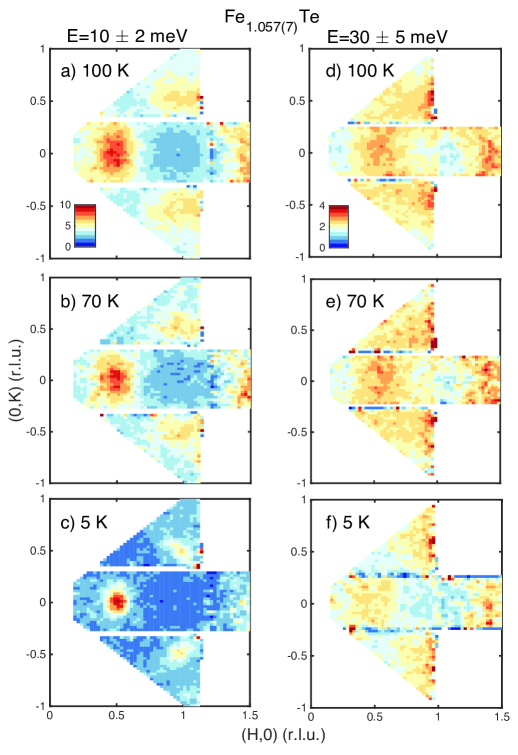
Figure 2 shows constant momentum slices taken near (H,K)=(0.5,0) at 5 K, below the transition to collinear magnetic order, both along the H and K directions taken on the MAPS chopper spectrometer with Ei=75 meV. Unlike the case of Se doped Fe1+xTe1-ySey where the magnetic fluctuations are peaked near the (, ) position, in parent Fe1+xTe, the magnetic correlations are peaked near (, 0). Chi et al. (2011) As previously published, the low temperature magnetic fluctuations are strongly correlated along both the and directions and become one dimensional at higher energy transfers in excess of 30 meV. Stock et al. (2014) This is confirmed in the constant momentum slices in panels and and the corresponding cuts in panels and where the magnetic fluctuations are strongly correlated in momentum along both the H and K directions at E=10 meV. A considerable broadening occurs at high temperatures of 100 K, however, the fluctuations remain anisotropic in momentum at this temperature as illustrated in constant momentum slices in panels and and also cuts and taken at E=10 2 meV.
Figure 3 displays constant energy slices at low energy transfers of 10 2 meV (panesl ) and also 30 5 meV (panels ). The data are also from the MAPS spectrometer with Ei=75 meV. At low temperatures and low energies displayed in panel , a constant energy map shows that the scattering is well correlated in both the and directions. At 70 K (panel ) close to the first order transition to collinear order, the results discussed above is further confirmed showing broadened, yet still anisotropic correlations. At 100 K (well above TN), however as illustrated in panel , the scattering becomes more isotropic being broader along yet there is still a clear anisotropy in the correlations along and . At higher energies (E=30 5 meV displayed in panels ), a different picture emerges with the magnetic fluctuations being more elongated along the K direction at 5 K indicative of one dimensional fluctuations. At higher temperatures of 70 K, the magnetic correlations become isotropic along the H and K directions with the scattering forming nearly a ring in momentum at 100 K.
As noted previously in a high energy neutron scattering study Stock et al. (2014) as a function of interstitial iron concentration, the magnetic excitations extend up to at 200 meV and this is also confirmed by two-magnon results using Raman. Okazaki et al. (2011) Within error of 15 %, we observe no temperature dependence to the integrated intensity at 5, 70, and 100 K integrating over energy transfers up to 50 meV. While the analysis is sensitive to how the elastic line is treated, the increase in spectral weight in the inelastic channel is accounted for by the loss of spectral weight at the magnetic Bragg position within error. This contrasts with some previous studies on Fe1+xTe (Ref.Zaliznyak et al., 2011), however we emphasize that our measurements are performed on a different sample which is located at a different point in the magnetic and structural phase diagram drawn in Fig. 1. We have also discussed possible sources of error due to low-energy phonons in the supplementary information in Ref. Stock et al., 2014. In the collinear phase of Fe1.057(7)Te, we therefore do not observe evidence of a spin transition, but rather a re-distribution of spectral weight from the elastic line to the inelastic position and also throughout the Brillouin zone as a function of temperature.
The constant energy and momentum cuts in Figs. 2 and 3 illustrate that the fluctuations become considerably broadened in momentum and energy crossing the Neel transition (TN=75 K). Fig. 2 panels and show that the magnetic fluctuations remain peaked around K=0 and H=0.5, however at high temperatures of 100 K above the first order magnetic and structural transition, the magnetic fluctuations at 10 meV are slightly displaced in H to lower values away from the commensurate H=0.5 position. The nature of these incommensurate fluctuations will be discussed in more detail below. It is interesting to note that while the magnetic fluctuations become considerably broadened at high temperatures, they do remain very anisotropic in the (H,K) plane as illustrated in Fig. 3 panel which is at 100 K, well above the Neel transition temperature. Gaussian fits to the data produce an anisotropy in momentum with widths of /=1.85 0.10 at 100 K. Therefore, the high temperature low energy fluctuations in Fe1.057(7)Te are anisotropic in momentum, despite the tetragonal shape of the lattice and the equivalence of the and directions. However, these fluctuations centered around the (, 0) position do preserve the C4 symmetry of the lattice and should be distinguished from the “nematic” phase fluctuations identified in the “122” pnictides at high temperatures. Lu et al. (2014); Fernandes et al. (2014) The anisotropy around the (,0) position may reflect the underlying Fermi surface Subedi et al. (2008) as suggested to explain a similar anisotropy in the magnetic fluctuations in iron based pnictides. Park et al. (2010); Graser et al. (2009); Lu et al. (2014)
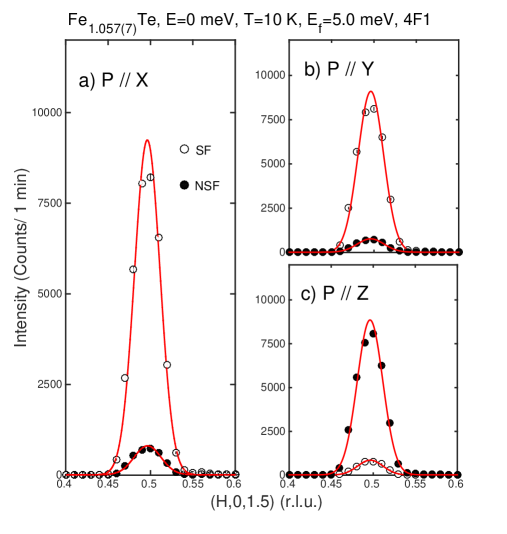
We now investigate the polarization of the magnetic fluctuations as a function of temperature using polarized neutron scattering obtained at the 4F1 triple-axis spectrometer. Figure 4 illustrates scans through the low temperature elastic magnetic Bragg peak at (0.5, 0, 1.5). Spin-flip (open circles) and non spin-flip (filled circles) are illustrated for the neutron beam polarized along the X (defined as parallel ), Y (perpendicular to , but within the horizontal (H0L) scattering plane), and Z (perpendicular to the and perpendicular to the horizontal scattering plane). Panel shows that the dominant cross section is in the spin-flip channel, as expected for magnetic scattering, with the feed-through measured in the non-spin-flip channel the result of incomplete polarization characterized by the flipping ratio discussed above in the experimental section. Scans with the polarization along Y indicate a strong spin-flip cross section indicating that the magnetic moment is oriented out of the scattering plane. This is confirmed by scans with the neutron polarization oriented along Z which show a dominant cross section in the non-spin-flip channel. Polarization analysis along the Y and Z directions confirm that the magnetic moments are aligned along the axis, perpendicular to the (H0L) scattering plane chosen for the 4F1 polarized experiments. This result is consistent with previous powder diffraction and single crystal neutron diffraction reported for the iron deficient side of the Fe1+xTe phase diagram.
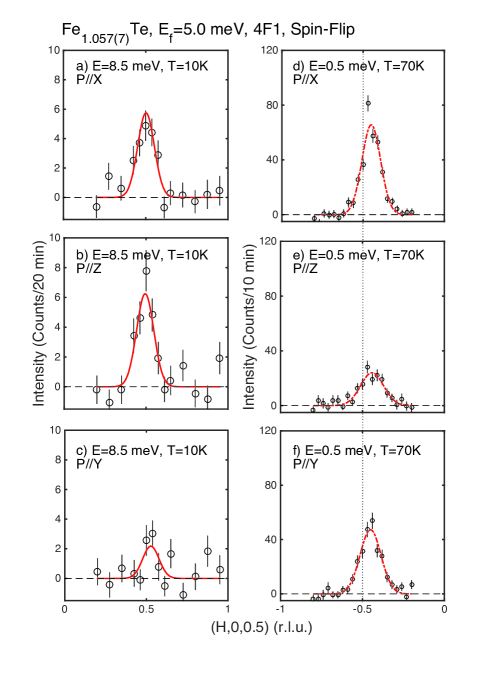
Having reviewed the magnetic structure at low temperatures with elastic neutron scattering with polarization analysis, we now discuss the polarization of the low temperature spin fluctuations. The low temperature magnetic dynamics in Fe1.057(7)Te are gapped for this particular iron concentration Stock et al. (2011, 2014) as shown in Fig. 2. In Fig. 5 panels , we investigate the polarization of these fluctuations at an energy transfer of E=8.5 meV, above the energy gap. Panel shows the total magnetic cross section as probed in the spin-flip channel with the neutron beam polarized along X. Panel illustrates the same scan, but now with the neutron beam polarized along the Z direction (perpendicular to and the horizontal (H0L) scattering plane utilized on 4F1). Given the geometry of the spectrometer and sample, this corresponds to the axis of the sample. The intensity measured in this channel is, within error, equal to the total magnetic cross section measured in panel with the neutron beam polarized along X. A small spin-flip cross section is measured with the beam polarized along Y. This scan is sensitive to spin fluctuations along the axis of the material and parallel to the low temperature ordered magnetic moment direction. Given the statistics, it is not clear if this is statistically significant given the flipping ratio. The main result found in the polarization analysis in panels is that the dominant magnetic cross section at E=8.5 meV is transverse to the ordered magnetic moment direction at low temperatures. We therefore conclude that the low energy spin fluctuations in Fe1.057(7)Te are the result of localized spin fluctuations similar to spin-waves in an ordered antiferromagnet.
Figure 5 show polarization analysis at E=0.5 meV of the low energy fluctuations at 70 K near the Néel temperature (TN=75 K). As noted previously Parshall et al. (2012), these fluctuations are incommensurate at H 0.45 and this is highlighted by the vertical dashed line at the commensurate H=0.5 position in Fig. 5. Panel shows the total magnetic cross section with the neutron beam polarized along , defined as the X direction. Panel shows a weaker cross section corresponding to fluctuations perpendicular to the axis of the sample (the low temperature ordered magnetic moment direction), however, a larger cross section is found in panel with the Y-polarized neutrons. This analysis suggests a dominant fraction of the neutron cross section at 70 K corresponding to fluctuations polarized along the axis which are longitudinal fluctuations parallel to the low temperature ordered magnetic moment.
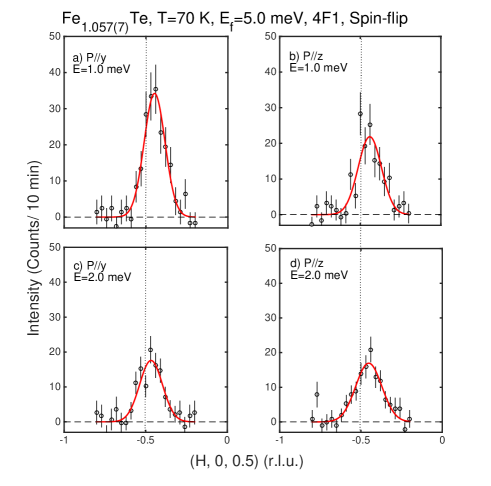
Figure 6 illustrates the energy dependence of the incommensurate fluctuations critical to collinear Neel ordering. Panels show polarization analysis at an energy transfer of 1.0 meV and panels at 2.0 meV. The Y-polarized spin-flip channel is sensitive to fluctuations along the axis and the Z-polarized channel is sensitive to fluctuations transverse, or perpendicular, to . An anisotropy is observable at 1.0 meV, however at higher energy transfers of 2.0 meV (panels ), the excitations are isotropic within error with equal weight residing in the Y and Z polarized spin-flip channels. This shows that the low energy incommensurate fluctuations are primarily longitudinal in nature, at higher energy transfers the fluctuations become more isotropic.
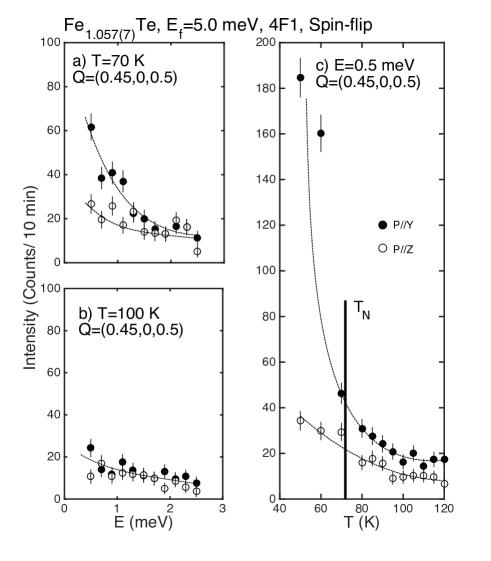
Figure 7 illustrates background corrected temperature and energy scans for the incommensurate magnetic fluctuations peaked at (0.45, 0, 0.5). Panel and display constant momentum cuts. At 70 K, near the Néel temperature, a significant difference develops between the Y and Z polarized channels at low energy transfers below 1 meV. At higher temperatures of 100 K displayed in panel , the two channels for neutrons polarized along Y and Z have equal intensities within error indicating isotropic fluctuations at all energy transfers studied. This is expected for a paramagnet at temperatures well above the ordering temperature. The temperature dependence of the magnetic fluctuations at E=0.5 meV and with =(0.45, 0, 0.5) is displayed in panel where it is seen that a large difference between the spin-flip channels with Y and Z polarized neutrons is present near and below TN. At high temperatures the two channels are equal within error.
The polarized neutron scattering results demonstrate anisotropic spin fluctuations which develop near TN in Fe1.057(7)Te. This is evidenced in the difference seen between the Y and Z polarization channels in Figs. 5, 6, and 7 discussed above. If the magnetic fluctuations were isotropic, the intensity in these two spin-flip channels would be equal and the intensity when the neutron beam is polarized along as observed in magnets in the paramagnetic region at high temperatures as shown in Refs. Wicksted et al., 1984; Ishikawa et al., 1985. These anisotropic fluctuations are preferentially polarized along the axis which is parallel to the low temperature ordered magnetic moment. However, these fluctuations are located at an incommensurate wave vector of =( 0.45, 0, 0.5) and are distinct from the low temperature commensurate magnetic order and the fluctuations associated with this order which occurs at (0.5, 0, 0.5). This indicates that these high temperature fluctuations are associated with a competing phases. The polarization and also the wavevector are the same as the collinear spin-density wave reviewed above for Fe0.124(5)Te. We therefore conclude that this magnetic density wave phase competes with collinear and commensurate order in the Fe1+xTe phase diagram.
IV The magnetic structure in x=0.141(5) - Helical magnetism and ordered interstitial iron sites
Having discussed the competition between and localized collinear magnetism and spin density wave phase in iron deficient Fe1+xTe for less than 0.12, we now discuss single crystal neutron diffraction for large concentrations of interstitial iron where helical magnetic order has been previously observed.
Owing to the presence of ferromagnetic iron oxide near the surface of the single crystal, polarized experiments on large interstitial iron concentrations were not successful. Therefore we pursued single crystal unpolarized measurements on HB-3A (Oak Ridge).
Large concentrations of interstitial iron have been found to result in semiconducting or poorly metallic behavior over a broad temperature range. Rodriguez et al. (2013) Further transport studies on superconducting samples of Fe1+xTe1-y(Se,S)y found evidence for interstitial iron even causing charge localization. Liu et al. (2009) Here we use single crystal neutron diffraction to investigate the magnetism on the interstitial iron site in Fe1.141(5)Te.
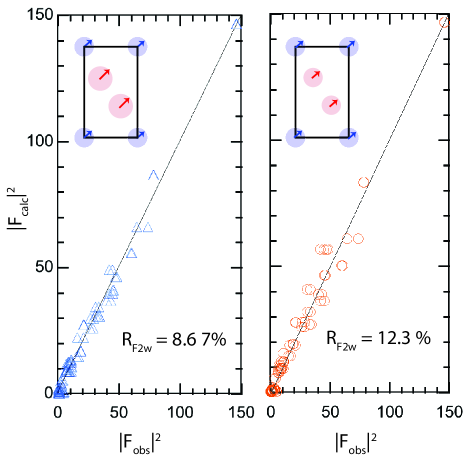
Results of a single crystal refinement for Fe1.141(5)Te is illustrated in Fig. 8 which plots as a function of with the -factor listed for each fit. This particular concentration of interstitial iron is placed beyond the Lifshitz point separating collinear and helical magnetism. Two models are shown in Fig. 8, the first where the interstitial iron moment size was allowed to vary independently of the moment size in the FeTe layers and the second where both were constrained to be equal. The first model (panel ) refines to 2.01(2) and 3.5(5) respectively for iron in the FeTe layers and interstitial sites respectively. The constrained model (panel ) refines to 2.1(1) .
The refined helical magnetic structure in Fe1.141(5)Te is different to the collinear phase found for smaller interstitial iron concentrations. It is also different to the helical phase in FeAs Rodriguez et al. (2011a); Segawa and Ando (2009); Selte and Kjekshus (1969) which displays a noncollinear spin density wave with the spin amplitude along the axis direction larger than the direction. The magnetic iron moments refine to a uniform helical magnetic structure. The refinement also illustrates that the interstitial sites are fully ordered with a moment size that is comparable, and larger within error, to ordered magnetic moments within the FeTe layers. We note that while powder diffraction results indicated a substantial magnetic moment on the interstitial site, the single crystal results presented here confirm this result along with the fact that the interstitial site follows the same magnetic structure as the FeTe layers.
V =0.124(5)- Spin density wave and search for charge wave
We now discuss the magnetic properties at the border between collinear and helical order in the Fe1+xTe phase diagram by presenting neutron diffraction data on a single crystal of Fe1.124(5)Te.
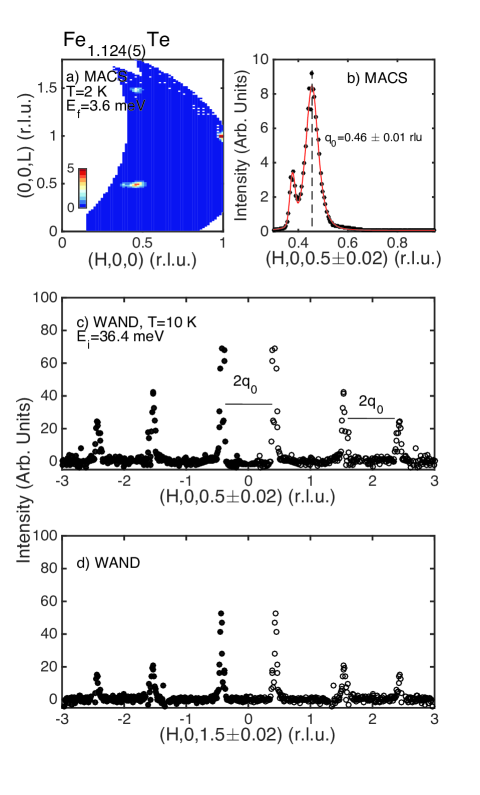
Measurements of the elastic neutron cross section at the border between collinear antiferromagnetism and the helical phase were done using a single crystal of Fe1.124(5)Te. Figure 9 illustrates a constant energy slice at the elastic position taken on the MACS cold triple axis spectrometer at 2 K. Panel displays a cut along the H direction illustrating the incommensurate wavevector at =0.46 0.01 along the H direction based on fits to a Lorentzian squared lineshape. Within experimental error, the peak is commensurate along L being positioned at L=0.5 and no observable evidence of second harmonics at 2 are observable in the data (within 2% of the peak height at =0.46 0.01). As discussed previously in Ref. Rodriguez et al., 2011b, the static magnetism corresponding to this peak is short-range along the axis evidenced by a broader than resolution lineshape along the H direction. The lineshape is resolution limited along corresponding to long range order along L. An analysis based on polarized neutrons found that the magnetic structure is polarized along the axis in contrast to the helical order for Fe1+xTe samples on the iron rich side of the phase diagram. The magnetic structure at =0.124(5) therefore corresponds to a collinear spin-density wave phase. A second peak is observed at a lower position and as discussed in Refs. Rodriguez et al., 2011b, 2013 based on a polarized neutron analysis, this corresponds to a small inclusion of a helical phase with a larger interstitial iron concentration.
As discussed above in the introduction, there have been several reports of magnetism at this incommensurate wave vector, even in superconducting samples doped with Se. However, it is not clear from the limited momentum range if the peak is incommensurate with respect to the nuclear positions or to the antiferromagnetic H=0.5 point as might be expected based on analogies with cuprates. Figure 9, panels and , show cuts at L=0.5 and L=1.5 taken on WAND where the combined thermal neutron wavelengths and broad detector coverage allow us to study the magnetism over a broad range of momentum transfer. The cuts prove the result reported previously that the propagation vector is =0.46 0.01 and is incommensurate with respect to the nuclear positions. This contrasts with some studies that have stated that the propagation vector is taken as (0.5-,0,0.5) Wen et al. (2012) and is only clear in the current data set given the broad momentum coverage afforded by the WAND diffractometer.
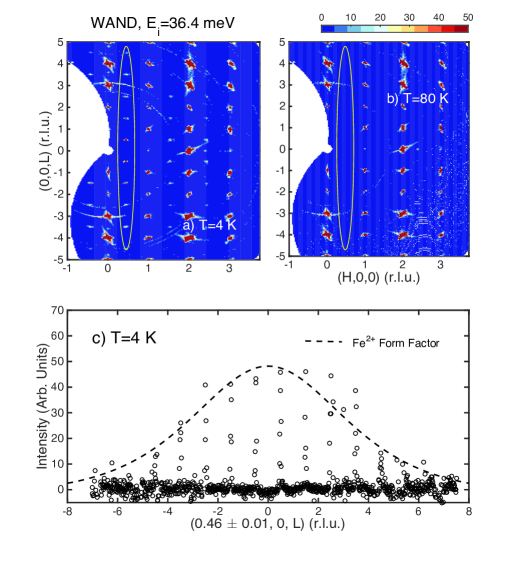
Figure 10 illustrates an extensive reciprocal space map at 4 K (in the magnetically ordered state) and also at high temperatures of 80 K where Fe1.124(5)Te is paramagnetic. A series of magnetic superlattice peaks are clearly observed at H 0.46, 1.54 and 2.45 r.l.u. at T=4 K, but absent at high temperatures of 80 K, confirming the magnetic origin. This is highlighted by the yellow ellipse at H 0.46 at both temperatures. Panel plots an L scan at H=0.46 0.01 r.l.u. showing that the magnetic peaks appear at the commensurate half integer positions along L and also that the intensity decays with the expected Fe2+ form factor. This is consistent with dipolar selection rules for the intensity based on localized magnetic moments pointing along the axis.
Our WAND results are not consistent with suggestions of antiphase boundaries separating locally ordered collinear states. Mazin and Johannes (2009) While such a structure can produce scattering at incommensurate positions, as observed in stripe phases of nickelates Tranquada et al. (1996) and also cuprates Wakimoto et al. (2000, 1999); Stock et al. (2004, 2010), it fails to model both the incommensurate wavevector and the lack of higher harmonics that would be associated with a sharp uniaxial boundary. It has recently been proposed that the structure maybe understood in terms of solitons Materne et al. (2015), however the magnetic structure proposed would produce a and axis component to the scattering in our previous polarized neutron diffraction studies of this compound. This contradicts the data which is consistent with a component only along the -axis. We therefore conclude that the short-range static antiferromagnetism observed near interstitial iron concentrations of 0.12 is more consistent with a spin density wave where the magnitude of the spin varies along the direction of propagation.
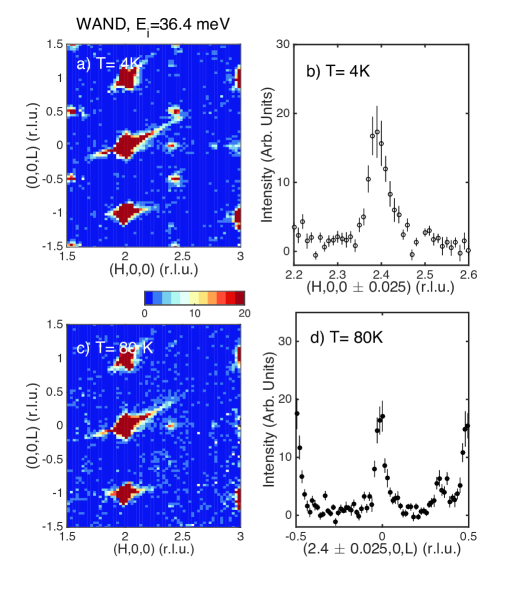
Using the wide momentum coverage on WAND, we have also searched for any charge density wave that may accompany this spin density wave. The single crystal momentum maps in Fig. 10 and display no observable superlattice peaks that may be associated with a charge density wave. A small peak is observed near (2.39 0.05, 0, 0 0.05), however this peak is present at both 4 K and 80 K and is not observable near any other primary nuclear Bragg peak measured in our reciprocal space mapping. The peak is illustrated in Fig. 11. While a coupling between strain or charge and magnetism is expected, Turner et al. (2009) as displayed in Cr metal Fawcett (1988), the charge density wave peak intensity is in proportion to the spin density wave and should be at harmonic of the primary wavevector which is not the case here. Pynn et al. (1976); Kotani (1976, 1978)
The lack of consistency with what has been discussed in relation to coupled spin and charge density waves and the wave vector imply that this peak is not associated with a charge density wave. From an experimental viewpoint, the peak is also suspicious given the large tails from the (200) peak likely originating from strong bragg scattering feeding through the collimators. Shirane et al. (2002) A similar structure can be seen near (004) which is also a strong nuclear Bragg peak. The inconsistency between different Bragg positions and also the correlation with strong nuclear Bragg lead us to conclude that the peak is likely spurious. These small weak peaks are likely due to secondary scattering from the aluminium window located on the multi wire detector system.
VI Conclusions and Discussion
We have presented a study of the magnetic structures and fluctuations near the Lifshitz point in the Fe1+xTe phase diagram using neutron diffraction, inelastic scattering, and neutron polarization analysis. We have identified an incommensurate spin density wave which competes with collinear “double-stripe” magnetism and is stabilized over a narrow range of interstitial iron concentrations. These incommensurate fluctuations are highly anisotropic being longitudinally polarized along and also anisotropic in the dynamical correlation lengths as evidenced by differing widths along H and K. The anisotropy reflects stronger correlations along the direction and weaker correlations along . Such anisotropy was also observed in superconducting FeTe1-xSex Xu et al. (2016) and modelled with correlations reflecting a such anisotropy, but tilted to reflect that the correlations were centered around the (, ) position instead of the (, 0) position found here. These incommensurate correlations are observed to compete with collinear magnetic order for interstitial iron concentrations less than 0.12. For larger interstitial iron concentrations this competition between incommensurate spin density fluctuations and collinear order is replaced by robust helical magnetic order. Our studies of helically ordered samples have not observed any evidence of incommensurate order at H 0.45 even above TN. Rodriguez et al. (2013) Based on this, we speculate that this incommensurate order competes with collinear magnetic order while helical magnetism is a robust feature of the Fe1+xTe phase diagram.
In previous studies, we have related the temperature dependence of these fluctuations to the resistivity with the suggestion that they are the origin of the semiconducting properties above TN in the collinear magnetically ordered part of the Fe1+xTe phase diagram. Rodriguez et al. (2013) The results are also confirmed by measurements under pressure where the structure can be tuned in a similar manner to doping interstitial iron. Okada et al. (2009) The temperature range also coincides with where optical conductivity observes strong fluctuations in the terahertz regime Homes et al. (2010) which is the same energy and temperature range where we observe highly anisotropic spin density wave fluctuations. While these correlations are dynamic for the iron deficient region of the Fe1+xTe phase diagram, static spin density magnetism is stabilized for a narrow region of 0.12.
Localized models of the magnetism in Fe1+xTe have been very successful in predicting the two dominant magnetic and structure phases - the collinear magnetic phase at small interstitial iron and the helical magnetic phase at large interstitial iron concentrations. Chen et al. (2013) However, to our knowledge, these models have not predicted the density wave phase we observe that competes with collinear magnetism and is stabilized for a narrow range of interstitial iron concentrations near . These models also do not account for the anisotropic magnetic fluctuations at temperatures above TN which are incommensurate, polarized along , and correlated anisotropically in momentum. The existence of an instability to orbital order could help explain the origin of a large anisotropy in the paramagnetic fluctuations illustrated above in Fe1.05(7)7)Te. This extra order parameter present at high temperatures, and the concomitant structural and magnetic transition at TN, has been used to explain the resistivity anomaly observed on the interstitial iron poor side of the Fe1+xTe phase diagram. Bishop et al. (2016)
The presence of an orbital degree of freedom has also been implicated in understanding the magnetic correlations and phase transitions in iron based systems. Khalyavin et al. (2014); Chen et al. (2009b) The Hunds rule coupling has been cited as the origin of the strong electronic correlations Yin et al. (2010); Liang et al. (2012); Lanata et al. (2013); Bascones et al. (2012) along with multi orbital models. Kubo (2007); Zhang et al. (2009); Rsing et al. (2015) where localized magnetism exists on some orbitals while others are more itinerant. Ducatman et al. (2014) The presence of an delocalized orbital degree of freedom may also support recent high energy neutron inelastic scattering measurements which find a deficit of spectral weight and also a considerable energy dampening of the excitations at high energy transfer. Stock et al. (2014)
In summary, we have reported the competition between a spin density wave phase with localized collinear and helical magnetism for interstitial iron concentrations near the Lifshitz point at 0.12. Using neutron diffraction, we report on the magnetic structure near this point. Polarized neutron inelastic scattering for concentrations less than 0.12 observe a competition between localized and longitudinal polarized spin fluctuations. For larger interstitial iron concentrations, this is replaced by robust helical magnetic order. Based on these results, we suggest the presence of a spin density wave which competes with ordered antiferromagnetism in the Fe1+xTe phase diagram.
This work was funded by the Carnegie Trust for the Universities of Scotland, the Royal Society of Edinburgh, the EPSRC, and through the National Science Foundation (Grant No. DMR-09447720). Research at Oak Ridge National Laboratory’s HFIR was sponsored by the Scientific User Facilities Division, Office of Basic Energy Sciences, U. S. Department of Energy.
References
- Kamihara et al. (2008) Y. Kamihara, T. Watanabe, M. Hirano, and H. Hosono, J. Am. Chem. Soc. 130, 3296 (2008).
- Hsu et al. (2008) F. C. Hsu, J. Y. Luo, K. W. Yeh, T. K. Chen, T. W. Huang, P. M. Wu, Y. C. Lee, Y. L. Huang, Y. Y. Chu, D. C. Yan, and M. K. Wu, Proc. Natl. Acad. Sci. 105, 14262 (2008).
- Dai (2015) P. Dai, Rev. Mod. Phys. 87, 855 (2015).
- Inosov (2016) D. S. Inosov, C. R. Physique 17, 60 (2016).
- Ishida et al. (2009) K. Ishida, Y. Nakai, and H. Honsono, J. Phys. Soc. Jpn. 78, 062001 (2009).
- Green and Paglione (2010) R. L. Green and J. Paglione, Nat. Phys. 6, 645 (2010).
- Johnston (2010) D. C. Johnston, Adv. Phys. 59, 803 (2010).
- Stock and McCabe (2016) C. Stock and E. E. McCabe, J. Phys.: Condens. Matter 28, 453001 (2016).
- Wen et al. (2011) J. Wen, G. Xu, G. Gu, J. M. Tranquada, and R. J. Birgeneau, Rep. Prog. Phys. 74, 124503 (2011).
- Dai et al. (2012) P. Dai, J. Hu, and E. Dagotto, Nat. Phys. 8, 709 (2012).
- Lumsden and Christianson (2010) M. Lumsden and A. D. Christianson, J. Phys.: Condens. Matter 22, 203203 (2010).
- Birgeneau et al. (2006) R. J. Birgeneau, C. Stock, J. M. Tranquada, and K. Yamada, J. Phys. Soc. Jpn. 11, 111003 (2006).
- Kastner et al. (1998) M. A. Kastner, R. J. Birgeneau, G. Shirane, and Y. Endoh, Rev. Mod. Phys. 70, 897 (1998).
- Raghu et al. (2008) S. Raghu, X.-L. Qi, C. X. Liu, D. J. Scalapino, and S. C. Zhang, Phys. Rev. B 77, 220503(R) (2008).
- Graser et al. (2009) S. Graser, T. A. Maier, P. J. Hirschfeld, and D. J. Scalapino, New Journal of Physics 11, 025016 (2009).
- Lei et al. (2012) H. Lei, D. Graf, R. Hu, H. Ryu, E. S. Choi, S. W. Tozer, and C. Petrovic, Phys. Rev. B 85, 094515 (2012).
- Kruger et al. (2009) F. Kruger, S. Kumar, J. Zaanen, and J. van den Brink, Phys. Rev. B 79, 054504 (2009).
- Lv et al. (2010) W. Lv, F. Kruger, and P. Phillips, Phys. Rev. B 82, 045125 (2010).
- Fruchart et al. (1975) D. Fruchart, P. Convert, P. Wolfers, R. Madar, J. P. Senateur, and R. Fruchart, Mat. Res. Bull. 10, 169 (1975).
- Sales et al. (2009) B. C. Sales, A. S. Sefat, M. A. McGuire, R. Y. Jin, D. Mandrus, and Y. Mozharivskyj, Phys. Rev. B 79, 094521 (2009).
- Deguchi et al. (2012) K. Deguchi, Y. Takano, and Y. Mizuguchi, Sci. Technol. Adv. Mater. 13, 054303 (2012).
- (22) S. Rosler, C. Koz, S. Wirth, and U. Schwarz, arxiv:1606.01012v1 .
- Mizuguchi and Takano (2010) Y. Mizuguchi and Y. Takano, J. Phys. Soc. Jpn. 79, 102001 (2010).
- Yin et al. (2011) Z. P. Yin, K. Haule, and G. Kotliar, Nat. Mater. 10, 932 (2011).
- McQueen et al. (2009) T. M. McQueen, Q. Huang, V. Ksenofontov, C. Felser, Q. Xu, H. Zandbergen, Y. S. Hor, J. Allred, A. J. Williams, D. Qu, J. Checkelsky, N. P. Ong, and R. J. Cava, Phys. Rev. B 79, 014522 (2009).
- Stock et al. (2012) C. Stock, E. E. Rodriguez, and M. A. Green, Phys. Rev. B 85, 094507 (2012).
- Vivanco and Rodriguez (2016) H. K. Vivanco and E. E. Rodriguez, J. Solid State Chem. 242, 3 (2016).
- Rodriguez et al. (2011a) E. Rodriguez, C. Stock, P. Y. Hsieh, N. Butch, J. Paglione, and M. Green, Chem. Sci. 2, 1782 (2011a).
- Xu et al. (2016) Z. Xu, J. A. Schneeloch, J. Wen, E. S. Bozin, G. E. Granroth, B. L. Winn, M. Feygenson, R. J. Birgeneau, G. Gu, I. A. Zaliznyak, J. M. Tranquada, and G. Xu, Phys. Rev. B 93, 104517 (2016).
- Tang et al. (2016) S. C. Tang, M. C. Ding, and Y. Z. Zhang, Sci. Rep. 6, 19031 (2016).
- Thampy et al. (2012) V. Thampy, J. Kang, J. A. Rodriguez-Rivera, W. Bao, A. T. Savici, J. Hu, T. J. Liu, B. Qian, D. Fobes, Z. Q. Mao, C. B. Fu, W. C. Chen, Q. Ye, R. W. Erwin, T. R. Gentile, Z. Tesanovic, and C. Broholm, Phys. Rev. Lett. 108, 107002 (2012).
- Rodriguez et al. (2013) E. E. Rodriguez, D. A. Sokolov, C. Stock, M. A. Green, O. Sobolev, J. A. Rodriguez-Rivera, H. Cao, and A. Daoud-Aladine, Phys. Rev. B 88, 165110 (2013).
- Rodriguez et al. (2011b) E. E. Rodriguez, C. Stock, P. Zajdel, K. L. Krycka, C. F. Majkrzak, P. Zavalij, and M. A. Green, Phys. Rev. B 84, 064403 (2011b).
- Koz et al. (2013) C. Koz, S. Rossler, A. A. Tsirlin, S. Wirth, and U. Schwarz, Phys. Rev. B 88, 094509 (2013).
- Bao et al. (2009) W. Bao, Y. Qiu, Q. Huang, M. A. Green, P. Zajdel, M. R. Fitzsimmons, M. Zhernenkov, S. Chang, M. Fang, B. Qian, E. K. Vehstedt, J. Yang, H. M. Pham, L. Spinu, and Z. Q. Mao, Phys. Rev. Lett. 102, 247001 (2009).
- Li et al. (2009) S. Li, C. delaCruz, Q. Huang, Y. Chen, J. W. Lynn, J. Hu, Y. L. Huang, F. C. Hsu, K. W. Yeh, M. K. Wu, and P. Dai, Phys. Rev. B 79, 054503 (2009).
- Chen et al. (2009a) G. F. Chen, Z. G. Chen, J. Dong, W. Z. Hu, G. Li, X. D. Zhang, P. Zheng, J. L. Luo, and N. L. Wang, Phys. Rev. B 79, 140509(R) (2009a).
- Collins (2002) M. Collins, Neutron Scattering with a Triple Axis Spectrometer (Cambridge University Press, Cambridge, UK, 2002).
- Materne et al. (2015) P. Materne, C. Koz, U. K. Rossler, M. Doerr, T. Goltz, H. H. Klauss, U. Schwarz, S. Wirth, and S. Rossler, Phys. Rev. Lett. 115, 177203 (2015).
- Hasselmann et al. (2004) N. Hasselmann, A. H. C. Neto, and C. M. Smith, Phys. Rev. B 69, 014424 (2004).
- Xu et al. (2010) Z. Xu, J. Wen, G. Xu, Q. Jie, Z. Lin, Q. Li, S. Chi, D. K. Singh, G. Gu, and J. M. Tranquada, Phys. Rev. B 82, 104525 (2010).
- Bendele et al. (2010) M. Bendele, P. Babkevich, S. Katrych, S. N. Gvasaliya, E. Pomjakushina, K. Condor, B. Roessli, A. T. Boothroyd, R. Khasanov, and H. Keller, Phys. Rev. B 82, 212504 (2010).
- Wen et al. (2009) J. Wen, G. Xu, Z. Xu, Z. W. Lin, Q. Li, W. Ratcliff, G. Gu, and J. M. Tranquada, Phys. Rev. B 80, 104506 (2009).
- Wen et al. (2012) J. Wen, Z. Xu, G. Xu, M. D. Lumsden, P. N. Valdivia, E. Bourret-Courchesne, G. Gu, D. H. Lee, J. M. Tranquada, and R. J. Birgeneau, Phys. Rev. B 86, 024401 (2012).
- Mazin (2010) I. I. Mazin, Nature 464, 183 (2010).
- Hirayama et al. (2013) M. Hirayama, T. Miyake, and M. Imada, Phys. Rev. B 87, 195144 (2013).
- Akbari et al. (2011) A. Akbari, I. Eremin, and P. Thalmeier, Phys. Rev. B 84, 134513 (2011).
- Han and Savrasov (2009) M. J. Han and S. Y. Savrasov, Phys. Rev. Lett. 103, 067001 (2009).
- Singh (2010) P. P. Singh, Phys. Rev. Lett. 104, 099701 (2010).
- Han and Savrasov (2010) M. J. Han and S. Y. Savrasov, Phys. Rev. Lett. 104, 099702 (2010).
- Ding et al. (2013) M. C. Ding, H. Q. Lin, and Y. Z. Zhang, Phys. Rev. B 87, 125129 (2013).
- Chubukov and Xing (2016) A. V. Chubukov and R. Q. Xing, Phys. Rev. B 93, 165141 (2016).
- Ma et al. (2009) F. Ma, W. Ji, J. Hu, Z. Y. Lu, and T. Xiang, Phys. Rev. Lett. 102, 177003 (2009).
- Ducatman et al. (2012) S. Ducatman, N. B. Perkins, and A. Chubukov, Phys. Rev. Lett. 109, 157206 (2012).
- Chen et al. (2013) G. Chen, S. Choi, and L. Radzihovsky, Phys. Rev. B 88, 165117 (2013).
- Hu et al. (2012) J. Hu, B. Xu, W. Liu, N. N. Hao, and Y. Wang, Phys. Rev. B 85, 144403 (2012).
- Argyriou et al. (2010) D. N. Argyriou, A. Hiess, A. Akbari, I. Eremin, M. M. Korshunov, J. Hu, B. Qian, Z. Mao, Y. Qiu, C. Broholm, and W. Bao, Phys. Rev. B 81, 220503 (2010).
- Lumsden et al. (2010) M. Lumsden, A. D. Christianson, E. A. Goremychkin, S. E. Nagler, H. A. Mook, M. B. Stone, D. L. Abernathy, T. Guidi, G. J. MacDougall, C. de la Cruz, A. S. Sefat, M. A. McGuire, B. C. Sales, and D. Mandrus, Nat. Phys. 6, 182 (2010).
- Lipscombe et al. (2011) O. J. Lipscombe, G. F. Chen, C. Fang, T. G. Perring, D. L. Abernathy, A. D. Christianson, T. Egami, N. Wang, J. Hu, and P. Dai, Phys. Rev. Lett. 106, 057004 (2011).
- Zaliznyak et al. (2011) I. A. Zaliznyak, Z. Xu, J. M. Tranquada, G. Gu, A. M. Tsvelik, and M. B. Stone, Phys. Rev. Lett. 107, 216403 (2011).
- Stock et al. (2014) C. Stock, E. E. Rodriguez, O. Sobolev, J. A. Rodriguez-Rivera, R. A. Ewings, J. W. Taylor, A. D. Christianson, and M. A. Green, Phys. Rev. B 90, 121113(R) (2014).
- Stock et al. (2005) C. Stock, W. J. L. Buyers, R. A. Cowley, P. S. Clegg, R. Coldea, C. D. Frost, R. Liang, D. Peets, D. Bonn, W. N. Hardy, and R. J. Birgeneau, Phys. Rev. B 71, 024522 (2005).
- Rodriguez et al. (2008) J. A. Rodriguez, D. M. Adler, P. C. Brand, C. Broholm, J. C. Cook, C. Brocker, R. Hammond, Z. Huang, P. Hundertmark, J. W. Lynn, N. C. Maliszewskyj, J. Moyer, J. Orndorff, D. Pierce, T. D. Pike, G. Scharfstein, S. A. Smee, and R. Vilaseca, Meas. Sci. Technol. 19, 034023 (2008).
- Shirane et al. (2002) G. Shirane, S. M. Shapiro, and J. M. Tranquada, Neutron Scattering with a Triple Axis Spectrometer (Cambridge University Press, Cambridge, UK, 2002).
- Chi et al. (2011) S. Chi, J. A. Rodriguez-Rivera, J. W. Lynn, C. Zhang, D. Phelan, D. K. Singh, R. Paul, and P. Dai, Phys. Rev. B 84, 214407 (2011).
- Okazaki et al. (2011) K. Okazaki, S. Sugai, S. Niitaka, and H. Takagi, Phys. Rev. B 83, 035103 (2011).
- Lu et al. (2014) X. Lu, J. T. Park, R. Zhang, H. Luo, A. H. Nevidomskyy, Q. Si, and P. Dai, Science 345, 657 (2014).
- Fernandes et al. (2014) R. M. Fernandes, A. V. Chubukov, and J. Schmalian, Nat. Phys. 10, 97 (2014).
- Subedi et al. (2008) A. Subedi, L. Zhang, D. J. Singh, and M. H. Du, Phys. Rev. B 78, 134514 (2008).
- Park et al. (2010) J. T. Park, D. S. Inosov, A. Yaresko, S. Graser, D. L. Sun, P. Bourges, Y. Sidis, Y. Li, J. H. Kim, D. Haug, A. Ivanov, K. Hradil, A. Schneidewind, P. Link, E. Faulhaber, I. Glavatskyy, C. T. Lin, B. Keimer, and V. Hinkov, Phys. Rev. B 82, 134503 (2010).
- Stock et al. (2011) C. Stock, E. E. Rodriguez, M. A. Green, P. Zavalij, and J. A. Rodriguez-Rivera, Phys. Rev. B 84, 045124 (2011).
- Parshall et al. (2012) D. Parshall, G. Chen, L. Pintschovius, D. Lamago, T. Wolf, L. Radzihovsky, and D. Reznik, Phys. Rev. B 85, 140515(R) (2012).
- Wicksted et al. (1984) J. P. Wicksted, P. Boni, and G. Shirane, Phys. Rev. B 30, 3655 (1984).
- Ishikawa et al. (1985) Y. Ishikawa, Y. Noda, Y. J. Uemura, C. F. Majkrzak, and G. Shirane, Phys. Rev. B 31, 5884 (1985).
- Liu et al. (2009) T. J. Liu, X. Ke, B. Qian, J. Hu, D. Fobes, E. K. Vehstedt, H. Pham, J. H. Yang, M. H. Fang, L. Spinu, P. Schiffer, Y. Liu, and Z. Q. Mao, Phys. Rev. B 80, 174509 (2009).
- Segawa and Ando (2009) K. Segawa and Y. Ando, J. Phys. Soc. Jpn. 78, 104720 (2009).
- Selte and Kjekshus (1969) K. Selte and A. Kjekshus, Acta Chem Scand 23, 2047 (1969).
- Mazin and Johannes (2009) I. I. Mazin and M. D. Johannes, Nat. Phys. 5, 141 (2009).
- Tranquada et al. (1996) J. M. Tranquada, D. J. Buttrey, and V. Sachan, Phys. Rev. B 54, 12318 (1996).
- Wakimoto et al. (2000) S. Wakimoto, R. J. Birgeneau, M. A. Kastner, Y. S. Lee, R. Erwin, P. M. Gehring, S. H. Lee, M. Fujita, K. Yamada, Y. Endoh, K. Hirota, and G. Shirane, Phys. Rev. B 61, 3699 (2000).
- Wakimoto et al. (1999) S. Wakimoto, G. Shirane, Y. Endoh, K. Hirota, S. Ueki, K. Yamada, R. J. Birgeneau, M. A. Kastner, Y. S. Lee, P. M. Gehring, and S. H. Lee, Phys. Rev. B 60, R769(R) (1999).
- Stock et al. (2004) C. Stock, W. J. L. Buyers, R. Liang, D. Peets, Z. Tun, D. Bonn, W. N. Hardy, and R. J. Birgeneau, Phys. Rev. B 69, 014502 (2004).
- Stock et al. (2010) C. Stock, R. A. Cowley, W. J. L. Buyers, C. D. Frost, J. W. Taylor, D. Peets, R. Liang, D. Bonn, and W. N. Hardy, Phys. Rev. B 82, 174505 (2010).
- Turner et al. (2009) A. M. Turner, F. Wang, and A. Vishwanath, Phys. Rev. B 80, 224504 (2009).
- Fawcett (1988) E. Fawcett, Rev. Mod. Phys. 60, 209 (1988).
- Pynn et al. (1976) R. Pynn, W. Press, S. M. Shapiro, and S. A. Werner, Phys. Rev. B 13, 295 (1976).
- Kotani (1976) C. Kotani, J. Phys. Soc. Jpn. 41, 1473 (1976).
- Kotani (1978) C. Kotani, J. Phys. Soc. Jpn. 44, 1455 (1978).
- Okada et al. (2009) H. Okada, H. Takahashi, Y. Mizuguchi, Y. Takano, and H. Takahashi, J. Phys. Soc. Jpn. 78, 083709 (2009).
- Homes et al. (2010) C. C. Homes, A. Akrap, J. S. Wen, Z. J. Xu, Z. W. Lin, Q. Li, and G. D. Gu, Phys. Rev. B 81, 180508(R) (2010).
- Bishop et al. (2016) C. B. Bishop, A. Moreo, and E. Dagotto, Phys. Rev. Lett. 117, 117201 (2016).
- Khalyavin et al. (2014) D. D. Khalyavin, S. W. Lovesey, P. Manuel, F. Kruger, S. Rosenkranz, J. M. Allred, O. Chmaissem, and R. Osborn, Phys. Rev. B 90, 174511 (2014).
- Chen et al. (2009b) C. C. Chen, B. Moritz, J. V. den Brink, T. P. Devereaux, and R. R. P. Singh, Phys. Rev. B 80, 180418(R) (2009b).
- Yin et al. (2010) W. G. Yin, C. C. Lee, and W. Ku, Phys. Rev. Lett. 105, 107004 (2010).
- Liang et al. (2012) S. Liang, G. Alvarez, C. Sen, A. Moreo, and E. Dagotto, Phys. Rev. Lett. 109, 047001 (2012).
- Lanata et al. (2013) N. Lanata, H. U. R. Strand, G. Giovannetti, B. Hellsing, L. de’Medici, and M. Capone, Phys. Rev. B 87, 045122 (2013).
- Bascones et al. (2012) E. Bascones, B. Valenzuela, and M. J. Calderon, Phys. Rev. B 86, 174508 (2012).
- Kubo (2007) K. Kubo, Phys. Rev. B 75, 224509 (2007).
- Zhang et al. (2009) J. Zhang, R. Sknepnek, R. M. Fernandes, and J. Schmalian, Phys. Rev. B 79, 220502(R) (2009).
- Rsing et al. (2015) U. D. Rsing, S. C. White, S. Schmaus, V. Tsurkan, A. Loidl, J. Deisenhofer, and P. Wahl, Sci. Adv. 1, e1500206 (2015).
- Ducatman et al. (2014) S. Ducatman, R. M. Fernandes, and N. B. Perkins, Phys. Rev. B 90, 165123 (2014).