Molecular gas dominated 50 kpc ram pressure stripped tail
of the Coma galaxy D100**affiliation: Based on observations made with the IRAM 30m
Telescope. IRAM is supported by INSU/CNRS (France), MPG (Germany), and
IGN (Spain).
Abstract
We have discovered large amounts of molecular gas, as traced by CO emission, in the ram pressure stripped gas tail of the Coma cluster galaxy D100 (GMP 2910), out to large distances of about 50 kpc. D100 has a 60 kpc long, strikingly narrow tail which is bright in X-rays and H. Our observations with the IRAM 30m telescope reveal in total of H2 (assuming the standard CO-to-H2 conversion) in several regions along the tail, thus indicating that molecular gas may dominate its mass. Along the tail we measure a smooth gradient in the radial velocity of the CO emission that is offset to lower values from the more diffuse H gas velocities. Such a dynamic separation of phases may be due to their differential acceleration by ram pressure. D100 is likely being stripped at a high orbital velocity km s-1 by (nearly) peak ram pressure. Combined effects of ICM viscosity and magnetic fields may be important for the evolution of the stripped ISM. We propose D100 has reached a continuous mode of stripping of dense gas remaining in its nuclear region. D100 is the second known case of an abundant molecular stripped-gas tail, suggesting that conditions in the ICM at the centers of galaxy clusters may be favorable for molecularization. From comparison with other galaxies, we find there is a good correlation between the CO flux and the H surface brightness in ram pressure stripped gas tails, over dex.
Subject headings:
galaxies: clusters: individual (Coma) — galaxies: individual (D100) — galaxies: evolution — galaxies: ISM — galaxies: star formation — submillimeter: ISM1. Introduction
The environments of galactic tails formed by ram pressure stripping (RPS) are likely different from typical environments of galaxy disks. The interstellar matter (ISM) stripped from galaxies infalling into clusters by dynamical pressure of the intra-cluster medium (ICM) that fills up the space in between galaxies presumably mixes with the surrounding ICM. Due to various competing thermodynamic processes a spectrum of temperatures and densities develops in the wakes of stripped galaxies. Ram pressure stripping as an efficient hydrodynamical mechanism of ISM removal from galaxies in clusters, as well as the fate of the stripped ISM, has been studied both observationally and theoretically (Gunn & Gott, 1972; Nulsen, 1982; Cowie & Songaila, 1977; Larson et al., 1980; Giovanelli & Haynes, 1983; Cayatte et al., 1990; Kenney & Koopmann, 1999; Koopmann & Kenney, 2004; Chung et al., 2009; Vollmer et al., 2001; Roediger & Hensler, 2005; Jáchym et al., 2007; Kapferer et al., 2009; Tonnesen et al., 2011; Tonnesen & Bryan, 2012, and others).
In the nearby, , Virgo cluster, many short off-disk, mostly H I features are known (Kenney et al., 2004; Chung et al., 2009; Abramson et al., 2011; Kenney et al., 2014). While there are also examples of longer ram pressure stripped gas tails (length ; Oosterloo & van Gorkom, 2005; Chung et al., 2007; Boselli et al., 2016), most of the gas missing in the Virgo galaxies has not been revealed in the intra-cluster space (e.g., Vollmer & Huchtmeier, 2007). In the more distant cluster A1367, with about 5-times the Virgo mass, several long RPS tails were observed in H I (Scott et al., 2010, 2012).
In more massive clusters (), such as Coma or Norma, many examples of long (length ), clearly RPS tails are observed in (1) diffuse H (Gavazzi et al., 2001; Cortese et al., 2006, 2007; Sun et al., 2007; Yagi et al., 2007, 2010; Yoshida et al., 2004, 2008; Fossati et al., 2012); (2) X-rays (Wang et al., 2004; Finoguenov et al., 2004; Machacek et al., 2005; Sun & Vikhlinin, 2005; Sun et al., 2006, 2010). Some of the tails are observed in multiple wavelengths (mostly X-rays + H), such as ESO 137-001, NGC 4848 and GMP2910, but also NGC 4388 in Virgo.
Rather surprisingly, regions of young star formation have been revealed in some of the tails, either in H or UV (Kenney & Koopmann, 1999; Cortese et al., 2006; Sun et al., 2007; Yoshida et al., 2008; Smith et al., 2010; Hester et al., 2010; Yagi et al., 2013; Ebeling et al., 2014). This indicates that while ram pressure generally suppresses star formation in the disks, it may induce new star formation in the stripped medium. Dense molecular clouds are the principal sites of star formation in galaxies. Observed ongoing star formation in some of the tails is thus suggestive of the presence of molecular gas.
Indeed, an abundant cold molecular component was discovered for the first time in the tail of the Norma cluster galaxy ESO 137-001 (Jáchym et al., 2014). The detected amounts of cold molecular phase () are similar to those of hot ionized phase observed in the tail, suggesting that molecular gas may form a substantial fraction of the multi-phase gas. Moreover, in the tail of ESO 137-001, the observed gas components, including the rich molecular phase, together nearly account for the missing gas in the disk. Other tails were searched for molecular content: In the Virgo cluster, only upper limits on CO emission were measured in the tail of IC 3418 (Jáchym et al., 2013), while several regions with molecular gas were recently discovered at large distances in the tail of NGC 4388 (Verdugo et al., 2015), but corresponding only to a small fraction of total mass of the gas tail. Also, in the Virgo cluster, regions of off-disk CO emission were detected in NGC 4522, (Vollmer et al., 2008), as well as in the long H trail that connects M86 with NGC 4438 (Dasyra et al., 2012).
Formation and survival of molecular gas in the tails of ram pressure stripped galaxies, in the surroundings of the hot ICM, is an interesting problem worth of further observational and numerical efforts. Central regions of galaxy clusters have revealed that cold molecular gas may exist in the long filaments of cooling cores (e.g., Salomé et al., 2011). The central region of the Coma cluster, the most massive and most X-ray luminous cluster at , is an ideal laboratory for studying the hydro-dynamic effects of the surrounding ICM on galaxies as well as the fate of the stripped gas. The Coma cluster has the richest optical data among nearby massive clusters, already with more than 20 late-type galaxies with one-sided star-forming or ionized gas tails (Smith et al., 2010; Yagi et al., 2010), several of which are also bright in soft X-rays. One of the best galaxies to study is D100, a galaxy near the Coma core with a remarkable ram pressure gas stripped tail.
1.1. D100 (GMP 2910)
| RA, Dec (J2000) | .14, |
|---|---|
| type | SBab |
| redshiftaafootnotemark: , | 0.01784, 5348 km s-1 |
| km s-1 | |
| major diameter (-band) | |
| major-minor axis ratio | 1.35 |
| PA, inclination | , |
| total ( mag | () |
| stellar massbbfootnotemark: |
D100’s tail is the straightest, and has the largest length to width ratio, of any known ram pressure stripped tail. It is bright in multiple wavelengths. Fig. 2 shows the Subaru deep image of the galaxy (Yagi et al., 2010). H emission is coming from long ( kpc) and extremely narrow (mostly kpc) area that connects to the core of the galaxy (Yagi et al., 2007). The inner parts of the H tail are also shown in the middle panel of Fig. 1, overlaid on HST image of the galaxy (Caldwell et al., 1999). The D100 tail is also bright in soft X-rays (see Fig. 1, left panel). GALEX observations further revealed a UV component of the tail in the inner kpc of its length (Smith et al., 2010). Some star formation is thus likely taking place in the stripped material. No H I was detected with VLA in the galaxy or the tail (Bravo-Alfaro et al., 2000, 2001).
D100 is a SBab type galaxy with estimated stellar mass of (Yagi et al., 2010)111The stellar mass estimate comes from the MPA-JHU SDSS catalog in the DR7_v5.2 version.. It exhibits starburst in its core, with current star formation rate of yr-1 (derived from WISE band 4), and post-starburst characteristics in the rest of the disk. D100 is projected at only kpc from the Coma cluster center. Fig. 1 (left panel) shows its position in a Chandra view of the central parts of the Coma cluster. Its radial velocity component relative to the Coma mean is km s-1 (Yagi et al., 2007).
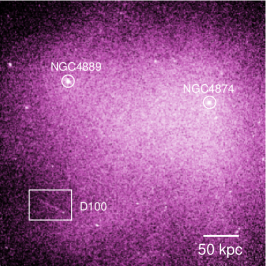
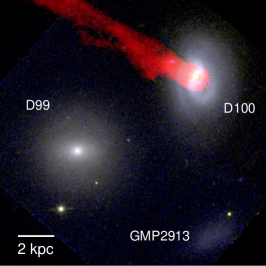
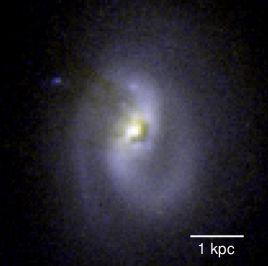
In the HST image in Fig. 1 (right panel), prominent dust features obscuring the eastern side of the disk are clearly visible (Caldwell et al., 1999). They coincide with the tail direction. The image also reveals a strong two-armed spiral pattern extending out to kpc radius. While two early-type galaxies are projected close to D100, GMP 2897 (D99) at kpc and GMP 2852 at kpc, their radial velocities are substantially larger (by about 4500 and 2000 km s-1, respectively). Another galaxy, a low-surface brightness GMP 2913 occurs at a projected distance of kpc from D100 (see Fig. 1, middle panel). Its radial velocity is only by km s-1 lower than that of D100, which makes their interaction possible (Yagi et al., 2007). However, the optical isophotes of D100 are symmetric and do not indicated any (strong) recent tidal interaction.
In this paper we report our discovery of abundant molecular gas component in the prominent tail of D100. We study its distribution and kinematics and compare it with the warm ionized component, as well as discuss the origin of the tail and of the molecular gas in the tail. The paper is organized as follows: our observations and results are introduced in Sections 2 and 3, kinematics of the tail is studied in Section 4, and the distribution of the CO emission and its correlation with H emission in Section 5. Also the CO-to-H2 conversion factor is discussed in Section 5. In Section 6, we discuss the origin of the tail, the efficiency of star formation in the stripped gas, and we study the orbit of the galaxy in Coma. Conclusions are drawn in Section 7. Throughout the paper, we use the Coma distance of Mpc, thus kpc. Cosmological constants in use were , , .
2. Observations
The observations were carried out with the IRAM 30m antenna operated by the Institut de Radio Astronomie Millimétrique (IRAM) at Pico Veleta, Spain, in December 2014. The EMIR receiver in E090 and E230 bands was used to observe simultaneously at the frequencies of the 12CO(1–0) ( GHz) and the 12CO(2–1) ( GHz) lines. Observing conditions were excellent with PWV as low as mm and system temperatures typically about K at CO(1-0) and K at CO(2-1). The FTS spectrometer with kHz spectral resolution was connected to both lines. Also the WILMA autocorrelator with a spectral resolution of 2 MHz at both 115 GHz and 230 GHz was used as a back-up. The observations were done in a symmetric Wobbler switching mode with the maximum throw of the secondary reflector of in order to avoid with OFF positions the tail if oriented in azimuth.
The half power beamwidth (HPBW) of the IRAM 30m main beam is described to a good accuracy by HPBW. Thus at the CO(1-0) and CO(2-1) sky frequencies, HPBW kpc and kpc, respectively. The corresponding main beam projected area arcsec kpc2 and arcsec kpc2, respectively, including a factor of a Gaussian beamshape correction.
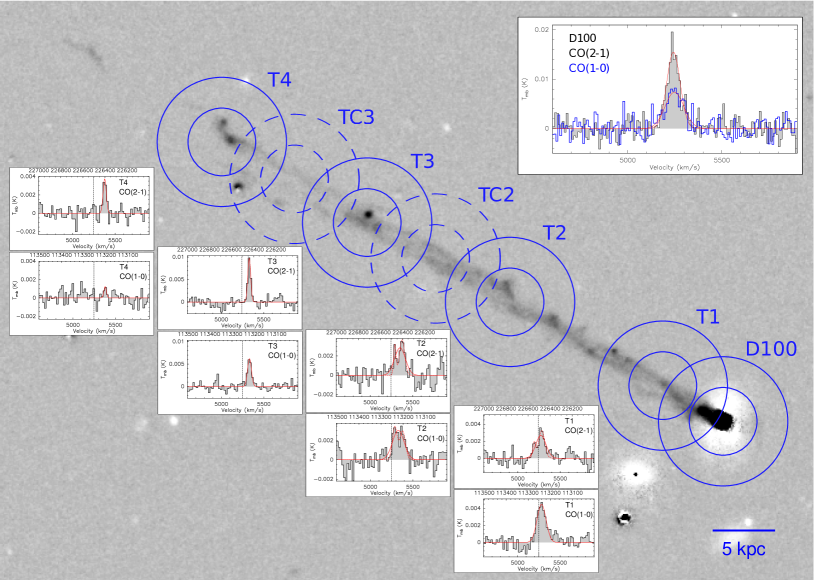
Seven integration points were selected to cover the main body of D100, as well as most of its H bright tail, out to a projected distance of kpc from the galaxy (see the scheme in Fig. 2). During the observation we first focused on H bright regions in the tail (pointings T1–T4) and only after revealing strong CO emission we moved in the remaining time also to intermediate parts of the tail with less (or less clumpy) H emission (’complementary’ pointings TC2 and TC3). The list of observed positions is given in Tab. 2, together with information on actual on-source observing times.
The FTS backend often suffered from “platforming” between individual units. There is a correction CLASS script FtsPlatformingCorrection5.class222 www.iram.es/IRAMES/mainWiki/AstronomerOfDutyChecklist that can subtract baselines individually from the affected FTS units. However, our expected lines were placed in the middle of the central FTS unit, thus platforming was not a big issue.
| R.A. | Dec. | |||
|---|---|---|---|---|
| (J2000) | (J2000) | (kpc) | (min) | |
| D100 | 13:00:09.14 | +27:51:59.2 | - | 99 |
| T1 | 13:00:09.88 | +27:52:04.1 | 5.2 | 196 |
| T2 | 13:00:11.84 | +27:52:19.4 | 19.4 | 112 |
| TC2 | 13:00:12.77 | +27:52:26.2 | 26.1 | 83 |
| T3 | 13:00:13.64 | +27:52:32.4 | 32.3 | 127 |
| TC3 | 13:00:14.53 | +27:52:39.0 | 38.7 | 106 |
| T4 | 13:00:15.45 | +27:52:45.3 | 45.2 | 177 |
The data were reduced in the standard manner using CLASS from the GILDAS333http://www.iram.fr/IRAMFR/GILDAS software package developed at IRAM. Bad scans were flagged and emission line-free channels in the total width of about 1000 km s-1 were used to subtract (mostly) first-order baselines. The corrected antenna temperatures, , provided by the IRAM 30m calibration pipeline, were converted to main-beam brightness temperature by , using a main beam efficiency of about at 115 GHz and at 230 GHz, and the forward efficiencies of 0.94 and 0.92, respectively. The rms noise levels typically of mK per 10.6 km s-1 channels were obtained. Gaussian fits were used to measure peak , width, and position of the detected CO lines. The flux density-to-antenna temperature conversion factor is , where is the telescope aperture efficiency and is the diameter of the telescope in meters. The IRAM 30m aperture efficiency is at CO(1-0) frequency and at CO(2-1) frequency. The conversion is thus Jy beam-1 K-1 for both bands.
3. Results
3.1. Main body of D100
The CO(1-0) and CO(2-1) spectra measured in the main body D100 pointing are shown in Fig. 2 (top-right panel). Both lines are clearly detected, the CO(2-1) line is about two-times stronger than CO(1-0). We calculate the CO luminosity from the standard relation of Solomon & Vanden Bout (2005)
| (1) |
where is the CO line luminosity in , is the CO velocity integrated line flux in , is the observed CO line frequency in GHz, and is the distance in Mpc. The CO(1-0) luminosity is . Following
| (2) |
where we assume a CO/H2 conversion factor of cm-2(K km s that is standard under Milky Way disk conditions (e.g., Bolatto et al., 2013). However, the actual value of the conversion factor is uncertain, especially in the tail of D100. This is discussed later in Section 5.3. The luminosity corresponds to a molecular gas mass of (including a factor of 1.36 to account for Helium).
The CO lines are in Fig. 2 fitted with Gaussians. Their parameters are given in Table 3. The CO(1-0) central velocity is km s-1, assuming the radio definition of the velocity (). This is consistent with the optical radial velocity km s-1 measured from H, [NII], and [SII] emission in the galaxy center (Yagi et al., 2007). The CO(1-0) line width is km s-1, contrary to km s-1 for the CO(2-1) line. The difference may reflect detecting emission from larger galactocentric radii with increasing rotation velocity within the larger CO(1-0) beam. From the Tully-Fisher relation (e.g., Gnedin et al., 2007), a disk galaxy with D100’s stellar mass has a typical circular velocity of km s-1. Given the inclination of the galaxy of (see Section 6.3), this corresponds to the linewidth of km s-1, thus consistent with the measured CO(1-0) linewidth. The larger CO(1-0) beam is also likely contaminated by the emission from the inner tail (see lower).
The CO (2-1)/(1-0) integrated luminosity ratio measured in the D100 pointing is (and the ratio of the peak temperatures is ), not corrected for the different beam sizes. Assuming a typical CO (2-1)/(1-0) ratio of , the measured value is consistent with emission coming from an extended source that is larger than the CO(2-1) beam.
3.2. Molecular gas in the tail of D100
| Source | Line | rms | velocity | rel. vel. | FWHM | aafootnotemark: | |||
|---|---|---|---|---|---|---|---|---|---|
| (mK) | (km s-1) | (km s-1) | (km s-1) | (mK) | (K km s-1) | ( K km s-1pc2) | () | ||
| D100 | CO(1-0) | 1.7 | 0 | 7.4 | |||||
| CO(2-1) | 1.7 | 0 | 16. | ||||||
| T1 | CO(1-0) | 1.0 | 33 | 4.5 | |||||
| CO(2-1) | 1.1 | 30 | 2.7 | ||||||
| CO(2-1) #1 | -55 | 1.9 | |||||||
| CO(2-1) #2 | 39 | 3.3 | |||||||
| T2 | CO(1-0) | 1.3 | 81 | 3.1 | |||||
| CO(1-0) #1 | 40 | 3.4 | |||||||
| CO(1-0) #2 | 131 | 3.0 | |||||||
| CO(2-1) | 1.3 | 107 | 2.9 | ||||||
| CO(2-1) #1 | 47 | 3.1 | |||||||
| CO(2-1) #2 | 132 | 3.7 | |||||||
| T3 | CO(1-0) | 1.3 | 83 | 6.4 | |||||
| CO(2-1) | 1.3 | 86 | 10.7 | ||||||
| T4 | CO(1-0) | 1.0 | 132 | 1.4 | |||||
| CO(2-1) | 1.0 | 135 | 3.7 | ||||||
| TC2 | CO(1-0) | 1.5 | - | - | - | - | - | - | - |
| CO(2-1) | 1.3 | - | - | - | - | - | - | - | |
| TC3 | CO(1-0) | 1.2 | 103 | 2.8 | |||||
| CO(2-1) | 1.5 | - | - | - | - | - | - | - |
Our new CO observations of the D100 tail reveal for the first time the presence of abundant molecular gas coexisting with the previously observed H and X-ray components. Figure 2 depicts CO(1-0) and CO(2-1) spectra measured in the T1T4 pointings. The complementary spectra from the two less sensitive regions TC2 and TC3 are shown in Fig. 5. The parameters of the Gaussian fits to the detected lines are summarized in Table 3. Further in this section, we divide the tail into three parts (inner, intermediate, and outer). As the morphology of the tail does not change substantially along its length, we base the division only on the projected distance from the galaxy.
As noted above, the CO/H2 conversion relation is uncertain in the tail of D100. It may introduce some systematic errors into the values of H2 masses derived in the following subsections from the observed CO(1-0) luminosities. While it is hard to quantify the uncertainty in the conversion factor, it may be a factor of a few, but likely less than an order of magnitude. For more details see the discussion in Sec. 5.3.
3.2.1 Inner tail
In the innermost tail pointing T1, CO(1-0) emission is strong and comparable to that coming from the D100 disk itself. Following Eqs. 1 and 2, the corresponding H2 mass is . CO(2-1) emission is substantially weaker than in the disk – the ratio of integrated intensities is low, . This is very likely due to contribution from the disk covered by the outer parts of the larger CO(1-0) beam. The values of the CO (2-1)/(1-0) line-ratios are for the observed regions depicted in Fig. 3.
As compared to the main body pointing, the spectral lines are in T1 shifted by km s-1 to higher velocities. The CO(2-1) line profile moreover suggests the emission is coming from two substructures at different radial velocities, with a separation km s-1. We fit the substructures with a double Gaussian (see Table 3). The lower-velocity peak is at km/s below the D100 central velocity and the higher-velocity peak at km/s above it (however, the latter component is much stronger than the former one). This could be an imprint of the galactic rotation.
3.2.2 Intermediate tail
At the projected distance of kpc from the galaxy, in the second closest region T2, both CO(1-0) and CO(2-1) emission are again bright. The CO intensity corresponds to H2 mass of . The linewidths of km s-1 are larger than in the main body and in the T1 region, but the line profiles clearly suggest there are (at least) two distinct peaks with km s-1. Presumably, the two peaks could correspond to the substructures (bifurcation) weakly visible in the H image. The FWHMs of the T1 and T2 sub-peaks are km s-1, which corresponds to the velocity dispersion range of km s-1. Much better spatial and spectral resolution are needed to further resolve smaller entities, such as individual molecular clouds whose velocity dispersions are smaller, typically km s-1.
Assuming a NFW profile for the Coma mass distribution (Navarro et al., 1996; Kubo et al., 2007), and the DM halo mass of D100 of (following the relation of Behroozi et al., 2010), we estimate the tidal truncation radius at the projected galactocentric distance kpc of D100 in Coma to be kpc. Thus, the material occurring in the pointing T2 (and farther out) is beyond the tidal truncation radius and will likely contribute to the intra-cluster medium. However, this does not take into account the gas velocities relative to the escape speed from the galaxy’s potential. Thus, even gas inside the tidal truncation will likely join the ICM since it will exceed the escape speed due to ram pressure acceleration.
The strongest emission (in terms of the S/N ratio) comes from the kpc distant region T3. The corresponding molecular gas mass is . The lines are substantially narrower than in the inner tail - the linewidth drops to km s-1, with no substructures suggested. This could be due to leaving behind the circular velocity component and/or due to a compact size of the CO-emitting region, possibly associated with the bright compact H (probably H II) region clearly visible in the center of the T3 beam.
The CO (2-1)/(1-0) integrated intensity line ratios (not corrected for the beam sizes) are in the T2 and T3 regions again rather low, and , respectively (see Fig. 3). This is probably due to more CO emission coming from the outer parts of the larger CO(1-0) beam, outside the CO(2-1) beam. However, taking the distribution of H emission as a proxy for the CO distribution, most of the emission may be in the T3 region enclosed by the smaller CO(2-1) beam. This would then suggest a low (corrected) line ratio. In the perpendicular direction, we assume the distribution of the CO emission is confined to the width of the H (and X-ray) tail.
3.2.3 Outer tail
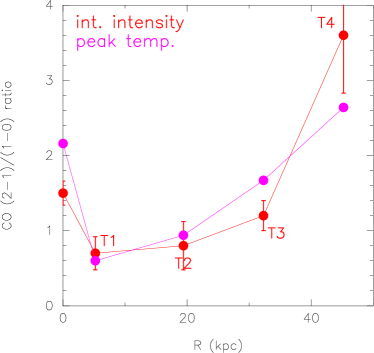
In the most distant observed pointing T4, at kpc from the galaxy, CO(2-1) emission is reliably detected, while there is only a hint of CO(1-0) at the same velocity. The line intensity corresponds to H2 mass of . The CO(2-1) line is again narrow ( km s-1) and shifted towards higher velocities, by about 150 km s-1 relative to the main body. Contrary to the previous pointings, the integrated intensity line ratio in T4 is , thus consistent with a point-source emission diluted by the four-times larger CO(1-0) beam (and a typical R21 line ratio of ). Alternatively, it could suggest that molecular gas is in T4 more extended, and heated to higher temperatures, indicating optically thin gas (see e.g., Crosthwaite & Turner, 2007). Fig. 3 clearly illustrates that along the tail the integrated intensity line ratio (not corrected for the different beam sizes) increases.
In Fig. 4, the peak CO main beam temperatures are shown as s function of the downstream distance in the tail, together with the CO integrated intensities.
3.2.4 Complementary, less-sensitive pointings
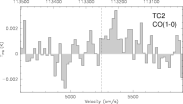
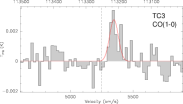
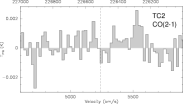
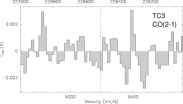
In addition to the H bright regions T1-T4 that revealed strong CO emission, less sensitive observations in regions TC2 and TC3 covering the parts of the tail with less (or less clumpy) H emission were performed. These regions would need more observing time to either confirm detection or decrease rms. It is still interesting to inspect their spectra in Fig. 5. They suggest that CO(1-0) emission is there stronger than CO(2-1), contrary to the neighboring regions T3 and T4. In TC2, at a projected distance of kpc from the galaxy (see the scheme in Fig. 2), there is a hint of CO(1-0) emission, with a S/N ratio of , while CO(2-1) emission is absent. In TC3, at kpc, CO(1-0) emission is (marginally) detected with a S/N of , but CO(2-1) is not detected. The corresponding H2 mass in TC3 is .
The presumably low CO (2-1)/(1-0) line ratios in the TC2 and TC3 regions may correspond to emission coming mainly from the outer parts of the larger CO(1-0) beams. There indeed seems to be less H emission, especially in the location of TC3, which could also point to less molecular emission, assuming there is a correlation between H and CO emission. Moreover, in both TC2 and TC3, the H emission is probably smoother, with no obvious compact regions, as compared to the neighboring parts of the tail (see Fig. 2). The low line ratios in TC2 and TC3 could thus also suggest that conditions in the stripped gas are locally different: the gas may be more extended and have a lower temperature (since CO(1-0) usually traces more extended component and has a lower excitation temperature than CO(2-1)).
4. Kinematic separation of dense gas component in the tail
Our CO observations have revealed a radial velocity gradient of km s-1 along kpc length of the D100’s tail. This is well visible in Fig. 6 that depicts the central velocities of the Gaussian fits of the detected CO(1-0) and CO(2-1) lines as a function of their (projected) distance from the galaxy. For comparison, the plot also shows radial velocities measured from optical H slit spectra in 22 regions along the D100 tail (Yagi et al., 2007, with a couple of previously incorrect values revised). While the ionized gas velocity field is not smooth but shows small scale variations, a clear trend is visible: the total H velocity difference between the galaxy center and outer tail is km s-1. It can be described by the sum of a sharp rise in the first 4 kpc, and a more gradual rise between kpc and kpc of km s-1. We note that the angular resolution of the two measurement sets is different – the CO(2-1) beamsize is kpc, while the optical slits are typically kpc long.
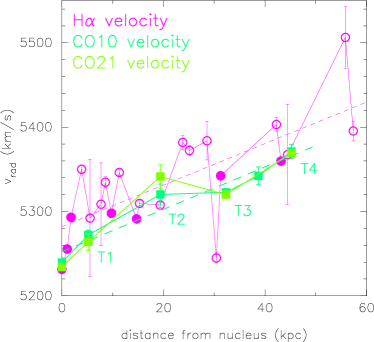
Figure 6 reveals that radial velocities of the CO emission lines are systematically lower than the mean optical velocities by km s-1, while having a similar slope. The CO velocities are mostly consistent with the lower edge of the velocity span of the H regions. We identified slit regions with large H surface brightnesses (possible H II regions) and marked them in the plot with filled circles. All of them are below (or in one case at) the fit.
This suggests that denser, more compact gas clumps, including CO and compact H sources, are less accelerated by ram pressure due to their large momentum, and lag behind more diffuse H-emitting gas. Such gas lumps decouple from the surrounding diffuse gas and may fall back to the galaxy potential. The same phenomenon, although observed spatially rather than kinematically, has been observed in high resolution optical images of other cluster spirals, which show dense decoupled clouds spatially offset from more diffuse dust which is further downstream (Crowl et al., 2005; Abramson & Kenney, 2014; Abramson et al., 2016; Kenney et al., 2015). The velocity field of the stripped ISM may have a large range at any distance. This was clearly shown in numerical simulations by Tonnesen & Bryan (2010). Velocity gradients have been previously reported in ram pressure stripped gas tails of IC 4040, IC 3418, NGC 4388 (Yoshida et al., 2012; Kenney et al., 2014; Oosterloo & van Gorkom, 2005). This is the first time that effects of differential acceleration of individual phases of the ISM by ram pressure are indicated from observation.
The radial velocity gradients of km s-1 in CO and nearly km s-1 in H emission form only about one tenth of the (projected) ICM wind speed. Simulations by Tonnesen & Bryan (2012) show that even after a few hundred Myr of stripping, most of the gas does not reach the ICM wind velocity but has velocities one-third to one half of the way to it. The large momentum of dense molecular gas prevents ram pressure to accelerate it quickly. Similarly, in the RPS Virgo cluster galaxy IC 3418, H II regions in the tail extend kinematically only to of the ICM wind velocity (Kenney et al., 2014).
Interestingly enough, the increase in velocity per unit tail length is constant along the tail (see the linear fits to both the H and CO measurements in Fig. 6). In numerical simulations, Roediger & Brüggen (2008b) measured the velocity of the stripped gas along the tail to increase linearly with increasing distance from the galaxy (despite higher velocity width of the tail). They found that the slope changes for different ram pressures, i.e., it is larger for stronger pressures and shallower for weaker pressures (see their Figs. 12 to 14). Also Yoshida et al. (2012) measured almost monotonically increasing velocity of H regions in the tail of IC4040 with the distance from the galaxy. They measured the overall acceleration rate of km s-1 kpc-1 in a range of kpc. For comparison, in the tail of D100, the average acceleration is (in projection) about 2.5 km s-1 kpc-1.
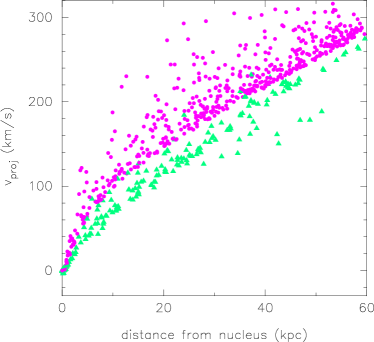
In order to illustrate the effects of differential ram pressure acceleration, we use in Fig. 7 simple semi-analytic calculations: a set of test particles that represent ISM parcels with a range of column densities are initially distributed in a thin (2D) disk in a model galaxy potential that experiences an increasing ram pressure with a Lorentzian-shaped time profile. Both the model potential and the ram pressure pulse are set to approximately correspond to the case of D100 in Coma. Equation of motion of the particles under the combined effects of the galaxy’s potential and (face-on) ram pressure is calculated. Fig. 7 shows the distribution of velocities and distances (relative to the galaxy) that the stripped ISM parcels reach after 1 Gyr, at the time when the ram pressure reaches its peak. The results are qualitatively consistent with the observations in Fig. 6 – a velocity range forms in the distribution of the stripped gas parcels as denser clumps are less accelerated. In the calculations we moreover mimic simply in-situ condensation of denser clumps by multiplying suddenly column density of randomly selected parcels. This can reproduce the offset in velocity (triangles vs. dots in Fig. 6) – the ’condensed’ parcels decouple from the main cloud of stripped parcels (they shift down in the plot). With the present calculations we only aim to illustrate the effects of differential ram pressure acceleration of the stripped gas components with different column densities in the tail, not to accurately model the tail of D100.
5. H2-dominated multi-phase gas tail
D100 is after ESO 137-001 (Jáchym et al., 2014) only the second known example of a ram pressure stripped galaxy whose tail shows up simultaneously in X-ray, H, and CO emission444See the Discussion section for information about the multiphase tail of the Virgo cluster galaxy NGC 4388.. It is therefore of great interest to study how different phases co-exist and evolve in this special environment.
The hot ionized gas is expected to fill up the volume of the tail (). Its total mass is estimated to , which corresponds to the observed (bolometric) luminosity of erg s-1 of the soft X-ray emitting gas at temperature of keV (assuming a single-component model with metallicity ; Sanders et al., 2014). The electron density of the material is cm-3 assuming the emission comes from a cylinder of 2 kpc radius and 36 kpc in length.
The warm ionized, H emitting gas is on the other hand expected to have a very low volume filling factor (; see Jáchym et al., 2013, for details). Its total mass is , assuming the emission fills a 60 kpc1 kpc cylinder (Yagi et al., 2007).
No H I was detected in D100 with a upper limit of for the beam (Bravo-Alfaro et al., 2000, 2001) which nearly corresponds to the area of the tail. Re-reduction of the original VLA data decreased the limit to (Hector Bravo-Alfaro, priv. communication). New sensitive VLA observations are forthcoming (PI: M. Sun).
Surprisingly thus, the tail of D100 may be dominated by cold molecular component, despite the hot ICM surroundings. The total H2 mass that we detected is , thus by a factor of about higher than the mass of ionized hot and warm phases together. Given the uncertainty of the -factor (see the discussion in Section 5.3), it is possible that the molecular gas fraction is somewhat smaller, however, very likely still exceeding the fraction of the other gas components. For comparison, in the tail of the Norma galaxy ESO 137-001, the amounts of cold molecular and hot ionized gas are similar (; Jáchym et al., 2014; Sun et al., 2006).
In numerical simulations of ram pressure stripped gas tails (Tonnesen et al., 2011), the ratio of warm ( K K) + hot ( K K) to cold ( K K) gas components varies in the range for different simulation runs (after Myr of stripping). In the tail of D100, an analogous ratio of warm+hot ionized to cold (molecular+H I) components is thus likely much lower, (for the standard -factor value). Though, more suited simulations would be needed to directly compare with the D100 observations, as the CO emitting gas has temperatures lower than is the range covered in Tonnesen et al. (2011), and the X-ray emitting gas in the D100 tail has temperature of K (Sanders et al., 2014).
5.1. Mass gradients along the tail
The large-scale distribution of the stripped gas along the tail is determined by the mass-loss per orbital length, which is given by a combination of ram pressure that determines how much gas the galaxy loses in a given time, and the orbital velocity that determines over which volume the lost gas is spread (Roediger & Brüggen, 2008b). In numerical simulations, the mass per orbital length decreases behind the galaxy, but at later times saturates (becomes constant) typically at about 70 kpc from the galaxy (e.g., Roediger & Brüggen, 2008b). Local physical processes, mixing with the surrounding ICM, as well as separation of phases drive the evolution of the stripped gas and shape the composition of the gas in the tail.
| Source | beam | ||||
|---|---|---|---|---|---|
| D100 | CO10 | ||||
| CO21 | |||||
| T1 | CO10 | 14.86 | 2.3 | ||
| CO21 | 4.05 | 0.9 | |||
| T2 | CO10 | 5.09 | 2.1 | ||
| CO21 | 3.66 | 1.3 | |||
| TC2 | CO10 | 4.52 | 2.7 | ||
| CO21 | 3.17 | 1.3 | |||
| T3 | CO10 | 4.14 | 2.6 | ||
| CO21 | 3.22 | 0.8 | |||
| TC3 | CO10 | 3.47 | |||
| CO21 | 2.07 | ||||
| T4 | CO10 | 3.51 | 0.6 | ||
| CO21 | 3.13 | 0.6 |
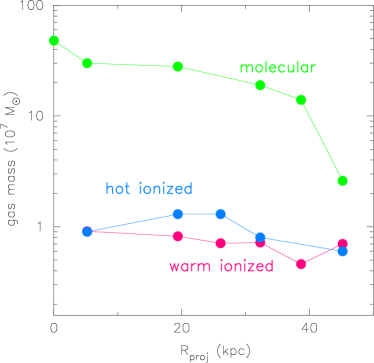
Table 4 gives X-ray and H fluxes and corresponding masses encompassed by our IRAM 30m apertures. In Fig. 8, hot ionized, warm ionized and molecular gas masses within CO(2-1) apertures T1 to T4 are plotted as a function of radial (projected) distance from the galaxy. The plot clearly suggests that the balance of the different gas phases does not change strongly (within a factor of 2) along most of the tail, except its outer parts, where the molecular gas mass drops by a factor of .
To characterize the evolution of the stripped gas we can measure mass ratios of individual gas phases. The ratio of molecular to warm + hot ionized components decreases from about 17 (in T1) and 13 (in T2, T3) to (in T4), assuming a constant -factor along the tail. The ratio of hot-to-warm ionized (X-ray-to-H) masses is quite similar in all tail regions and close to . For comparison, in the tail of ESO 137-001, the hot-to-warm gas ratio is also nearly constant, , and the ratio of cold-to-(warm+hot) masses also decreases along the tail but in a much less extreme – from in the innermost region to at 40 kpc distance downstream (Jáchym et al., 2014). The difference could correspond to different evolutionary states of stripping of D100 as compared to ESO 137-001.
A possible origin of the observed elevated molecular-to-ionized gas ratio could be heating from shocks induced by ram pressure interaction. This can create an abundant warm, CO-emitting molecular component in the tail. The contribution from shocks is also suggested from optical observations that revealed high values of the [N II]/H ratio of (Yagi et al., 2007). Also in the tail of ESO 137-001 were measured elevated values of [N II]/H and [O I]/H (VLT/MUSE observations; Fossati et al., 2016), as well as in other Coma ram pressure stripped galaxies, IC 4040 and RB 199 (Yoshida et al., 2012).
5.2. Correlation of molecular and warm ionized gas phases
Studying the correlation of individual gas phases in ram pressure stripped tails can reveal details about the evolution of the stripped ISM and its mixing with the surrounding ICM. A detailed comparison of the distributions of different gas phases will be the subject of a future study. With the limited level of spatial resolution of our current CO observations we focus on the relationship between molecular and warm ionized gas in the tail of D100 and in tails of other known ram pressure stripped galaxies.
In Figure 9 the integrated CO fluxes measured in the tails of D100 (present work), ESO 137-001 (Jáchym et al., 2014) and ESO 137-002 (Jáchym et al. in prep.) are plotted as a function of the H surface brightness in the respective tail areas encompassed by IRAM 30m or APEX apertures. The tails of the two Norma galaxies are by a factor of brighter than that of D100, both in H and in CO emission. The three data points from ESO 137-001 correspond to APEX integrations at kpc, 16 kpc, and 40 kpc projected distances downstream in the tail, while those from ESO 137-002 are from regions in the outer disk and the inner tail (upper limit). There is a difference in spatial resolution as the HPBW of the IRAM 30m beam at Coma distance is kpc, while the HPBW of the APEX beam at Norma distance is kpc.
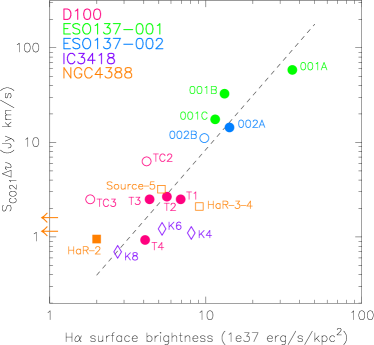
The plot in Fig. 9 reveals a rather tight correlation between cold molecular and warm ionized phase over about 2 dex, both in CO fluxes and H surface brightnesses. Molecular gas is the primary fuel of star formation. However, the amount of star formation in CO-abundant tails is different: there is over 30 H II regions in the tail of ESO 137-001 (Sun et al., 2007), possibly only a few H II regions in the tail of D100 (this work), but none were revealed in the tail of ESO 137-002 (Zhang et al., 2013). The observed correlation thus indicates that different excitation processes are active in the stripped gas. It is possible that stronger ram pressure (either in a richer cluster or in a galaxy that gets closer to the cluster center, or in a smaller galaxy) strips more dense gas that can form more molecular gas, as well as it produces brighter H emission, not only by star-formation (denser, more compact component) but also due to stronger shock ionization (more diffuse component). Consequently, stronger ram pressure stripping produces data points at the top-right end of the correlation.
In Fig. 9 we further include points corresponding to the CO upper limits measured in three H bright regions in the outer tail of the ram pressure stripped Virgo galaxy IC3418 (Jáchym et al., 2013; Fumagalli et al., 2011), and one CO detection and two upper limits in the tail of another ram pressure stripped Virgo galaxy NGC 4388 (Verdugo et al., 2015). While these data points are basically well consistent with the revealed correlation, the spatial scale is very different – at the Virgo distance the IRAM 30m CO(2-1) beam HPBW is kpc (or kpc at CO(1-0)), thus sampling more local conditions in the tails. Also, IC3418 is a dwarf galaxy with sub-solar metallicity which might be the primary reason for weak CO emission, that moreover is in a late stripping state when most of molecular gas in the tail would have been consumed by star formation (Jáchym et al., 2013; Kenney et al., 2014). In NGC 4388 on the other hand, CO emission was detected in several more regions not associated with strong H emission ( erg s-1; arrows at the left edge of the plot in Fig. 9).
5.3. Uncertainty of X-factor
The value of the CO-to-H2 conversion factor is in the D100 tail uncertain. Local conditions in the ISM including metallicity, radiation field, temperature, density, pressure or dust properties determine the value of the conversion between measured CO integrated intensities and H2 column densities.
The environment of the gas-stripped tail is likely distinct from typical galactic disks in a number of parameters. For example, the volume density of the stripped gas may be lower due to ram pressure preferentially stripping lower density gas from the galaxy that moreover distributes in an extended three-dimensional tail. Also, the relative lack of young stars and thus of strong UV emission suggests different chemistry in the tail, possibly driven by shocks and turbulence induced by the ram pressure interaction (e.g., Godard et al., 2009, and references therein).
In the inner tail of ESO 137-001 elevated ratios of warm-to-cold molecular gas of were observed (Sivanandam et al., 2010; Jáchym et al., 2014), indicating that some part of CO emission is coming from a warmer, more diffuse molecular component. Also in several Virgo spirals, higher ratios of warm H2/PAH were found (Wong et al., 2014). Recent works that analyzed the CO-to-H2 relation in the diffuse component of the ISM in the Milky Way (Liszt et al., 2010; Liszt & Pety, 2012; Roman-Duval et al., 2016) and in nearby galaxies (Sandstrom et al., 2013) surprisingly found that the value of -factor is in the diffuse gas similar to that in dense gas. The reason may be that on small spatial scales (arcmins in the Galaxy) there are likely large differences in the value of the -factor in the diffuse gas between bright CO (low ) and faint CO (high ) regions, that however on large scales average out (see also Bolatto et al., 2013, for comprehensive review).
While some warm, subthermally excited diffuse component producing enhanced CO emission could exist in the D100 tail, there likely are also dense, compact regions that re-formed in situ, copying the distribution of compact H regions (see Figure 2). For example, in the farthest region T4, the measured CO (2-1)/(1-0) line ratio is consistent with a point source distribution.
We can also estimate the (stellar) metallicity of D100 from the stellar mass-metallicity relation of Tremonti et al. (2004). For , the predicted median metallicity of D100 is rather high, , i.e., about solar (we assume a solar value of 8.69; Asplund et al., 2009). While there is no data available on the gas metallicity, the above estimate suggests the factor is not much affected by metallicity in D100. We expect the metallicity of the stripped gas is consistent with the value in the main body (Fossati et al., 2016). Since D100 is likely in a late stripping phase (see Sec. 6), gas originating from outer disk regions with potentially lower metallicity due to a radial metallicity gradient currently does not contribute to the tail.
In summary, while there probably is an uncertainty in the CO/H2 relation of a factor of a few, there is no strong evidence that the factor is in the D100 tail systematically lower that the standard value. The detected bright CO emission then suggests that molecular gas mass dominates the tail by a factor of .
6. Discussion
Our detection of the abundant molecular gas in the tail of D100 has revealed a substantial component of the stripped gas that until now was hidden. However, the detection has also raised new questions about the evolution of the stripped gas, about the origin of molecular gas in the special environment of ram pressure stripped gas tails, as well as about how common are the phenomena of molecular gas-rich ram pressure stripped tails.
6.1. Ram pressure stripping origin of the tail
The 60 kpc multi-wavelength gas tail of D100 has all marks of a ram pressure stripping origin as it is gaseous, one-sided, straight and well centered on the disk of the galaxy. Moreover the galaxy is occurring close to the Coma cluster center, where it is likely currently experiencing a peak ram pressure.
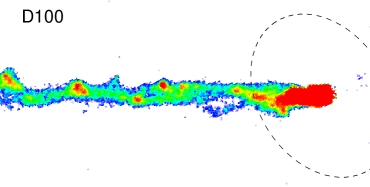
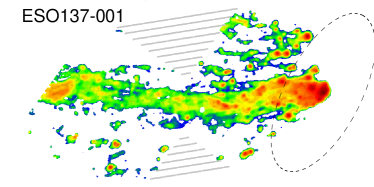
What makes it clearly stand out of other known cases is its remarkable narrowness along its length. In ESO 137-001 for comparison, a wider tail of H regions orphaned from X-ray emission, together with the secondary X-ray tail, accompany the main tail. This is clearly visible in Fig. 10 where we show the inner parts of the H tails of the two galaxies. The images are scaled so that the optical diameters of the galaxies match each other. The comparison reveals that the tail of D100 has simpler morphology, with much less substructure perpendicular to its length, and it is also straighter. On the other hand, the two tails bear some similarities – they are brightest in the innermost parts and there are local enhancements along the tail with H peaks separated by relatively diffuse emission regions.
Ram pressure stripping proceeds in a galaxy from the outside in, which was confirmed by many observations of truncated HI, H and/or dust disks (Koopmann & Kenney, 2004). Consequently the gas stripped at later stages is expected to form a narrower tail. Numerical simulations have confirmed that small cross-sections lead to less flaring in the tail (see e.g., Roediger et al., 2006, their Fig. 8).
The narrow profile of the D100’s tail thus suggests that the galaxy is in an advanced stripping stage when its stripping radius is small, and all ISM from outer disk radii was lost to the intra-cluster space far behind the galaxy. Dense (molecular) gas is not expected to be directly stripped from the galaxy (see Section 6.3.3). A galaxy can also have a smaller cross-section if it is moving (near) edge-on through the ICM. As we will show later in Section 6.3, this may be the case for D100, however, this effect would probably be more important in an earlier stripping phase. Radiative cooling processes were also identified to make for much narrower tails with significantly less flaring by reducing the pressure in the tail (Tonnesen & Bryan, 2010). We also note that the extreme linearity of the tail may point to high viscosity of the surrounding ICM that can suppress hydrodynamic instabilities that otherwise cause vortices and turbulence (Roediger & Brüggen, 2008a). Magnetic fields if aligned with the tail can further inhibit instabilities and transport processes with the surroundings making the tail smoother than it would be in the absence of magnetic fields. However, magnetic fields may lead to suppression of viscosity, thus the combined effects of the ICM viscosity and magnetic fields in the Coma center are likely important for the structure of the D100 tail.
6.1.1 Continuous stripping of nuclear gas?
The fact that the narrow tail of D100 is not (much) widening suggests that the galaxy is heavily stripped and that the stripping radius has not changed much over the lifetime of the observed tail. At the same time the CO luminosity of the tail is about twice that of the galaxy, so a lot of gas has been removed from the galaxy without changing the gas stripping radius much. This may be compatible with stripping of dense gas from the (circum)nuclear region of the galaxy. D100 contains a bar (see the HST image in Figure 1, right panel) that could have driven gas from the outer disk into the inner kiloparsec via gravitational torques. This behavior has been observed in barred galaxies as indicated from their larger central molecular gas concentrations compared to unbarred galaxies (Sakamoto et al., 1999).
The stripping radius of D100 is only pc which is about the same as the diameter of the bar. When stripping reaches the nuclear region (), the stripping radius does not change quickly, both due to large gas concentrations, and the gravitational potential that becomes significantly steeper there. In many galaxies, especially those with central starbursts, the gas surface density increases sharply in the nuclear region, with a scale length much smaller than that of the outer disk (Jogee et al., 2005). D100 shows an ongoing nuclear starburst (Yagi et al., 2007; Caldwell et al., 1999).
Assuming that the stripped gas () now forming the narrow tail originated from an annular region pc (which corresponds to an area pc2), we can get a rough estimate on the surface density of the original gas in the disk of pc-2. The gas surface density profiles in the circumnuclear regions are typically pc-2 or less at kpc, and pc-2 inside pc (Jogee et al., 2005). It is probable that an analogous galaxy to D100 with the same stellar mass but no CN gas concentration would be completely stripped at the current D100’s location in the cluster, possessing only an old detached gas-stripped tail.
6.1.2 In-situ origin of molecular gas
Formation and survival of large quantities of (cold) molecular gas in the tail is rather surprising given the presence of the surrounding hot ICM. It suggests that processes able to heat and disperse the stripped cool gas, such as heat conduction, ionizing soft X-ray radiation, cosmic rays or turbulence, are not efficient enough to prevent the gas from cooling and condensing. For example, assuming the saturated flux equations, Tonnesen et al. (2011) estimated the efficiency of heat conduction to be low in the tails, of the order of , otherwise cold clouds would quickly evaporate on a timescale of Myr. The viscosity of the ICM is also important for the evolution of the stripped gas. With increasing viscosity the stripped galactic gas mixes less readily with the ambient ICM. Viscously stripped galaxies thus are expected to have unmixed, cool wakes that are also X-ray bright (Roediger et al., 2015).
A key precondition for H2 formation is the presence of dust in the tail, it means its stripping and survival. The HST image of D100 (see Fig. 1, right panel) clearly shows strong dust extinction filaments extending from the disk central regions in the direction of the tail. This indicates that dust has been stripped to the tail, however its survival to large distances from the galaxy is yet to be explored. The D100 tail was also covered by Herschel observations, but only upper limits on FIR emission in the tail can be obtained (will be done elsewhere; Sivanadam et al., in prep.). HST images of the Virgo galaxies NGC 4522 and NGC 4402 that are being stripped clearly show dust being removed from the disk along with the gas (Abramson et al., 2016).
Given the large amounts of detected molecular gas along the tail, including large distances from the galaxy, together with the small measured velocity gradients (measured in Section 4), in-situ molecularization of the stripped material appears to be a probable scenario of the origin of the detected gas. As we will estimate in Sec. 6.3.3, ram pressure operating on D100 could have directly stripped gas components as dense as pc-2 down to about 1 kpc disk radius. However, due to strong internal density gradients in real GMCs reaching values of hundreds of pc-2, gradual ablation of dense clouds due to ram pressure is expected rather than pushing them as a whole. Molecular component of the ISM is also expected to be dissociated during stripping by shock introduced by ram pressure interaction. Moreover, the lifetime of dense molecular clouds is typically Myr which likely is by at least a factor of 10 shorter than the presumed tail age.
Numerical hydrodynamical simulations suggested that overdensities may form from the less dense stripped gas that has cooled and condensed in the tail (e.g., Tonnesen & Bryan, 2010, 2012). The timescale for condensation and H2 formation is determined by the gas density following an inverse relation (Guillard et al., 2009). The densest gas lumps in the tail were likely formed from the densest gas lumps that were stripped. Rather dense clumps stripped from the circumnuclear gas concentration of D100, that further were compressed by the surrounding ICM, started to cool down efficiently (the cooling time in the tail is expected to be rather short). Lack of ambient UV photo-dissociating radiation field in the tail further can favor H2 formation on dust grains.
6.2. Star formation in extreme environments
It is of great interest to study star formation in ram pressure stripped gas tails since these are distinct environments from typical star-forming regions in disks of spiral galaxies.
6.2.1 Weak star formation in the tail
The detailed Subaru Telescope H image of the tail of D100 shows a great deal of substructure in the ionized gas distribution (despite its narrowness) with several compact regions visible at different distances from the galaxy (Yagi et al., 2010, see the image in Fig. 2). The three most compact H sources have also the lowest optical [N II]/H ratios in the D100 tail (in the range ; Yagi et al., 2007, their Table 2). However, these values are too large for typical H II regions (generally ; e.g., Fossati et al., 2016, their Fig. 7). Thus, they do not look like typical H II regions formed around star-forming clouds.
We can obtain a rough estimate on the star formation rate (SFR) in the tail if we assumed the most compact sources were HII regions. From H fluxes in the three most compact regions identified from the H Subaru image in Yagi et al. (2007)555The sources , , and , located at (13:00:10.53, +27:52:10.88) at the edge of the CO(1-0) T1 region, (13:00:13.64, +27:52:33.44) in the T3 region, and (13:00:15.4, +27:52:45.6) - in the T4 region, respectively.. The corresponding fluxes are erg s-1 cm-2. Using the SFR– formula of Kennicutt & Evans (2012)
| (3) |
the corresponding summed SFR is yr-1 assuming a typical 1 mag extinction correction for H. For comparison, in the observed regions in the tail of ESO 137-001, the summed SFR is by a factor of 10 stronger, yr-1 (Jáchym et al., 2014).
A weak UV emission is also seen in the inner kpc of the tail with GALEX (Smith et al., 2010). The presence of both H and UV emission could suggest star formation has been ongoing in the tail within Myr (which is the time-scales of the H emission as a tracer of star formation). However, much UV emission seems to come from background galaxies that are around the tail and the small residual is hard to be isolated for GALEX’s large PSF. The current GALEX data thus cannot be used to constrain the SFR robustly. Smith et al. (2010) have also shown a MegaCam archival -band deep image with higher resolution than in the GALEX image. The -band continuum shows the tail clearly up to kpc. While the -band vs. H overlay does show a lot of correspondence between these two tracers, most of the -band emission may not be from stars.
We thus conclude that some star formation may be present in D100’s tail, though it is weak. Given the wealth of discovered molecular gas, the efficiency of star formation must be very low (characterized by molecular gas depletion times , that are larger than the Hubble time). Previous observations of ESO 137-001 and NGC 4388 indeed suggested that most of molecular gas in the stripped gas tails does not form stars and ultimately joins the ICM (Jáchym et al., 2014; Verdugo et al., 2015).
6.2.2 Starburst in the disk
Our proposed scenario of ram pressure stripping of nuclear gas concentration is consistent with the starburst observed in the center of D100: the nucleus of the galaxy (within ) exhibits starburst characteristics, such as strong emission and strong underlying Balmer absorption. Larger radii in the disk () show a poststarburst feature (only Balmer absorption) with a quenching time between Myr, depending on the burst strength (Caldwell et al., 1999; Yagi et al., 2007).
We can check what is the depletion timescale of the presumed nuclear region in D100. In the main body pointing we detected of molecular gas. The estimated star formation rate in the nucleus is yr-1 (derived from WISE band 4), thus Gyr, which is short and indeed consistent with a burst.
6.3. Galaxy’s orbit in Coma
To better understand the timescale of stripping of D100 we analyze the available parameters of its orbit. The galaxy is projected close ( kpc) to the cluster center and its tail points nearly perpendicularly to the direction to the cluster center. This suggests that D100 is likely near the pericenter of its orbit in Coma666The location and orientation of D100 in Coma is similar to that of the completely stripped dwarf IC3418 in Virgo (Jáchym et al., 2013; Kenney et al., 2014).. However, the details of the geometry of the ram pressure interaction are not immediately clear.
6.3.1 Constraining the wind angle
We can get an interesting constraint on the ram pressure interaction geometry and the 3D velocity of the interaction from the HST image of the galaxy (Fig. 1, right panel). Apparent in the image are elongated filaments of dust extinction which can be seen against the Eastern disk side. The filaments are elongated in the tail direction, and are likely part of the base of the tail. We also know that the stripped gas tail must extend in the direction away from us, since the radial velocity of D100 is km s-1 relative to the Coma mean ( km s-1; Yagi et al., 2007). Since the kinematics indicate the tail must extend away from us, and the extinction features indicate that the base of the tail is in front of the Eastern side of the stellar disk, the Eastern side of the disk must be the far side. The geometry is shown in Fig. 11 in the plane-of-the-sky–line-of-sight view.
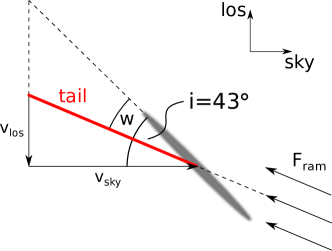
To constrain the wind direction relative to the disk plane (wind angle), we first derive the disk inclination angle by inspecting isophotes from the HST image. While slight lopsidedness of the disk is apparent, consistent values of the major-to-minor axes ratio are obtained at several different radii. The corresponding average value of the disk inclination is . Since the tail is extending away from us, and at the same time it is in front of the E disk side, the tail angle relative to the disk plane must be in the range . This is illustrated in Fig. 11. If we assume that the tail follows the past orbital path, the wind angle is equal to the tail angle. Then the above analysis prescribes that the plane-of-sky (tangential) orbital velocity component is equal to or larger than the radial velocity component of D100. This means that the total orbital velocity of D100 is km s-1.
The system orientation implies that the larger the total orbital velocity (and thus the tangential component), the larger the wind angle, but it is always smaller than . However, for reasonable values of the velocity the interaction is close to edge-on: for the total orbital velocity of 3000 km s-1 (or 4000 km s-1), the wind angle would be only (or ).
Numerical simulations have suggested that (close-to) edge-on ram pressure stripping is less efficient than face-on or only slightly inclined stripping (e.g., Jáchym et al., 2009; Roediger et al., 2006). D100 however has likely been experiencing very strong (near pericenter) ram pressure in which case stripping saturates and the stripping efficiency difference between edge-on and face-on stripping disappears (cf., Jáchym et al., 2009).
6.3.2 Estimated age of the D100 tail
Knowing the disk inclination angle and constraining the tail angle relative to the disk allows us to deproject the tail length ( kpc in H), as well as the velocity gradient along the tail ( km s-1 in H). For the 3D orbital velocity of 3000 km s-1 (or 4000 km s-1), the deprojected tail length would be kpc (or kpc), and the deprojected velocity gradient along the tail km s-1 (or km s-1).
We can do a zeroth order estimate on the age of the tail: to cross the length of 71 kpc (or 65 kpc) at the velocity of 283 km s-1 (or 400 km s-1), the duration of Myr (or Myr) would be needed. These are probably lower limits as we have neglected the fact that gas parcels are from the galaxy ram pressure accelerated only gradually. On the other hand, ram pressure changes steeply with time as the galaxy orbits through the cluster.
From the simple estimate of the tail age we can also calculate a zeroth order estimate on the average mass loss rate due to stripping. The total gas mass of detected in the tail would be stripped from the galaxy over 245 Myr (or 159 Myr) at a high rate of yr-1.
It is interesting to realize that within the time the tail of the observed length has formed, the galaxy has traveled a much larger distance through the cluster, possibly exceeding Mpc (neglecting the fact that the orbital velocity peaks at the pericenter). Thus the environment in which the tail had started to form is likely completely disconnected from the galaxy’s current location.
6.3.3 Current ram pressure estimate
Modeling the ICM distribution in the Coma cluster with a -profile with parameters given by Mohr et al. (1999) and Fossati et al. (2012), we can get an upper limit estimate on the ICM density at the projected location of D100777For fully ionized gas with primordial abundances (mass of Helium is 0.25 of the total mass of the gas), electron and the proton number densities relates to the mass density of the ICM as and (e.g., Pavlovski et al., 2008). of g cm-3. Assuming the orbital velocity of 3000 km s-1 (or 4000 km s-1), the current ram pressure is dyne cm-2 (or dyne cm-2). The value is lower by a factor of several if the (deprojected) orbit has larger l-o-s distance from the mid-point of the cluster.
For comparison, the current ram pressure acting on D100 may be about 2-times (or 3.5-times) higher than the estimated current ram pressure on ESO 137-001 in the Norma cluster (Jáchym et al., 2014). Moreover, the effects of ram pressure likely have been much stronger on D100 due to its -times lower stellar mass. Solving semi-analytically the equation of motion of gas parcels in a D100-like model galaxy (see Jáchym et al., 2013, 2014, assuming a dark matter halo and a radial orbit), it is probable that the gas parcels with column densities up to pc-2 could be completely (directly) stripped from the galaxy, down to kpc radius.
6.4. Galaxy transformation watched live
Several studies of S0 galaxies have suggested that their bulges contain younger stellar populations that are also richer in metallicity than the surrounding discs (e.g., Johnston et al., 2014; Cortesi et al., 2013). This indicates that the last episode of star formation occurs in the central regions of galaxies that are being transformed by cluster environments. The starburst observed in the circumnuclear region of D100, that otherwise is gas-truncated, is thus consistent with the image of galaxy occurring at the late stage of its transformation towards passive S0 type (Johnson et al., 2016). We are lucky enough to witness the ongoing transformation, moreover accompanied by the spectacular multi-phase gas tail.
7. Conclusions
With the IRAM 30m telescope we have discovered large amounts of molecular gas in the ram pressure stripped gas tail of the Coma cluster galaxy D100 that up to now was known to be bright in H and X-rays. After ESO 137-001 (Jáchym et al., 2014), this is only the second known example of a molecular gas-rich RPS tail. While it is currently not clear how common such tails are, it is possible that RPS galaxies may be an important source of cold gas (and sometimes stars) to intra-cluster space. The main results of our analyses are:
-
1.
Bright CO emission was detected in several regions along the tail of D100 out to nearly 50 kpc distance from the galaxy, with the corresponding total H2 mass . While the value of the -factor in the tail is uncertain and may be locally lower by a factor of a few than the standard Galactic value, our observations indicate that molecular gas is the dominant mass component of the D100 tail. In-situ formation of molecular gas in the stripped gas is a preferable scenario of its origin.
-
2.
The extremely narrow morphology of the tail that does not change with length indicates that D100 is currently at a late evolutionary stage when strong ram pressure has been continuously stripping the nuclear dense gas. Along the tail, at a spatial scale of kpc, the distribution of the stripped gas, including the molecular, warm and hot ionized components, is nearly flat, indicating that the balance between different gas components does not change much. The elevated ratio of molecular-to-ionized gas mass measured in the D100 tail may be due to excitation and heating from shocks induced by ram pressure interaction.
-
3.
The kinematics of the stripped gas in the D100 tail reveals an offset of km s-1 between denser, more compact gas, including CO and compact H sources, and more diffuse H-emitting gas. Such a dynamic separation may be due to differential acceleration of the ISM gas phases by ram pressure. The stripped gas is along the tail accelerated to only a fraction () of the presumed ram pressure wind speed that is likely above 3000 km s-1. The age of the (visible) tail is Myr. Over that period the galaxy has traveled kpc through the cluster and thus formation of the tail has started in completely disconnected environment.
-
4.
Some star formation is likely present in the D100 tail but it is weak. Given the detected large amounts of molecular gas, the efficiency of star formation is very low. This may be due to presumably mostly diffuse morphology of the molecular gas. While there are several compact regions visible in the H image of the tail, their optical line ratios may be too large for typical HII regions.
-
5.
The new CO data for D100 in comparison with a limited sample of other galaxies with known CO components in ram pressure stripped gas tails indicate a rather tight correlation between the CO integrated intensity and the H surface brightness that holds over dex.
Forthcoming interferometric CO observations of D100 tail will reveal the distribution of molecular gas in the tail as well as more details about the kinematics of the cold component and allow for a better comparison with the kinematics of other gas phases. The present results emphasize the importance of multi-wavelength observations for better understanding of the fate and evolution of ram pressure stripped gas.
Acknowledgments
This work has been supported by the project LG 14013 of the Ministry of
Education, Youth and Sports of the Czech republic, the grant project
15-06012S of the Czech Science Foundation, and the institutional
research project RVO:67985815.
M.S. thanks the support provided by the National Aeronautics and Space
Administration through Chandra Award Number GO6-17111X issued by the
Chandra X-ray Observatory Center, which is operated by the Smithsonian
Astrophysical Observatory for and on behalf of the National Aeronautics
Space Administration under contract NAS8-03060.
We thank Hector Bravo-Alfaro for
re-reducing existing VLA data. Based in part on data collected at
Subaru Telescope, which is operated by the National Astronomical
Observatory of Japan. This research has made use of the NASA/IPAC
Extragalactic Database (NED) which is operated by the Jet Propulsion
Laboratory, California Institute of Technology, under contract with the
National Aeronautics and Space Administration. We further acknowledge
the usage of the HyperLeda database
(http://leda.univ-lyon1.fr).
Facilities: IRAM 30m
References
- Abramson et al. (2016) Abramson, A., Kenney, J., Crowl, H., & Tal, T. 2016, AJ, 152, 32
- Abramson & Kenney (2014) Abramson, A., & Kenney, J. D. P. 2014, AJ, 147, 63
- Abramson et al. (2011) Abramson, A., Kenney, J. D. P., Crowl, H. H., et al. 2011, AJ, 141, 164
- Asplund et al. (2009) Asplund, M., Grevesse, N., Sauval, A. J., & Scott, P. 2009, ARA&A, 47, 481
- Behroozi et al. (2010) Behroozi, P. S., Conroy, C., & Wechsler, R. H. 2010, ApJ, 717, 379
- Bolatto et al. (2013) Bolatto, A. D., Wolfire, M., & Leroy, A. K. 2013, ARA&A, 51, 207
- Boselli et al. (2016) Boselli, A., Cuillandre, J. C., Fossati, M., et al. 2016, A&A, 587, A68
- Bravo-Alfaro et al. (2000) Bravo-Alfaro, H., Cayatte, V., van Gorkom, J. H., & Balkowski, C. 2000, AJ, 119, 580
- Bravo-Alfaro et al. (2001) —. 2001, A&A, 379, 347
- Caldwell et al. (1999) Caldwell, N., Rose, J. A., & Dendy, K. 1999, AJ, 117, 140
- Cayatte et al. (1990) Cayatte, V., van Gorkom, J. H., Balkowski, C., & Kotanyi, C. 1990, AJ, 100, 604
- Chung et al. (2009) Chung, A., van Gorkom, J. H., Kenney, J. D. P., Crowl, H., & Vollmer, B. 2009, AJ, 138, 1741
- Chung et al. (2007) Chung, A., van Gorkom, J. H., Kenney, J. D. P., & Vollmer, B. 2007, ApJ, 659, L115
- Cortese et al. (2006) Cortese, L., Gavazzi, G., Boselli, A., et al. 2006, A&A, 453, 847
- Cortese et al. (2007) Cortese, L., Marcillac, D., Richard, J., et al. 2007, MNRAS, 376, 157
- Cortesi et al. (2013) Cortesi, A., Merrifield, M. R., Coccato, L., et al. 2013, MNRAS, 432, 1010
- Cowie & Songaila (1977) Cowie, L. L., & Songaila, A. 1977, Nature, 266, 501
- Crosthwaite & Turner (2007) Crosthwaite, L. P., & Turner, J. L. 2007, AJ, 134, 1827
- Crowl et al. (2005) Crowl, H. H., Kenney, J. D. P., van Gorkom, J. H., & Vollmer, B. 2005, AJ, 130, 65
- Dasyra et al. (2012) Dasyra, K. M., Combes, F., Salomé, P., & Braine, J. 2012, A&A, 540, A112
- Ebeling et al. (2014) Ebeling, H., Stephenson, L. N., & Edge, A. C. 2014, ApJ, 781, L40
- Finoguenov et al. (2004) Finoguenov, A., Briel, U. G., Henry, J. P., et al. 2004, A&A, 419, 47
- Fossati et al. (2016) Fossati, M., Fumagalli, M., Boselli, A., et al. 2016, MNRAS, 455, 2028
- Fossati et al. (2012) Fossati, M., Gavazzi, G., Boselli, A., & Fumagalli, M. 2012, A&A, 544, A128
- Fumagalli et al. (2014) Fumagalli, M., Fossati, M., Hau, G. K. T., et al. 2014, MNRAS, 445, 4335
- Fumagalli et al. (2011) Fumagalli, M., Gavazzi, G., Scaramella, R., & Franzetti, P. 2011, A&A, 528, A46
- Gavazzi et al. (2001) Gavazzi, G., Boselli, A., Mayer, L., et al. 2001, ApJ, 563, L23
- Giovanelli & Haynes (1983) Giovanelli, R., & Haynes, M. P. 1983, AJ, 88, 881
- Gnedin et al. (2007) Gnedin, O. Y., Weinberg, D. H., Pizagno, J., Prada, F., & Rix, H.-W. 2007, ApJ, 671, 1115
- Godard et al. (2009) Godard, B., Falgarone, E., & Pineau Des Forêts, G. 2009, A&A, 495, 847
- Guillard et al. (2009) Guillard, P., Boulanger, F., Pineau Des Forêts, G., & Appleton, P. N. 2009, A&A, 502, 515
- Gunn & Gott (1972) Gunn, J. E., & Gott, III, J. R. 1972, ApJ, 176, 1
- Hester et al. (2010) Hester, J. A., Seibert, M., Neill, J. D., et al. 2010, ApJ, 716, L14
- Jáchym et al. (2014) Jáchym, P., Combes, F., Cortese, L., Sun, M., & Kenney, J. D. P. 2014, ApJ, 792, 11
- Jáchym et al. (2013) Jáchym, P., Kenney, J. D. P., Růžička, A., et al. 2013, A&A, 556, A99
- Jáchym et al. (2009) Jáchym, P., Köppen, J., Palouš, J., & Combes, F. 2009, A&A, 500, 693
- Jáchym et al. (2007) Jáchym, P., Palouš, J., Köppen, J., & Combes, F. 2007, A&A, 472, 5
- Jogee et al. (2005) Jogee, S., Scoville, N., & Kenney, J. D. P. 2005, ApJ, 630, 837
- Johnson et al. (2016) Johnson, H. L., Harrison, C. M., Swinbank, A. M., et al. 2016, MNRAS, 460, 1059
- Johnston et al. (2014) Johnston, E. J., Aragón-Salamanca, A., & Merrifield, M. R. 2014, MNRAS, 441, 333
- Kapferer et al. (2009) Kapferer, W., Sluka, C., Schindler, S., Ferrari, C., & Ziegler, B. 2009, A&A, 499, 87
- Kenney et al. (2015) Kenney, J. D. P., Abramson, A., & Bravo-Alfaro, H. 2015, AJ, 150, 59
- Kenney et al. (2014) Kenney, J. D. P., Geha, M., Jáchym, P., et al. 2014, ApJ, 780, 119
- Kenney & Koopmann (1999) Kenney, J. D. P., & Koopmann, R. A. 1999, AJ, 117, 181
- Kenney et al. (2004) Kenney, J. D. P., van Gorkom, J. H., & Vollmer, B. 2004, AJ, 127, 3361
- Kennicutt & Evans (2012) Kennicutt, R. C., & Evans, N. J. 2012, ARA&A, 50, 531
- Koopmann & Kenney (2004) Koopmann, R. A., & Kenney, J. D. P. 2004, ApJ, 613, 866
- Kubo et al. (2007) Kubo, J. M., Stebbins, A., Annis, J., et al. 2007, ApJ, 671, 1466
- Larson et al. (1980) Larson, R. B., Tinsley, B. M., & Caldwell, C. N. 1980, ApJ, 237, 692
- Liszt & Pety (2012) Liszt, H. S., & Pety, J. 2012, A&A, 541, A58
- Liszt et al. (2010) Liszt, H. S., Pety, J., & Lucas, R. 2010, A&A, 518, A45
- Machacek et al. (2005) Machacek, M., Dosaj, A., Forman, W., et al. 2005, ApJ, 621, 663
- Mohr et al. (1999) Mohr, J. J., Mathiesen, B., & Evrard, A. E. 1999, ApJ, 517, 627
- Navarro et al. (1996) Navarro, J. F., Frenk, C. S., & White, S. D. M. 1996, ApJ, 462, 563
- Nulsen (1982) Nulsen, P. E. J. 1982, MNRAS, 198, 1007
- Oosterloo & van Gorkom (2005) Oosterloo, T., & van Gorkom, J. 2005, A&A, 437, L19
- Pavlovski et al. (2008) Pavlovski, G., Kaiser, C. R., Pope, E. C. D., & Fangohr, H. 2008, MNRAS, 384, 1377
- Roediger & Brüggen (2008a) Roediger, E., & Brüggen, M. 2008a, MNRAS, 388, L89
- Roediger & Brüggen (2008b) —. 2008b, MNRAS, 388, 465
- Roediger et al. (2006) Roediger, E., Brüggen, M., & Hoeft, M. 2006, MNRAS, 371, 609
- Roediger & Hensler (2005) Roediger, E., & Hensler, G. 2005, A&A, 433, 875
- Roediger et al. (2015) Roediger, E., Kraft, R. P., Nulsen, P. E. J., et al. 2015, ApJ, 806, 104
- Roman-Duval et al. (2016) Roman-Duval, J., Heyer, M., Brunt, C. M., et al. 2016, ApJ, 818, 144
- Sakamoto et al. (1999) Sakamoto, K., Scoville, N. Z., Yun, M. S., et al. 1999, ApJ, 514, 68
- Salomé et al. (2011) Salomé, P., Combes, F., Revaz, Y., et al. 2011, A&A, 531, A85
- Sanders et al. (2013) Sanders, J. S., Fabian, A. C., Churazov, E., et al. 2013, Science, 341, 1365
- Sanders et al. (2014) Sanders, J. S., Fabian, A. C., Sun, M., et al. 2014, MNRAS, 439, 1182
- Sandstrom et al. (2013) Sandstrom, K. M., Leroy, A. K., Walter, F., et al. 2013, ApJ, 777, 5
- Scott et al. (2012) Scott, T. C., Cortese, L., Brinks, E., et al. 2012, MNRAS, 419, L19
- Scott et al. (2010) Scott, T. C., Bravo-Alfaro, H., Brinks, E., et al. 2010, MNRAS, 403, 1175
- Sivanandam et al. (2010) Sivanandam, S., Rieke, M. J., & Rieke, G. H. 2010, ApJ, 717, 147
- Smith et al. (2010) Smith, R. J., Lucey, J. R., Hammer, D., et al. 2010, MNRAS, 408, 1417
- Solomon & Vanden Bout (2005) Solomon, P. M., & Vanden Bout, P. A. 2005, ARA&A, 43, 677
- Sun et al. (2010) Sun, M., Donahue, M., Roediger, E., et al. 2010, ApJ, 708, 946
- Sun et al. (2007) Sun, M., Donahue, M., & Voit, G. M. 2007, ApJ, 671, 190
- Sun et al. (2006) Sun, M., Jones, C., Forman, W., et al. 2006, ApJ, 637, L81
- Sun & Vikhlinin (2005) Sun, M., & Vikhlinin, A. 2005, ApJ, 621, 718
- Tonnesen & Bryan (2010) Tonnesen, S., & Bryan, G. L. 2010, ApJ, 709, 1203
- Tonnesen & Bryan (2012) —. 2012, MNRAS, 2609
- Tonnesen et al. (2011) Tonnesen, S., Bryan, G. L., & Chen, R. 2011, ApJ, 731, 98
- Tremonti et al. (2004) Tremonti, C. A., Heckman, T. M., Kauffmann, G., et al. 2004, ApJ, 613, 898
- Verdugo et al. (2015) Verdugo, C., Combes, F., Dasyra, K., Salomé, P., & Braine, J. 2015, A&A, 582, A6
- Vollmer et al. (2008) Vollmer, B., Braine, J., Pappalardo, C., & Hily-Blant, P. 2008, A&A, 491, 455
- Vollmer et al. (2001) Vollmer, B., Cayatte, V., Balkowski, C., & Duschl, W. J. 2001, ApJ, 561, 708
- Vollmer & Huchtmeier (2007) Vollmer, B., & Huchtmeier, W. 2007, A&A, 462, 93
- Wang et al. (2004) Wang, Q. D., Owen, F., & Ledlow, M. 2004, ApJ, 611, 821
- Wong et al. (2014) Wong, O. I., Kenney, J. D. P., Murphy, E. J., & Helou, G. 2014, ApJ, 783, 109
- Yagi et al. (2013) Yagi, M., Gu, L., Fujita, Y., et al. 2013, ApJ, 778, 91
- Yagi et al. (2007) Yagi, M., Komiyama, Y., Yoshida, M., et al. 2007, ApJ, 660, 1209
- Yagi et al. (2010) Yagi, M., Yoshida, M., Komiyama, Y., et al. 2010, AJ, 140, 1814
- Yoshida et al. (2012) Yoshida, M., Yagi, M., Komiyama, Y., et al. 2012, ApJ, 749, 43
- Yoshida et al. (2004) Yoshida, M., Ohyama, Y., Iye, M., et al. 2004, AJ, 127, 90
- Yoshida et al. (2008) Yoshida, M., Yagi, M., Komiyama, Y., et al. 2008, ApJ, 688, 918
- Zhang et al. (2013) Zhang, B., Sun, M., Ji, L., et al. 2013, ApJ, 777, 122