Sparse Mean Localization
by Information Theory
I would like to express my gratitude to Stefan Bauer and Nico Gorbach who gave me all the support I needed, to Prof. Dr. Joachim Buhmann for the opportunity to work in such as a fascinating topic, and to Dr. Markus Kalisch for all the support, in this semester project and throughout the Masters’ programme.
Abstract
Sparse feature selection is necessary when we fit statistical models, we have access to a large group of features, don’t know which are relevant, but assume that most are not. Alternatively, when the number of features is larger than the available data the model becomes overparametrized and the sparse feature selection task involves selecting the most informative variables for the model. When the model is a simple location model and the number of relevant features does not grow with the total number of features, sparse feature selection corresponds to sparse mean estimation. We deal with a simplified mean estimation problem consisting of an additive model with gaussian noise and mean that is in a restricted, finite hypothesis space (parameter space). This restriction simplifies the mean estimation problem into a selection problem of combinatorial nature. Although the hypothesis space is finite, its size is exponential in the dimension of the mean. In limited data settings and when the size of the hypothesis space depends on the amount of data or on the dimension of the data, choosing an approximation set of hypotheses is a desirable approach. Choosing a set of hypotheses instead of a single one implies replacing the bias-variance trade off with a resolution-stability trade off. Generalization capacity provides a resolution selection criterion based on allowing the learning algorithm to communicate the largest amount of information in the data to the learner without error. In this work the theory of approximation set coding and generalization capacity is explored in order to understand this approach. We then apply the generalization capacity criterion to the simplified sparse mean estimation problem and detail an importance sampling algorithm which at once solves the difficulty posed by large hypothesis spaces and the slow convergence of uniform sampling algorithms (caused by the skewed distribution of hypothesis costs). Finally we explore how the generalization capacity criterion can be a applied to a more realistic version of the sparse feature selection problem where the number of relevant features grows with the total number of features.
Contents
toc
List of Figures
lof
Chapter 1 Introduction
It is often the case that when fitting statistical models, the majority of available features are not informative in the sense of the underlying learning task. In other cases the limited amount of data available implies that most features can’t be used, even if they are all informative, because the model becomes overparametrized. In both instances sparse feature selection must be done prior or simultaneous to model fitting. In this work we deal with the sparse feature selection problem as it applies to a simplified location model. We first assume the number of relevant features is small and fixed and then explore the case where the number of relevant features is small but grows with the total number of features. Although this problem is well known and studied, for example in vanDeGeer, we are interested in how we can apply approximation set coding and generalization capacity to localize the hypothesis class to an optimal resolution.
1.1 Structure
The report is organized as follows. Section 1.2 gives a description of the problem we will focus on: sparse mean estimation and sparse feature selection. We want to solve this problem using the approximation set coding and generalization capacity methodology proposed by Buhm13, so in Sections 1.3-1.6 we give an introduction to the theory involved. Section 1.3 introduces the pattern analysis framework for learning problems. In section 1.4 we explore how, by defining approximation sets of hypotheses instead of proposing a single hypothesis as the solution, we are able to move from the normal bias-variance trade-off of learning problems to a resolution-stability trade-off. In section 1.5, with the help of concepts from Sections 1.3 and 1.4, we define various information theoretic concepts such as Boltzmann weights, Gibbs distributions and partition functions, culminating in the definition of generalization capacity. We try to give an intuitive understanding of each of these concepts except that of generalization capacity itself. In Section 1.6 we motivate the concept of generalization capacity in analogy to Shannon’s noisy channel coding theorem from which it is derived.
In Chapter 2 we estimate the generalization capacity of the squared loss based, empirical risk function for the non-sparse version of the mean localization problem. We concentrate on low-dimensional cases. In Section 2.1 the information theoretic concepts defined in Section 1.5 are applied to the problem at hand culminating in an expression for the generalization capacity that suggests an exhaustive simulating algorithm for its estimation. Section 2.2 includes the pseudo code for implementing this algorithm. Section 2.3 includes the results of implementing the exhaustive simulating algorithm to estimating generalization capacity. Section 2.4 is a note on how to avoid underflow problems when implementing this algorithm. In Section 2.5 we explore different ways in which we may incoprorate the use of common random numbers into our algorithm as a variance reduction technique.
In Chapter 3 we estimate the generalization capacity for the sparse mean localization problem. Section 3.1 describes the changes and additional tools necessary to implement the algorithm described in 2.2 to the sparse version of the problem. Section 3.2 includes the results of implementing this algorithm to estimating generalization capacity. Since the algorithm will be shown to be inadequate in the high dimensional case, in Section 3.3 we describe a sampling algorithm based on a re-expression of the generalization capacity. Section 3.4 includes the results of this sampling algorithm. This algorithm will be shown to converge too slowly in the number of simulations and so in section 3.5 we describe an importance sampling algorithm for estimating generalization capacity. Section 3.6 includes the results of this algorithm.
Chapter 4 is a brief exploration into a more realistic version of sparse feature selection where the number of relevant features grows with the total number of features. We describe the problem and explore some of the difficulties of estimating generalization capacity with a simulation algorithm in this case.
Chapter 5 includes a summary of the report and a list of possible related avenues of future research.
1.2 Problem statement
We deal with the statistical model studied in Buhm14:
where
-
•
-
•
-
•
-
•
observations with are i.i.d.
In the general case estimating corresponds to selecting a hypothesis from the hypothesis space which has cardinality . While we first deal with this problem, we will be more interested in a modified version of this problem where:
-
i.)
-
ii.)
-
iii.)
-
iv.)
It is assumed that is known.
We first deal with the general case where , , and then with a sparse case where is kept constant and grows toward infinity. In Chapter 4 we briefly discuss another sparsity condition where .
1.3 Pattern analysis
Although the classical framework of parameter inference, in which estimators are maps from a sample space to a parameter space , is appropriate for the problem at hand we introduce Aproximation Set Coding (ASC) and Generalization Capacity (GC) within the framework of Pattern Analysis since they are more relevant in this wider context. The rest of this introductory chapter follows Buhm13 closely.
The problem described in Section 1.2 belongs to the class of problems which are the object of Pattern Analysis. The goal of pattern analysis is to map a set of object configurations to a pattern space. Concretely, we want to choose a hypothesis where:
-
•
are objects in an object space.
-
•
are object sets.
-
•
is a hypothesis in a hypothesis class and is a pattern space.
A few remarks about this framework:
-
i.)
The hypothesis class may or may not depend on the object set. Specifically, the size of the hypothesis class may depend on the object set or not.
-
ii.)
In this exposition the objects in the object set may be tuples of objects from more fundamental object sets, i.e. . However, the objects are at the level of the mapping .
-
iii.)
The hypothesis map is actually a composition of the maps and where is a measurement space.
-
iv.)
The pattern space may be related to the data generating process or not. It is an interpretation space: a set of abstract, mutually exclusive properties which we wish to assign to object configurations.
We present some examples to clarify the pattern analysis framework.
Example 1.3.0.1 (Mean estimation).
We want to estimate the population mean height of swiss women given a sample of 100. We make no assumptions regarding the data generating process.
-
•
swiss women
-
•
is the set of sampled women.
-
•
are the heights of the sampled women.
-
•
is the set of possible heights for the 100 women.
-
•
is the set of possible population mean heights.
-
•
is the hypothesis class which does not depend on the size of the object set.
Example 1.3.0.2 (Clustering - Population).
We want to cluster 100 people into 4 groups according to height and weight. We assume the underlying data generating process is a gaussian mixture with parameters with and .
-
•
people.
-
•
is the set of sampled people.
-
•
are the heights and weights of the sampled people.
-
•
is the set of possible heights and weights for the 100 people.
-
•
is the set of possible population mean and covariances.
-
•
is the hypothesis class which does not depend on the size of the object set.
Remark: Notice how our assumptions about the data generating process inform our choice of pattern space .
Example 1.3.0.3 (Clustering - Sample).
We want to cluster 100 people into 4 groups according to height and weight. We do not assume anything about the underlying data generating process and are just interested in finding a clustering that defines homogenous groups for this sample and not the entire population.
-
•
people.
-
•
is the set of sampled people.
-
•
are the heights and weights of the sampled people.
-
•
is the set of possible heights and weights for the 100 people.
-
•
are all the possible ways we can group 100 people into 4 groups.
-
•
is the hypothesis class which in this case does depend on the size of the object set.
Example 1.3.0.4 (Dyadic data).
We are interested in predicting if a user will make a purchase at a given website, based on the age and gender of the person and on the type of website (there are types). We don’t assume anything about the data generating process but have already decided to model the probability of purchase using a logistic regression model.
-
•
peoplewebsites.
-
•
is the set of sampled person-website pairs.
-
•
are the age, geneder, website-type and purchase outcome of the sampled person-website pairs.
-
•
is the sample space.
-
•
is the parameter space for the logistic model.
-
•
is the hypothesis class which does not depend on the size of the object set.
As we can see the pattern analysis framework fits a wide range of problems. Although problems such as mean estimation and regression, in which hypothesis classes with infinite cardinality are involved, can be tackled using the pattern analysis framework, in the rest of this introductory chapter we focus on classes with a finite number of hypotheses. In other words we assume:
| (1.3.0.1) |
1.4 Approximation sets
In classical statistical learning theory, in order to solve an inference decision problem, we choose a loss function with which we construct the risk function . We then choose a single hypothesis that minimizes the empirical risk for a given data set :
| (1.4.0.1) | ||||
| (1.4.0.2) |
If is large then the Emprirical Risk Minimizer (ERM) will be close to the minimizer of the risk function . However, in general we know that when is not large then the ERM will tend to overfit the data. Instead of choosing a single hypothesis we can choose a subset of the hypothesis class which includes good hypotheses: hypothesis with low costs. Qualitatively, we would like this set to be composed of low cost hypotheses which we cannnot (partially) order further because their costs are statistically indistinguishable. The goal is to choose a subset of hypotheses that are stable with respect to fluctuations in the cost measurements. We may code this selection with a weight function over the hypothesis class where:
| (1.4.0.3) |
| (1.4.0.4) |
| (1.4.0.5) |
Where can be interpreted as the degree of certainty we have that is the best solution. We may generalize the concept of approximation sets by allowing fuzzy, non-binary selection where hypotheses belong to the solution set to varying degrees, i.e. . In this case valid weight vectors satisfy:
| (1.4.0.6) |
The sum of the weights over the hypothesis class indicates the equivalent number of hypotheses selected. The bigger this sum the more unsure we are about . We will sometimes say that is the approximation set of hypotheses, meaning that it encodes the (fuzzy) membership of the hypotheses in the set. A parametric family of weights which satisfies condition 1.4.0.6 is:
| (1.4.0.7) |
Notice that if we normalize the weights such that we can interpret the weights as a posterior probability distribution over the hypothesis class.
In the classical statistical setting, when we have limited data, obtaining unbiased estimators often means these estimators have high variance: estimations change dramatically from one data set to the next. Lowering the variance can sometimes be achieved by introducing bias into our estimator. This is the bias-variance trade-off that, when there is limited data, is usually resolved through some sort of regularization. As we shall see in Section 1.6 the ASC approach leads to a resolution-stability trade-off which replaces the bias-variance trade-off. Resolution refers to the equivalent number of hypotheses selected while stabiity refers to obtaining similar approximation sets for different . Adopting the ASC approach the trade-off becomes, do we obtain a very stable set of good hypotheses that don’t change a lot depending on the data set but that is quite large (low resolution) or do we focus in on a small number of very good hypotheses but such that they will change from one data set to the next (unstable).
Notice that the parameter in our weight function is the resolution parameter that determines how this trade-off is resolved. Adopting the view of our normalized weight vector as a posterior over the hypothesis class, the higher is the more probability is spread or smoothed among all the hypotheses. In limited data settings, choosing the parameter corresponds to regularizing our empirical risk function.
In general, the justification for using the ASC approach is:
-
I
Inference. It allows us to identify hypotheses which are similar in cost but which might be distinct according to other criteria not included in the cost function. This benefit is also common to bayesian inference.
-
II
Learnability. For to be learnable, ERM theory requires that it should not be too complex. In other words, should have a finite VC-dimension. For certain problems, such as 1.3.0.3, the size of increases too quickly in , meaning that as the empirical risk minimizer does not converge to the true risk minimizer. For this type of problem it is not even theoretically possible to converge to the true as so an approximation set solution seems more reasonable.
1.5 Generalization capacity
Definition 1.5.0.1 (Boltzmann weights).
If, from the parametric family 1.4.0.7, we choose to construct our weight vector we obtain the so called Boltzmann weights:
| (1.5.0.1) |
Definition 1.5.0.2 (Partition function).
The sum over of the Boltzmann weights is a function of the data . We call it the partition function with respect to and define it as:
| (1.5.0.2) |
Definition 1.5.0.3 (Gibbs Distribution).
The normalized Boltzmann weights define a Gibbs distribution, over with respect to the cost function :
| (1.5.0.3) |
This choice of weight vector can be justified from an information theoretic perspective. The Gibbs distribution is the maximum entropy distribution among all distributions over such that:
| (1.5.0.4) |
where is a non-increasing function of . As we increase , the resolution parameter, the expected cost with respect to the Gibbs distribution, decreases. In the limit, as , the Gibbs distribution becomes a single point mass distribution over and . The Gibbs distribution preserves the same (partial) ordering of as , but rescales so that differences in cost on the low end of the cost spectrum are exaggerated and differences in cost on the high end of the cost spectrum are smoothed out.
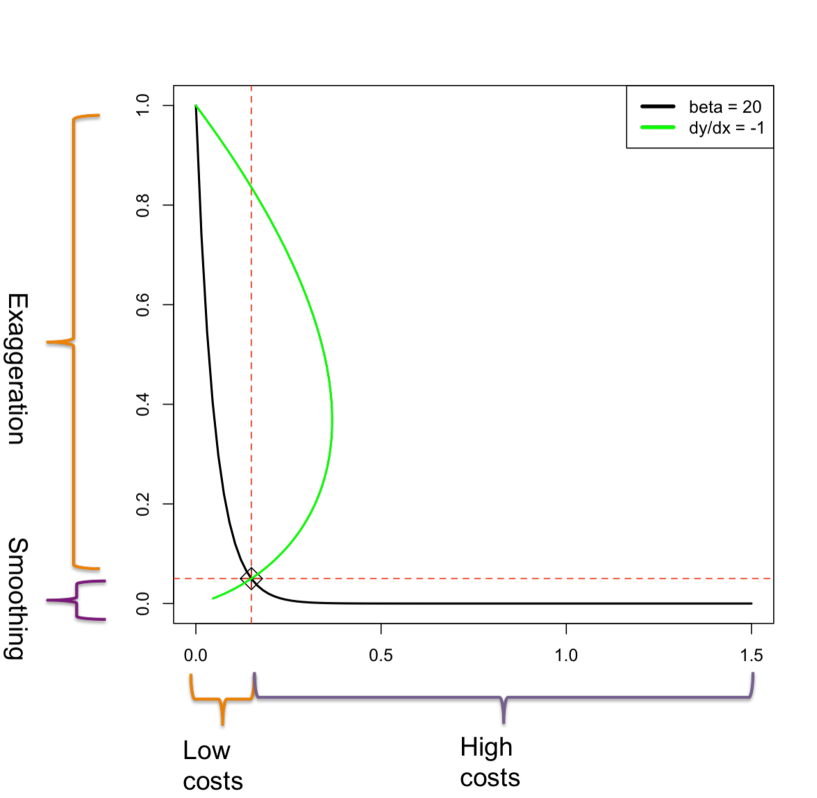
Figure 1.1 illustrates the mechanics of the smoothing of costs with the Boltzmann weight function. Costs scaled by the parameter are plotted on the x-axis () and the corresponding Boltzmann weights on the y-axis (). The black lines show the Boltzmann weights for two different resolution values: . The green line represents the points which are the points that satisfy . Let the point of intersection between a given weight function indexed by and the green line be called the critical point for that . For a given , scaled costs to the right of the critical point (high costs) are smoothed onto the interval while scaled costs to the left of (low costs) are exaggerated onto the interval . This is how the Boltzmann weight function and the parameter control the level of smoothing: for high resolution only the lowest cost hypotheses remain relevant, while for low resolution levels most hypotheses retain some measure of relevance.
The characteristics discussed above, are shared by all functions from the parametric family 1.4.0.7. These characteristics allow the Boltzmann weight function to be used in global optimization strategies such as simulated and deterministic annealing where the smoothing out of less important features in the cost surface in early iterations prevent the search algorithm from getting stuck in local minima. As is established in Jaynes1, Jaynes2 and Jaynes3, particular to the Gibbs distribution (for which ), is the fact that for a given level of resolution, manifested as an expectation, , that is a certain distance from , it has maximum entropy among distributions with this characteristic This means that if we use the Gibbs distribution to describe our uncertainty about the true hypothesis, the only information extracted from is that obtained using . Interpreting the entropy of a distribution as a measure of its uncertainty and supposing we know that , then is the maximally non-comittal distribution with respect to information different to that contained in this restriction. Tikochinsky established another characteristic that makes the Boltzmann weights and Gibbs distribution an appealing choice as the ASC weighting function: it is maximally stable. If we change our desired resolution level from to , the change in the induced Gibbs distributions is minimal, in the norm sense, among any two distributions and that satisfy and .
We have discussed the role of the resolution parameter in the context of the resolution-stability trade-off, so how can we determine the best value of ? For this purpose Buhm13 developed the concept of Generalization Capacity which we will first define and then describe in analogy to the Channel Capacity concept of information theory.
Definition 1.5.0.4 (Joint partition function).
Before we define Generalization Capacity we define the joint partition function between two data sets which measures the equivalent number of hypotheses selected by a weighting function for two different data sets and :
| (1.5.0.5) |
Remarks:
-
i.)
We have dropped the superindex (n) for better readability: , , and .
-
ii.)
As this definition already suggests GC will involve comparing the approximation sets obtained with different data sets of the same size.
-
iii.)
For some pattern analysis problems such as 1.3.0.3 the hypothesis class depends on the object set so that . In this case we need a mapping so that can be properly defined as . Although these types of problems are very important in the context of ASC given the infinite VC dimension of the hypothesis class, for the sparse mean estimation problem described in Section 1.2 this is not the case, so we will simply assume, from now on, that . This also means we can dispense with the mappings in this exposition.
Definition 1.5.0.5 (Information Content).
The information content retrievable from data by a cost function with resolution is:
| (1.5.0.6) |
Remarks:
-
i.
is a normalized and rescaled version of which measures the equivalent number of selected hypotheses with cost function for both data sets and .
-
ii.
Since it holds that , which means that for resolution , where all hypothesis are given a weight of 1, the information content is zero.
-
iii.
Let , and , then:
(1.5.0.7) (1.5.0.8) and we can see that . This means that for maximum resolution the information content can reach up to the log-size of the hypothesis class.
Definition 1.5.0.6 (Generalization Capacity).
The generalization capacity of a cost function defined over a hypothesis class and data space is:
| (1.5.0.9) |
Remarks:
-
i.
Since we have that and,s
-
ii.
since we have that
1.6 GC and Shannon’s noisy-channel coding theorem
To motivate the relevance of the Generalization Capacity as an important quantity in itself aswell as a criterion for deciding between cost functions in a pattern analysis problem, we briefly study Shannon’s Noisy-Channel Coding Theorem, the communication protocol suggested therein and the role of Channel Capacity. We then move from the communication context to the pattern learning context and study an analagous learning protocol suggested by Buhm13 where the generalization capacity emerges as a natural counterpart to channel capacity. The exposition of Shannon’s Noisy-Channel Coding Theorem is based on Cover and Yeung.
Shannon’s Noisy-Channel Coding Theorem deals with the rate at which information can be passed through a channel so we first define what information and channels are.
Definition 1.6.0.1 (Shannon Information).
The Shannon information of an outcome of a random variable , where is a finite set and is the probability distribution of is:
If we interpret the informativeness of an outcome in terms of the worth of knowing its value the following properties make this a useful measure of information:
-
i.)
-
ii.)
Assigns 0 to a certain outcome
-
iii.)
The rarer an outcome the more informative:
-
iv.)
It is continuous in :
-
v.)
Additivity:
Definition 1.6.0.2 (Entropy).
The entropy of a random variable , where is a finite set, is its expected Shannon Information:
| (1.6.0.1) |
We can interpret entropy as the average information rate of a random variable. If we want to send messages from a finite message set , we may define the information rate of the message set by assuming messages will be sent according to the uniform distribution. In this case:
| (1.6.0.2) |
We now define joint and conditional entropy.
Definition 1.6.0.3 (Joint Entropy).
For random variables and , with and finite sets, the joint entropy of and is defined as:
| (1.6.0.3) |
Definition 1.6.0.4 (Conditional Entropy).
For random variables and , with and finite sets, the joint entropy of given is defined as:
| (1.6.0.4) |
Conditional entropy is a measure of the mean information left in once we know the outcome of . It turns out that so the joint entropy can be interpreted as the mean amount of information in plus the mean amount of information left in once the outcome of is known.
Definition 1.6.0.5 (Mutual Information).
For random variables and , with and finite sets, the mutual information between and is defined as:
| (1.6.0.5) |
Using that we can interpret the mutual information as the reduction in information left in once is known (or vice versa). Alternatively, we can interpret as the information that is common to and . If and are independent then they have no information in common and if depends deterministically on then they have the same information.
Definition 1.6.0.6 (Discrete Channel).
Let and be discrete sets and be a transition matrix from to that is a valid distribution for all . Then the tuple is a discrete channel where and are the input and output respectively. Remark: We sometimes refer to the discrete channel simply as .
If Input is sent through the channel then the output is distributed according to .
Definition 1.6.0.7 (Discrete Memoryless Channel (DMC)).
A discrete memoryless channel is a discrete channel such that if a sequence of inputs are sent through the channel then:
| (1.6.0.6) |
Intuitively, the channel forgets all previous communication such that the ouptut of only depends on the input and on the distribution .
Definition 1.6.0.8 (Capacity of a DMC).
The capacity of a DMC is defined as:
| (1.6.0.7) |
Where and are the input and output of the channel.
The capacity of a DMC is a measure of the amount of common information between the input and output in the most optimistic scenario. As we will see later in this section, Shannon’s Noisy-Channel Coding Theorem shows why the capacity of a DMC is an important quantity.
Since a given channel only takes as input we need an encoder function to transform our message into an acceptable input. If then we may simply assign each message an element of the input set , however this doesn’t help us avoid errors in communication. If the channel transforms the message such that the output is not the same as the input then an error will occur.
If we have some slack in our input set which may help us to avoid errors. Suppose that and then we can assign 0 to and 1 to and . If an is sent through and the channel distorts it into an we still avoid error.
If we may add slack to our coding scheme by encoding each message with a sequence of symbols . In this case we have sequences to encode messages. If we let grow then we increase the slack in our code and so reduce the probability of error, especially if we assign sets of sequences to each message in a smart way. To prove the Noisy-Channel Coding theorem Shannon constructed such a smart assignment procedure using ideas of typicality which we explore somewhat further on.
We can already touch on how the pattern analysis problem bares some resemblance to the problem of sending a message through a noisy channel: in the former there is some truth or property in nature which is a hypothesis and it is encoded in a slack way by a data generating mechanism such that for each hypothesis there correspond many possible data sets .
Having broached the idea of slack codes we now define an code and give a schematic description of Shannon’s communication scenario.
Definition 1.6.0.9 ( code).
An code for a DMC is defined by an encoding function and a decoding function :
Where:
-
•
is called the message set,
-
•
are the codewords and
-
•
is the codebook.
The rate of an code is defined as . This corresponds to the rate of a uniform random variable over the message set divided by so that it is in the units of bits (or nats depending on the base of the logarithm) per symbol and not bits per sequence .
A rate for a DMC is said to be asymptotically achievable if there exists an code that for a sufficiently large can transmit at a rate arbitrarily close to with arbitrary precision.
Theorem 1.6.0.10 (Shannon’s Noisy-Channel Coding Theorem ).
A rate is asymptotically achievable for a DMC
This theorem justifies the Capacity of a channel as an interesting quantity: it implies that we can achieve error-free communication at a rate equal to the capacity of the DMC. The proof of this part of the theorem involves proposing the code shown below and then proving that for an such that the rate of the code is close to the capacity of the DMC, the probability of error is small. In this work we are especially interested in the code proposed in Shannon’s proof since it forms the basis of a similar coding scheme and communication protocol in which generalization capacity plays an analogous role to that of channel capacity.
Definition 1.6.0.11 (Shannon’s (n,M) code).
The code proposed is the following:
-
1
Sample sequences uniformly at random from and randomly assign each sequence sampled to one of the messages. This establishes the encoding function . Both sender and receiver have the codebook .
-
2
Compare the joint entropy of , to the empirical entropy of the the pairs of sequences . Choose message such that the empirical entropy of is close to the entropy . If there is more than one pair of sequences that satisfies this condition decode to . This establishes the decoding function .
The proof that this code can asymptotically achieve a rate involves the concept of typicality which is an application of the Law of Large Numbers. Although we do not give the formal proof we give a sequential illustration of the ideas.
-
i.)
Start with a large for a slack code. First we choose large so that we have a lot of slackness in our code, more than we will need, and uniformly at random choose sequences as our codewords.
Figure 1.4: Shannon code: creation of codebook -
ii.)
Channel sends messages to non-overlapping regions. We have chosen so large that even with a lot of noise, when are transformed into by the channel the probability that and are close for any is essentially zero. The i-th region represents the sequences which are jointly typical with . Given that the sequence passed over the channel is , the probability that the sequence received by the decoder is outside this region is essentially zero. If and then .
Figure 1.5: Shannon code: decoding -
iii.)
Decrease until is tight around regions. Since is large the rate of the code is low. Shannon’s Noisy-Channel Coding Theorem says that we can decrease so that the rate increases to close to and the error stays very small. By decreasing we decrease the size of so that all the regions are tightly crowded within. If we are at capacity, the overlap between the regions is still essentially zero, but if we make any smaller by decreasing further, the overlap will start to grow, meaning the probability of error grows.
Figure 1.6: Shannon code: towards capacity
As we have already hinted at, the pattern analysis problem can be seen as a special case of the communication problem. We explore this further by proposing the following Idealized Learning Protocol :
The communication protocol has the following characteristics:
-
1
The sender picks uniformly at random to construct : .
-
2
The sender selects a message uniformly at random: . Remark: we use the tilde to separate , from .
-
3
The sender and receiver have access to the data generating mechanism which they use to set up the following code:
-
a
The encoder function is constructed by randomly sampling times a data set of size from the data generating mechanism to obtain the codebook where . Notice that in many problems such as clustering and regression so that , i.e. we code each message using a data matrix.
-
b
Our decoding function works as in Shannon’s code except that is not necessarily a finite set so we might need to use joint differential entropy instead of joint entropy.
-
a
-
4
We set up a channel with our knowledge of the hypothesis and data generating mechanisms and respectively:
(1.6.0.8) (1.6.0.9) Notice that we are assuming that successive sample sets of size from the data generating mechanism are independent given .
With the exception that we are using what may be a set with infinite cardinality to code the message set the above Idealized Learning Protocol corresponds to the previous communication protocol. The channel characterizes the noisiness of the pattern analysis problem since in a noise-free scenario we would obtain the same data set for each realization of the data generating mechanism, i.e. . Since messages are always selected uniformly at random according to we may consider the capacity of the channel to be . The capacity of the channel is a measure of the noisiness (the higher the capacity the less is the noise) and is an upper bound on the rate at which any learning algorithm can extract information from specific realizations , that generalizes accross realizations, i.e. information about and not about the noise. In the above Idealized Learning Protocol we can achieve the capacity rate, as before, by choosing a suitable . Since this scenario is highly idealized we make successive changes to it until we arrive at the more useful Learning Protocol proposed by Buhm13 and from which generalized capacity is derived:
-
I
Change expressiveness of codebook instead of size of code sequences. Suppose we can no longer change , the size of our sequence , i.e. it is fixed. Instead we are allowed to change the number of selected to form . We can now achieve a rate close to capacity by increasing instead of decreasing . Our message set and codebook become more expressive as we increase .
-
II
Coding based on transformation set. Additionally, suppose we can only use the data generating mechanism and channel once. We still know the form of and (and so can calculate entropies for decoding) but can only generate with it once. Furthermore, suppose that we don’t know what hypothesis is selected and passed to the data generating mechanism . Since we don’t have any information about other than the data and , we use a uniform prior to describe our uncertainty regarding the true . All this means we can only generate two data sets : we generate using and then send it through the channel to get . Without access to the data generating mechanism and the true we need an alternative way to construct a codebook (i.e. another for our code). Consider the set of unique maps:
(1.6.0.10) Where .
Notice the following properties about :
-
(a)
-
(b)
If you apply a fixed on all you get again.
-
(c)
If you apply all on a fixed you get again.
Additionally, consider the set of maps:
(1.6.0.11) We assume that we have a mapping such that for a given , and:
(1.6.0.12) Where the posteror is obtained from the data generating mechanism and the prior :
(1.6.0.13) This means that if data set is generated under hypothesis with the data generating mechanism then, for a given move within the hypothesis space we know how to make a corresponding move in the coding/data space . The assumption that we can obtain a mapping is reasonable in some contexts such as in the sparse mean estimation problem that is the main topic of this work. In other pattern analysis problems such as in the mean estimation problem 1.3.0.1 where the hypothesis class has infinite cardinality, the validity of this assumption is not clear.
With the above assumption we will be able to encode into a codebook However we can only pass one data set through the channel and arbitrarily choose to pass which gives the random output . Observe that:
(1.6.0.14) (1.6.0.15) (1.6.0.16) (1.6.0.17) (1.6.0.18) (1.6.0.19) (1.6.0.20) (1.6.0.21) We wish to mimic the channel by mimicking the noise process that contaminated to produce . We may think of the output of the channel as a function of the input and a noise realization of some . We then have that
(1.6.0.22) (1.6.0.23) Since we have passed through the channel and have observed we implicitly have a noise observation . Although, we can’t pass through the channel to get (recall we are only allowed to use the channel once, and we have already used it to pass through), we can mimic the output with which is the result of evaluating on instead of on a new realization of :
(1.6.0.24) (1.6.0.25) With the set and the mapping we have the necessary elements to replace our encoding function . Incorporating the changes to the encoding function and channel, the learning protocol, thus far, consists of:
-
1
The sender picks transformations uniformly at random to construct : . Even though we don’t know what is we can set up our message set using : . In fact, we may now say that is the message set.
-
2
The sender selects a message uniformly at random: . Remark: we use the tilde to separate , from .
-
3
The sender and receiver have access to the transformation set and the mapping which they use to set up the following code:
-
a
The encoder function is constructed by applying to each to construct . Our codebook vector is then .
-
b
Since we still know the distribution we may use it to calculate . Notice that since we know how is selected we use . With we can calculate the joint entropy and use it for decoding as before.
-
a
-
4
We can only send one data set through the channel and so can only observe one output . However, we may mimic the behavior of the channel for other input data sets by using, as derived above, that:
(1.6.0.26) This means that we may mimic the channel by outputing for a given input . This output corresponds to the output the actual channel would have given for an input , assuming the same realization of the noise process as ocurred when passed through the channel. Since the noise realization for one data set, is made up of components, the hope is that the realization observed summarizes the noisiness of the channel. In other words we hope that applying this noise realization to any input data set , the output data set is similar to that we would get by passing through the real channel (to which we no longer have access).
-
(a)
-
III
Decoding based on approximation sets. Finally suppose we don’t know the distribution of the data generating mechanism or that of the channel . This means we need a new decoding function since we don’t know and so cannot use the joint entropy for decoding. This is where our learning algorithm comes to the fore in the form of the cost function and the Gibbs distributions corresponding to both data sets: and . We first describe the new decoding function and then discuss the ideas behind it and its relationship to genealization capacity.
Let
(1.6.0.27) Then the decoding rule is
(1.6.0.28) Where ties are resolved by taking the minimum . Before discussing how to choose the resolution parameter we can show the final Learning Protocol schematic.
Figure 1.8: Learning protocol What should we use? In general we can use any , however to find the channel capacity we must choose it so that for a given (which determines the rate , given is fixed) we can achieve error-free communication. We then increase to such that if we increase it any further there exists no that allows error-free communication. This determines the maximum achievable rate of our code. We illustrate the process of finding the maximum achievable rate of the above code.
-
i
Start with low expressiveness for slack code. We uniformly sample by sampling transformations and use the corresponding set to build our codebook. We select a transformation and pass the econcoded message through the channel to decoder that receives .
Figure 1.9: Learning protocol: creation of codebook -
ii
Create high resolution approximation sets. Using high resolution , we calculate approximation sets , one for each codeword in the codebook. Using the received data set, we calculate an additional approximation set , and apply decoding rule. In the case illustrated in figure 1.10 so by default we decode message to . The red circles represent the approximation sets while the blue circle represents the approximation set . Recall from Section 1.4 that although, strictly speaking, is a weight vector over the entire hypothesis class , the circles represent the subset of where the majority of the weight is supported.
Figure 1.10: Learning protocol: decoding with high resolution -
iii
Lower resolution to increase intersection. Since the current resolution level doesn’t allow significant intersection between and any of the approximation sets we lower the resolution level until there is some intersection meaning we can decode the message without error. Since the hypothesis class is not cluttered with approximation sets, because we are not near capacity, the intersection need not represent a large percentage of the respective approximation sets.
Figure 1.11: Learning protocol: decoding with low resolution -
iv
Increase expressiveness , while adjusting resolution . In finding the maximum rate of our code we increase the size of the message set which means more approximation sets over . However, as happens in part (b) of figure 1.12, for a given resolution the approximation set intersects with more than one approximation set meaning the probability of decoding the wrong message increases. We can, as is shown on part (c), fix this by decreasing the resolution but this increases the size of the approximation sets so that they intersect between themselves. This also increases the probability of error since the set intersects with several sets simultaneously. Finally in part (d) we obtain obtain the maximum rate of our code: if we add any more approximation sets , they will become cluttered between themselves (we go back to the situation in part c) and if we then fix this by increasing resolution, more than one of these sets will intersect significantly with (we go back to the situation in part b).
Figure 1.12: Learning protocol: maximizing learning rate
We have arrived at a fundamental trade-off between, on the one hand, the expressiveness of our code (the cardinality of ) and the resolution of our decoding mechanism (the parameter ) and on the other, the stability of the learning protocol measured by the probability of error, itself a function of the quality of the overlap .
-
i
Suppose the sender sends the hypothesis corresponding to the dataset . We want to compare the approximation sets and to get an idea of what needs to happen to be able to achieve the maximum learning rate. For a given resolution :
-
1
We want to be able to increase the size of the message set, taking care that the approximation sets don’t become cluttered. We can achieve this by maximizing:
(1.6.0.29) This criterion will tend to make small.
-
2
We want to make sure that the quality of the overlap is good. However we need a relative measure since low resolution communication will in general lead to a bigger . We can achieve this by maximizing:
(1.6.0.30) This criterion will tend to make small and large.
Now notice that for a given , and these two quantities don’t depend on the transformation due to assumption 1.6.0.12 so that we may assume without loss of generality that and . So for a given and the bigger and the larger the learning rate will be. This gives us a qualitative notion of why generalization capacity defines the maximum learning rate of our learning algorithm.
We now analyze the probability of error of the above Learning Protocol to more formally understand the role of generalization capacity.
Recall what the random quantities in the Learning Protocol are:
-
•
,
-
•
, where
-
•
Now let . We have that:
| (1.6.0.31) | ||||
| (1.6.0.32) | ||||
| (1.6.0.33) | ||||
| (1.6.0.34) |
Where we have used the union bound to establish the inequality. Note that is a random variable depending on , , and . Using the Markov inequality and the independence of and we see the following:
| (1.6.0.35) | ||||
| (1.6.0.36) | ||||
| (1.6.0.37) | ||||
| (1.6.0.38) | ||||
| (1.6.0.39) | ||||
| (1.6.0.40) | ||||
| (1.6.0.41) | ||||
| (1.6.0.42) | ||||
| (1.6.0.43) | ||||
| (1.6.0.44) |
Where:
-
•
is due to the Markov inequality,
-
•
is due to the fact that is given so there is no need to integrate over it,
-
•
is due to the chain rule of probability,
-
•
is due to the fact that is independent of for ,
-
•
and are due to the fact that is independent of ,
-
•
is due to the fact that is independent of for ,
-
•
is due to the linearity of expectations, and
-
•
is due to the fact that are identically distributed for .
Now
| (1.6.0.45) | ||||
| (1.6.0.46) | ||||
| (1.6.0.47) | ||||
| (1.6.0.48) |
Where for the last equivalence we have used assumption 1.6.0.12. Using the properties of 1.6.0.10 we can establish the following:
| (1.6.0.49) | ||||
| (1.6.0.50) | ||||
| (1.6.0.51) | ||||
| (1.6.0.52) | ||||
| (1.6.0.53) |
So we have that
| (1.6.0.54) | ||||
| (1.6.0.55) |
Again using the properties of 1.6.0.10 we have that:
| (1.6.0.56) | ||||
| (1.6.0.57) | ||||
| (1.6.0.58) | ||||
| (1.6.0.59) |
with which
| (1.6.0.60) | ||||
| (1.6.0.61) | ||||
| (1.6.0.62) | ||||
| (1.6.0.63) |
So error free learning is possible as long as, on average, for data sets and it holds that .
Finally we mention that since the generalization capacity defines the maximum learning rate of a cost function it can be used as a criterion for deciding which cost function to use: simply use the cost function with highest generalization capacity. We will see an application of this in Section 3.6.
Chapter 2 Mean localization
2.1 Generalization capacity
Recall from Section 1.4 that the empirical risk function is defined with respect to a loss function . We will mostly deal with the square loss function:
| (2.1.0.1) |
We calculate the empirical risk, which is our cost function in the context of ASC, with respect to this loss function.
| (2.1.0.2) | ||||
| (2.1.0.3) | ||||
| (2.1.0.4) | ||||
| (2.1.0.5) | ||||
| (2.1.0.6) | ||||
| (2.1.0.7) |
With which we can define the cost function as:
| (2.1.0.8) |
Recall that in the problem at hand so that:
| (2.1.0.9) | ||||
| (2.1.0.10) |
Where:
-
•
and
-
•
Since we don’t know the distribution of or we will use simulation to estimate . Before describing the simulation algorithm notice that is a function of the two data set means and and since has a normal distribution:
| (2.1.0.11) |
If we let then and we have that:
| (2.1.0.12) |
Where:
-
•
,
-
•
-
•
-
•
and
-
•
Using this alternate expression we can reduce the number of simulations by a factor of . Notice that varying both and doesn’t make sense since characterizes the variance of the data set. For this reason we leave fixed and only vary in our simulation experiments.
2.2 Exhaustive algorithm
To estimate the generalization capacity for the mean localization problem, for a given and , take the following steps:
-
1.
Choose a grid of relevant values:
-
2.
For to
-
a.
Simulate
-
b.
For to
-
•
Calculate information content:
(2.2.0.1)
-
•
-
a.
-
3.
For to
-
•
Estimate mean information content:
(2.2.0.2) -
•
Estimate generalization capacity:
(2.2.0.3)
-
•
Remark. When dealing with real data we don’t know what is. This doesn’t matter since GC is independent of any particular hypothesis, rather it depends on the data generating mechanism and on the cost function . Provided we can simulate from the model that we assume generated the data we will always be able to estimate GC by simulating from the model for an arbitrary set of parameters . By calculating GC we obtain a that resolves the resolution-stability trade off. We may then use on the real data to obtain an appropriate approximation set of hypotheses. Alternatively we may compare the GC associated to different cost functions and choose the cost function with the highest GC.
2.3 Simulation results
We used the following parameters for the simulation experiments:
-
•
,
-
•
,
-
•
100 different values from 0.01 to 20, and
-
•
30 different noise levels from 0.1 to 10.
To check simulation results made sense we first calculated the Gibbs distribution distribution over , where is the resolution parameter that allows generalization capacity to be reached. Since corresponds to a vector with entries. To display the results in an easy to read fashion we aggregated this vector to produce a component-wise Gibbs distribution:
| (2.3.0.1) |
The following graph is an illustration of the estimate for different noise levels.
The blue dots show the true value of for each of its components. The lower the noise the less uncertainty about the value of the we have. We next show the average information content for different resolutions and noise levels .
The crossed circles represent the pairs where average information content is maximized. The lower the noise level the higher the generalization capacity is. For low noise levels, sucha as , we can obtain gains in average information content the higher the resolution (albeit at a diminishing rate) i.e. generalization capacity is basically an increasing function of resolution for these noise levels. This means that for such low noise we can let and obtain the empirical risk minimizer. For medium range noise levels, such as , once we go past the resolution threshold , the average information content decreases dramatically i.e. generalization capacity is a convex function of resolution for these noise levels. Here we see the resolution-stability trade-off clearly. For this level of noise we can only decrease our approximation sets to a certain size parametrized by before we start to get very unstable sets with little information.
We now show the generalization capacity for different noise levels.
The blue line shows the generalization capacity while the red line shows the true Gibbs probabilty, i.e. . As expected the generalization capacity decreases toward zero as the noise level becomes so big as to completely drown out the signal . Notice that for noise levels , and indicating that we can completely recover the signal with the empirical risk minimizer ( !).
2.4 Log-sum-exp trick
We can express the information content as
| (2.4.0.1) |
In turn, we can express the log partition functions as:
| (2.4.0.2) | ||||
| (2.4.0.3) |
where:
-
•
,
-
•
and
-
•
When implementing the algorithm of Section 2.2 we may run into the problem that for very high resoluton values , and are so small that they are represented as 0 using limited-precision, floating point numbers. This means and are represented as with which our calculation of breaks down. To solve this underflow problem we use the log-sum-exp trick. Let:
| (2.4.0.4) |
Then,
| (2.4.0.5) |
If we calculate using the last expression, this solves the underflow problem since so that .
2.5 Variance reduction with common random numbers
If we want to estimate by simulation:
| (2.5.0.1) |
We can either:
-
a.
Generate i.i.d. realizations of : ,. Then:
(2.5.0.2) (2.5.0.3) (2.5.0.4) or we can,
-
b.
Generate i.i.d. realizations of : . Then:
(2.5.0.5) (2.5.0.6) (2.5.0.7)
The second method is an example of Common Random Numbers (CRNs) since we use the same pseudo-random numbers to estimate and .
CRNs is a variance reduction technique, although, strictly speaking, it does not always succeed in reducing the variance of an estimator. To see when it might succeed we compare the variance of and :
| (2.5.0.8) | ||||
| (2.5.0.9) | ||||
| (2.5.0.10) | ||||
| (2.5.0.11) | ||||
| (2.5.0.12) |
| (2.5.0.13) | ||||
| (2.5.0.14) | ||||
| (2.5.0.15) | ||||
| (2.5.0.16) | ||||
| (2.5.0.17) |
If and are both either monotonically non-decreasing or mononotonically non-increasing then:
| (2.5.0.19) | ||||
| (2.5.0.20) |
We now obtain a different expression for and in order to use the CRN technique for the estimation of . We start with an alternative, but equivalent (proportional in ) cost function . Using that we have that:
| (2.5.0.21) | ||||
| (2.5.0.22) | ||||
| (2.5.0.23) | ||||
| (2.5.0.24) | ||||
| (2.5.0.25) |
So that .
Again, using that we have that:
| (2.5.0.26) | ||||
| (2.5.0.27) |
Since we have that:
| (2.5.0.28) | ||||
| (2.5.0.29) |
Where:
-
•
-
•
Using these expressions we implemented 3 different CRN algorithms to estimate and , and compared the variance estimate of each, where .
All three algorithms generate realizations of but differ in wether they use them for the estimation of , or both:
-
1.
CRN-1 Generate realizations of . Use first to calculate and and second to calculate .
-
2.
CRN-2 Generate realizations of . Use all to calculate , and .
-
3.
CRN-3 Generate realizations of . Use first to calculate , second to calculate and all to calculate . This CRN algorithm is actually the algorithm proposed in Section 2.2. We simulate times and use it to estimate both and .
We used the following parameters for the simulation experiments:
-
•
,
-
•
,
-
•
100 different values from 0.01 to 20, and
-
•
30 different noise levels from 0.1 to 4.
Figure 2.4(b) shows the estimation of the generalization capacity and the square root of variance using all 3 methods.
Clearly method CRN-3, the method described in Section 2.2, has the least variance. This makes sense because if are i.i.d.:
-
a.
, so using the same random number to estimate and actually increases the variance, while,
-
b.
, so using the same random number to estimate and decreases the variance.
Chapter 3 Sparse mean localization
3.1 Exhaustive algorithm
For the sparse mean localization problem the hypothesis space is restricted to binary vectors with entries equal to one:
| (3.1.0.1) |
Notice that . In terms of the algorithm in Section 2.2, the only thing that changes is that the sums involved in and are over instead of the entire .
In the non-sparse case, to generate the vectors such that we can simply use the mapping where maps a positive integer to its length binary representation.
In the sparse case, to generate the vecors such that we use the mapping where maps a positive integer to the i-th element of , assuming that is in lexicographical order.
The algorithm shown below, adapted from Lehmer (pp. 27-29), can be used to produce the mapping . It is based on the fact that if is in reverse lexicographical order then we can represent the number as:
| (3.1.0.2) |
Where gives the position of the j-th entry of that is equal to one. i.e. .
Algorithm to obtain
-
1.
Initalize:
-
•
Set .
-
•
Set .
-
•
-
2.
For from to :
-
a.
-
b.
-
c.
-
a.
3.2 Simulation results: exhaustive algorithm
We used the following parameters for the simulation experiments:
-
•
,
-
•
-
•
,
-
•
100 different values from 0.01 to 20, and
-
•
30 different noise levels from 0.1 to 10.
First we show the information content for different values of , and . Since we look at only. For the behavior will be equivalent and the only difference is that the role of 0 and 1 () is reversed.
For a given we see that, as in the non-sparse case, for low noise levels, increases in resolution obtain diminishing gains in information content while for higher noise levels, once the optimum resolution is surpassed, the information content decreases. Also notice that as increases toward the information content also increases. This is because the size of the hypothesis space is increasing in from 0 to . We now show the generalization capacity for different values of .
Again, since values of closer to correspond to larger hypothesis spaces, the generalization capacity of the cost function is larger for these .
3.3 Sampling algorithm
As was mentioned in Section 1.2 we are ultimately interested in the sparse case where is kept constant and grows toward infinity. As grows, the size of the hypothesis space grows exponentially fast which means computing the partition functions and , which are sums over , quickly becomes unfeasible. In this section we use the sampling algorithm suggested in Buhm14 to estimate and without summing over the entire hypothesis space.
Recall that:
| (3.3.0.1) | ||||
| (3.3.0.2) | ||||
| (3.3.0.3) | ||||
| (3.3.0.4) |
If we let then,
| (3.3.0.5) | ||||
| (3.3.0.6) | ||||
| (3.3.0.7) | ||||
| (3.3.0.8) | ||||
| (3.3.0.9) | ||||
| (3.3.0.10) | ||||
| (3.3.0.11) | ||||
| (3.3.0.12) | ||||
| (3.3.0.13) |
The last expression suggests the following sampling algorithm to estimate the generalization capacity :
-
1.
Choose a grid of relevant values:
-
2.
For to
-
a.
Simulate
-
b.
Uniformly sample hypotheses
-
c.
For to
-
•
Calculate quasi information content:
(3.3.0.14) (3.3.0.15)
-
•
-
a.
-
3.
For to
-
•
Estimate mean information content:
(3.3.0.16) -
•
Estimate generalization capacity:
(3.3.0.17)
-
•
3.4 Simulation results: sampling algorithm
We used the following parameters for the simulation experiments:
-
•
,
-
•
,
-
•
,
-
•
,
-
•
20 different values from 0.01 to 10, and
-
•
20 different noise levels from 0.1 to 15.
We first compare the generalization capacity estimation using the exhaustive and sampling algorithms for two different choices of .
It is clear that using the sampling algorithm with we underestimate the generalization capacity since for very low noise levels we know the generalization capacity is equal to . For the estimation is much better, however since it is cheaper to use the exhaustive algorithm. Next we check the generalization capacity estimate for both algorithms as increases. The parameters used for the simulation experiments were the following:
-
•
,
-
•
,
-
•
,
-
•
,
-
•
20 different values from 0.01 to 10, and
-
•
2 different noise levels .
The figure above confirms that the sampling algorithm proposed turns out to be more expensive than the exhaustive algorithm. For example, to estimate the generalization capacity accurately when we need which is larger than the size of the hypothesis space . The sampling algorithm represents a way to estimate genearalization capacity by summing over a sample of the hypothesis class. The sample size required must be, at most, linear in if it is to be useful in estimating generalization capacity for sparse conditions when is fixed and is large.
3.5 Importance sampling algorithm
The aim of the sampling algorithm is to estimate with a sample from instead of exhaustively calculating it as:
| (3.5.0.1) |
This means sampling , calculating the Boltzmann weights and averaging them. In general, different hypothesis contribute differently to the average. The lower the cost of a hypothesis the larger the weight contributed. Those hypotheses which contribute most of the weight are relatively small in number. This means that with a small number of samples the proportion of important and unimportant hypotheses will not accurately reflect the population proportions and the result will be a biased estimate of and . If we take a large sample, of size bigger than the size of , the simulation results seem to show that the estimates converge to those of the exhaustive algorithm, but this defeats the purpose of sampling hypotheses: to obtain an algorithm that is not exponential in as the size of the hypothesis class is.
We want to design an importance sampling algorithm where:
-
1.
We sample according to a proposal distribution which assigns more probability to more important hypotheses.
-
2.
When estimating the expectation with the average we assign weights to each sample to correct for the fact we sampled according to wrong distribution:
| (3.5.0.2) | |||||
| (3.5.0.3) |
Where .
Recall that we may write:
| (3.5.0.4) | ||||
| (3.5.0.5) |
Observe that is constant for the case where the hypothesis space is and not . Also note that is the number of hits of hypothesis : the number of components such that . With this in mind we can obtain the following equivalent expression for :
| (3.5.0.6) | ||||
| (3.5.0.7) |
Where . This means we may express the Boltzmann weights as:
| (3.5.0.8) |
The importance of a hypothesis is given by the Boltzmann weights and these depend on the functions and . We first analyse . We have that, for :
| (3.5.0.9) | ||||
| (3.5.0.10) | ||||
| (3.5.0.11) |
This means that we can expect to increase for half the samples and decrease it for the other half, although in general, we can expect to increase . So we see that may contribute to a hypothesis being more or less important depending on the sampled. If we want to take this effect into account in determining the proposal distribution we would have to make it depend on the given sampled. For simplicity we only take into account in determining .
We now analyse . The more hits that a hypothesis has with respect to the lower the costs which means the larger he weight contributed. Also note that there are hypotheses such that . The following figure illustrates the importance of a hypothesis and the number of such hypotheses in as a function of for , and .
Hypothesis such that is close to contribute moste of the weight but are relatively few in number. There are hypotheses such that so there are hypotheses such that . As grows this becomes a low proportion of , the total number of hypotheses. In other words, as grows, the most important hypotheses, those that contribute most of the weight, become a smaller proportion of all hypotheses.
This means that to sample a representative proportion of important hypotheses we need a very large sample. To find a way around this we use a proposal distribution such that the probability of sampling a hypothesis with hits is the same for all .
Let,
| (3.5.0.12) | ||||
| (3.5.0.13) |
This means that:
| (3.5.0.14) | ||||
| (3.5.0.15) | ||||
| (3.5.0.16) |
| (3.5.0.17) |
The above suggests the following importance sampling algorithm for estimating generalization capacity.
-
I.
Choose a grid of relevant values:
-
II.
For to
-
1.
Simulate
-
2.
For to
-
a.
Sample from
-
b.
Sample from This can be done by:
-
i.
Calculate number of misses
-
ii.
Identify and
-
iii.
Set
-
iv.
Uniformly sample times and setting and each time.
-
i.
-
a.
-
3.
For to
-
•
Calculate quasi information content:
(3.5.0.18) (3.5.0.19)
-
•
-
1.
-
III.
For to
-
•
Estimate mean information content:
(3.5.0.20) Where
-
•
Estimate generalization capacity:
(3.5.0.21)
-
•
3.6 Simulation results: importance sampling algorithm
We used the following parameters for the simulation experiments:
-
•
,
-
•
,
-
•
,
-
•
,
-
•
20 different values from 0.01 to 10, and
-
•
20 different noise levels from 0.1 to 15.
We first compare the generalization capacity estimation using the exhaustive, sampling and importance sampling algorithms for two different choices of .
The figures suggest that the generalization capacity estimated with the importance sampling algorithm converges to the exhaustive algorithm results for a sample size much smaller than is required for the sampling algorithm. Next we check the generalization capacity estimate for all three algorithms as increases. The parameters used for the simulation experiments were the following:
-
•
,
-
•
,
-
•
,
-
•
,
-
•
20 different values from 0.01 to 10, and
-
•
2 different noise levels .
The above figures seem to confirm that the importance sampling algorithm need a much smaller sample size to converge than does the sampling algorithm suggesting it will be useful in estimating generalization capacity for large values of when we can no longer exhaustively evaluate the partition functions. In the following simulation experiments we estimate the generalization capacity of the cost function in sparse settings where is constant and is large. We used the following parameters for these simulation experiments:
-
•
,
-
•
,
-
•
,
-
•
,
-
•
100 different values from 0.01 to 30, and
-
•
4 different noise levels .
Recall we ended Section 1.6 by mentioning that we can use generalization capacity to choose between alternative cost functions. The following simulation experiments, carried out with the above parameters, were performed for two different cost functions, the squared-loss based risk function and an absolute-loss based risk function. Recall expression 2.1.0.8 for the squared-loss based risk function:
| (3.6.0.1) |
If we replace the L2 norm with the L1 norm we get te absolute-loss based risk function:
| (3.6.0.2) |
The following figure shows the estimated generalization capacity of both cost functions for different number of components and noise levels . Each scatter point represents the estimation, by simulation, of the generalization capacity for a given and cost function . Blue points represent the generalization capacity of the L1 norm cost function and black points that of the L2 norm cost function. The blue and black lines are smoothing splines applied to the blue and black points respectively.
We can see that the generalization capacity for both cost functions, as a function of the number of components , displays concave behavior. Initially, as the hypothesis set size grows we see rapid increase in the generalization capacity however after a certain threshold, the large number of hypotheses makes detection of the relevant components difficult so that additional gains in generalization capacity are marginal. The value of this threshold depends on the noise level of the data: the higher the noise level the lower the threshold. Additionally, observe that, as we would expect given that the data has a gaussian distribution, the L2 norm cost function has a greater generalization capacity than that of the L1 norm cost function.
Chapter 4 Towards sparse feature selection for correlated features
As with the model described in Section 1.2 we deal with the statistical model:
Except in this case we have that:
-
•
,
-
•
,
-
•
,
-
•
It is assumed that is known,
-
•
where for all , and
-
•
observations with are i.i.d.
Notice that in contrast to the problem statement in section 1.2, the features are now correlated. This is because each entry represents a variable or feature and the normal situation is that features are correlated. We now change the sparsity condition from a small, fixed and large to . This reflects the assumption that the number of relevant features grows as the number of total features grows, albeit at a slower rate.
We are ultimately interested in estimating, by simulation, the generalization capacity of the quadratic loss based, empirical risk function. We could try to use the importance sampling algorithm of Section 3.5 although we haven’t tested for the case where and . In this Chapter we explore an alternate way to approximate the expected value of the log partition function , which, as we have seen, is a component of the generalization capacity. The following derivations and approximations are based on BuhmNotes.
In this case we have that
| (4.0.0.1) |
So we let , where so that . Recall from 2.5.0.26 that we may write the square based empirical risk function as:
| (4.0.0.2) |
Let and . Then:
| (4.0.0.4) | ||||
| (4.0.0.5) | ||||
| (4.0.0.6) |
with which
| (4.0.0.7) | ||||
| (4.0.0.8) |
but since we have that
| (4.0.0.9) | ||||
| (4.0.0.10) | ||||
| (4.0.0.11) |
Let
| (4.0.0.12) |
Notice that so that
| (4.0.0.13) |
If we take a hypothesis at random the number of hits is a hypergeometric random variable:
| (4.0.0.14) |
Where
-
•
measures the number of succesesses from draws without replacement,
-
•
is the number of success states and
-
•
is the number of draws.
In this case we pick a at random which represents picking components to be equal to one (without replacement), from a population of where there are exactly components equal to one. This random variable has the following probability distribution function:
| (4.0.0.15) |
Where which means that
| (4.0.0.16) | ||||
| (4.0.0.17) | ||||
| (4.0.0.18) |
Now is exponential in and is a sum over a very large hypothesis space so we will need a way to approximate it. We have that:
| (4.0.0.19) | ||||
| (4.0.0.20) |
where . First notice that if then , and since we have that so that:
| (4.0.0.21) | ||||
| (4.0.0.22) | ||||
| (4.0.0.23) | ||||
| (4.0.0.24) | ||||
| (4.0.0.25) | ||||
| (4.0.0.26) |
Where . Since
| (4.0.0.27) |
so that
| (4.0.0.28) |
The problem with evaluating is that it is a sum over which is very large if is large and . If we can come up with a good approximation of then the above formula suggests the following algorithm for estimating , for a given , and :
-
1.
For to
-
a.
Simulate
-
b.
For to
-
•
Simulate
-
•
Calculate
(4.0.0.29)
-
•
-
c.
Calculate
-
a.
-
2.
Estimate
(4.0.0.30)
In order to explore possible ways to approximate we take a look at its distribution.
| (4.0.0.31) |
Since
| (4.0.0.32) | ||||
| (4.0.0.33) | ||||
| (4.0.0.34) |
and
| (4.0.0.35) |
we have that even in the case that , is a sum of correlated log-normals with correlation matrix such that
| (4.0.0.36) |
If we have that
| (4.0.0.37) | ||||
| (4.0.0.38) |
and
| (4.0.0.39) | ||||
| (4.0.0.40) |
Where is the number of overlapping ones in and . If we can use the approximation proposed in BuhmNotes where we assume we have that:
| (4.0.0.41) | ||||
| (4.0.0.42) | ||||
| (4.0.0.43) | ||||
| (4.0.0.44) | ||||
| (4.0.0.45) | ||||
| (4.0.0.46) |
However it is not clear that this approximation will be helpful since it corresponds to assuming that if and then and for all and .
Chapter 5 Summary
The work presented in this report falls into the following three categories:
- i.)
- ii.)
-
iii.)
Exploration of how generalization capacity can be implemented for a more realistic version of the sparse feature selection problem: Chapter 4.
In the first case we introduce pattern analysis which is a broad framework with which to deal with learning problems. We describe the approximation set approach to learning where we look for a set of hypotheses with similar performance instead of looking for just one. With the definitions from pattern analysis and approximation sets we then introduce information theoretic concepts, originally developed within the field of statistical physics, which we need to define GC. To motivate the meaning of GC we study Shannon’s noisy channel coding theorem and related theory drawing an extensive analogy between channel capacity and generalization capacity. We describe in detail the differences and similarities between the communication scenario from which Shannon’s concept of channel capacity arises and the learning scenario from which Buhm13’s concept of generalization capacity can be derived.
The second type of contribution presented here involves the implementation of generalization capacity to the problem of sparse mean localization. In Buhm14 an expression for GC for the sparse mean localization problem (with respect to the squared loss based empirical risk function) is derived that suggests a simulating algorithm for its estimation. The simulating algorithm is briefly described and results are presented. Based on this work we designed and detailed successive simulating algorithms for GC estimation for non-sparse and sparse mean localization problems. We first designed an exhaustive sampling algorithm for non-sparse mean localization in low dimensional cases where the dimension of the mean vector is in the order of 10. We implemented various versions of common random numbers to reduce variance and chose the best one. We then applied it to the sparse mean localization problem and tried to scale it up to deal with high dimensional cases, but found that since the size of the hypothesis class is exponential in the dimension the exhaustive algorithm is unfeasible since it involves summing over the entire hypothesis space. To deal with this we designed a uniform sampling algorithm, also suggested in Buhm14, but found that for this algorithm to converge the number of sampled hypotheses necessary was actually larger than the hypothesis class size. We solved this difficulty by designing an importance sampling alogorithm which seems to be adequate for high dimensions in the order of 10,000 (asymptotic confidence intrevals need to be derived to verify this). In Buhm14 results showing the estimation of GC for high dimensional sparse mean localization are shown however the simulation method is not detailed. The contribution of this work is to detail and justify numerical estimation of GC for the sparse mean localization problem. It is also worth mentioning that the results of the estimatation of GC are qualitatively different to those found in Buhm14:compare for example figures 1 and 2 in Buhm14 to figure 3.10.
Finally, based on BuhmNotes, we explored estimating GC in a more realistic version of the sparse feature selection problem and sketched a general simulation algorithm, describing certain difficulties that need to be resolved.
5.1 Future work
Possible ways to extend the work presented here are:
-
•
Derive asymptotic confidence intervals for the different GC estimators (exhaustive, sampling, importance sampling) so as to verify when these are fullfilled and so determine the number of simulations necessary. This is especially important for the sparse high dimensional cases ( large) so as to establish the reliability of the estimates produced and the feasability of the algorithms.
-
•
Explore the sparse feature selection problem further: does the approximation work? What other approximations can we use to make the estimation of feasible for large and .
-
•
Implement the importance sampling algorithm to the more general sparse feature selection problem and compare with simulation methods based on approximations of the type discussed in Chapter 4.
-
•
Extend the study to include estimation of sparse histograms. In this case a histogram can be represented as a vector composed of a mean and noise : i.e. as in the sparse mean localization problem. However in this case instead of and instead of . The number of non-zero entries is still assumed to be to enforce a sparsity condition.
Appendix A R Code
We include the code in R that was used to implement the importance sampling algorithm. Other algorithms described to estimate generalization capacity are very similar so we omit them.