Aligned Image-Word Representations Improve Inductive Transfer Across Vision-Language Tasks
Abstract
An important goal of computer vision is to build systems that learn visual representations over time that can be applied to many tasks. In this paper, we investigate a vision-language embedding as a core representation and show that it leads to better cross-task transfer than standard multi-task learning. In particular, the task of visual recognition is aligned to the task of visual question answering by forcing each to use the same word-region embeddings. We show this leads to greater inductive transfer from recognition to VQA than standard multitask learning. Visual recognition also improves, especially for categories that have relatively few recognition training labels but appear often in the VQA setting. Thus, our paper takes a small step towards creating more general vision systems by showing the benefit of interpretable, flexible, and trainable core representations.
1 Introduction
Consider designing a vision system that solves many tasks. Ideally, any such system should be able to reuse representations for different applications. As the system is trained to solve more problems, its core representations should become more complete and accurate, facilitating the learning of additional tasks. Vision research often focuses on designing good representations for a given task, but what are good core representations to facilitate learning the next?
The application of knowledge learned while solving one task to solve another task is known as transfer learning or inductive transfer. Inductive transfer has been demonstrated in recent vision-language tasks in [34, 37, 26, 16, 49, 24], where the hidden or output layers of deep networks learned from pre-training (e.g. on ImageNet [14]) or multitask learning serve as the foundation for learning new tasks. However, the relations of features to each new task needs to be re-learned using the new task’s data. The goal of our work is to transfer knowledge between related tasks without the need to re-learn this mapping. Further, as we are working with vision-language tasks, we aim to transfer knowledge of both vision and language across tasks.
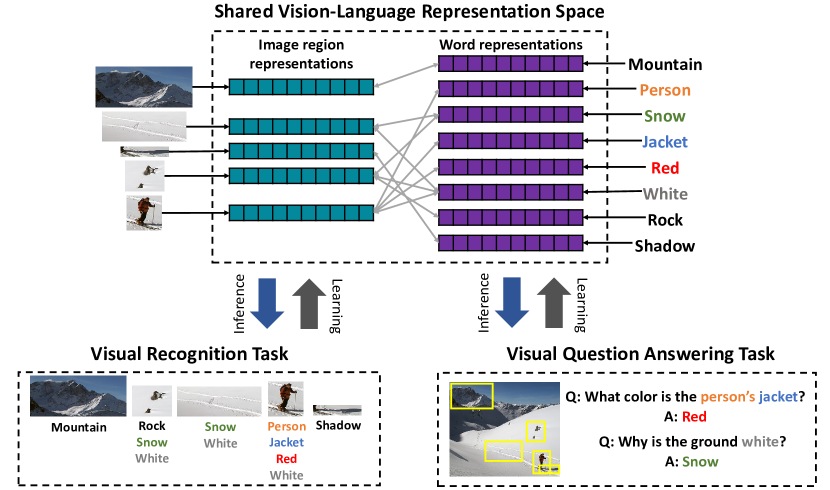
In this work we propose a Shared Vision-Language Representation (SVLR) module that improves inductive transfer between related vision-language tasks (see Fig. 1). We apply our approach to visual recognition (VR) and attention-based visual question answering (VQA). We formulate VR in terms of a joint embedding of textual and visual representations computed by the SVLR module. Each region is mapped closest to its correct (textual) class label. For example, the embedding of “dog” should be closer to an embedded region showing a dog than any other object label. We formulate VQA as predicting an answer from a relevant region, where relevance and answer scores are computed from embedded word-region similarities. For example, a region will be considered relevant to “Is the elephant wearing a pink blanket?” if the embedded “pink” and either “elephant” or “blanket” are close to the embedded region. Similarly, the answer score considers embedded similarities, but in a more comprehensive manner. We emphasize that the same word-region embedding is learned for both VR and VQA. Our experiments show that formulating both tasks in terms of the SVLR module leads to better cross-task transfer than if features are shared through multitask learning but without exploiting the alignment between words and regions.
In summary, our main contribution is to show that the proposed SVLR module leads to better inductive transfer than unaligned feature sharing through multitask learning. As an added benefit, attention in our VQA model is highly interpretable: we can show what words cause the system to score a particular region as relevant. We take a small step towards lifelong-learning vision systems by showing the benefit of an interpretable, flexible, and trainable core representation.
2 Related Work
Never-ending learning: NEL [43, 9, 53, 50, 11] aims to continuously learn from multiple tasks such that learning to solve newer problems becomes easier. Representation learning [7], multitask learning [10], and curriculum learning [45] are different aspects of this larger paradigm. Inductive transfer through shared representations is a necessary first step for NEL. Most works focus on building transferable representations within a single modality such as language or vision only. We extend this framework to learn a joint vision-language representation which enables a much larger class of new vision-language tasks to easily build on and contribute to the shared representation.
VR using Vision-language embeddings: Traditionally, visual recognition has been posed as multiclass classification over discrete labels [21, 51, 32]. Using these recognizers for tasks like VQA and image captioning is challenging because of the open-vocabulary nature of these problems. However, availability of continuous word embeddings (e.g. word2vec [40]) has allowed reformulation of visual recognition as a nearest neighbor search in a learned image-language embedding space [55]. Such embeddings have been successfully applied to a variety of tasks that require recognition such as image captioning [35, 23], phrase localization [46, 31], referring expressions [29, 39], and VQA [5, 47, 60].
Our recognition model is related to previous open-vocabulary recognition/localization models [55, 48, 18], which learn to map visual CNN features to continuous word vector representations. However, we specifically focus on the multitask setting where VR forms a part of a higher-level vision-language task such as VQA. Since the SVLR module is reused in both tasks with inner products in the embedding space forming the basis for both models, during joint training VQA provides a weak supervision for recognition as well. Fang et al. [15] also learn object and attribute classifiers from weak supervision in the form of image-caption pairs using a multiple instance learning (MIL) framework, but do not use a vision-language embedding. Liu et al. [36] similarly use VR annotation from Flickr30K entities [46] to co-supervise attention in a caption-generation model on the same dataset. Our work goes further by allowing the supervision to come from separate datasets, thereby increasing the amount of training data available for the shared parameters. Additionally, we look at how each task has benefited from jointly training with the other.
VQA: Visual Question Answering (VQA) involves responding to a natural language query about an image. Our VQA model is closely related to attention-based VQA models [16, 24, 37, 58, 49, 59, 4, 3, 33, 54] which attempt to compute a distribution (region relevance or attention) over the regions/pixels in an image using inner product of image-region and the full query embedding [58, 49, 24, 37]. Region relevance is used as a weight to pool relevant visual information which is usually combined with the language representation to create a multimodal representation. Various methods of pooling such as elementwise-addition, multiplication, and outer-products have been explored [59, 16]. Attention models are themselves an active area of research with applications in visual recognition [44, 27], object localization, caption generation [28], question answering [56, 52, 33], machine comprehension [22] and translation [6, 57], and neural turing machines [20].
Our model explicitly formulates attention in VQA as image localization of nouns and adjectives mentioned in a candidate QA pair. Ilievski et al. [24] use a related approach for attention. They use word2vec to map individual words in the question to the class labels of a pre-trained object detector which then generates the attention map by identifying regions for those labels. Tommasi et al. [54] similarly use a pre-trainined CCA [18] vision-language embedding model to localize noun phrases, then extracts scene, attribute, and object features to answer VQA questions. Our model differs from these methods in two ways: (i) vision-language embeddings for VR allow for end-to-end trainability, and (ii) jointly training on VR provides additional supervision of attention through a different (non-VQA) dataset.
Andreas et al. [4, 3] rely heavily on the syntactic parse to dynamically arrange a set of parametrized neural modules. Each module performs a specific function such as localizing a specific word or verifying relative locations. In contrast, our approach uses a static model but relies on language parse to make it interpretable and modular.
3 Method
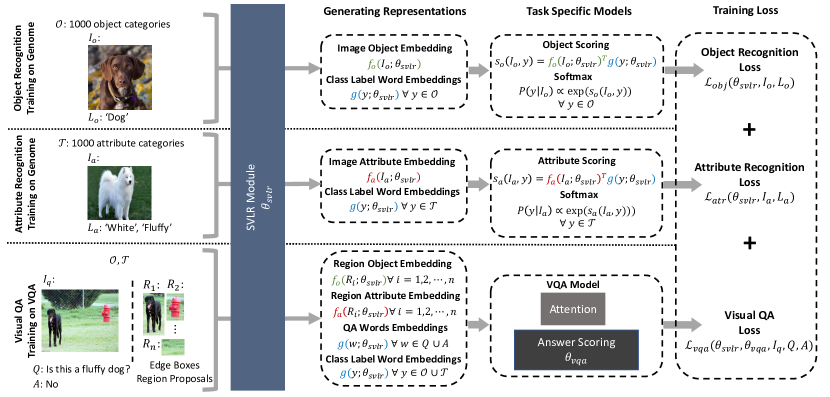
We propose an SVLR module to facilitate greater inductive transfer across vision-language tasks. As shown in Fig. 2, the word and region representations required for object recognition, attribute recognition, and VQA are computed through the SVLR module. By specifically formulating each task in terms of inner products of word and region representations and training on all tasks jointly, we ensure each task provides a consistent, non-conflicting training signal for aligning words and region representations. During training, the joint-task model is fed batches containing training examples from each task’s dataset.
3.1 Shared Vision Language Representation
The SVLR module converts words and image-regions into feature representations that are aligned to each other and shared across tasks.
Word Representations: The representation for a word is constructed by applying two fully connected layers (with 300 output units each) to pretrained word2vec representation [41] of with ReLU after the first layer.
Region Representations: A region is represented using two dimensional feature vectors and that separately encode the objects and attributes contained. We used two representations instead of one to encourage disentangling of these two factors of variation. For example, we do not expect “red” to be similar to “apple”, but we expect and to be similar to and if depicts a red apple. The features are constructed by extracting the average pooled features from Resnet [21] pretrained on ImageNet and then passing through separate object and attribute networks. Both networks consist of two fully connected layers (with 2048 and 300 output units) with batch normalization [25] and ReLU activations.
3.2 Visual Recognition using SVLR
3.2.1 Inference
The visual recognition task is to classify image regions into one or more object and attribute categories. The classification score for region and object category is . The classification score for an attribute category is . Attributes may include adjectives and adverbs (e.g., “standing”). Though our recognition dataset has a limited set of object categories and attribute categories , our model can produce classification scores for any object or attribute label given its word2vec representation. In experiments, the and consist of 1000 most frequent object and attribute categories in the Visual Genome dataset [31].
3.2.2 Training
Our VR model is trained using the Visual Genome dataset which provides image regions annotated with object and attribute labels. VR uses only the parameters for the embedding functions and that are part of the SVLR module. The parameters of receive gradients from the object loss while those of receive gradients from the attribute loss. The parameters of word embedding model receive gradients from both losses.
Object loss: We use a multi-label loss as object classes may not be mutually exclusive (e.g., “man” is a “person”). For a region , we denote the set of annotated object categories and their hypernyms extracted from WordNet [42] by . The object loss forces the true labels and their hypernyms to score higher than all other object labels by a margin . For a batch of samples the object loss is:
| (1) |
Attribute Loss: The attribute loss is a multi-label classification loss with two differences from object classification. Attribute labels are even less likely to be mutually exclusive than object labels. As such, we predict each attribute with independent cross entropy losses. We also weigh the samples based on fraction of positive labels in the batch to balance the positive and negative labels in the dataset. For a batch with M samples where is the set of attributes annotated for region , the attribute loss is:
| (2) |
where is a sigmoid activation function and is the fraction of positive samples for attribute in the batch.
3.3 Visual Question Answering using SVLR
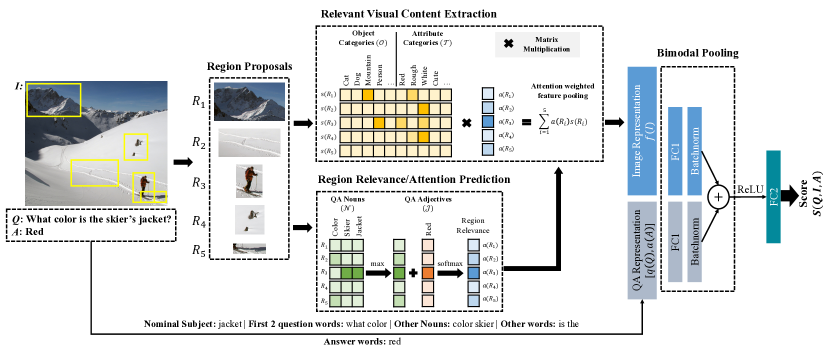
Our VQA model is illustrated in Fig. 3. The input to our VQA model is an image, a question, and a candidate answer. Regions are extracted from the image using Edge Boxes [61]. The same SVLR module used by VR (Sec. 3.2) is explicitly applied to VQA for attention and answer scoring. Our system assigns attention scores to each region according to how well it matches words in the question/answer, then scores each answer based on the question, answer, and attention-weighted scores for all objects () and attributes ().
Attention Scoring: Unlike other attention models [59, 37] that are free to learn any correlation between regions and question/answers, our attention model encodes an explicit notion of vision-language grounding. Let be the set of region proposals extracted from the image, and and denote the set of nouns and adjectives in the pair. Each region is assigned an attention score as follows:
| (3) | ||||
| (4) |
Thus, a region’s attention score is the sum of maximum adjective and noun scores for words mentioned in the question or answer (which need not be in sets and ).
Image Representation: To score an answer, the content of region is encoded using the VR scores for all objects and attributes in and , as presence of unmentioned objects or attributes may help answer the question. The image representation is an attention-weighted average of these scores across all regions:
| (5) |
where is the image, are the scores for 1000 objects in for each image region , are the scores for 1000 attributes in , and is the attention score.
Question/Answer Representation: To construct representations and for the question and answer, we follow Shih et al. [49], dividing question words into 4 bins, averaging word representations in each bin, and concatenating the bin representations resulting in a 1200 () dimensional vector . The answer representation is obtained by averaging the word representations of all answer words. The word representations used here are produced by the SVLR module.
Answer Scoring: We combine the image and Q/A representations to jointly score the triplet.
To ensure equal contribution of language and visual features, we apply batch normalization [25] on linear transformations of these features before adding them together to get a bimodal representation :
| (6) |
Here, denote batch normalization and and define the linear transformations. The bimodal representation is:
| (7) |
with .
Training: We use the VQA dataset [5] for training parameters of our VQA model: , and scales and offsets of batch normalization layers. In addition, the VQA loss backpropagates into , and which are part of the SVLR module. Each sample in the dataset consists of a question about an image with list of answer options including a positive answer and negative answers .
The VQA loss encourages the correct answer to be scored higher than all incorrect answer options by a margin . Given batch samples , the loss is written as
| (8) |
3.4 Zero-Shot VQA
The representations produced by SVLR module should be directly usable in related vision-language tasks without any additional learning. To demonstrate this zero-shot cross-task transfer, we train the SVLR module using Genome VR data only and apply to VQA. Since bimodal pooling and scoring layers cannot be learned without VQA data, we use a proxy scoring function constructed using region-word scores only. For each region, we compute as the sum of its scores for the maximally aligned question nouns and question adjectives (Eq. 3 with only question words). A score is similarly computed using answer nouns and adjectives. The final score for the answer is defined by
| (9) |
where is the attention score computed using Eq. 4. Therefore, the highest score is given to QA pairs where question as well as answer nouns and adjectives can be localized in the image. Note that the since the model is not trained on even a single question from VQA, the zero-shot VQA task also shows that our model does use the image to answer questions instead of solely relying on the language prior which is a common concern with most VQA models [2, 19].
4 Implementation and Training Details
We use 100 region proposals resized to for all experiments. Resnet-50 was used for image feature extraction in all experiments except those in Tab. 3 which used Resnet-152. The nouns and adjectives are extracted from the and lemmatized using the part-of-speech tagger and WordNet lemmatizer in NLTK [8]. We use the Stanford Dependency Parser [13] to parse the question into bins as detailed in [49]. All models are implemented and trained using TensorFlow [1]. We train the model jointly for the recognition and VQA tasks by minimizing the following loss function using Adam [30]:
| (10) |
We observe that values of and relative to can be used to trade-off performance between visual recognition and VQA tasks. For experiments that analyze the effect of transfer from VR to VQA (Sec. 5.2), we set , and . For VQA only and Genome only baselines, we set the corresponding to 1 and others to 0. For experiments dealing with transfer in the other direction (Sec. 5.3), we set , and . The margins used for object and answer losses are . The object and attribute losses are computed for the same set of Visual Genome regions with a batch size of . The answer loss is computed for a batch size of questions sampled from VQA. We use an exponentially decaying learning rate schedule with an initial learning rate of and decay rate of 0.5 every 24000 iterations. Weight decay is used on all trainable variables with a coefficient of . All the variables are Xavier initialized [17].
5 Experiments
Our experiments investigate the extent to which using SVLR as a core representation improves transfer in multitask learning. We first analyze how including the VR task improves VQA (Sec. 5.2, Tab. 1). We find that using SVLR doubles the improvement compared to standard multitask learning, and demonstrate performance well above chance in a zero-shot setup (trained only on VR, applied to VQA). We then analyze improvement to VR due to training with (weakly supervised) VQA (Sec. 5.3, Fig. 5). We find moderate overall improvements (1.2), with the largest improvements for classes that have few VR training examples. We also quantitatively evaluate how well our attention maps correlate with that of humans using data provided by [12] in Table 2. We include results of our VQA system trained with ResNet-152 architecture on val, test-dev, test-std, along with state-of-the-art (Tab. 3).
| Accuracies on Real-MCQ-VQA Validation Set |
what color |
what is the (wo)man/person |
what is in/on |
what kind/ type/animal |
what room/sport |
can/could/ does/do/has |
what does/ number/name |
what brand |
which/who |
what is/are |
why/how |
how many |
what time |
where |
is/are/was |
none of the above |
other |
number |
yes/no |
overall accuracy |
|---|---|---|---|---|---|---|---|---|---|---|---|---|---|---|---|---|---|---|---|---|
| VQA Only | 53.5 | 70.5 | 53.6 | 56.8 | 89.8 | 81.8 | 41.9 | 45.9 | 49.0 | 58.3 | 33.8 | 38.4 | 53.9 | 45.8 | 80.2 | 56.0 | 54.5 | 39.2 | 82.1 | 62.9 |
| Joint Multitask | 59.4 | 71.8 | 54.6 | 58.3 | 91.0 | 81.9 | 43.8 | 46.4 | 50.8 | 59.2 | 32.3 | 39.4 | 53.9 | 47.0 | 80.4 | 57.1 | 56.7 | 39.8 | 82.2 | 64.1 |
| Joint SVLR | 62.1 | 74.1 | 57.9 | 60.0 | 91.1 | 82.8 | 41.6 | 52.9 | 52.0 | 61.1 | 33.6 | 39.0 | 51.3 | 48.6 | 81.4 | 58.5 | 58.8 | 38.8 | 83.0 | 65.3 |
| Zero-Shot VQA | 18.8 | 21.0 | 27.4 | 31.4 | 22.0 | 17.1 | 13.9 | 11.6 | 20.6 | 22.9 | 12.7 | 0.7 | 7.2 | 26.1 | 13.5 | 19.2 | 22.4 | 1.2 | 13.3 | 16.4 |
5.1 Datasets
Our model is trained on two separate datasets: one for VQA supervision, one for visual recognition (attributes and object classification). We use the image-question-answer annotation triplets from Antol et al. [5] and bounding box annotations for object and attribute categories from Visual Genome [31]. The train-val-test splits for the datasets are as follows.
VQA: We split the train set into train-subset and train-held-out and use the latter for model selection. The train-subset consists of 236,277 samples whereas train-held-out contains 12,072 samples. The val and test set contain 121,512 and 244,302 samples respectively. There are exactly 3 questions per image. We use VQA val for evaluating on specific question types.
Visual Genome: We use only images from Visual Genome not in VQA (overlaps identified using md5 hashes). The selected images were divided into train-val-test using an 85-5-10 split, yielding 1,565,280, 90,212 and 181,141 annotated regions in each. We use val for selecting the model for evaluating recognition performance.
5.2 Inductive Transfer from VR to VQA
In Table 1, we analyze the role of SVLR module for inductive transfer in both joint training and zero-shot settings.
Joint Training: During joint training, the VR models and VQA model are simultaneously trained using object and attribute annotations from Genome, and Q/A annotations from the VQA dataset. The common approach to joint training is to use a common network for extracting image features (e.g. class logits from ResNet), which feeds into the task-specific networks as input. We refer to this approach in Table 1 as Joint Multitask. This baseline is implemented by replacing (see Fig. 2), with a fixed set of vectors for each of the predetermined 1000 object and 1000 attribute categories in the VR models. The embedding is still in the VQA model, but is no longer shared across tasks. Our proposed Joint SVLR outperforms VQA-only by , doubling the improvement achieved by Joint Multitask. Our formulation of VR and VQA tasks in terms of shared word-region representations more effectively transfers recognition knowledge from VR than shared features. The gain is often larger on questions that involve recognition (in bold in Table 1). For example, what color questions improve by due to SVLR.
Surprisingly, pre-training the visual classifiers on Genome prior to joint training performs worse than the model trained jointly from scratch: 63.7% versus 65.3%.
Zero-Shot VQA: We evaluate Zero-shot VQA to further highlight transfer from VR to VQA. We train on only Genome VR annotations but test on VQA val. The model has not seen any Q/A training data, but achieves an overall accuracy of where random guessing yields (18 choices). Our zero-shot system does not exploit language priors, which alone can score as high as 54.0 [49]. This shows that some knowledge can be directly applied to related tasks using SVLR without additional training.
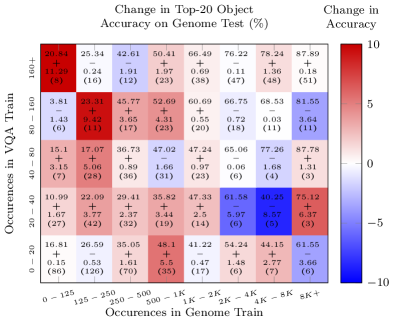
5.3 Inductive Transfer from VQA to VR
We compare the performance of our SVLR based model trained jointly on VQA and VR data with a model trained only on Genome data to analyze transfer from VQA to VR. Genome test is used for evaluation. We observe an increase in the overall object recognition accuracy from 43.3% to 44.5%, whereas average attribute accuracy remained unchanged at 36.9%. In Fig. 5, we show that nouns that are rare in Genome (left columns) but have 20 or more examples in VQA (upper rows) benefit the most from weak supervision provided by VQA. On average, we measure improvement from 21 to 32 for the 8 classes that have fewer than 125 examples in Genome train but occur more than 160 times in VQA questions. We conducted the same analysis on Genome attributes, but did not observe any notable pattern, possibly due to the inherent difficult in evaluating the multi-label attribute classification problem (the absence of attributes is not annotated in Genome).
5.4 Interpretable Inference for VQA
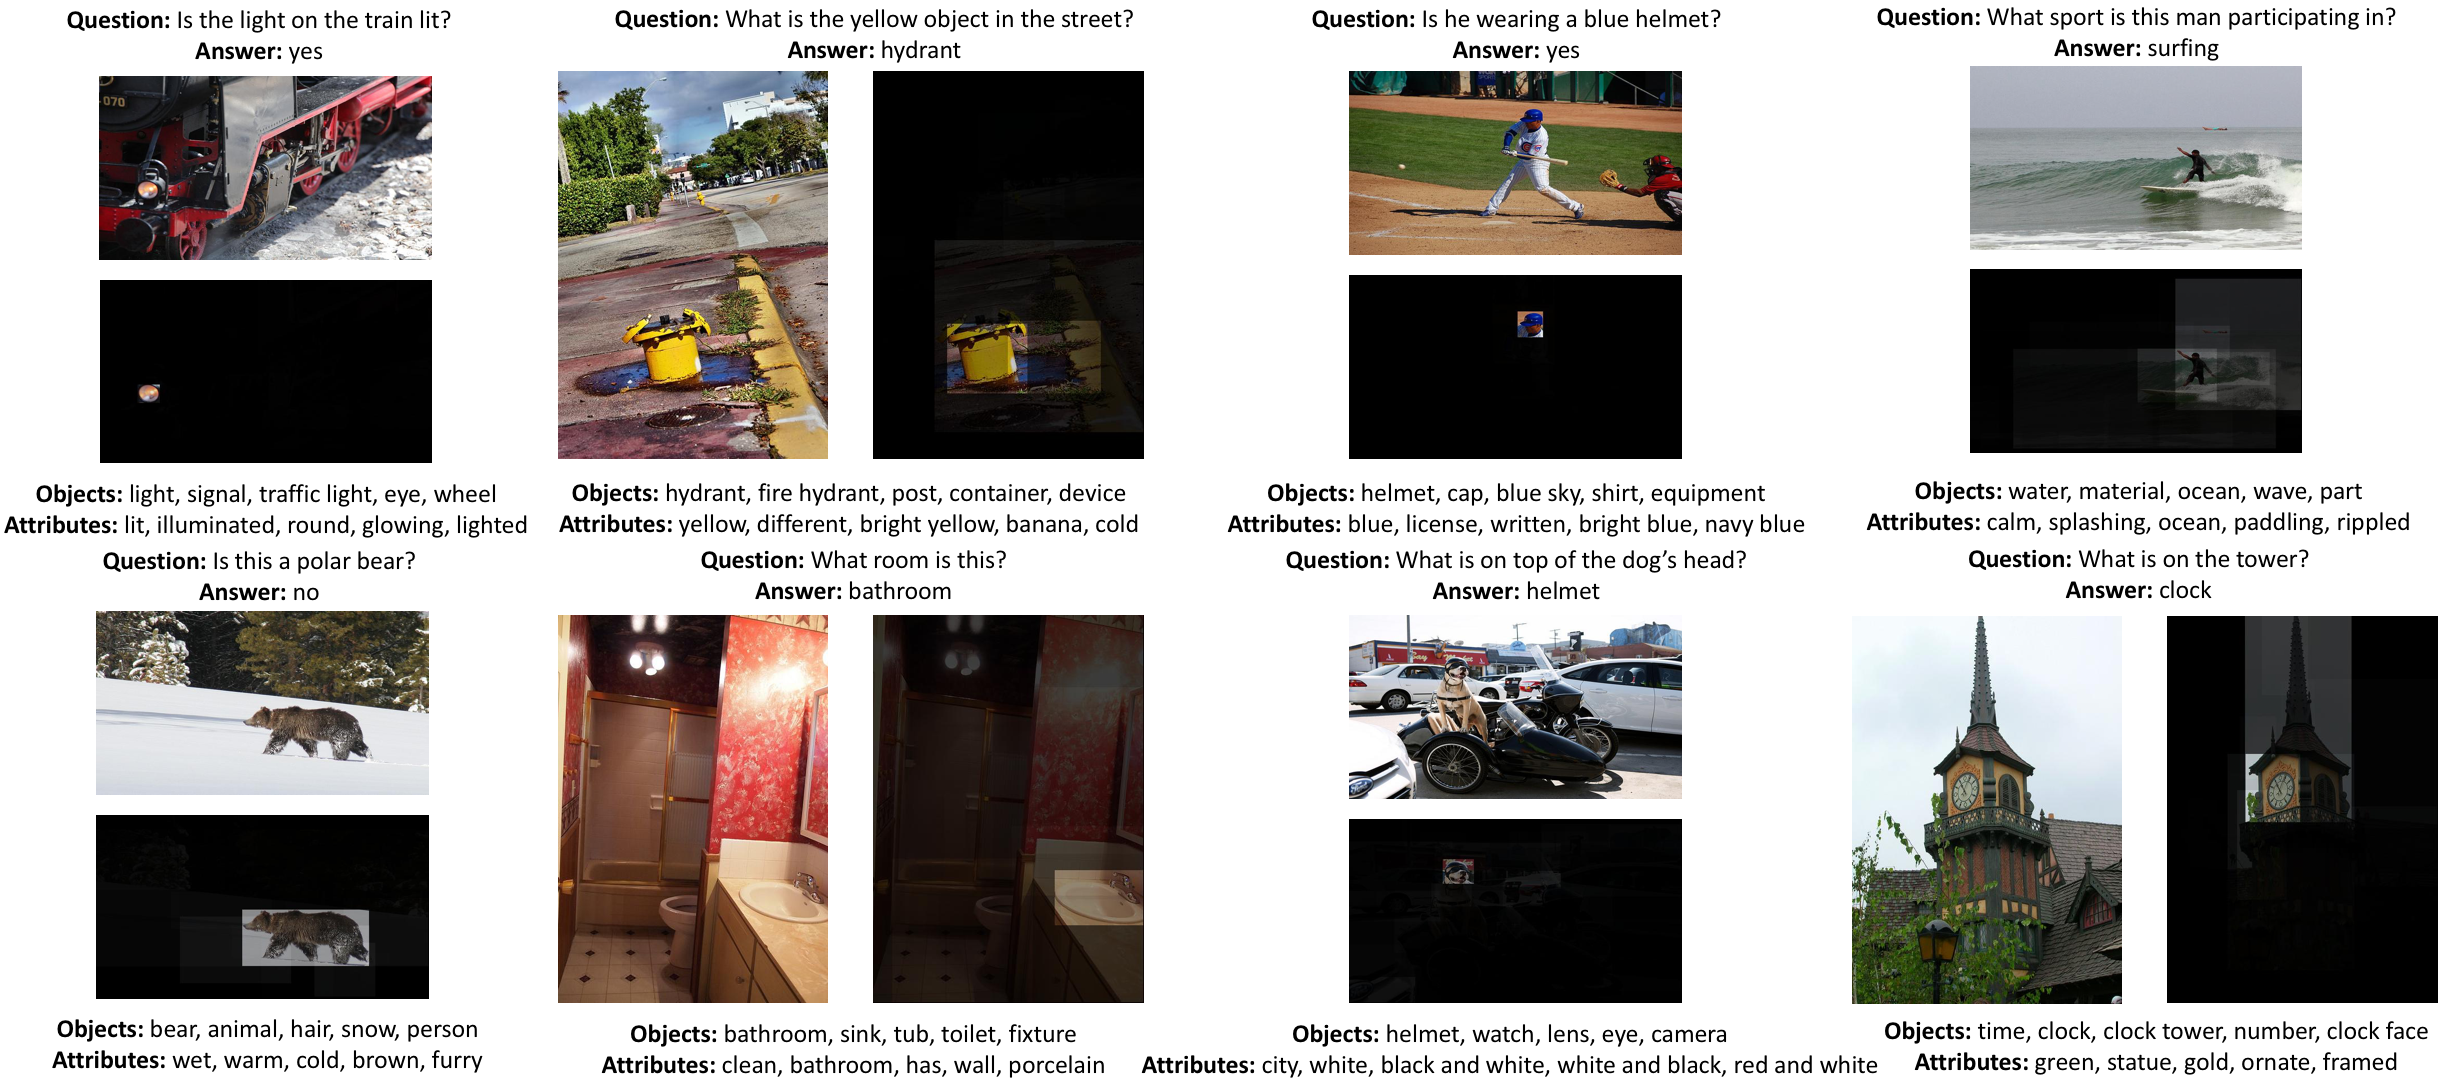
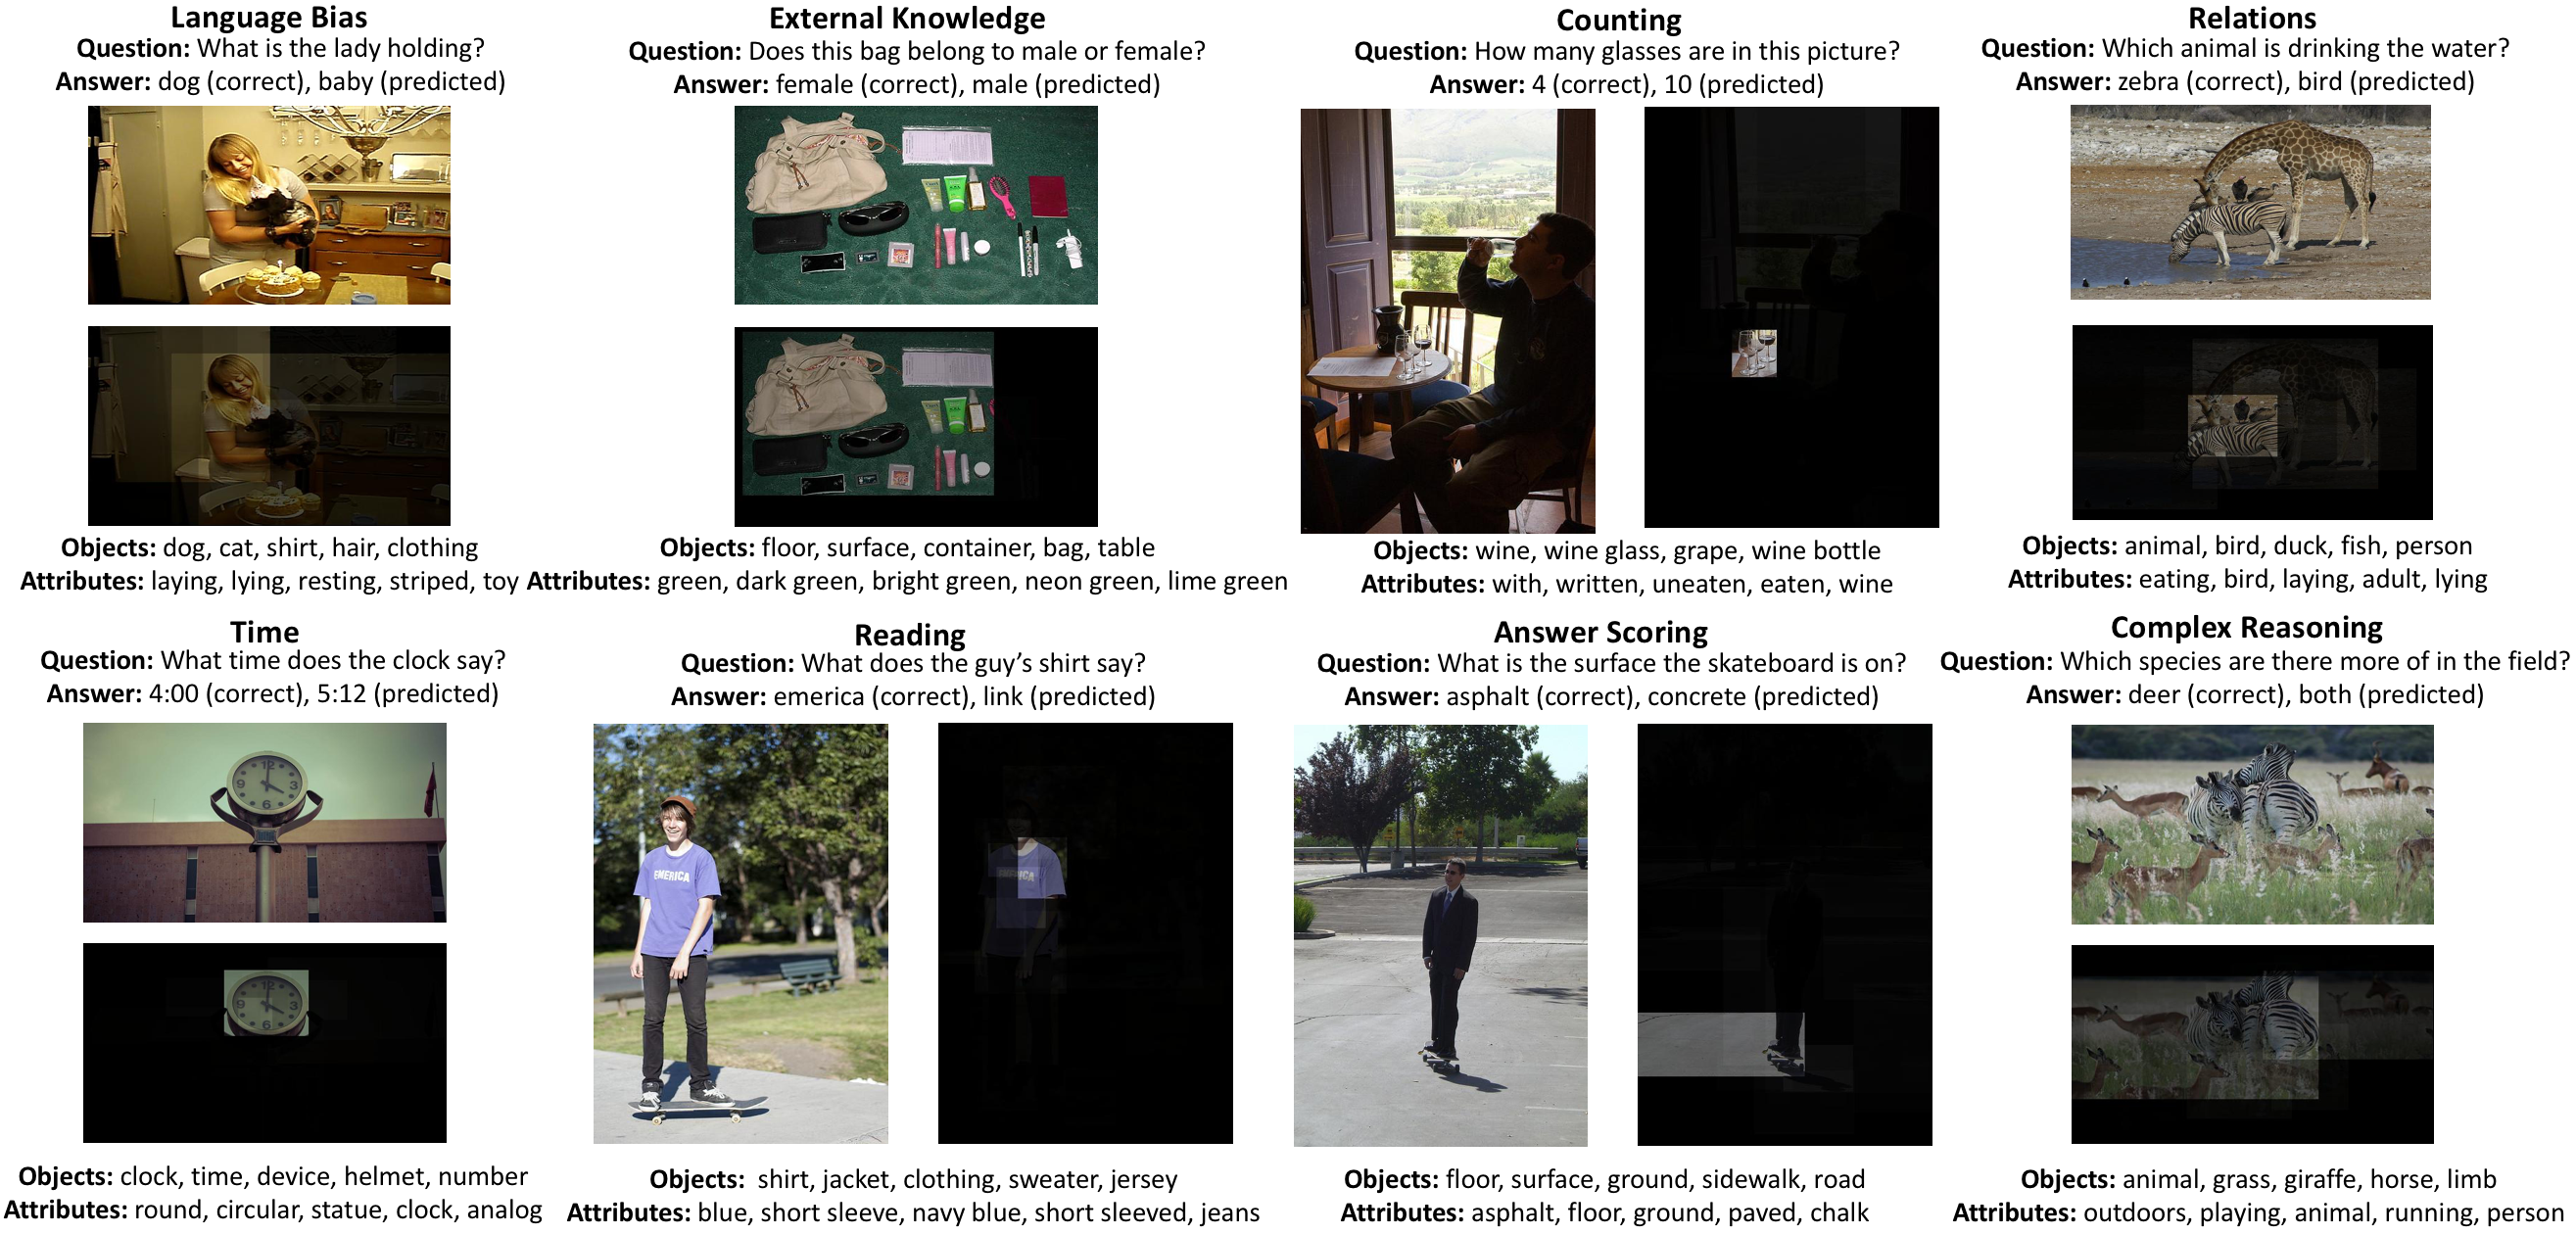
As shown in Fig. 4, our VQA model produces interpretable intermediate outputs such as region relevance and visual category predictions, similar to [54]. The answer choice is explained by the object and attribute predictions associated with the most relevant regions. Because relevance is posed as the explicit localization of words in the question and answer, we can qualitatively evaluate the relevance prediction by verifying that the predicted regions match said words. This also provides greater insight into the failure modes as shown in Fig. 6.
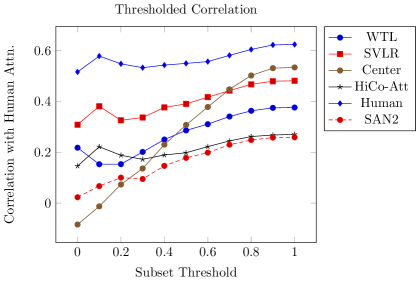
We also quantitatively evaluate our attention using collected human attention maps from Das et al. [12] in Table 2 and in Figure 7. Table 2 includes the correlation scores between the attention maps from various VQA attention models and human attention on a subset of question-answer pairs on the validation set. Our proposed SVLR model significantly outperforms other models we compare with. However, we note that a strong center-focused heatmap baseline still outperforms all models, signifying that the main topic of a question is very often located in the center of the image. As such, we also evaluate correlations on multiple subsets of the human attention maps is Figure 7, thresholding them based on correlation with the center heatmap. We note that learned attention models appear to have better correlation with human attention at lower thresholds where the human attention correlates poorly with the center-focused heatmap – a result also demonstrated in [12].
| HiCo[37] | SAN2[59] | WTL[49] | SVLR | Center | Human | |
| Corr. | 0.27 | 0.26 | 0.38 | 0.48 | 0.53 | 0.62 |
5.5 Learned Word Representations
In Table 4, we compare the word representations of the SVLR model to that of Word2Vec [41] by showing several nearest neighbors from both embeddings. We observe a shift from non-visual neighborhoods and meanings (monitor, control) to visual ones (monitor, keyboard). Neighbors were computed using cosine distance after mean centering.
| WTL[49] | FDA[24] | MLP[38, 26] | MCB[16] | HiCo[37] | Ours | |
| val | 58.9 | - | 63.6 | - | - | 66.2 |
| test-dev | 62.4 | 64.0 | 65.9 | 69.9 | 65.8 | 64.8 |
| test-std | 63.5 | 64.2 | - | - | 66.1 | 64.8 |
| Trained on | train+val | - | train | train+val | train+val | train |
| Word | Word2Vec | SVLR |
|---|---|---|
| column | newspaper, magazine, book, letter | pillar, post, pole, tower, chimney |
| counter | curb, stem, foil, stop, dispenser | shelf, stove, countertop, burner |
| horn | piano, guitar, brass, pedal | tail, harness, tag, paw |
| meat | chicken, lamb, food, uncooked | rice, scrambled, piled, slice |
| monitor | watch, control, checked, alert | keyboard, computer, portable |
6 Conclusion
Humans learn new skills by building upon existing knowledge and experiences. We attempt to apply this behavior to AI models by demonstrating cross-task learning for the class of vision-language problems using VQA and VR. To enhance inductive transfer, we propose sharing core vision and language representations across all tasks in a way that exploits the word-region alignment. We plan to extend our method to larger sets of vision-language tasks.
7 Acknowledgements
This work is supported in part by NSF Awards 14-46765 and 10-53768 and ONR MURI N000014-16-1-2007.
References
- [1] M. Abadi, A. Agarwal, P. Barham, E. Brevdo, Z. Chen, C. Citro, G. S. Corrado, A. Davis, J. Dean, M. Devin, S. Ghemawat, I. Goodfellow, A. Harp, G. Irving, M. Isard, Y. Jia, R. Jozefowicz, L. Kaiser, M. Kudlur, J. Levenberg, D. Mané, R. Monga, S. Moore, D. Murray, C. Olah, M. Schuster, J. Shlens, B. Steiner, I. Sutskever, K. Talwar, P. Tucker, V. Vanhoucke, V. Vasudevan, F. Viégas, O. Vinyals, P. Warden, M. Wattenberg, M. Wicke, Y. Yu, and X. Zheng. TensorFlow: Large-scale machine learning on heterogeneous systems, 2015. Software available from tensorflow.org.
- [2] A. Agrawal, D. Batra, and D. Parikh. Analyzing the behavior of visual question answering models. arXiv preprint arXiv:1606.07356, 2016.
- [3] J. Andreas, M. Rohrbach, T. Darrell, and D. Klein. Learning to compose neural networks for question answering. arXiv preprint arXiv:1601.01705, 2016.
- [4] J. Andreas, M. Rohrbach, T. Darrell, and D. Klein. Neural module networks. In Proceedings of the IEEE Conference on Computer Vision and Pattern Recognition, pages 39–48, 2016.
- [5] S. Antol, A. Agrawal, J. Lu, M. Mitchell, D. Batra, C. Lawrence Zitnick, and D. Parikh. Vqa: Visual question answering. In Proceedings of the IEEE International Conference on Computer Vision, pages 2425–2433, 2015.
- [6] D. Bahdanau, K. Cho, and Y. Bengio. Neural machine translation by jointly learning to align and translate. arXiv preprint arXiv:1409.0473, 2014.
- [7] Y. Bengio, A. Courville, and P. Vincent. Representation learning: A review and new perspectives. IEEE transactions on pattern analysis and machine intelligence, 35(8):1798–1828, 2013.
- [8] S. Bird, E. Klein, and E. Loper. Natural language processing with Python. ” O’Reilly Media, Inc.”, 2009.
- [9] A. Carlson, J. Betteridge, B. Kisiel, B. Settles, E. R. Hruschka Jr, and T. M. Mitchell. Toward an architecture for never-ending language learning. In AAAI, volume 5, page 3, 2010.
- [10] R. Caruana. Multitask learning. In Learning to learn, pages 95–133. Springer, 1998.
- [11] X. Chen, A. Shrivastava, and A. Gupta. Neil: Extracting visual knowledge from web data. In Proceedings of the IEEE International Conference on Computer Vision, pages 1409–1416, 2013.
- [12] A. Das, H. Agrawal, C. L. Zitnick, D. Parikh, and D. Batra. Human attention in visual question answering: Do humans and deep networks look at the same regions? In Conference on Empirical Methods in Natural Language Processing, 2016.
- [13] M.-C. De Marneffe, B. MacCartney, C. D. Manning, et al. Generating typed dependency parses from phrase structure parses. In Proceedings of LREC, volume 6, pages 449–454, 2006.
- [14] J. Deng, W. Dong, R. Socher, L.-J. Li, K. Li, and L. Fei-Fei. Imagenet: A large-scale hierarchical image database. In Computer Vision and Pattern Recognition, 2009. CVPR 2009. IEEE Conference on, pages 248–255. IEEE, 2009.
- [15] H. Fang, S. Gupta, F. Iandola, R. K. Srivastava, L. Deng, P. Dollár, J. Gao, X. He, M. Mitchell, J. C. Platt, et al. From captions to visual concepts and back. In Proceedings of the IEEE Conference on Computer Vision and Pattern Recognition, pages 1473–1482, 2015.
- [16] A. Fukui, D. H. Park, D. Yang, A. Rohrbach, T. Darrell, and M. Rohrbach. Multimodal compact bilinear pooling for visual question answering and visual grounding. arXiv preprint arXiv:1606.01847, 2016.
- [17] X. Glorot and Y. Bengio. Understanding the difficulty of training deep feedforward neural networks. In Aistats, volume 9, pages 249–256, 2010.
- [18] Y. Gong, L. Wang, M. Hodosh, J. Hockenmaier, and S. Lazebnik. Improving image-sentence embeddings using large weakly annotated photo collections. In European Conference on Computer Vision, pages 529–545. Springer International Publishing, 2014.
- [19] Y. Goyal, T. Khot, D. Summers-Stay, D. Batra, and D. Parikh. Making the v in vqa matter: Elevating the role of image understanding in visual question answering. arXiv preprint arXiv:1612.00837, 2016.
- [20] A. Graves, G. Wayne, and I. Danihelka. Neural turing machines. arXiv preprint arXiv:1410.5401, 2014.
- [21] K. He, X. Zhang, S. Ren, and J. Sun. Deep residual learning for image recognition. arXiv preprint arXiv:1512.03385, 2015.
- [22] K. M. Hermann, T. Kocisky, E. Grefenstette, L. Espeholt, W. Kay, M. Suleyman, and P. Blunsom. Teaching machines to read and comprehend. In Advances in Neural Information Processing Systems, pages 1693–1701, 2015.
- [23] M. Hodosh, P. Young, and J. Hockenmaier. Framing image description as a ranking task: Data, models and evaluation metrics. Journal of Artificial Intelligence Research, 47:853–899, 2013.
- [24] I. Ilievski, S. Yan, and J. Feng. A focused dynamic attention model for visual question answering. arXiv preprint arXiv:1604.01485, 2016.
- [25] S. Ioffe and C. Szegedy. Batch normalization: Accelerating deep network training by reducing internal covariate shift. arXiv preprint arXiv:1502.03167, 2015.
- [26] A. Jabri, A. Joulin, and L. van der Maaten. Revisiting visual question answering baselines. In European Conference on Computer Vision, pages 727–739. Springer, 2016.
- [27] M. Jaderberg, K. Simonyan, A. Zisserman, et al. Spatial transformer networks. In Advances in Neural Information Processing Systems, pages 2017–2025, 2015.
- [28] J. Johnson, A. Karpathy, and L. Fei-Fei. Densecap: Fully convolutional localization networks for dense captioning. arXiv preprint arXiv:1511.07571, 2015.
- [29] S. Kazemzadeh, V. Ordonez, M. Matten, and T. L. Berg. Referit game: Referring to objects in photographs of natural scenes. In EMNLP, 2014.
- [30] D. Kingma and J. Ba. Adam: A method for stochastic optimization. arXiv preprint arXiv:1412.6980, 2014.
- [31] R. Krishna, Y. Zhu, O. Groth, J. Johnson, K. Hata, J. Kravitz, S. Chen, Y. Kalantidis, L.-J. Li, D. A. Shamma, et al. Visual genome: Connecting language and vision using crowdsourced dense image annotations. arXiv preprint arXiv:1602.07332, 2016.
- [32] A. Krizhevsky, I. Sutskever, and G. E. Hinton. Imagenet classification with deep convolutional neural networks. In Advances in neural information processing systems, pages 1097–1105, 2012.
- [33] A. Kumar, O. Irsoy, J. Su, J. Bradbury, R. English, B. Pierce, P. Ondruska, I. Gulrajani, and R. Socher. Ask me anything: Dynamic memory networks for natural language processing. arXiv preprint arXiv:1506.07285, 2015.
- [34] Z. Li and D. Hoiem. Learning without forgetting. In European Conference on Computer Vision, pages 614–629. Springer, 2016.
- [35] T.-Y. Lin, M. Maire, S. Belongie, J. Hays, P. Perona, D. Ramanan, P. Dollár, and C. L. Zitnick. Microsoft coco: Common objects in context. In European Conference on Computer Vision, pages 740–755. Springer, 2014.
- [36] C. Liu, J. Mao, F. Sha, and A. Yuille. Attention correctness in neural image captioning. arXiv preprint arXiv:1605.09553, 2016.
- [37] J. Lu, J. Yang, D. Batra, and D. Parikh. Hierarchical question-image co-attention for visual question answering. arXiv preprint arXiv:1606.00061, 2016.
- [38] A. Mallya. simple-vqa: Code implementing VQA MLP baseline from Revisiting Visual Question Answering Baselines. https://github.com/arunmallya/simple-vqa, 2016. [Online; accessed 14-Nov-2016].
- [39] J. Mao, J. Huang, A. Toshev, O. Camburu, and K. Murphy. Generation and comprehension of unambiguous object descriptions. In Computer Vision and Pattern Recognition, 2016.
- [40] T. Mikolov, K. Chen, G. Corrado, and J. Dean. Efficient estimation of word representations in vector space. arXiv preprint arXiv:1301.3781, 2013.
- [41] T. Mikolov, I. Sutskever, K. Chen, G. S. Corrado, and J. Dean. Distributed representations of words and phrases and their compositionality. In Advances in neural information processing systems, 2013.
- [42] G. A. Miller. Wordnet: a lexical database for english. Communications of the ACM, 38(11):39–41, 1995.
- [43] T. Mitchell. Never-ending learning. Technical report, DTIC Document, 2010.
- [44] V. Mnih, N. Heess, A. Graves, et al. Recurrent models of visual attention. In Advances in Neural Information Processing Systems, pages 2204–2212, 2014.
- [45] A. Pentina, V. Sharmanska, and C. H. Lampert. Curriculum learning of multiple tasks. In Proceedings of the IEEE Conference on Computer Vision and Pattern Recognition, pages 5492–5500, 2015.
- [46] B. A. Plummer, L. Wang, C. M. Cervantes, J. C. Caicedo, J. Hockenmaier, and S. Lazebnik. Flickr30k entities: Collecting region-to-phrase correspondences for richer image-to-sentence models. In Proceedings of the IEEE International Conference on Computer Vision, pages 2641–2649, 2015.
- [47] M. Ren, R. Kiros, and R. S. Zemel. Exploring models and data for image question answering. In Proceedings of the 28th International Conference on Neural Information Processing Systems, NIPS’15, pages 2953–2961, Cambridge, MA, USA, 2015. MIT Press.
- [48] A. Rohrbach, M. Rohrbach, R. Hu, T. Darrell, and B. Schiele. Grounding of textual phrases in images by reconstruction. In European Conference on Computer Vision (ECCV), 2016.
- [49] K. J. Shih, S. Singh, and D. Hoiem. Where to look: Focus regions for visual question answering. In Proceedings of the IEEE Conference on Computer Vision and Pattern Recognition, 2016.
- [50] D. L. Silver, Q. Yang, and L. Li. Lifelong machine learning systems: Beyond learning algorithms. In AAAI Spring Symposium: Lifelong Machine Learning, pages 49–55. Citeseer, 2013.
- [51] K. Simonyan and A. Zisserman. Very deep convolutional networks for large-scale image recognition. arXiv preprint arXiv:1409.1556, 2014.
- [52] S. Sukhbaatar, J. Weston, R. Fergus, et al. End-to-end memory networks. In Advances in neural information processing systems, pages 2440–2448, 2015.
- [53] S. Thrun. Lifelong learning algorithms. In Learning to learn, pages 181–209. Springer, 1998.
- [54] T. Tommasi, A. Mallya, B. Plummer, S. Lazebnik, A. C. Berg, and T. L. Berg. Solving visual madlibs with multiple cues. In Proceedings of the British Machine Vision Conference 2016, 2016.
- [55] L. Wang, Y. Li, and S. Lazebnik. Learning deep structure-preserving image-text embeddings. In Computer Vision and Pattern Recognition, 2016.
- [56] J. Weston, S. Chopra, and A. Bordes. Memory networks. arXiv preprint arXiv:1410.3916, 2014.
- [57] Y. Wu, M. Schuster, Z. Chen, Q. V. Le, M. Norouzi, W. Macherey, M. Krikun, Y. Cao, Q. Gao, K. Macherey, et al. Google’s neural machine translation system: Bridging the gap between human and machine translation. arXiv preprint arXiv:1609.08144, 2016.
- [58] H. Xu and K. Saenko. Ask, attend and answer: Exploring question-guided spatial attention for visual question answering. In European Conference on Computer Vision (ECCV), 2016.
- [59] Z. Yang, X. He, J. Gao, L. Deng, and A. Smola. Stacked attention networks for image question answering. arXiv preprint arXiv:1511.02274, 2015.
- [60] L. Yu, E. Park, A. C. Berg, and T. L. Berg. Visual madlibs: Fill in the blank description generation and question answering. In Proceedings of the IEEE International Conference on Computer Vision, pages 2461–2469, 2015.
- [61] C. L. Zitnick and P. Dollár. Edge boxes: Locating object proposals from edges. In European Conference on Computer Vision, pages 391–405. Springer, 2014.