Who Makes Trends?
Understanding Demographic Biases in Crowdsourced Recommendations
Abstract
Users of social media sites like Facebook and Twitter rely on crowdsourced content recommendation systems (e.g., Trending Topics) to retrieve important and useful information. Contents selected for recommendation indirectly give the initial users who promoted (by liking or posting) the content an opportunity to propagate their messages to a wider audience. Hence, it is important to understand the demographics of people who make a content worthy of recommendation, and explore whether they are representative of the media site’s overall population. In this work, using extensive data collected from Twitter, we make the first attempt to quantify and explore the demographic biases in the crowdsourced recommendations. Our analysis, focusing on the selection of trending topics, finds that a large fraction of trends are promoted by crowds whose demographics are significantly different from the overall Twitter population. More worryingly, we find that certain demographic groups are systematically under-represented among the promoters of the trending topics. To make the demographic biases in Twitter trends more transparent, we developed and deployed a Web-based service ‘Who-Makes-Trends’ at twitter-app.mpi-sws.org/who-makes-trends.
Introduction
Social media sites like Facebook and Twitter have emerged as popular destinations for users to get real-time news about the world around them. In these sites, users are increasingly relying on crowdsourced recommendations called Trending Topics to find important events and breaking news stories. Typically topics, including key-phrases and keywords (e.g., hashtags), are recommended as trending when they exhibit a sharp spike in their popularity, i.e., their usage by the crowds suddenly jump at a particular time (?). Once a topic is selected as trending, it gets prominently displayed on the social media homepages, thus reaching a large user population. Additionally, traditional news organizations often pick the trending topics and cover them in their news stories (a practice termed as Hashtag journalism (?)), further amplifying their reach. Recognizing their importance, researchers have started arguing whether trending topics have become a part of our societal culture (?).
A large number of prior works on trending topics have focused on what the trends are (e.g., classifying the trends into different categories (?)), or how the trends are selected (e.g., proposing new algorithms to identify trends from the content stream (?)). Complementary to the earlier works, our focus in this paper is on the users who make different topics worthy of being recommended as trending. Specifically, we attempt to analyze the demographics of crowds promoting different topics on the social media sites. By promoters of a topic, we refer to the users who posted on the topic before it became trending, thereby contributing to the topic’s selection as a trend.
In this paper, our focus is on the biases in the demographics of the promoters of different trends, i.e., we investigate whether the distribution of trend promoters across different socially salient groups are representative of the media site’s overall user population. As users belonging to different demographic groups (such as middle-aged white men, young asian women, adolescent black men) might be interested in posting about different topics, the demographics of a topic’s promoters can be quite different from the site’s user population. Our goal here is to study the demographic biases of trends, i.e., we quantify and analyze the divergence between the demographics of the promoters of trends and the site’s overall population.
Towards this end, we gathered extensive data from the popular social media site Twitter over a period of 3 months from July, 2016 to September, 2016. Our data included over five thousand trending topics recommended to Twitter users in the United States, and millions of users posting on the topics, both before and after the topics became trending. We inferred three demographic attributes for these Twitter users namely, their gender, race, and age. We performed a detailed analysis on these users, and our analysis offers several interesting insights:
(a) We find that a large fraction of trending topics are promoted by crowds whose demographics are significantly different from Twitter’s overall user population.
(b) We find clear evidence of under-representation of certain demographic groups (female, black, mid-aged) among the promoters of the trending topics, with mid-aged-black-females being the most under-represented group.
(c) We discover that once a topic becomes trending, it is adopted (i.e., posted) by users whose demographics are less divergent from the overall Twitter population, compared to the users who were promoting the topic before it became trending. Our finding alludes to the influence and importance of trending topic selection on making users aware of specific topics.
(d) We observe that topics promoted predominantly by a single demographic group tend to be of niche interest to that particular group. However, during events of wider interest (e.g., national elections, police shootings), the topics promoted by different demographic groups tend to reflect their diverse perspectives, which could help understand the different facets of public opinion.
Our findings make the case for making the demographic biases of Twitter trend recommendations transparent. Therefore, we developed and deployed a system ‘Who-Makes-Trends’111twitter-app.mpi-sws.org/who-makes-trends, where for any trend in the US, one can check the demographics of the promoters of that trend. We further note that our analysis framework and findings about demographic biases can be extended to other social media algorithms such as social search or social influence estimation.
More broadly, our work offers a new perspective to the growing debate about fairness, bias, and transparency of decisions taken by algorithms operating over big crowdsourced data (?; ?; ?). Similar to the work by Kulshrestha et al. (?), it highlights the need to understand the characteristics and biases in the inputs to the algorithms (e.g., the group of users promoting specific trending topics), in addition to studying the algorithms (e.g., selection of trending topics), and their outputs.
Related Work
We briefly survey related efforts in the following three axes. First, we discuss efforts that explore social media demographics. Then, we point to the studies focusing on Twitter trends. Finally, we survey a few approaches for providing transparency to algorithms and systems.
Social Media Demographics: Recently, there has been a growing interest for demographic aspects of social media data. Mislove et al (?) provided one of the first studies in this space, by looking at the gender and racial demographics of Twitter users, and analyzing how the demographics vary across different US states. Pew research (?) conducted user surveys to understand the demographics of users in different social media platforms. There have also been past attempts to understand the use of social media among particular demographic groups. For example, Madden et al. (?) explored how teenagers use different social media sites. Gilbert et al. (?) analyzed social media use among rural users. In another research direction, many efforts attempt to quantify inequalities in social media systems, including Wikipedia (?), Pinterest (?), and Twitter (?). However, to the best of our knowledge, we are not aware of any effort that approached the demographics behind crowdsourced recommendations deployed in social media sites. Thus, our endeavor is complementary to the above mentioned approaches.
Twitter Trends Analysis: Many prior works have focused on Twitter Trending Topics. For example, Zubiaga et al. presented an approach to automatically categorize trending topics (?). Lee et al. characterized how spammers can exploit trending topics (?). Benhardus et al. (?) proposed alternative algorithms for detecting trending topics. Our prior work (?) identified temporal coverage biases in the selection of trending stories.
Most of the existing efforts on this space have focused on the outputs (results) from the trending topics selection algorithms. Thus, our work offers a novel and complementary angle as we focus on the input to the Twitter trend selection algorithms. To the best of our knowledge, there has been no prior attempt to analyze the demographic distribution of the crowd who make a particular topic trending.
Algorithmic and Data Transparency: Increasingly, researchers and governments are recognizing the importance of making algorithms transparent. The White House recently released a report that concludes that the practitioners must ensure that AI-enabled systems are open, transparent, and understandable (?). Indeed, the controversy around Facebook using human editors on their trending topics teaches a lesson about the importance of transparency. On one hand, when humans were editing trending topics, they were accused to select and filter content (?). On the other hand, when humans were removed from the process, Facebook was accused of featuring fake news as trending (?).
Our present effort contributes to make the demographic biases of Twitter trend recommendations transparent, and we hope that the methodology to compute demographic distribution of users can be leveraged to make other crowdsourced systems (e.g., social search (?)) transparent as well. More importantly, for algorithms that operate on large-scale crowdsourced data, we show that along with making the outputs of the algorithms (and the algorithm itself) transparent, it is also important to understand the non-uniformities in the inputs to the algorithms.
Methodology and Dataset
In this section, we first describe the dataset gathered, then the method to infer demographic information of individual Twitter users.
Twitter dataset gathered
For this work, we gathered the random sample of all tweets,
through the Twitter Streaming API222dev.twitter.com/streaming/public,
along a -month period, from July to September, 2016. Simultaneously and along the same period,
by querying the Twitter REST API333dev.twitter.com/rest/reference/get/trends/place
at every -minutes, we collected all topics which became trending in US.
In total, we collected more than million tweets posted by around million users. During these three months, topics became trending, out of which () trends were hashtags and the rest were multi-word phrases. For simplicity, we restrict our focus on trending hashtags, and leave the analysis of trending phrases as future work.
Inferring demographics of Twitter users
While conducting traditional user interviews,
social survey agencies like Pew Research
typically ask the respondents different aspects of user
demographics, including the gender, race, age group, location,
educational qualification, or the annual income of the users.
To collect Twitter users’ demographic information at scale,
we can only use publicly available information about a user,
such as her name, profile description, location, profile image,
and the tweets she posted. Due to this limitation, in this work, we consider three aspects of
user demographics – gender, race, and age group, and we restrict our analysis on users
whose location could be identified as within US.
Past works have attempted to infer a particular user’s gender and race from her name (?; ?; ?), or the age from Twitter profile description (by searching for patterns like ‘21 yr old’ or ‘born in 1989’) (?). However, Liu et al. (?) reported that users in their dataset did not have a proper name and hence their gender could not be inferred. Similarly, to infer the age from the profile descriptions, we could find age related patterns for only of the users in our dataset. To circumvent the difficulties in inferring the demographic information from users’ profile names and descriptions, we use the profile pictures of the users to get their demographic information. Specifically, we use Face++ (faceplusplus.com), a face recognition platform based on deep learning (?), to extract the gender, race, and age information from the recognized faces in the profile images of all US based users in our dataset.
We observed four issues with using the profile images for inferring demographics: (i) some users may have Twitter’s default profile picture, while others have customized profile images, (ii) a profile image may not have any recognizable face, (iii) multiple faces can be present in an image (e.g., group photo), and (iv) some users may change their profile pictures between the time the tweets are collected and the time at which the demographic inference is attempted. To address the first issue, we check the URLs of the profile images and discard the users having default profile pictures. For issues (ii) and (iii), we check the output of Face++, and users whose profile images contain zero or more than one faces are discarded. Finally, when users change their picture, the corresponding URL changes as well, making it impossible for us to gather demographic information for such users; hence we ignore such users. In our dataset, we have around million US based users with valid profile image URLs. After performing the filtering steps discussed above, we consider the demographic information, as returned by Face++, for around million users.
Possible values of the demographic attributes
Face++ returns the values Male or Female for the gender,
White, Black, or Asian for the race,
and a numerical value corresponding to the estimated age of the recognized face in the profile image.
In this work, we use the values of gender and race as returned by Face++. To form the age groups, we bucketize the age values according to the seminal work by Erikson (?), where he proposed eight stages of psychosocial development in human life-cycle. Discarding the first four childhood stages, we use the remaining four stages of adulthood as the age groups in this work. Specifically, we use the following four age groups: (i) Adolescent (13 – 19 years), (ii) Young (‘Early adulthood’ in Erikson’s parlance) (20 – 39 years), (iii) Mid-aged (‘Adulthood’) (40 – 64 years), and (iv) Old (‘Maturity’) (65 years and above).
Evaluating the demographic inference by Face++
Along with the inferred demographic information, Face++ returns confidence levels for inferred gender and race,
and an error range for inferred age. The average confidence levels reported by Face++ for our data
were for gender and for race inference, respectively.
The average error range reported for age inference was years.
To further evaluate the effectiveness of the inference made by Face++, we asked volunteers to label randomly selected profile images from our dataset. We measured the inter-annotator agreement in terms of the Fleiss’ score. For gender labeling, score was denoting complete agreement, was for race, and regarding labeling age group, was , implying that inferring the exact age group is tough even by humans. It is especially difficult for users having age bordering two age groups.
Comparing the labels made by majority of the human annotators, and the ones inferred by Face++, we find that the accuracy of gender inference is , while the accuracy for race is . If we take the absolute age returned by Face++ (without the error range), age group is correct in cases. However, if we consider the error range, especially in the border of two age groups, the accuracy of the age inference shoots up to , considering either age group to be correct in such cases. Separately, there have been some recent attempts to use Face++ for inferring the gender and age of Twitter users (?; ?). We note that the results found in our evaluation are comparable with their observations.
Limitations
Inferring the age, race, and gender from the profile images
are challenging tasks, and we are limited by the accuracy of Face++ in the inference.
However, as the performance of deep learning systems continue to
improve, the inferred demographic attributes should become more accurate.
The other limitation of using Face++ is that it reports the race of the users but
not the ethnicity (e.g., Hispanic). In future work, we aim to explore
alternative approaches to overcome this limitation.
Analysis
For a trending topic on Twitter, we define the promoters of the trend as the users who have tweeted that topic before the topic actually became trending. Therefore, promoters are the users who make different topics worthy of being recommended by Twitter as trending. In this section, we attempt to analyze the promoters of different trends.
Specifically, our focus is on the demographics of the promoters of different trending topics on Twitter. For each topic, we compute the demographics of the promoters as a vector where each entry corresponds to the fraction of the promoters belonging to different demographic groups (such as middle-aged white men, young asian women, adolescent black men). Such demographic groups can be considered either using a single demographic attribute (e.g., only gender, race, or age) or a combination of multiple attributes (e.g., gender and race). Before analyzing the demographics of the promoters of different trends, we first look at the demographics of all active Twitter users in US.
Demographics of the user population on Twitter
Using the demographic information of around million US based Twitter users, as obtained from Face++, we compute the overall demographics of such users. Table 1 shows the distribution of gender, race, and age groups among the US based users. We can see in Table 1 that more women than men, more Whites, and more young people are present in Twitter. Considering the race and gender together, of users in Twitter are white men, are white women, are black men, are black women, are asian men, and users are asian women.
To compare the demographics of Twitter users with the demographics of the offline population, we collect the demographics of US residents from the U.S. Census Bureau444census.gov/population/age/data/2012comp.html 555census.gov/prod/cen2010/briefs/c2010br-02.pdf and present in Table 1. We see that some demographic groups are present a lot more in Twitter compared to their share of US population. For example, the presence of Asians in Twitter is about 4 times more than in the overall US population. Similarly, the adolescent and young people are present significantly more in Twitter. On the contrary, mid-aged and old population have comparatively much less presence in Twitter. Our findings corroborate with a recent survey on social media population conducted by Pew Research666pewinternet.org/2016/11/11/social-media-update-2016.
| Baseline | Gender | Race | Age Group | ||||||
|---|---|---|---|---|---|---|---|---|---|
| % Male | % Female | % White | % Black | % Asian | % Adolescent | % Young | % Mid-aged | % Old | |
| US Population | 49.2 | 50.8 | 72.4 | 12.6 | 4.8 | 13.6 | 26.7 | 33.2 | 13.5 |
| Twitter Population | 46.9 | 53.1 | 67.9 | 13.7 | 18.3 | 29.3 | 61.2 | 9.3 | 0.2 |
Demographics of the promoters of Twitter trends
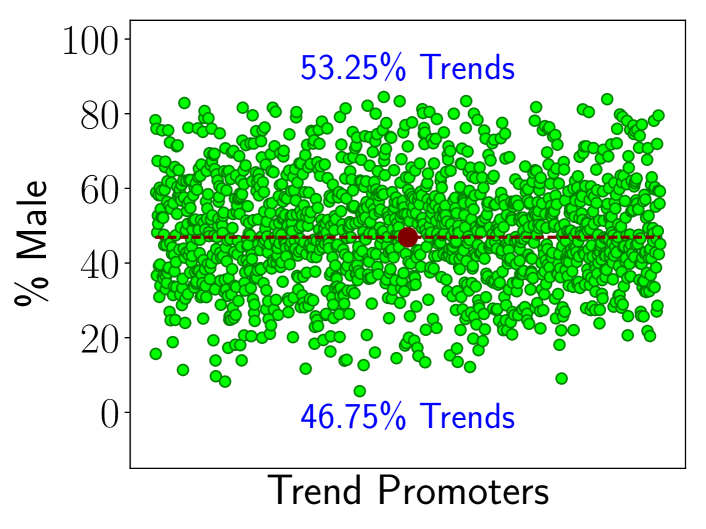
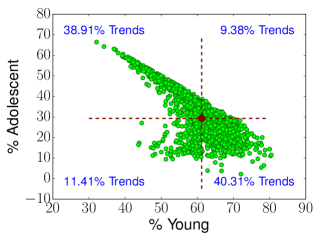
After computing the demographics of the Twitter population in US, we now investigate the demographics of the promoters of different trending topics. For our analysis, we only consider trends from our dataset, where we have the demographic information of at least of their promoters. We compute the distribution of genders, races and age-groups among the promoters of these trends. Figure 1, Figure 2 and Figure 3 respectively show the scatter plots of gender distribution, racial distribution, and distribution of age-groups among the trend promoters.
The figures reveal that the trending topics in Twitter are promoted by users of varied demographics. For example, we can see in Figure 1 that there are a number of trends where men dominate the group of promoters. However, there are also trends which are promoted mostly by women.
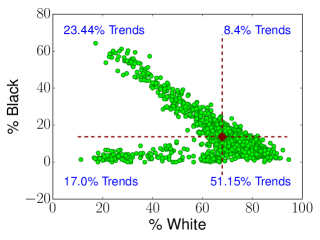
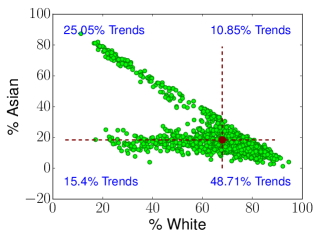
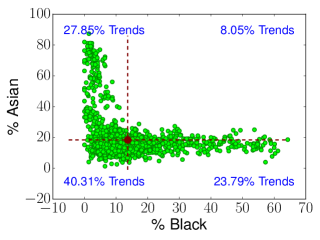
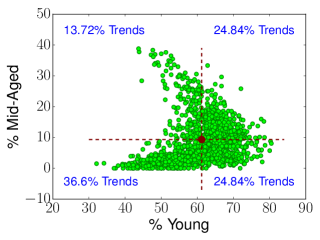
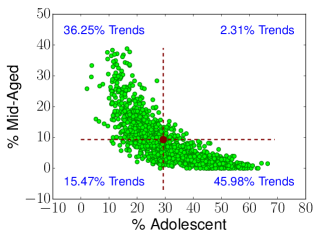
We can make similar observations from the racial distribution of promoters in Figures 2(a), 2(b), and 2(c), as well as from the distribution of age-groups in Figures 3(a), 3(b), and 3(c). In these figures, the scatter plots tend to form triangles, where the boundaries (or edges) of the triangles represent extreme trends where users from a particular demographic group (e.g., Blacks or Mid-aged people) are not at all present among the promoters.
| Demographic Attribute | Gender | Race | Age | Gender & Race | Gender & Age | Race & Age | Gender, Race & Age |
| % of Trends | 61.23 | 80.19 | 76.54 | 82.44 | 83.07 | 83.91 | 88.25 |
Divergence of trend promoters from overall population
While analyzing the demographics of the promoters of different trends, we observed that different trends are promoted by user-groups having highly disparate demographics. Now, we compare their demographics with the (baseline or reference) demographics of overall Twitter population in the US. In Figure 1, Figure 2 and Figure 3, we present the baseline as a red circle. We observe that although some of the green circles, representing demographics of the promoters, are close to the red circle, many of them are far from it.
To formally quantify whether the demographics of the promoters of a trend deviates significantly from the demographics of the overall population, we use Fisher’s Exact Test (?). For example, considering the gender demographics, if the number of men and women among the promoters of a trend and in the overall population are , , and respectively, then to evaluate whether the proportion of men and women among the promoters of is significantly different from their proportion in overall population, we first build the following Contingency Table
Then, we compute the p-value from this contingency table using Fisher’s test (?). If the p-value obtained from the test is less than , we conclude that the difference in the two proportions is statistically significant. Although Fisher’s exact test was originally proposed for contingency tables, it has later been extended to apply on general contingency tables (?).
Table 2 shows the fraction of trends, which are promoted by groups of users who are significantly different from Twitter’s overall user population. We can see that such trends constitute a significant majority of all trending topics, which indicates that the promoters of most of the trends are different from the overall population.
This observation is interesting because when a topic is declared trending on Twitter, and news outlets start reporting on them777fortune.com/2017/02/21/delete-uber-twitter 888teenvogue.com/story/day-without-immigrants-strike-twitter, the underlying assumption is that the topic is popular among a representative sample of all Twitter users in a geographical region. However, as we see in our analysis, this assumption does not hold in practice. Hence, along with the topic, it is also important to know the specific groups of users who make the topic trending.
When the representation of different demographic groups (such as Whites, Women, or Adolescents) among the trend promoters deviate from the overall Twitter population, the groups can either be represented more or represented less compared to their share in the overall population. To investigate how different groups are represented, we plot reference lines along the x-axis in Figure 1, and along both x-axis and y-axis in Figures 2(a-c) and Figures 3(a-c). Each reference line denotes the proportion of users in the overall Twitter population belonging to a particular demographic group. For example, the reference line in Figure 1 denotes the percentage of men among the overall Twitter population. This line divides the trends in Figure 1 into two halves: (i) upper-half, which contains the trends where men are represented more among the promoters (there are of all trends falling into the upper half), and (ii) lower-half containing trends () where men are represented less.
For Figures 2(a-c) and Figures 3(a-c), the reference lines divide the trends into four quadrants: (i) first quadrant contains the trends where both demographic groups shown in a particular figure are represented more among the promoters; (iii) third quadrant contains trends where both groups are represented less; (ii) second quadrant and (iv) fourth quadrant have the trends where one of the groups is represented more and the other is represented less among the promoters, compared to the overall Twitter population.
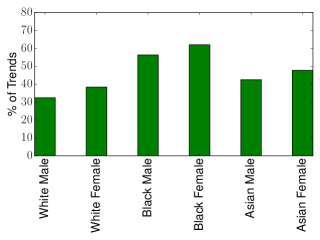
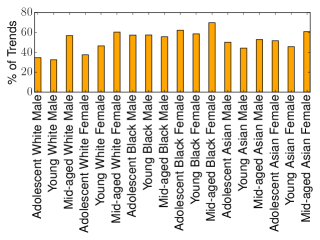
Under-representation of demographic groups
For most of the trends, we observed that different demographic groups (such as Whites, Women, or Adolescents) are represented less or represented more among the promoters of these trends. A pertinent question to ask in this context is for how many trends, the representation of a particular demographic group is significantly less.
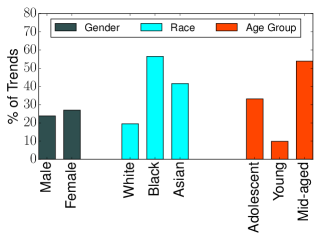
We define a demographic group to be under-represented among the promoters of a topic, if the fraction of promoters belonging to group is less than of the fraction of in the reference demographics (i.e., the overall population). Our selection of the threshold is motivated by the 80% rule used by U.S. Equal Employment Opportunity Commission to determine whether a company’s hiring policy has any adverse impact on a minority group (?).
Figure 4(a) shows the under-representation of different gender groups, racial groups and age groups. Figure 4(b) and Figure 4(c) respectively show the under-representation for the demographic groups based on both race and gender, as well as based on all three demographic attributes together. The age group ‘old’ is not shown in these figures as we do not have enough tweets posted by old people in our dataset.
We make the following interesting observations in Figures 4(a), 4(b),
and 4(c):
(i) Although the fraction of women in the Twitter population is larger than that of men, women are
under-represented more among the trend promoters than men.
(ii) Blacks and Asians are under-represented in the racial demographic groups promoting Twitter trends.
(iii) Among the age-groups, both adolescents and mid-aged people are under-represented.
(iv) Considering race and gender together,
among all groups, black women are most under-represented.
(v) Among the demographic groups based on gender, race and age together,
the highest under-representation is noticed in mid-aged black women.
Our observations about the perceived under-representation towards women and the demographic groups containing black users are in line with previous findings related to gender inequalities in Twitter (?), and in many other efforts that discuss inequalities of these demographic groups in our society (?; ?). More importantly, these observations suggest that the so called ‘glass ceiling effect’, usually used to describe the barriers that women face at the highest levels of an organization (?), may occur even in crowdsourced recommendations such as Twitter Trends.
Impact of trend recommendations
We next turn our focus towards the adopters of the trends who have used the topics after they became trending. It is expected that once a topic becomes trending, it gets noticed by a large number of users. We want to investigate whether the topics still remain popular among the same demographics who promoted them (before they became trending), or whether the topics get adopted by a wider population. Towards that end, similar to the demographics of promoters, we compute the demographics of adopters for all trends by considering the proportion of adopters belonging to different demographic groups, and then consider their divergence from the overall Twitter demographics.
While computing the divergence of demographics of the users of a topic (either promoting or adopting it) from the reference or baseline demographics of all Twitter users, we consider the euclidean distance between the demographics of the promoters (and adopters) of and the reference demographics:
| (1) |
where is the reference or baseline demographics. Higher the score, more divergent is the demographics of users promoting or adopting the topic.
Figure 5 shows the average divergence of promoters and adopters of different trends from the overall population. We can see in Figure 5 that the demographics of the adopters for different trends become closer to the overall Twitter population, and thereby reducing the divergence score. Thus, we can conclude that the topics which were promoted by particular sections of the users, get adopted by a much wider population after the topics become trending.
| Demographic Attribute | Demographic Group | Example Trends |
|---|---|---|
| Gender | Male | #SXSW2017, #Wikileaks, #HeGone, #playstationmeeting, #drunkerhistory |
| Female | #JUSTINFOREVER, #BacheloretteFinale, #mypetmystar, #weloveyounormani | |
| Race | White | #PardonSnowden, #UnlikelyBreakfastCereals, #PrisonStrike, #NightTube |
| Black | #OneAfricaMusicFest, #blackloveday, #BlackGirlsRock, #ThingsBlackpplFear | |
| Asian | #FlyInNYC, #ButterflyKiss, #indiedevhour, #QueenHwasaDay | |
| Age-group | Adolescent | #WhoSaysYouAreNotPerfectSelena, #NationalTeddyBearDay, #SuperJunior |
| Young | #breastfeeding, #KeepItPersonal, #WWEChicago | |
| Mid-aged | #HillaryHealth, #TrumpInDetroit, #WheresYourTaxes, #TrumpCouldSay |
| Trend | Demographics of Promoters | |||||||
|---|---|---|---|---|---|---|---|---|
| Gender | Race | Age-group | ||||||
| % Male | % Female | % White | % Black | % Asian | % Adolescent | % Young | % Mid-aged | |
| #AmericaWasNeverGreat | 47.5 | 52.5 | 63.13 | 21.25 | 15.63 | 28.75 | 59.38 | 11.25 |
| #Freedom | 54.01 | 45.99 | 80.21 | 8.02 | 11.76 | 20.86 | 65.78 | 12.3 |
| #GodBlessAmerica | 48.97 | 51.03 | 80.69 | 10.34 | 8.97 | 17.24 | 64.83 | 17.93 |
| #GrowingUpInABlackChurch | 37.02 | 62.98 | 32.75 | 53.29 | 13.95 | 45.93 | 50.58 | 3.49 |
| #WeAreAmerica | 62.07 | 37.93 | 63.79 | 18.97 | 17.24 | 22.41 | 67.24 | 8.62 |
| Trend | Demographics of Promoters | |||||||
|---|---|---|---|---|---|---|---|---|
| Gender | Race | Age-group | ||||||
| % Male | % Female | % White | % Black | % Asian | % Adolescent | % Young | % Mid-aged | |
| #AllLivesShouldMatter | 47.37 | 52.63 | 47.36 | 26.32 | 26.32 | 63.12 | 36.8 | 0.8 |
| #BattleBots | 66.67 | 33.33 | 69.44 | 11.11 | 19.44 | 5.56 | 72.22 | 22.22 |
| #BlackLivesMatter | 50.0 | 50.0 | 28.57 | 57.14 | 14.29 | 21.43 | 64.29 | 14.29 |
| #BlackSkinIsNotACrime | 43.86 | 56.14 | 38.6 | 38.6 | 22.81 | 43.86 | 54.39 | 1.75 |
| #DallasPoliceShootings | 45.18 | 54.82 | 77.71 | 9.64 | 12.65 | 28.31 | 54.82 | 15.66 |
| #PoliceLivesMatter | 50.0 | 50.0 | 73.68 | 13.16 | 13.16 | 15.79 | 65.79 | 18.42 |
| #PrayForPeace | 35.14 | 64.86 | 78.38 | 2.7 | 18.92 | 29.73 | 64.86 | 5.41 |
| Trend | Demographics of Promoters | |||||||
| Gender | Race | Age-group | ||||||
| % Male | % Female | % White | % Black | % Asian | % Adolescent | % Young | % Mid-aged | |
| 7th November, 2016 | ||||||||
| #ImWithHer | 44.44 | 55.56 | 77.78 | 11.11 | 11.11 | 22.22 | 66.67 | 11.11 |
| #MyVote2016 | 71.43 | 28.57 | 82.21 | 14.29 | 3.5 | 14.29 | 82.33 | 3.38 |
| #TrumpWinsBecause | 78.57 | 21.43 | 91.79 | 1.07 | 7.14 | 14.29 | 42.86 | 35.71 |
| 8th November, 2016 | ||||||||
| #Decision2016 | 44.24 | 55.76 | 82.49 | 6.45 | 11.06 | 22.58 | 68.2 | 9.22 |
| #ElectionDay | 50.46 | 49.54 | 77.52 | 10.44 | 12.04 | 20.88 | 63.37 | 15.16 |
| #ObamaDay | 51.14 | 48.86 | 50.0 | 36.36 | 13.64 | 19.32 | 71.59 | 9.09 |
| 9th November, 2016 | ||||||||
| #ElectionResults | 49.57 | 50.43 | 81.2 | 7.69 | 11.11 | 13.68 | 69.23 | 17.09 |
| #ImStillWithHer | 31.17 | 68.83 | 77.27 | 9.09 | 13.64 | 33.77 | 57.79 | 8.44 |
| #MorningAfter | 38.46 | 61.54 | 69.23 | 7.69 | 23.08 | 7.69 | 76.92 | 15.38 |
| #NowThatTrumpIsPresident | 76.47 | 23.53 | 35.29 | 41.18 | 23.53 | 17.65 | 70.59 | 11.76 |
| #PresidentTrump | 47.47 | 52.53 | 77.22 | 8.23 | 14.56 | 18.35 | 65.82 | 14.56 |
| #RIPAmerica | 39.06 | 60.94 | 73.44 | 6.25 | 20.31 | 40.63 | 54.69 | 4.69 |
| #TrumpsFirstOrder | 78.13 | 21.88 | 84.38 | 6.25 | 9.38 | 15.63 | 56.25 | 28.13 |
Demographics influencing the type of trends
Earlier, we saw how different demographic groups are represented among the promoters of different trends. We now attempt to analyze the impact of the demographics of the promoters on the type of topics becoming trending. Looking through the trends promoted by users where a particular demographic group is represented more, we find two patterns among such trends: (i) the trends tend to express the niche interests of that demographic group, (ii) when some event happens, which is of interest to everyone, different trends bring out different perspectives on that event. Next, we demonstrate these observations with some case studies.
Trends expressing niche interest
We first look at some of the trends where the promoters are dominated by certain demographic groups, and list some examples in Table 3.
Trends promoted more by one gender group
Second and third rows in Table 3 show the trends promoted by either mostly men, or mostly women.
We see that the gaming trends like #playstationmeeting, or political trends like #Wikileaks, are mostly promoted by men.
On the other hand, trends #JUSTINFOREVER, about the singer Justin Bieber and #BacheloretteFinale, a TV show, are promoted mostly by women.
Trends promoted more by one racial group
Fourth, fifth and sixth rows in Table 3 show the trends promoted by either mostly Whites, Blacks, or Asians.
Trends such as #UnlikelyBreakfastCereals and #PrisonStrike, which is related to the protest of prison inmates, are more popular among Whites.
Whereas, trends of niche cultural interest such as #OneAfricaMusicFest, #blackloveday are more popular among Blacks. Finally, trends popular mostly among Asians include #FlyInNYC, which is related to
a concert by the South Korean musical group GOT7, and the trend #QueenHwasaDay, which is about Hwasa,
a member of the Korean girl band namely Mamamoo.
Trends promoted more by one age group
The last three rows in Table 3 show the trends promoted by either mostly Adolescents, Young, or mostly Mid-aged people.
Examples of topics promoted by adolescents include
#WhoSaysYouAreNotPerfectSelena, which is about the celebrity Selena Gomez, or #NationalTeddyBearDay.
Trends promoted predominantly by young people include
health related issues like #breastfeeding, or #WWEChicago (a wrestling match). Finally,
the trends promoted by mid-aged people, tend to cover
many political topics such as #HillaryHealth, #TrumpInDetroit, and #WheresYourTaxes.
Trends expressing different perspectives during
different events
Apart from the niche interests, trends promoted by different demographic groups
also tend to offer unique perspectives during events relevant to the broad society.
Here, we discuss the topics which became trending in Twitter during the following three events:
A. US Independence Day (on 4th July, 2016)
B. Dallas Shooting (on 7th July, 2016)
C. US Presidential Election 2016 (on 8th November, 2016)
US Independence Day
July Fourth is the independence day of the US, and therefore, many related topics became trending. However, the long election campaigns as well as recent increase in racial tensions have prompted different Twitter users to promote different trends expressing their views. Table 4 shows the demographics of promoters of different associated trends. We can see that trends like #AmericaWasNeverGreat was promoted by mid-aged black people, similarly, #WeAreAmerica was promoted by young black men.
#GrowingUpInABlackChurch was promoted by adolescent black women. On the other hand, trends such as #Freedom, #GodBlessAmerica were promoted by young white men.
Dallas Shooting
On 7th July, 2016, a protest was organized in Dallas, Texas by the group ‘Black Lives Matter’, against the killings of two black men, Alton Sterling and Philando Castile, by police officers in Louisiana and Minnesota, few days before. During the protest, 5 police officers in Dallas were assassinated by a black army veteran Micah Xavier Johnson999nytimes.com/2016/07/08/us/dallas-police-officers-killed.html. Subsequently, on 8th July, police killed Johnson with a remote controlled bomb carried by a robot. This event also marked the first use of a robot to kill a suspect by police in US101010talkingpointsmemo.com/livewire/suspect-killed-bomb-robot.
In Table 5, we show trends which were promoted by users having different demographics. We can clearly see how different trends express different perspectives on the same event. #DallasPoliceShootings, and #PoliceLivesMatter were promoted by young or mid-aged white users. #BattleBots was promoted by young and mid-aged men across all races. On the other hand, #BlackLivesMatter, and #BlackSkinIsNotACrime were promoted by adolescent and young black people. #AllLivesShouldMatter was promoted by a combination of black and asian adolescents. Finally, #PrayForPeace was promoted by young white women.
US Presidential Election 2016
US presidential election of 2016 was held on 8th November, 2016, where the major contenders were Democratic candidate Hillary Clinton, and Republican candidate Donald Trump. The election results became clear on 9th November early morning, with Trump becoming the president-elect. In addition to the dataset described in the dataset section, we collected trends, tweets and the demographic information of Twitter users participating in the trends during the election period. In Table 6, we present the election related trends chronologically.
We can see that on 7th November, before the election, the election related trends were promoted by mostly young and mid-aged white people. The political distinctions can be seen in the gender of the promoters. While #ImWithHer, Clinton campaign slogan, was promoted by both men and women; promoters of #TrumpWinsBecause was dominated by men. On the election day, the trends were mostly promoted by young people, and by white men, white women and black men.
On the day of the election result, we see multiple trends emerging, each representing the perspectives of different groups. For example, #ElectionResults, #PresidentTrump and #TrumpsFirstOrder were promoted by mid-aged white men. On the other hand, #RIPAmerica, and #ImStillWithHer were promoted by adolescent and young white women. Finally, #NowThatTrumpIsPresident was promoted by young and mid-aged black and asian men.
Concluding Discussion
In this paper, we focused on understanding the demographics of crowds who make some content worthy of being recommended as trending. We particularly focus on the promoters of Twitter trends. Using an extensive dataset from Twitter, we analyzed how the promoters of different trends compare with the overall Twitter population.
Our analysis shows that a large fraction of Twitter trends are promoted by users, whose demographic composition differs significantly from Twitter’s user population. More troublingly, we find that traditionally marginalized social groups (e.g., black women) are systematically under-represented among the promoters of Twitter trends. We observe that the trends predominantly promoted by a specific demographic group either tend to be of niche interest or reflect divergent perspectives on events of broad societal interest.
Our work adds an important perspective to ongoing debates about the fairness, bias, and transparency of algorithms operating over big crowdsourced datasets: their inputs. Our findings show that beyond studying algorithms and their outputs (e.g., search results, trending topics), it is useful to understand the inputs over which the algorithms work (e.g., characteristics of the crowd who make a topic popular).
Making demographic biases in trends transparent
Given our findings that (i) the demographics of the crowds promoting
trends is often quite different from the overall population of the
media site, and (ii) the demographics of promoters has a strong influence
on what topics will become trending, there is a clear need to make the
demographic biases in trend recommendations transparent to Twitter
users.
Towards that end, we developed and publicly deployed a system ‘Who-Makes-Trends’111111twitter-app.mpi-sws.org/who-makes-trends to make the demographics of crowds promoting Twitter trends in the US more transparent. We believe that such systems are not only useful for the social media users, but also for journalists, social media researchers, developers of recommendation systems, as well as for governmental agencies wanting to understand different facets of public opinion during moments of unrest.
Directions for future work
While our study here is limited to understanding biases in the inputs to the crowdsourced
recommendations (i.e., trending topics), we believe that our analysis
framework can be easily extended and our core findings will be
relevant to a variety of algorithms in social media that rely on
inputs from crowds, including social search (?) and
assessing reputation or influence of users in social media. Another
avenue for future work lies in investigating new algorithms for
selecting trending topics that explicitly take into account the
demographic biases of the crowds promoting individual topics.
Acknowledgments: This research was partly supported by a grant from the IMPECS project titled Understanding, Leveraging and Deploying Online Social Networks. F. Benevenuto was supported by grants from Humboldt Foundation, Capes, CNPq, and Fapemig. A. Chakraborty is a recipient of Google India PhD Fellowship and Prime Minister’s Fellowship Scheme for Doctoral Research, a public-private partnership between Science & Engineering Research Board (SERB), Department of Science & Technology, Government of India and Confederation of Indian Industry (CII).
References
- [An and Weber 2016] An, J., and Weber, I. 2016. # greysanatomy vs.# yankees: Demographics and hashtag use on twitter. In ICWSM.
- [Benhardus and Kalita 2013] Benhardus, J., and Kalita, J. 2013. Streaming trend detection in twitter. Journal of Web Based Communities 9(1).
- [Biddle 2006] Biddle, D. 2006. Adverse impact and test validation: A practitioner’s guide to valid and defensible employment testing.
- [Blevins and Mullen 2015] Blevins, C., and Mullen, L. 2015. Jane, john… leslie? a historical method for algorithmic gender prediction. Digital Humanities Quarterly 9(3).
- [Bonilla-Silva 2006] Bonilla-Silva, E. 2006. Racism without racists: Color-blind racism and the persistence of racial inequality in the United States. Rowman & Littlefield Publishers.
- [Chakraborty et al. 2015] Chakraborty, A.; Ghosh, S.; Ganguly, N.; and Gummadi, K. 2015. Can trending news stories create coverage bias? on the impact of high content churn in online news media. In Computation and Journalism Symposium.
- [Chakraborty et al. 2016] Chakraborty, A.; Ghosh, S.; Ganguly, N.; and Gummadi, K. P. 2016. Dissemination biases of social media channels: On the topical coverage of socially shared news. In ICWSM.
- [Cotter et al. 2001] Cotter, D. A.; Hermsen, J. M.; Ovadia, S.; and Vanneman, R. 2001. The glass ceiling effect. Social forces 80(2):655–681.
- [Duggan 2015] Duggan, M. 2015. The Demographics of Social Media Users. pewinternet.org/2015/08/19/the-demographics-of-social-media-users/.
- [Erikson 1994] Erikson, E. H. 1994. Identity: Youth and crisis. Number 7. WW Norton & Company.
- [Felton and Lyons 2016] Felton, E., and Lyons, T. 2016. The administration’s report on the future of artificial intelligence. whitehouse.gov/blog/2016/10/ 12/administrations-report-future-artificial-intelligence.
- [Fisher 1922] Fisher, R. A. 1922. On the interpretation of 2 from contingency tables, and the calculation of p. Journal of the Royal Statistical Society 85(1).
- [Friedman 2016] Friedman, A. 2016. Hashtag journalism: The pros and cons to covering twitter’s trending topics. Columbia Journalism Review.
- [Gilbert et al. 2013] Gilbert, E.; Bakhshi, S.; Chang, S.; and Terveen, L. 2013. “i need to try this?": A statistical overview of pinterest. In ACM SIGCHI.
- [Gilbert, Karahalios, and Sandvig 2008] Gilbert, E.; Karahalios, K.; and Sandvig, C. 2008. The network in the garden: an empirical analysis of social media in rural life. In ACM SIGCHI.
- [Gillespie, Seyfert, and Roberge 2016] Gillespie, T.; Seyfert, R.; and Roberge, J. 2016. # trendingistrending: When algorithms become culture. Algorithmic Cultures: Essays on Meaning, Performance and New Technologies.
- [Kroll 2015] Kroll, J. A. 2015. Accountable Algorithms. Ph.D. Dissertation, Princeton University.
- [Kulshrestha et al. 2017] Kulshrestha, J.; Eslami, M.; Messias, J.; Zafar, M. B.; Ghosh, S.; Gummadi, K. P.; and Karahalios, K. 2017. Quantifying search bias: Investigating sources of bias for political searches in social media. ACM CSCW.
- [Lee et al. 2012] Lee, K.; Caverlee, J.; Kamath, K. Y.; and Cheng, Z. 2012. Detecting collective attention spam. In Joint ACM WICOW/AIRWeb Workshop on Web Quality.
- [Liu and Ruths 2013] Liu, W., and Ruths, D. 2013. What’s in a name? using first names as features for gender inference in twitter. In AAAI spring symposium.
- [Madden et al. 2013] Madden, M.; Lenhart, A.; Cortesi, S.; Gasser, U.; Duggan, M.; Smith, A.; and Beaton, M. 2013. Teens, social media, and privacy. Pew Research Center.
- [Mehta and Patel 1983] Mehta, C. R., and Patel, N. R. 1983. A network algorithm for performing fisher’s exact test in r c contingency tables. Journal of the American Statistical Association 78(382).
- [Mislove et al. 2011] Mislove, A.; Lehmann, S.; Ahn, Y.-Y.; Onnela, J.-P.; and Rosenquist, J. N. 2011. Understanding the demographics of twitter users. ICWSM.
- [Naaman, Becker, and Gravano 2011] Naaman, M.; Becker, H.; and Gravano, L. 2011. Hip and trendy: Characterizing emerging trends on twitter. Journal of the American Society for Information Science and Technology 62(5).
- [Nilizadeh et al. 2016] Nilizadeh, S.; Groggel, A.; Lista, P.; Das, S.; Ahn, Y.-Y.; Kapadia, A.; and Rojas, F. 2016. Twitter’s glass ceiling: The effect of perceived gender on online visibility. In ICWSM.
- [Nunez 2016] Nunez, M. 2016. Former Facebook Workers: We Routinely Suppressed Conservative News. gizmodo.com/former-facebook-workers-we-routinely-suppressed-conser-1775461006.
- [Ohlheiser 2016] Ohlheiser, A. 2016. Three days after removing human editors, facebook is already trending fake news. washingtonpost.com/news/ the-intersect/wp/2016/08/29/a-fake-headline-about-megyn-kelly-was-trending-on-facebook/.
- [Sloan et al. 2015] Sloan, L.; Morgan, J.; Burnap, P.; and Williams, M. 2015. Who tweets? deriving the demographic characteristics of age, occupation and social class from twitter user meta-data. PloS one 10(3).
- [Twitter 2010] Twitter. 2010. To Trend or Not to Trend. blog.twitter.com/2010/to-trend-or-not-to-trend.
- [Wagner et al. 2016] Wagner, C.; Graells-Garrido, E.; Garcia, D.; and Menczer, F. 2016. Women through the glass ceiling: gender asymmetries in wikipedia. EPJ Data Science 5(1).
- [Yin et al. 2015] Yin, Q.; Cao, Z.; Jiang, Y.; and Fan, H. 2015. Learning deep face representation. US Patent 20,150,347,820.
- [Zafar et al. 2015] Zafar, M. B.; Valera, I.; Rodriguez, M. G.; and Gummadi, K. P. 2015. Learning fair classifiers. arXiv preprint arXiv:1507.05259.
- [Zagheni et al. 2014] Zagheni, E.; Garimella, V. R. K.; Weber, I.; and State, B. 2014. Inferring international and internal migration patterns from twitter data. In ACM WWW Companion.
- [Zubiaga et al. 2011] Zubiaga, A.; Spina, D.; Fresno, V.; and Martínez, R. 2011. Classifying trending topics: a typology of conversation triggers on twitter. In ACM CIKM.