On Binary Channels to Anomalous Cepheids
Abstract
Anomalous Cepheids are a rather rare family of pulsating variables preferably found in dwarf galaxies. Attempts to model these variable stars via single-star evolution scenarios still leave space for improvements to better grasp their origin. Focusing on the LMC with its rich population of Anomalous Cepheids to compare against we probe the rôle binary stars might play to understand the nature of Anomalous Cepheids. The evolution of donors and accretors undergoing Case-B mass transfer along the first red-giant branch as well as merger-like models were calculated. First results show that in binary scenarios a larger range of star masses and metallicities up to , higher than deemed possible hitherto, enter and pass through the instability strip. If binary stars play a rôle in Anomalous Cepheid populations, mass donors, mass accretors, or even mergers are potential candidates to counteract constraints imposed by the single-star approach.
keywords:
binaries: close – stars: evolution – stars: oscillations1 Introduction
Short-period Cepheid-like variable stars, at the time almost exclusively found in dwarf spheroidal galaxies, were tagged with the diagnostic adjective “anomalous" if they did not fall into any of the customary regions occupied by classical pulsators (PopI – , Type II – Cepheids, and even RR Lyrae stars) on the period – luminosity (PL) plane (Zinn & Searle, 1976). Also the lightcurve morphologies of Anomalous Cepheids (ACs), quantified via Fourier coefficients, suggest that many of them are distinct from their classical siblings (e.g. Soszyński et al., 2015, on the Magellanic Clouds). Nonetheless, depending on the parent stellar system, considerable overlap with classical pulsators of comparable period may exist so that a clean attribution to a particular pulsating-stars family is not always possible. The periods of ACs range from about 0.6 to 3 days, so that they might be confused with RR Lyrae, BL Her variables, or short-period Classical Cepheids. ACs are, however, considerably brighter than RR Lyrae stars and the lightcurves frequently differ sufficiently that ACs are not mistaken for BL Her stars. ACs are either fundamental-mode (F) or first-overtone (O1) pulsators; no case of a double-mode pulsator is known. On the PL plane, ACs inhabit the region between Classical and TypeII Cepheids; with – at fixed period – being fainter than Classical but brighter than TypeII Cepheids; also the slope of the PL relation appears to be intermediate (cf. Fig. 1). ACs are rather rare variable stars. As mentioned before, ACs were first identified in dwarf spheroidals, they are essentially absent in globular clusters, and only a few are known in the Galactic field. The study of Fiorentino & Monelli (2012) contains a helpful census of ACs. The Magellanic Clouds contain the currently richest known populations of ACs. Thanks to the monitoring efforts of the OGLE team, the observational parameters of 141 ACs in the LMC and 109 in the SMC are well established (Soszyński et al., 2015). A very useful primer on ACs with a synopsis on their history can be found in Catelan & Smith (2015).
From their locations on color – magnitude diagrams, mainly relative to the horizontal branch and RR Lyrae stars thereon, and the application of the simple period – mean-density relation, already Zinn & Searle (1976) estimated ACs to be two to three times more massive than RR Lyrae stars. The resulting conundrum of how to get stars of the inferred mass to the observed position, say in the HR diagram, on a time-scale in accordance with the stellar population of the hosting stellar system, has been solved only partially.
Single-star modeling, by which observed ACs are most frequently calibrated, calls for extremely metal-poor stars with masses of about in the LMC (Fiorentino & Monelli, 2012), in Scl dSph (Martinez-Vazquez et al., 2016), or in LeoI where ACs and short-period Cepheids are intermingled (Stetson et al., 2014). Because ACs and Classical Cepheids are observed to follow different period – luminosity relations, see e.g. Soszyński et al. (2015), the two families of pulsators likely obey different mass – luminosity relations. According to e.g. Fiorentino & Monelli (2012), the short-period Cepheids are interpreted as intermediate-mass stars that quietly ignited He in their cores and which evolve through blue loops in the HR diagram under favorable conditions (in the current context this means mainly for sufficiently low Z-abundances). In contrast, ACs are understood as low-mass stars in their He core-burning phase; such stars begin their central He burning after a series of off-center He flashes. The locus on the HR diagram of such zero-age He core-burning low-mass stars is found to be sensitive to their heavy-element abundances (see e.g. Fig. 3 in Fiorentino et al., 2012): For sufficiently small – typically – zero-age He-core burning stars with masses roughly between and line up along a hook that develops out of the clump-giant region towards the classical instability strip (CIS). The magnitude of the hook is sensitive to and essentially disappears for . Stars that start their He core-burning phase along this hook have a chance to evolve into or through the CIS on a nuclear time-scale and hence show up as AC variables without having to embark on a blue loop as the Classical Cepheids do.
The sensitivity on metallicity is the Achilles heel of the above single-star AC-origin scenario. Frequently, the postulated low values are well below the dominating metallicity of the hosting stellar system. This applies also to the Magellanic Clouds, both of which host rich AC populations. In their attempt to understand the situation in the Large Magellanic Cloud (LMC), Fiorentino & Monelli (2012) had to resort to and models and found that such metal-poor stars in the mass range of , aged Gyrs, could feed the class of ACs therein. Hence, the invoked AC models were considerably metal poorer than what is found to dominate the LMC.
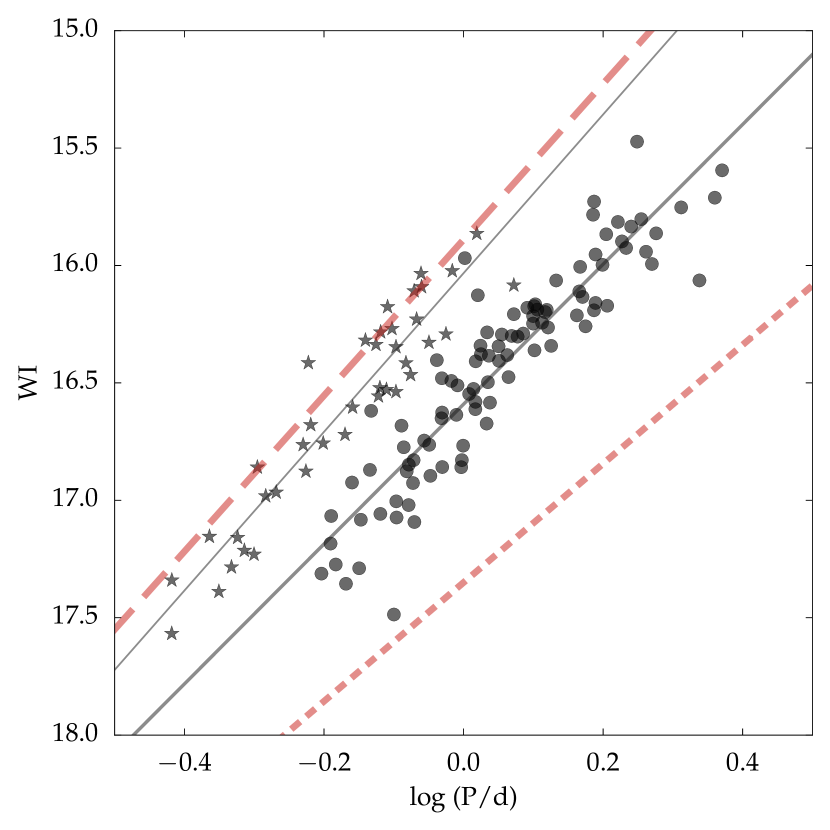
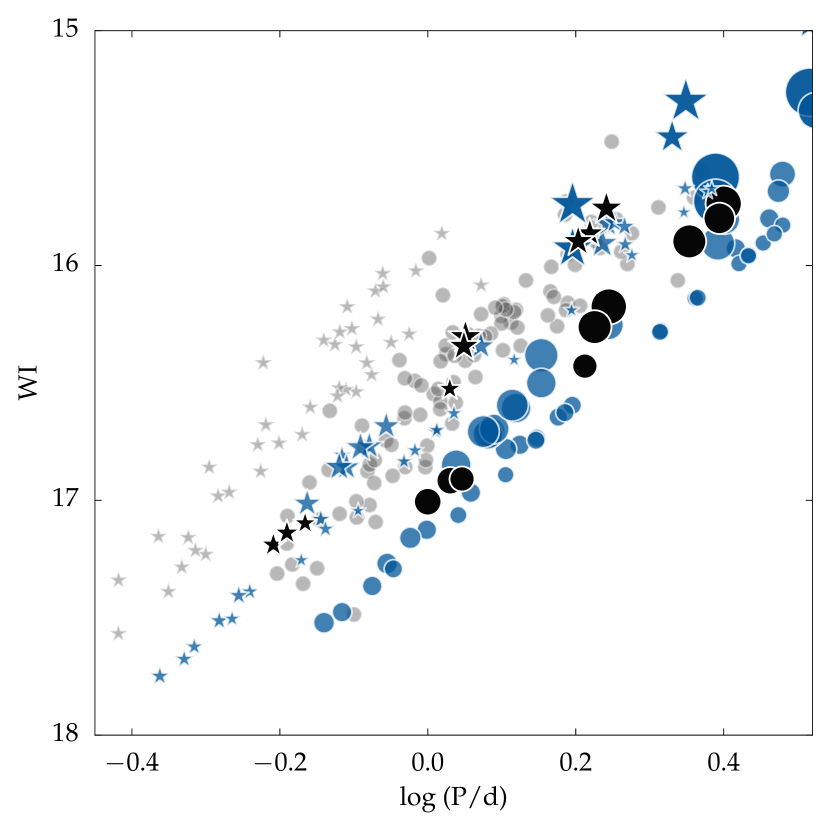
Binarity is not a rare configuration in stellar evolution in general and hence potentially also in ACs. Sipahi et al. (2013a, b) reported two examples of Galactic ACs, which are binary components of systems that must have undergone mass-transfer earlier on. Already early on, Zinn & Searle (1976) contemplated qualitatively ACs to be possibly binary components that have passed through mass-transfer episodes or might even be products of the coalescence of binary components. Detailed elaborations of scenarios do not exist, to the best of the authors’ knowledge. Nowadays, the computational infrastructure for such an endeavor is available with MESA (cf. Paxton et al., 2013, 2015). With the robust modules for stellar astrophysics, binary- and appropriately modified single-star models were evolved to gain insight into the rôle binaries might play in our understanding of ACs. The compositional choices of the models were motivated by the best available AC population, that of the LMC (Soszyński et al., 2015). The results are documented in the observer’s version of the PL relation; i.e. the period – Wesenheit-index (P-WI) relation: Figure 1 displays the 101 F-mode pulsators as filled grey circles and the 40 O1 ones as asterisks. Linear regressions to the distributions are added as full lines for comparison with results obtained in this paper; the respective numerical parameters are listed in Table 1 in the row ‘OGLE LMC’. To illustrate how the ACs are positioned relative to TypeII and Classical Cepheids, the respective F-mode P-WI relations, again adopted from OGLE observations of the LMC, are supplemented as dashed lines in Fig. 1. Consult Soszyński et al. (2015) for the observational background and in particular for remarks on the attribution of pulsation modes to the photometric data. Throughout this paper, Figure 1 serves as the template against which our modeling attempts are evaluated.
2 Approach and Methods
We investigated exemplary evolutionary paths of binary stars that are compatible with observed ACs; the most important character traits for us are their overstable radial pulsations in either fundamental or first-overtone mode in the appropriate period range. We explored possibilities for donors, accretors, and coalesced binary remnants to become pulsators. The performed computations and the chosen system configurations are neither exhaustive nor possibly even representative; they must be understood as first attempts of a feasibility study to understand at least some of the ACs in the context of now wide binaries that evolved into contact and lived through mass-transfer during their earlier evolution. Binary evolution through contact promises to resolve mismatches of age of a stellar system and the mass of embedded stars therein.
The necessary stellar-evolution computations were all performed with Version 8118 of the MESA software package either in single- or in binary-star mode. In the binary mode, both components were evolved. The binary orbits were assumed to be circular and conservative, i.e. no mass and no angular momentum was lost from the system, mass-loss rates were computed implicitly. For model stars111In MESA, the boundary of a convective core is computed by referring also to the chemical composition outside the boundary. To not systematically underestimate the duration of the He core-burning stage (cf. Bossini et al., 2015), and to not suppress (Cepheid) loops on the HR Diagram it is essential to allow for small overshooting at the outer edge of the convective helium-burning core. All MESA computations referred to in this paper had the inlist parameter overshoot_f_above_burn_he_core set to . evolving into the region of the CIS, blue-edge locations of the lowest few orders of nonadiabatic radial pulsation modes were computed with Version of the GYRE code, which comes with the MESA package.
Due to the lack of an implemented pulsation-convection interaction in GYRE, only the blue-edge loci of the instability domains were calculated in this paper. Any red-edges referred to in the following were ad hoc postulated by parallel shifting the blue edge to lower temperatures at which the periods of the pulsation modes were computed. To gain confidence in the quality of the simplified pulsation treatment, Appendix A illustrates the computed blue edges of Classical Cepheid models in the LMC with neglected convective-flux perturbation. The theoretical F- and O1-mode blue edges were mapped onto the P-WI plane and compared with OGLE observations. The agreement is reassuring, in particular when keeping in mind that ACs are bluer than the computed Classical Cepheids and therefore have envelopes that are even less affected by convection.
3 Accretor to AC
Deep convective stellar envelopes have the tendency to expand as a reaction to rapid mass loss. On the other hand, if the entropy of accreted matter is not much higher than that of the accreting stellar envelope, then it tends to shrink upon rapid mass accretion. Therefore, simulating semi-detached binaries with both components on the first giant branch (FGB) undergoing case Bc mass transfer (i.e. case B mass transfer of donors with deep convective envelopes) appeared appealing: Case Bc mass transfer (MT) between two say components can be expected to strip roughly one solar mass from the primary and feeding it onto the secondary, transforming the latter to an intermediate-mass star, which takes a much longer time to evolve into Helium core-burning than an isolated star starting from the ZAMS with the same mass. The property of the accretor to shrink prevents it from also filling its Roche lobe and from forcing the system into contact. Even though the remnants stay bound, their orbit will widen so much that the binary nature of a pulsating component might be difficult to establish observationally.
The strong mass dependence of stellar main-sequence lifetime necessitates small mass differences between the components of binaries aimed at. The set of computed systems consisted of almost-twins on the ZAMS; the primary was usually about more massive than the secondary. A larger mass difference left the secondary too far back in its evolution, usually with the secondary still having a predominantly radiative envelope at the onset of case Bc MT and therefore leading to contact systems, which cannot be dealt with in MESA. The smaller the mass differences the more pronounced is the tendency of both components to fill their respective Roche radii at the same time so that transferring enough mass before full contact becomes difficult again.
For our exploratory purposes we evolved a few almost twin-component binaries with through case Bc MT until the accretor evolved to the end of He core-burning. We restricted the ZAMS masses of the component so that the accretor mass was at the end of MT. The initial separation of the binary components on the ZAMS varied between (equivalent to about d orbital period), this ensured MT to start during the FGB phase of the donor and the accretor having already started its ascent along the FGB (in case the mass difference between the components was ). We found the post-MT masses to not depend crucially on the size of the orbit, therefore we performed most binary computations with an initial separation of .
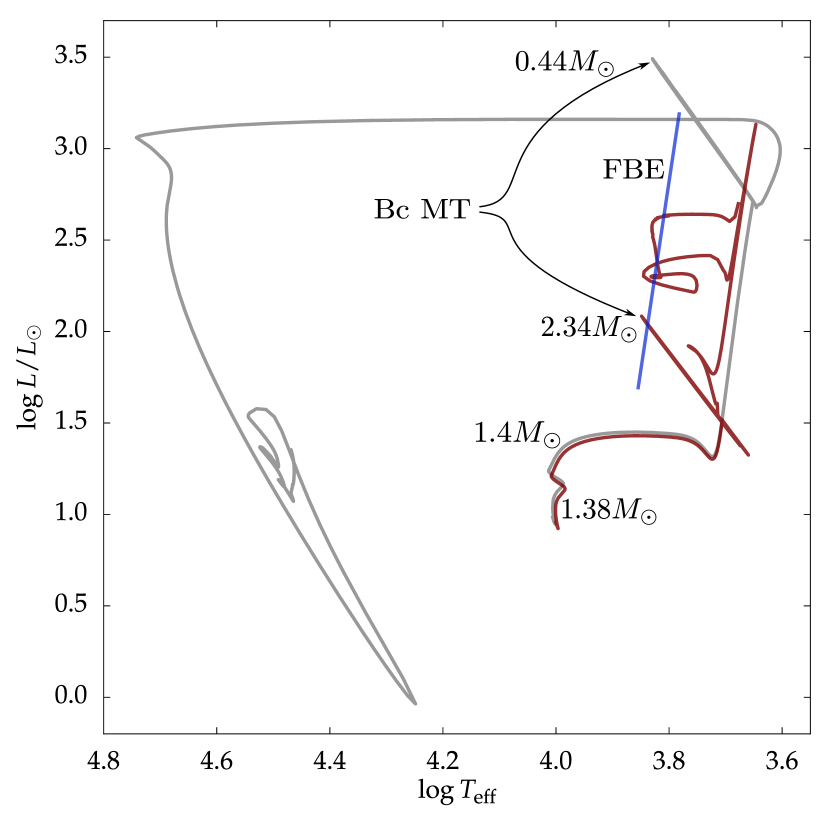
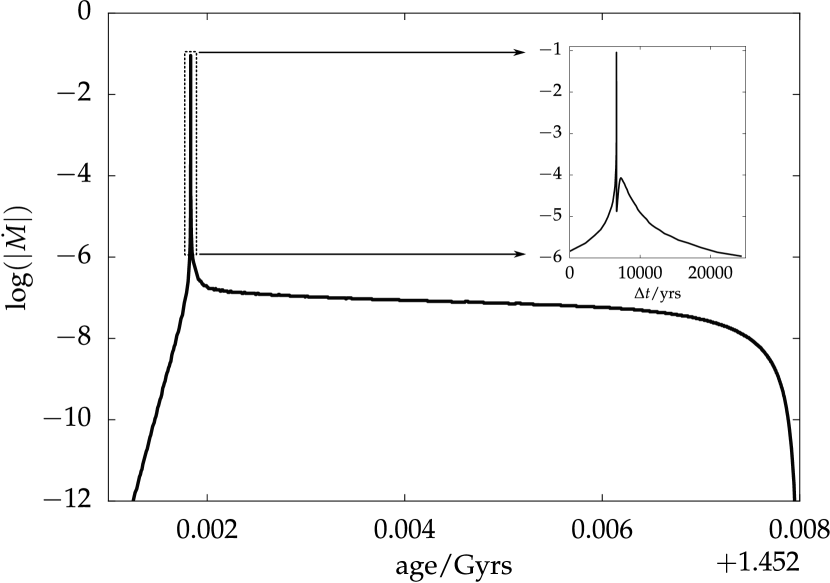
Figure 2 illustrates representative evolutionary tracks of binary components with initially (dark/red locus) and (brighter grey locus), respectively, with an orbital period of days, corresponding to a separation of , on the ZAMS. The tracks of both binary components look essentially identical to the lower FGB when dynamically unstable MT sets in; the respective reactions of the two components on the HR plane are highlighted as ‘Bc MT’. The short episode of case Bc MT shows up as diagonal excursions traced out by the donor as well as the accretor. Figure 3 shows the details of the evolution of the mass transfer rate during the Bc MT episode, which lasts for about 7 million years. The phase of persists for roughly yrs, the one during which most of the mass is transferred from the primary to the secondary, when , spans about years. Both components involved in the Bc MT process show strong luminosity and effective temperature variations, essentially at constant radius, on the HR plane (see Fig. 2). It remains unclear if this behavior is an artifact of the numerical implementation of the dynamically unstable mass transfer. The ensuing evolution of the remnants of Bc MT remained robust, independent of the particular settings of the numerical treatment of this evolutionary phase.
During case Bc MT, the primary lost to the secondary. The resulting remnant still ignited helium burning and evolved into a low-mass white dwarf, which eventually underwent a late shell flash (cf. Fig. 2). The secondary grew from to within a few tens of thousands of years, i.e. on a time-scale without noticeable nuclear evolution. The thermal relaxation of the new star can be seen in the HR diagram of Fig. 2 as the hook that developed above the Bc MT fault of the evolutionary track (at around ). Afterwards, the by then more massive secondary continued to evolve along the FGB in quasi-equilibrium until it started its helium core-burning. Even though the newly minted primary qualified as an intermediate-mass star which normally starts helium core-burning quietly, it continued to behave like a low-mass star in its center. Helium core-burning started degenerately in a series of mild off-center flashes during which the star evolved off the tip of the FGB to the region of the FBE at about . Hence, we could indeed produce radially pulsating He-burning stars with periods short enough to be AC candidates as the result of some close-binary MT episode. By the time the more massive secondary passed through the CIS it was accompanied by a low-mass binary companion that was about 30 times fainter and orbited the pulsating star with a period of around 420 days.
3.1 Emulating case Bc with single-star evolution
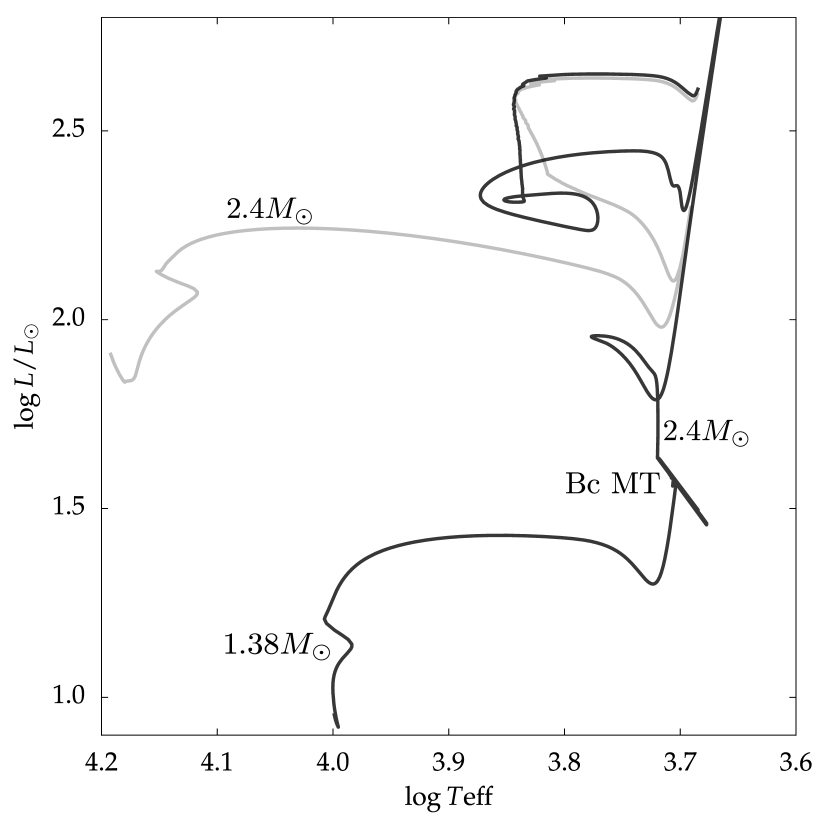
The very short mass-transfer episode and, except for mass accretion, the negligence of any other binary-specific physical interaction invites an emulation of accretor evolution by means of a single-star ansatz. Figure 4 illustrates the outcome of the evolution of an initially star from the ZAMS. It underwent rapid mass accretion on the lower FGB until it reached, in accordance with the binary system presented above, a total mass of . The resulting evolutionary track is shown by the black line. The epoch of rapid mass transfer, which was set constant to , is indicated again with ‘Bc MT’. The agreement of the loci in Fig. 2 and Fig. 4 is comforting. To emphasize the differences of intermediate-mass stars that evolved as isolated stars from the ZAMS and those which turned into intermediate-mass stars later in life via close-binary interaction, a star with was evolved from the ZAMS to the end of He core-burning. The respective evolutionary track is shown by the grey line in Fig. 4. Despite their divergent early phases, the tracks of the two model stars converged on the HR diagram during He core-burning and they ended up essentially congruent at the beginning of double-shell burning. A corresponding behavior was also observed on the plane of the stars’ centers in Fig. 5: The track shown in light grey, the track described by a comparison star of without mass transfer is plotted with a dashed line; finally, the evolution of central density and temperature of the initially star that gains mass in a Bc-type MT along the FGB is colored in red (which appears as a darker grey in the printed version).
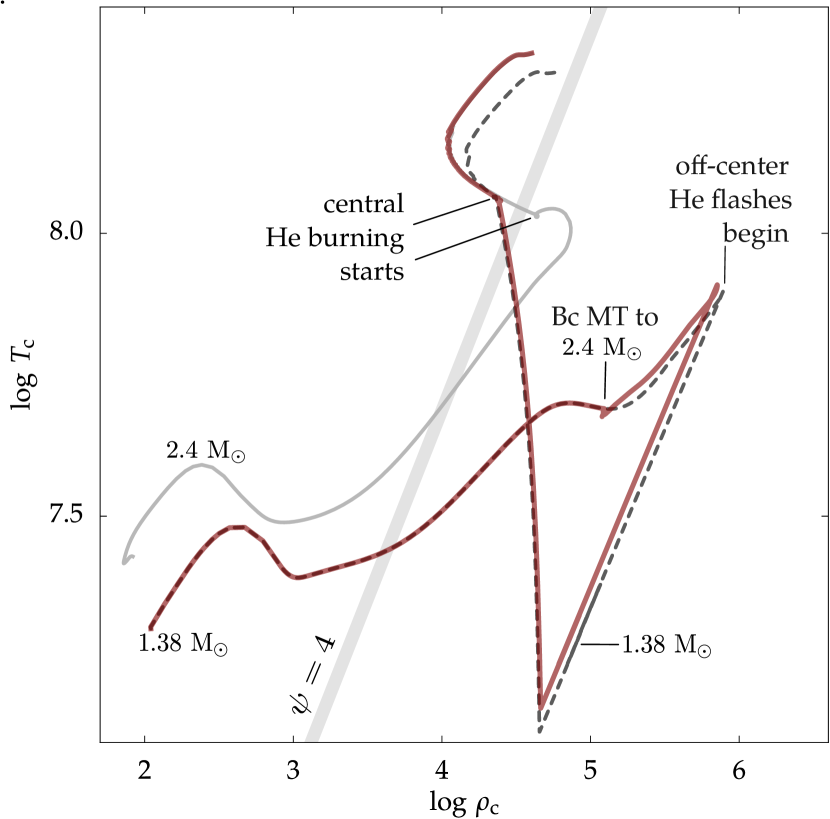
Evolution starting on the ZAMS places the three models on the lower left of the diagram. The broad grey band crossing diagonally through the plot constitutes a line of constant degeneracy, chosen to be at . The weak degeneracy of the stellar matter in the center of the model does not destroy the thermal stability of central He-burning at ignition: i.e. the star starts central burning quietly. The star’s central evolution is also textbook-like: After central H-burning, central temperature and density rise continuously, with the density getting high enough for stellar matter going degenerate. At the tip of the FGB, the model star develops off-center He-flashes. In a series of thermal instabilities burning propagates to the center where thermal stability is eventually regained and quiet central He-burning takes over. At that epoch the evolutionary loci on the plane of the and the models convene. A discussion of the wedge-shaped locus associated with the off-center He-flashes can be found e.g. in Paxton et al. (2011) or Gautschy (2012). The ensuing core He-burning phase for both models are similar, except that density was slightly higher but the temperature lower at the center of the star. Focus now on the accretor track: It starts as a star and gains quickly of matter; the corresponding epoch is marked in Fig. 5 as ‘Bc MT to ’. On the HR diagram, the thermal relaxation, after the Bc MT episode, of the then more massive star showed up as a small blue loop only at around in Fig. 4. Even though the accreted mass is considerable, the effect on the further evolution of the star on the plane was small. It is the sharp density contrast across the core – envelope boundary that essentially decouples the two regions so that the core’s evolution does not depend sensitively on what happens to the tenuous outer layers (cf. Sugimoto & Nomoto, 1980). The newly minted star continued to behave very much like the unperturbed star. In particular, also the accretor developed a thermally unstable He-shell and core He-burning is established via a series of He-shell flashes. The final part of the wedge-shape locus leading out of degeneracy is identical for the accretor and for the star. However, once core He-burning took over the accretor switched over to follow the locus of the unperturbed star.
On the HR diagram, it is evident that the degenerate onset of He core-burning takes the accretor to the blue earlier than in the case of quiet nondegenerate ignition. Therefore, the star evolved into and through the CIS at lower luminosities; i.e. after degenerate ignition of core-burning accretor remnants have a mass – luminosity relation that differs from canonical nondegenerate igniters.
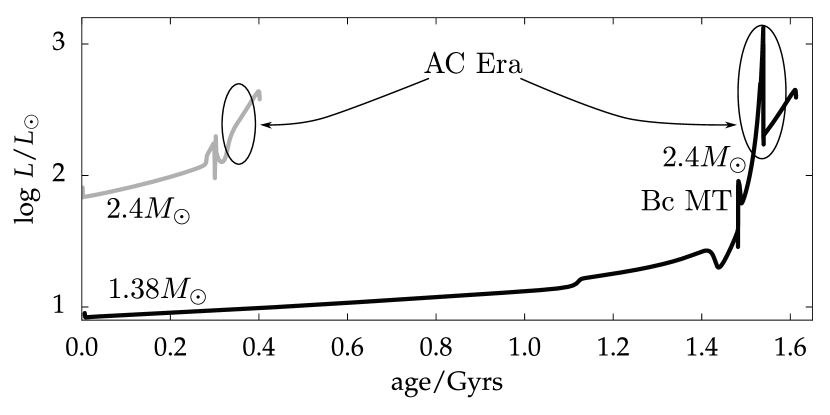
Another important effect of Bc MT on the mass-gainer is the evolutionary retardation effect inflicted by the process. Figure 6 plots age in gigayears versus luminosity. The pertinent epochs for the AC phenomenon are highlighted by ellipses. An isolated star reached its AC domain after about 0.35 gigayears. In contrast, the initial star that quickly gained along the FGB took about 1.5 gigayears to become a potential AC. In other words, binarity helps to accommodate seemingly too massive stars in otherwise older stellar populations.
3.2 Pulsation properties of case Bc MT accretors
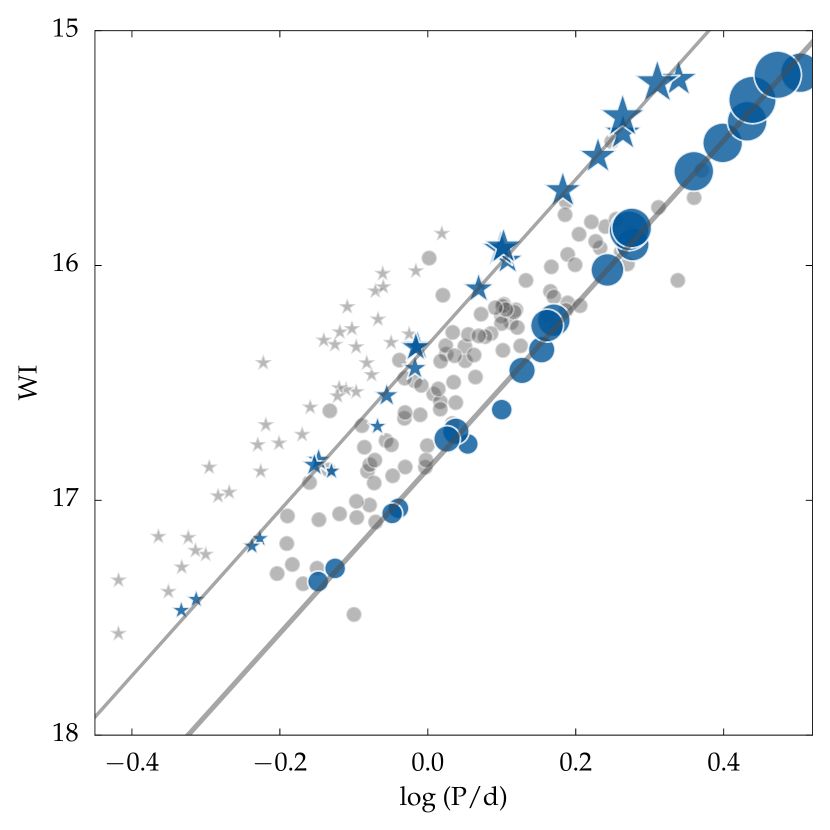
For the ad hoc chosen chemical composition of and we computed a number of evolutionary tracks either tracing the accretor in MESA’s binary mode, or then – when we studied model stars with different chemical compositions – to speed up the process, following the procedure described in Section 3.1. Figure 7 displays the results at the encountered blue edges with blue (dark grey in print) markers: Fundamental modes are shown as filled circles and first overtone modes as asterisks. For comparison, the computational results are overplotted on the LMC observations in light grey. The models’ luminosities were transformed to absolute photometric and magnitudes using a public FORTRAN program with an implementation of fits of stellar parameters to photometric passbands by Worthey & Lee (2011). To eventually dislocate the models to the right distance, an LMC distance modulus of mag was applied.
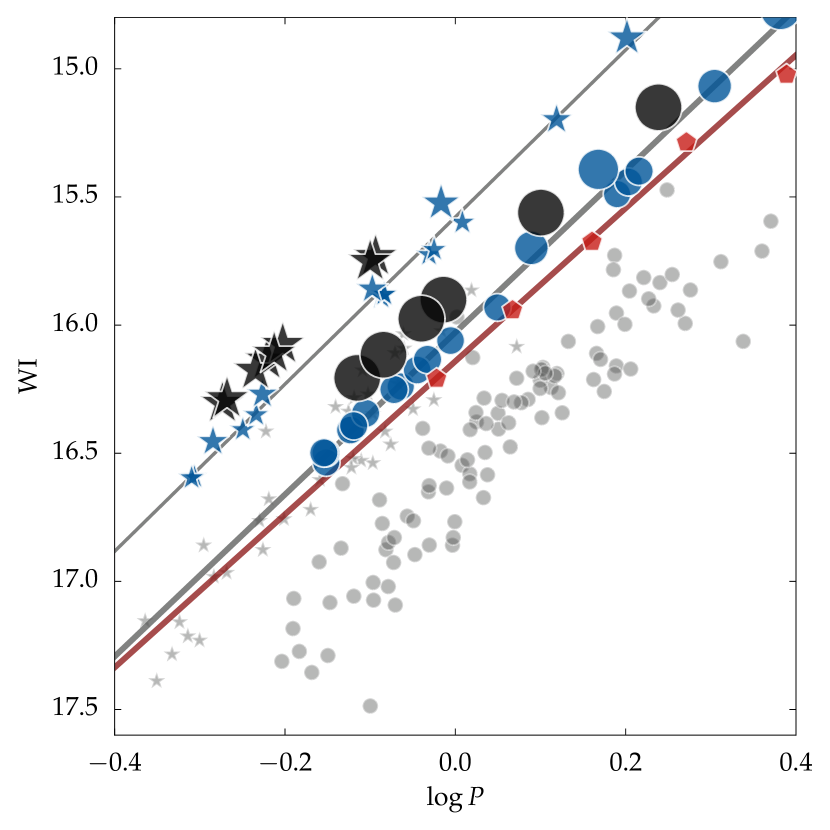
The grey lines through circles and asterisks plotted in Fig. 7 are linear least-square fits to the computed blue-edge locations, therefore they should prescribe the upper envelope to the respective observational data. To get an idea of the effect of the finite width of the CIS on the P-WI diagram, we computed F-modes at positions along the respective evolutionary tracks red-shifted by in from the FBE positions. Evidently, the instability strip collapses to a high degree on the P-WI plane; i.e. modeling predicts the intrinsic width of the instability strip on the P-WI plane to be considerably narrower than what observed fundamental mode ACs in the LMC suggest. The effect of chemical composition on the blue edges is illustrated with the additional black markers (which are also bigger) in Fig. 7; the respective model sequence used and and was computed in single-star approach with imposed fast MT on the FGB. A slight metallicity dependence of the P-WI relation seems to obtain: At a given period, the blue edges of the more metal-rich models are slightly brighter.
The size of the CIS – blue-edge markers in the P-WI diagrams scales with the mass of the model stars. The and models entering the CIS had accretor remnants with for the chosen binary parameters (such as initial mass of the components and initial separation). The general trend, which is though not strict, is that lower-mass stars populate the shorter-period and fainter WI domain of the plane, this applies to fundamental and first-overtone modes. In case of and models, is the lowest final accretor mass which crossed the CIS. Apparently, depending on its looping properties, even a star can pop up almost anywhere in the period range occupied by observed ACs.
4 Donor to AC
In last section we succeeded to evolve accreting components of interacting binaries into ACs. Therefore, the same can be conjectured to be possible for donors. To speed things up, we computed single-star models from which, in a case Bc-like scenario, mass was abstracted at the rate of once a prescribed helium core-mass was reached, i.e. once the model star expanded to an appropriate radius on the FGB. The adopted mass-loss rate is arbitrarily set, with robust results, as long as it is large enough for the remnant mass (also prescribed) to be reached on a timescale shorter than the star’s Kelvin-Helmholtz time; this ansatz emulates a dynamically unstable mass transfer. The price to pay is that we cannot follow the behavior of the binary system such as the separation of the components and the actual stop condition of the case Bc MT. In other words, more careful studies are required to find actual binary system configurations that reproduce donor stripping as prescribed in the ad-hoc way of this section.
Stars of initially , and and were evolved off the ZAMS. For suitable prescriptions of core He- and total remnant masses, fast MT along the FGB led indeed to CIS-crossing stars with remnant masses in the range . Two examples are shown in Fig. 8. Note that the donor models began their evolution as intermediate-mass stars which then turned into low-mass stars along the FGB. Much in accordance with the findings in the accretor case (cf. Sect. 3), also the donor remnants continued their evolution on plane along the path of the model star before case Bc MT; in this case, evolution of the central quantities of the model stars continued just like that of intermediate-mass stars even though the actual models had lost most of their initial mass. For the low-mass donor remnants this meant that they started their helium core-burning quietly under only weakly degenerate conditions. Depending on the choices of He core-mass at Bc MT switch-on and on the targeted remnant mass, we found that considerably He-enhanced envelopes could develop. In other words, ACs resulting from stripped donors might give away their origin spectroscopically via higher He/H ratios.
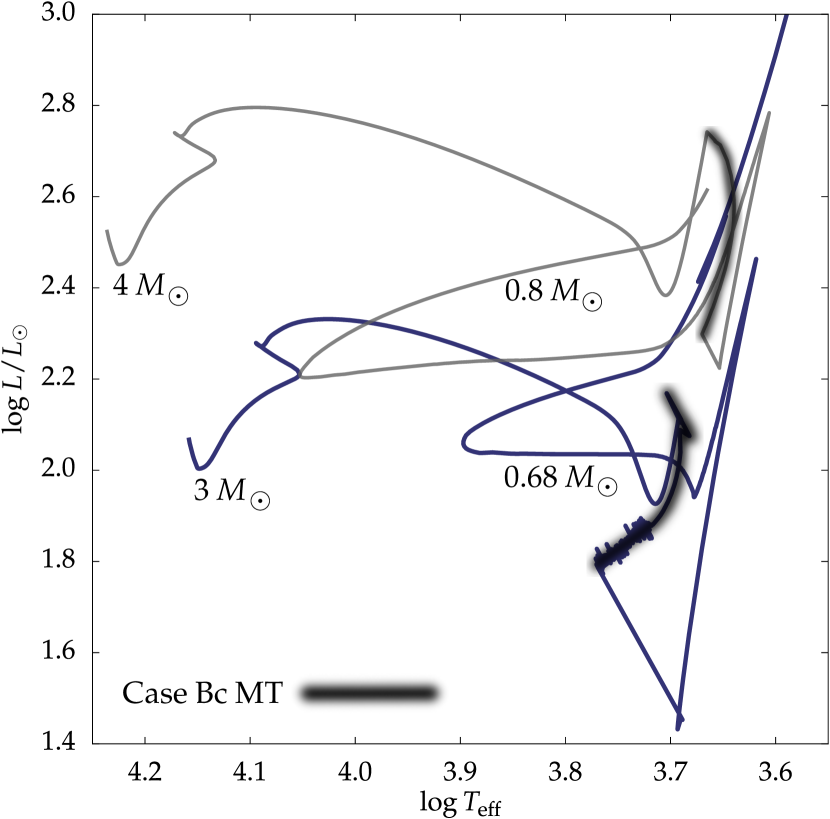
In Fig. 8, two stellar evolution tracks illustrate representatively the behavior of donor models. An initially star was stripped of its envelope on the FGB when its He core-mass reached ; a very high case-Bc – like mass loss removed mass until the remnant was left with . As evident from the dark blue evolutionary track, the remnant set out on a blue loop, crossing the CIS, during He core-burning. The same general behavior, with an even more extensive blue loop, applies to the model star, whose mass loss started at a He core mass of . Mass was abstracted until the remnant was left with . The phase of rapid mass loss is emphasized with a thick foggy line. The straight loci to lower luminosities and effective temperatures after termination of rapid mass loss were traced out when the remnants approached thermal equilibrium again.
The results on the P-WI plane of the blue edges as computed from our donor-stripping experiments are displayed in Fig. 9. Most importantly, from stars with initial masses exceeding and for heavy element abundances as high as and remnants were found to enter and cross the CIS with pulsation periods that are compatible with ACs. The weak grey background data points in Fig. 9 are again those observed of ACs in the LMC.
The mass of the models at their F and O1 blue edges are encoded again in the size of the markers. The smallest ones represent , the biggest ones pulsators. The markers in blue (intermediate grey) indicate the sequences. For initial masses of and and a heavy-element abundance of (at fixed ) blue looping helium core-burning models were found for remnant masses between and ; their positions on the P-WI plane are shown by the black symbols in Fig. 9. Within the scattered blue-edge data, no obvious metallicity dependence can be perceived. Furthermore, more massive pulsators are found at longer periods and higher luminosities. The lower-mass kin, however, are not restricted to short period and lower luminosity; they scatter along the whole AC-relevant period range of days of F modes (and days of O1 modes). It can even happen that small-mass O1 modes occupy the same region on the P-WI plane as more massive F-mode ACs. One can only hope that such a situation can be disentangled with the help of differing lightcurve shapes.
Because the scatter of even the blue-edge data is considerable we refrained from a fit to quantify the P-WI relations. Nonetheless, the situation in Fig. 9 is clear: The computed blue-edge data (adopting again a distance modulus of mag) for F and O1 modes are roughly parallel shifted to the observed LMC P-WI data. In contrast to Fig. 7, the ACs from donor remnants in Fig. 9 appear to be about 0.5 mag fainter than what LMC observations require.
The donors-to-ACs scheme can produce the sought-of pulsators in about yrs (for stars on the ZAMS) and yrs (for ZAMS stars). Donor remnants turning into ACs would hence require star formation within the last few hundred million years in the hosting stellar system.
5 Merger to AC
Finally, we conjectured that with some binary parameters mass transfer leads to a merger of the involved stellar components. In the following, we consider possibilities for such coalesced configurations to evolve through the CIS as ACs. The generic property of a post – main-sequence star on the FGB is its well expressed ‘core-halo structure’; i.e. a dense radiative He core smaller than about with a tenuous hydrogen-rich envelope extending as far as a few times . Because of the large density contrast between core and envelope, the core structure of such a star is insensitive to the envelope mass. Therefore, we expect the structures of the two cores to be hardly affected even upon the formation of a common envelope, and also once the cores coalesce in such a common-envelope scenario. The details of such a phenomenon is a complicated dynamical, three-dimensional process. All we can do here is to speculate that the emergent object is a star with a helium core whose mass is about a sum of the two initial cores. The remaining H-rich envelope mass, on the other hand, is supposedly significantly smaller than the sum of the masses of the original envelopes because a large amount of the tenuous envelopes is likely to be expelled from the system during the merging process (e.g. Ivanova et al., 2013, and references therein).
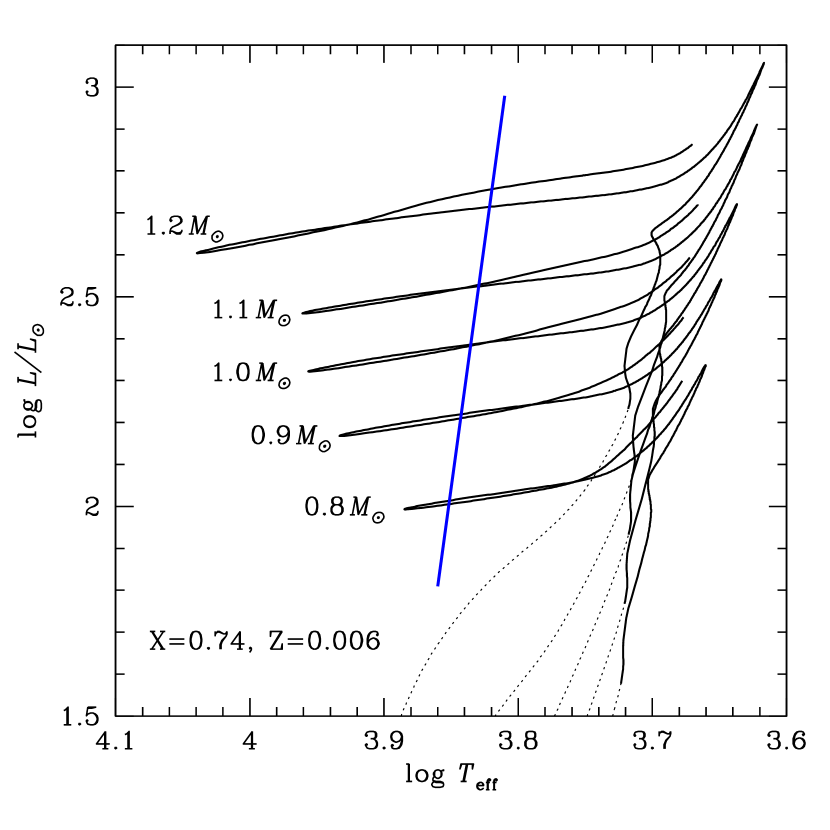
To obtain rough one-dimensional models that represent what we expect to emerge at the end of a coalescence and to emulate their evolution through the ensuing He core-burning stage, we computed, resorting again to MESA, respective model stars with . To approximate the expected partial mixing around the merging cores on their way to become about twice as massive as that of normal evolution, extensive overshooting from the H-burning core was invoked. Overshooting was computed with the prescription of exponentially decaying mixing as implemented in MESA, in which a parameter measures the scale-length ( with being the pressure scale-height) of the exponential decay of the mixing efficiency above the convective core (Herwig, 2000). The quantity was varied in the range of with the aim to obtain evolutionary tracks that take the stars through the CIS. Appropriate values of were found by trial-and-error, whereas larger values were required for smaller-mass models. With the very large overshooting as adopted here, He core masses between and resulted so that helium ignited non-degenerately at the center. Extended loops occurred during He core-burning if the ratio of envelope mass to the total mass was about or less (Fig.10). However, once the ratio got too small (e.g. being too large), He core-burning took place in regions hotter than the blue-edge of the CIS.
Figure 11 shows the periods of fundamental (filled blue circles) and first-overtone (blue asterisks) modes at the respective blue edges in the P-WI diagram showing again LMC observations in lighter grey. The size of the symbols reflects the mass of the model pulsators, ranging from to . As mentioned before, sufficiently extended blue loops occur for choices within a narrow range only. Larger values of yield more luminous models, the resulting P-WI relation, as presented in Fig. 11, remained nonetheless insensitive to the particular choice of .
According to Fig. 10, mergers apparently obey a unique relation in the region of the CIS; this translates into a tight P-WI relation with a well expressed mass segregation along the relation (Fig. 11). Lower-mass models were found at shorter periods and lower luminosities; the opposite applied to the more massive stars. The O1 P-WI relation is again well separated from the F mode; at constant period the O1 pulsators appear to be about mag brighter than an F-mode sibling (in other words, at a given brightness, the log of the period of an O1 pulsator is shorter by compared with that of an F-mode pulsator; the period ratio of O1 to F mode is hence about ). The numerical values of the linear least-square fits to the ‘Case Merger’ data are displayed in Tab. 1.
The He-core masses of at helium ignition of a merged star can be thought to originate from two stars with respective core masses on the FGB between about and . An isolated star (without overshooting) develops a He core of about at the base of the FGB (at an age of Myrs) and it reaches about at He ignition (at about Myrs). A star develops a He core of about up to the onset of He burning at an age of about Myrs. Therefore, the masses of the progenitors of our merger models should be and the age of the merger products therefore older than about Myrs.
6 Discussion
Remnants of close-binary interaction, be they donors, accretors, or even mergers have been shown to evolve into the CIS and to develop overstable radial pulsations with AC-compatible periods. We looked into the special case of the LMC because it hosts a respectable sample of ACs pulsating in either F or O1 modes. Furthermore, the LMC as a stellar system is commonly assigned a heavy-element abundance of about , with some spread in both directions. The scenario of single-star evolution that takes stars through the CIS and produces He core-burning pulsators is challenged by stellar systems with abundances of heavy elements exceeding (Fiorentino & Monelli, 2012).
| Source | F modes | O1 modes |
|---|---|---|
| OGLE LMC | (-2.97,15.59) | (-3.38, 16.03) |
| Case Bc-A | (-3.16,-2.47) | (-3.26, -2.92) |
| Case Merger | (-3.50,-1.63) | (-3.52, -2.16) |
In this paper we demonstrated that Case Bc MT generated accretor remnants with and masses between and crossed the CIS with F and O1 periods compatible with observed ACs. The slopes of the P-WI relations are comparable to the observed one (cf. Fig. 7). Adopting, as always in this study, a distance modulus of 18.5 mag to the LMC, the accretor P-WI relation is about to mag too bright, however.
Considering donors as AC candidates, we found remnants with masses between and about and with heavy element abundances as high as that crossed the CIS with F and O1 periods in the range of observed ACs in the LMC (cf. Fig. 9). The blue-edge data of the donors scattered considerably on the P-WI plane; not so much as to be incompatible with observations, but too much to find a useful linear fit to the blue-edge data. Compared with the accretor models and with observed LMC ACs, the donor models were systematically too faint at their blue edges. We estimate the computed blue edges to be subluminous by about 0.5 mag at a fixed period. The steepness of the computed blue-edge P-WI data, nonetheless, agree decently with observations.
Case Bc MT acts as an effective retardant to the evolutionary appearance of accretor remnants and as an evolutionary catalyst for donor remnants. Hence, depending on which component of a binary system develops into an AC, it can appear as either too young or too old compared with the dominating stellar population of the harboring stellar system. Linking such stars to their binary membership, however, resolves the discrepancy. Depending on the star-formation history of a stellar aggregate, the situation must be expected to become rather complicated if a mixture of single-star and various close-binary scenarios contribute to the population of variable stars.
We observed that the donor- and accretor-remnant ACs inherit their central properties from their precursors: Low-mass donor remnants started to burn helium nondegenerately in their centers whereas intermediate-mass accretor remnants began helium burning off-center under degenerate conditions with one or a few flashes during which burning propagated to the stars’ centers. Hence, in contrast to the single-star scenario for ACs, binary remnants evolve into the CIS after either degenerate (i.e. He-flash) or quiet non- or weakly-degenerate He ignition.
The possible case of MT resulting in the coalescence of the two binary components was adopted here as the merger scenario contributing to the source of some ACs. The coarse modeling led to AC-like pulsators for masses above about with sufficiently overgrown helium cores, exceeding about . The mass of the helium cores was adjusted via an unusually large overshooting parameter in the H-burning core of the precursors. Helium burning started quietly in the merger models and blue-loops crossing the CIS were encountered for heavy-element abundances as high as . Hence, in a stellar system like the LMC merger remnants belonging even to a rather recent star generation could naturally contribute to its AC population.
The merger P-WI relations of the blue edges of the merger models are tight and the slopes compare well to the LMC observations of OGLE project. As for the accretor and the donor cases, the brightness of the relation at fixed period does not fit. In the merger case, the relation is subluminous, roughly at the level of the donor cases (compare Figs. 11 and 9). In contrast to the accretor case, no obvious metallicity dependence was found of the blue-edge P-WI relations. Static stellar models with unusually massive helium cores were constructed to coarsely emulate the products of stellar mergers. The violent merging process, whose details probably depend on the masses and evolutionary states of the coalescing stars, was completely disregarded. The system-specific differences during coalescence must be expected to affect the subsequent helium core-burning stage and to eventually inflict scatter on the P-WI relation.
Obvious Case A mass transfer was also looked into, and it was able to produce components that entered the CIS in the mass range of interest for ACs. The fine-tuning of the initial orbital separation was considerable, however. To find a way through semi-detached binary evolution avoiding full contact, the orbital separation had to be finely tuned to within about . Therefore, we omitted such a path in this first study because it seemed to be even more unlikely to be taken as a viable path to ACs compared to the binary scenarios we discussed here.
Details of the orbital separation of the binaries proved not to be crucial as long as the separation was chosen large enough so that the primary filled its Roche radius along the FGB with the convective envelope being deep to ensure robust case Bc MT.
Karczmarek et al. (2016) pointed out recently that the influence of binary components, termed BEP (Binary Evolved Pulsators) in their paper, also in samples of classical pulsators should not be undervalued. Stellar population synthesis simulations predict that a fair number of remnants of close binary interactions must be expected and that the fraction of such candidates increases towards higher luminosities in the CIS. Our study shows that binary components can be expected to be a part of the AC family of pulsators – complicating the quest to understand the origin of the group of variables; on the other hand, binary remnants open an alternative window to the star formation history of the hosting stellar system.
The Wesenheit – the essence – of the Wesenheit-index is its being free of interstellar extinction, as long as the ratio of extinction to color excess remains constant for the stars to which it is applied. It furthermore reduces the scatter of the data on the P-WI plane by diminishing the intrinsic width of the CIS because lines of constant period have a component along the extinction vector (cf. Madore & Freedman, 1991), which varies depending on the chosen photometric indices. Examining Fig. 1 and comparing it with say Fig. 12 or even better, inspecting the observational data in the same panel (Fig. 5 of Soszyński et al., 2015), reveals that AC F-mode pulsators in particular exhibit a substantial residual scatter which exceeds the one of the Classical Cepheids. The effect of the finite width of the CIS should, however, be about the same for the two neighboring families of pulsators. Individual deviations of the ratio of reddening to color index of AC variables might, however, be a cause of the fan out of the P-WI relation; an definite answer requires a star by star analysis. On the other hand, according to our exploratory computations, the presence of binary components in the AC population of the LMC would contribute to the blurring of the P-WI relation.
7 Conclusions
Although the results of this paper are far from exhaustive they can be considered a proof-of-concept that remnants of close-binary interactions can make it through the CIS and pulsate radially with F- and O1-mode periods that compare well to observed ACs. Binary scenarios can hence complement the single-star explanations of these variable stars with the additional benefit of higher stellar Z-abundances that still lead to CIS crossings.
The mass range of AC candidates resulting from close-binary MT as computed here must be seen as lower bounds. Furthermore, we did not account for those low-mass stars whose loops extend into the CIS but do not extend far enough to cross the respective blue edges, and we neglected non-conservative mass-transfer.
If binary components are also to be admitted in the AC family then a much less well-defined mass-luminosity relation must be expected to be encountered. Specifically, the masses of AC variables would embrace a broader range than anticipated hitherto, when invoking single-star evolution only (e.g. Fiorentino & Monelli, 2012).
The binary orbits of the post – Bc MT models were seen to grow to the order of days by the time the remnants reached the instability strip; accordingly, the associated orbital speeds of ACs are as low as a few kilometers per second. The observable binary indicators are therefore weak enough so that they might have been either technically inaccessible or having been overlooked so far. One prediction of our scenario is therefore that those ACs that descend from close binary interactions via a case Bc mass transfer show, caused by their wide binary orbit, radial velocity variations on the time scale of several hundred days with amplitudes of a few kilometers per second. If the Gaia mission can contribute to a clarify the situation remains to be seen; after all, a proper phasing of pointings would be necessary to get a decent radial-velocity coverage that allows to disentangle pulsations and binary orbit.
In the case of donors turned to ACs, we predict that cases of ACs with helium-enriched envelopes should be observed; such cases might serve as spectroscopic tracers of their evolutionary past.
The modest CPU power which was available for this proof-of-concept study required simplifications on various levels of modeling. Systematic surveys of a much larger binary parameter space are, though, readily accessible to more capable computer systems. The data from such approaches are necessary to solidify the picture advocated here.
The persisting, complete absence of double-mode ACs in the observations of all stellar systems and the Galactic field remains intriguing. Linear modeling shows no signs of structural anomalies that hint at unusual excitation properties of either F or O1 modes; to the best of the authors’ knowledge also the nonlinear modeling has been of no help so far in this respect.
Acknowledgements
This research has made use of NASA’s Astrophysics Data System Bibliographic Services. The computations were made possible by the generous open-source philosophy of the MESA and GYRE code developers.
References
- Baraffe et al. (1998) Baraffe I., Alibert Y., Méra D., Chabrier G., Beaulieu J.-P., 1998, ApJ, 499, L205
- Bossini et al. (2015) Bossini D., et al., 2015, MNRAS, 453, 2290
- Catelan & Smith (2015) Catelan M., Smith H., 2015, Stellar Pulsations. Wiley-VCH
- Fiorentino & Monelli (2012) Fiorentino G., Monelli M., 2012, A&A, 540, A102
- Fiorentino et al. (2012) Fiorentino G., Stetson P. B., Monelli M., Bono G., Bernard E. J., Pietrinferni A., 2012, ApJL, 759, L12
- Gautschy (2012) Gautschy A., 2012, ArXiv:1208.3870 [astro-ph]
- Herwig (2000) Herwig F., 2000, A&A, 360, 952
- Ivanova et al. (2013) Ivanova N., et al., 2013, A&ARv, 21, 59
- Karczmarek et al. (2016) Karczmarek P., Wiktorowicz G., Iłkiewicz K., Smolec R., Stępień K., Pietrzyński G., Gieren W., Belczynski K., 2016, arXiv:1612.00465 [astro-ph]
- Madore & Freedman (1991) Madore B. F., Freedman W. L., 1991, PASP, 103, 933
- Martinez-Vazquez et al. (2016) Martinez-Vazquez C. Inez-Vazquez C. E., et al., 2016, MNRAS, 462, 4349
- Paxton et al. (2011) Paxton B., Bildsten L., Dotter A., Herwig F., Lesaffre P., Timmes F., 2011, ApJS, 192, 3
- Paxton et al. (2013) Paxton B., et al., 2013, ApJS, 208, 4
- Paxton et al. (2015) Paxton B., et al., 2015, ApJS, 220, 15
- Sipahi et al. (2013a) Sipahi E., İbanoǧlu C., Çakırlı O., Dal H. A., Evren S., 2013a, Rev. Mex. Astron. Astrophys., 49, 239
- Sipahi et al. (2013b) Sipahi E., İbanoǧlu C., Çakırlı O., Evren S., 2013b, MNRAS, 429, 757
- Soszyński et al. (2008) Soszyński I., et al., 2008, Acta Astron., 58, 163
- Soszyński et al. (2015) Soszyński I., et al., 2015, Acta Astron., 65, 233
- Stetson et al. (2014) Stetson P. B., Fiorentino G., Bono G., Bernard E. J., Monelli M., Iannicola G., Gallart C., Ferraro I., 2014, PASP, 126, 616
- Sugimoto & Nomoto (1980) Sugimoto D., Nomoto K., 1980, Space Sci. Rev., 25, 155
- Worthey & Lee (2011) Worthey G., Lee H.-c., 2011, ApJS, 193, 1
- Zinn & Searle (1976) Zinn R., Searle L., 1976, ApJ, 209, 734
Appendix A Ansatz-Validation with LMC Classical Cepheids
To inspect the performance of the simplified pulsation treatment adhered to in this paper a few intermediate-mass star models were evolved into their Cepheid phase. Observations from the OGLE project give access to a rich population of Classical Cepheids in the LMC (Soszyński et al., 2008), which served as fiducial data set. Model data at the blue edges of the F- and O1-mode instability regions on the P-WI plane were computed to be compared with the OGLE observations in Fig. 12.
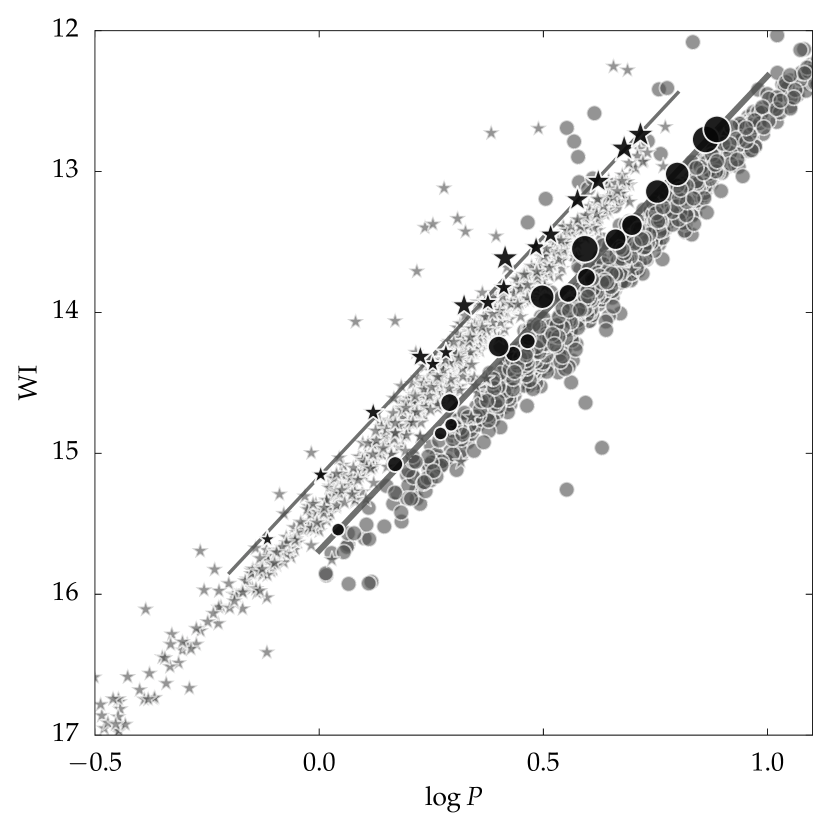
The model data for Fig. 12 were computed on evolutionary models with , Schwarzschild criterion to treat convection adopting , as suggested in Baraffe et al. (1998). The F- and O1-mode blue-edge data points plotted in the figure result from first to third crossing of the CIS of model stars with masses between and ; the marker sizes scale with stellar mass.
Even though the perturbation of the convective flux in the pulsation equations was neglected, Fig. 12 proves that location and slopes of F- and O1-mode blue edges agree very well with the observed LMC Classical Cepheids having periods shorter than roughly days. The slopes of the linear fits to the blue-edge computations and the slopes of the observed F- and O1-pulsators’ ridge-lines differ by less than . Visual inspection of Fig. 12 shows that the computed positions of the blue-edges also perform well as borders to observational data when adopting a distance modulus to the LMC of magnitudes again.
The LMC ACs pulsate with periods typically shorter than days. Hence, they are hotter than most of the Classical Cepheids considered here and they have shallower convection zones, so that the effect of convection on structure and pulsations is further diminished. We are therefore positive that the frozen-in convective flux treatment in the pulsation equations is good enough for this study of effect of binary components on the AC variable-star population.