11email: spavone@na.astro.it 22institutetext: University of Naples Federico II, C.U. Monte Sant’Angelo, Via Cinthia, 80126, Naples, Italy 33institutetext: INAF-Astronomical Observatory of Teramo, Via Maggini, 64100, Teramo, Italy 44institutetext: Institute for Computational Cosmology, Durham, UK 55institutetext: Centre for Astrophysics & Supercomputing, Swinburne University, Hawthorn, VIC 3122, Australia
VEGAS: A VST Early-type GAlaxy Survey
Observations of diffuse starlight in the outskirts of galaxies are thought to be a fundamental source of constraints on the cosmological context of galaxy assembly in the CDM model. Such observations are not trivial because of the extreme faintness of such regions. In this work, we investigate the photometric properties of six massive early type galaxies (ETGs) in the VEGAS sample (NGC 1399, NGC 3923, NGC 4365, NGC 4472, NGC 5044, and NGC 5846) out to extremely low surface brightness levels, with the goal of characterizing the global structure of their light profiles for comparison to state-of-the-art galaxy formation models. We carry out deep and detailed photometric mapping of our ETG sample taking advantage of deep imaging with VST/OmegaCAM in the g and i bands. By fitting the light profiles, and comparing the results to simulations of elliptical galaxy assembly, we identify signatures of a transition between “relaxed” and “unrelaxed” accreted components and can constrain the balance between in situ and accreted stars. The very good agreement of our results with predictions from theoretical simulations demonstrates that the full VEGAS sample of ETGs will allow us to use the distribution of diffuse light as a robust statistical probe of the hierarchical assembly of massive galaxies.
Key Words.:
Techniques: image processing – Galaxies: elliptical and lenticular, cD – Galaxies: fundamental parameters – Galaxies: formation – Galaxies: halos1 Introduction
LCDM galaxy formation theories predict that galaxies grow through a combination of in situ star formation and accretion of stars from other galaxies (White & Frenk, 1991). The ratio of stellar mass contributed by these two modes of growth is expected to change systematically over the lifetime of a galaxy as its dark matter halo and star formation efficiency evolve (e.g. Guo & White, 2008). Accreted stars are expected to dominate in the outer parts of galaxies because they have much lower binding energies in the remnant system than stars formed by dissipative collapse. Since dynamical timescales are long in these outer regions, phase-space substructures related to accretion, such as streams and caustics, can persist over many gigayears.
The structural properties of the outer parts of galaxies and their correlations with stellar mass and other observables might therefore provide ways of testing theoretical predictions of growth by accretion. For example, they could constrain the overall ratio of stars accreted to those formed in situ, the number of significant progenitors and the dynamics of the most important merger events (Johnston et al., 2008; Cooper et al., 2010; Deason et al., 2013; Amorisco, 2015). In support of this idea, cosmological simulations of galaxy formation predict trends in these quantities with mass that are responsible for systematic variations in the average shape, amplitude and extent of azimuthally averaged surface brightness profiles (Font et al., 2011; Cooper et al., 2013; Pillepich et al., 20.pdf14). Unfortunately, the accreted debris is also expected to have extremely low surface brightness ( 29 mag/arcsec2) on average and therefore to be very hard to separate from the background sky in conventional photometric observations.
In this paper we use extremely deep images of six massive early type galaxies (ETGs) from the VEGAS survey (described below) to constrain the properties of their accreted stellar components. The brightest ETGs are thought to be predominantly the central galaxies of the most massive DM halos at the present day (e.g. Frenk et al., 1985; Kauffmann et al., 1993; De Lucia et al., 2006). In order to explain the exponential high-mass cut-off of the galactic stellar mass function, theoretical models have invoked processes whereby in situ star formation in such halos is strongly suppressed at late times (e.g. Bower et al. 2006). As a consequence, massive ETGs in these models accumulate the bulk of their stellar mass by accretion, predominantly through mergers (in the case of massive BCGs; De Lucia & Blaizot 2007; Cooper et al. 2015) of low stellar mass ratio. Their spheroidal morphology is thought to arise from violent relaxation of the central potential during the most massive of these mergers, which can erase coherent structures established by earlier dissipative star formation (Villumsen, 1983; Cole et al., 2000; Hilz et al., 2012). The same models predict a rather different relationship between mass growth and structure for late type galaxies (LTGs) in less massive dark matter halos, like the Milky Way. In LTGs, the vast majority of stars are formed in situ in rotating discs that survive to the present day, while the bulk of the accreted stars are contributed by one or two objects of much lower mass and are mostly deposited on weakly-bound orbits extending far from the center of the potential. These models therefore imply a natural but complex continuum between the properties of the dominant stellar components of ETGs and those of the diffuse spheroidal ‘stellar halos’ around LTGs like the Milky Way, all of which originate from the same hierarchical accretion process (Purcell et al., 2007; Cooper et al., 2013).
From an observational perspective, it is straightforward to separate the disc and stellar halo components of LTGs because their mass, kinematics, spatial distribution and stellar populations are very different. Moreover, with relatively little ambiguity, the empirically-defined stellar halo can be identified with the bulk of the accreted stellar mass in those galaxies and the disc with the bulk of in situ stellar mass. In ETGs, however, the connections between different mechanisms of mass growth and the ‘structural components’ inferred from images are much less straightforward. If the bulk of the stars are really accreted, then the ‘stellar halo’ (or ‘spheroid’ or ‘classical bulge’) should be identified with at least the structural component that dominates the observed stellar mass. However, other empirical ‘components’ might also be accreted. In situ stars in ETGs will be extremely difficult to distinguish if they are also spheroidal, dispersion-supported and have old, metal-rich stellar populations resembling those of the dominant accreted component(s), with which they have been thoroughly mixed by violent relaxation111In the extreme case of a merger between two identical elliptical galaxies in identical DM halos, it would clearly be impossible to differentiate between the ‘in situ’ component and the ‘accreted’ component in the surface brightness profile of the remnant..
Cosmological dynamical simulations can help by suggesting plausible interpretations for features in the surface brightness profiles of ETGs in the context of specific galaxy formation theories. In particular, simulated galaxies show evidence for substructure in the form of inflections (‘breaks’), at which the surface brightness profile either becomes steeper or shallower (e.g. Cooper et al., 2013; Rodriguez-Gomez et al., 2016). As noted above, models predict that the accreted components of ETGs comprise several equal-size chunks of stellar mass from different contributors, but also that these contributors have a range of relative total (virial) mass ratios, such that their debris will relax to distributions with a range of characteristic radii (Amorisco, 2015). As shown for example in figure 10 of Cooper et al. (2015), inflections in the profile may therefore correspond not only to the transition between in situ and accretion dominance (which is responsible for the most obvious profile inflection for most LTGs, although this occurs at relatively low SB; Abadi et al. 2006; Font et al. 2011; Pillepich et al. 20.pdf14; Rodriguez-Gomez et al. 2016) but more generally to variations in the ratio between individual accreted components as a function of radius (Cooper et al., 2010; Deason et al., 2013; Amorisco, 2015). Indeed, for the reasons given above, most simulations222The exception being simulations that do not strongly suppress in situ star formation in very massive galaxies, which are generally in disagreement with observed luminosity functions. predict that the transition between in situ and accretion-dominated regions should be almost imperceptible in the azimuthally averaged profiles of typical ETGs, even though it occurs at relatively high SB. This transition may still be detectable as a change in shape or stellar population.
Observational work has clearly identified features in ETG surface brightness profiles and kinematic distributions indicative of substructure in the accreted component (Bender et al., 2015; Longobardi et al., 2015a; Longobardi et al., 2015b; Foster et al., 2016). Some of these feature occur at distances of many effective radii and hence at very low SB, which could be interpreted as evidence for multiple accreted components in the context of the models mentioned above. Using different techniques with observations of different depths, several authors have concluded that the profiles of massive ETGs are not well described by a single Sérsic law component, once thought to be near-universal for spheroidal galaxies. For example, Gonzalez et al. (2005) found that the surface brightness profiles of BCGs in their sample were well fitted by a double de Vaucouleurs law, while other works have argued that a combination of a Sérsic and an exponential () component provide the best description of particular ETG light profiles (Seigar et al., 2007; Donzelli et al., 2011; Bender et al., 2015). Huang et al. (2013) have suggested three or more Sérsic components may be required for an accurate description of typical ETGs.
A recent revival of this topic, historically hampered by the faintness of galaxian halos (de Vaucouleurs & Capaccioli, 1979; D’Onofrio et al., 1994), has been fostered by the coming into operation of a new generation of very-wide-field imaging instruments (Ferrarese et al., 2012; Mihos et al., 2013; Duc et al., 2015; Capaccioli et al., 2015; Iodice et al., 2016). We are taking advantage of the wide field of view and high spatial resolution of the VLT Survey Telescope (VST; Capaccioli & Schipani 2011) at the ESO Cerro Paranal Observatory (Chile) to carry out a multiband imaging survey of nearby ETGs, named VEGAS (VST Early-type GAlaxies Survey) (Capaccioli et al. 2015; hereafter Paper I). The primary aim of the survey is to obtain maps of the surface brightness of galaxies with Heliocentric redshifts km/s and mag sufficiently deep to detect the signatures of diffuse stellar components (the expected depths are , , and mag/arcsec2). The large, homogeneous and deep sample from VEGAS will enable a more systematic analysis of ETG light profiles and other photometric trends with radius than has previously been possible. We expect to obtain deep images for a sample of ETGs across a range of environments. To date, we have collected data for about thirty galaxies. The present status of VEGAS observations is regularly updated at the link http://www.na.astro.it/vegas/VEGAS/VEGAS_Targets.html.
The subsample of VEGAS galaxies that we study here are listed in Tab. 1 together with their basic parameters. These galaxies have been chosen because of their large angular dimensions, and because they are the brightest galaxies in their local environment. Here we present and analyse the g and i-band photometric properties of the four galaxies NGC 4365, NGC 3923, NGC 5044 and NGC 5846, which are in small groups and clusters. We combine these results with those presented in Paper I for NGC 4472 in the Virgo cluster, and in Iodice et al. (2016) for NGC 1399 in the Fornax cluster. Since both NGC 4472 and NGC 1399 are targets of the VEGAS survey and have been observed with VST, together with the other objects they represent a homogeneous sample of bright ETGs.
The paper is organized as follows. In Sec. 2 we describe the galaxies in our sample and their main properties. The observing strategy and the data reduction procedure are described in Sec. 3, while the data analysis is presented in Sec. 4 and 5. In Sec. 6 we compare our data with theoretical predictions, and in Sec. 7 we discuss our results and draw conclusions.
2 The sample
We briefly describe here the main properties of the four galaxies analyzed in this work, NGC 3923, NGC 4365, NGC 5044 and NGC 5846, and those of NGC 4472 and NGC 1399 (published in Paper I and by Iodice et al. (2016), respectively).
| Parameter | Value | Ref. |
|---|---|---|
| NGC 1399 | ||
| Morphological type | E1 | RC3 |
| R.A. (J2000) | 03h38m29.0s | NED |
| Dec. (J2000) | -35d27m02s | NED |
| Helio. radial velocity | 1425 km/s | NED |
| Distance | 20.9 Mpc | Blakeslee et al. (2009) |
| Absolute magnitude | -23.05b𝑏bb𝑏bCorrected for interstellar extinction as in Burstein & Heiles (1982). | Iodice et al. (2016) |
| NGC 3923 | ||
| Morphological type | E4 | RC3 |
| R.A. (J2000) | 11h51m01.7s | NED |
| Dec. (J2000) | -28d48m22s | NED |
| Helio. radial velocity | 1739 km/s | NED |
| Distance | 22.9 Mpc | Tonry et al. (2001) |
| Absolute magnitude | -22.66b𝑏bb𝑏bCorrected for interstellar extinction as in Burstein & Heiles (1982). | This work |
| NGC 4365 | ||
| Morphological type | E3 | RC3 |
| R.A. (J2000) | 12h24m28.3s | NED |
| Dec. (J2000) | +07d19m04s | NED |
| Helio. radial velocity | 1243 km/s | NED |
| Distance | 23.1 Mpc | Blakeslee et al. (2009) |
| Absolute magnitude | -22.41a𝑎aa𝑎aCorrected for interstellar extinction as in Arrigoni Battaia et al. (2012). | This work |
| NGC 4472 | ||
| Morphological type | E2 | RC3 |
| R.A. (J2000) | 12h29m46.7s | NED |
| Dec. (J2000) | +08d00m02s | NED |
| Helio. radial velocity | 981 km/s | NED |
| Distance | 16.9 Mpc | Mei et al. (2007) |
| Absolute magnitude | -22.77a𝑎aa𝑎aCorrected for interstellar extinction as in Arrigoni Battaia et al. (2012). | This work |
| NGC 5044 | ||
| Morphological type | E0 | RC3 |
| R.A. (J2000) | 13h15m24.0s | NED |
| Dec. (J2000) | -16d23m08s | NED |
| Helio. radial velocity | 2782 km/s | NED |
| Distance | 31.19 Mpc | Tonry et al. (2001) |
| Absolute magnitude | -22.59b𝑏bb𝑏bCorrected for interstellar extinction as in Burstein & Heiles (1982). | This work |
| NGC 5846 | ||
| Morphological type | E0 | RC3 |
| R.A. (J2000) | 15h06m29.3s | NED |
| Dec. (J2000) | +01d36m20s | NED |
| Helio. radial velocity | 1712 km/s | NED |
| Distance | 24.89 Mpc | Tonry et al. (2001) |
| Absolute magnitude | -22.77b𝑏bb𝑏bCorrected for interstellar extinction as in Burstein & Heiles (1982). | This work |
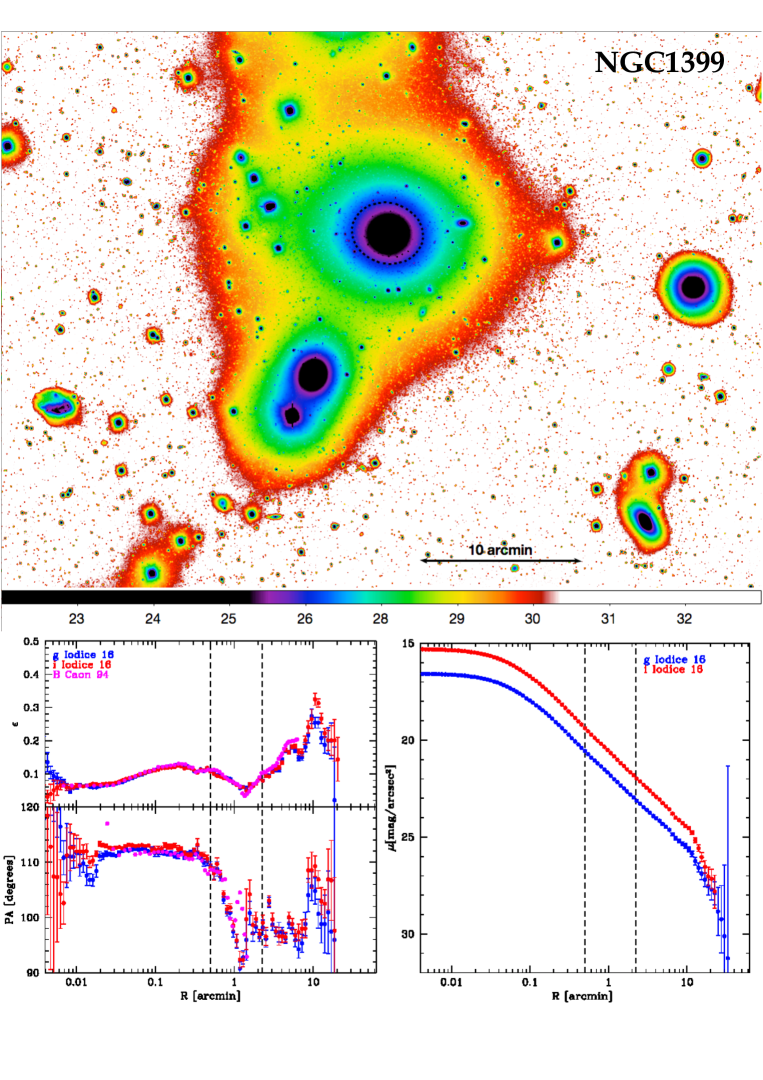
2.1 NGC 1399
NGC 1399 (FCC 213) is the central and brightest elliptical galaxy in the Fornax cluster. It has been extensively studied in a wide range of wavelengths. This galaxy has a vast and diffuse stellar envelope surrounding it (Iodice et al., 2016), as well as an extended and asymmetric gaseous halo in X-rays (Paolillo et al., 2002). NGC 1399 is the subject of a paper by Iodice et al. (2016), in which its main properties are discussed at length.
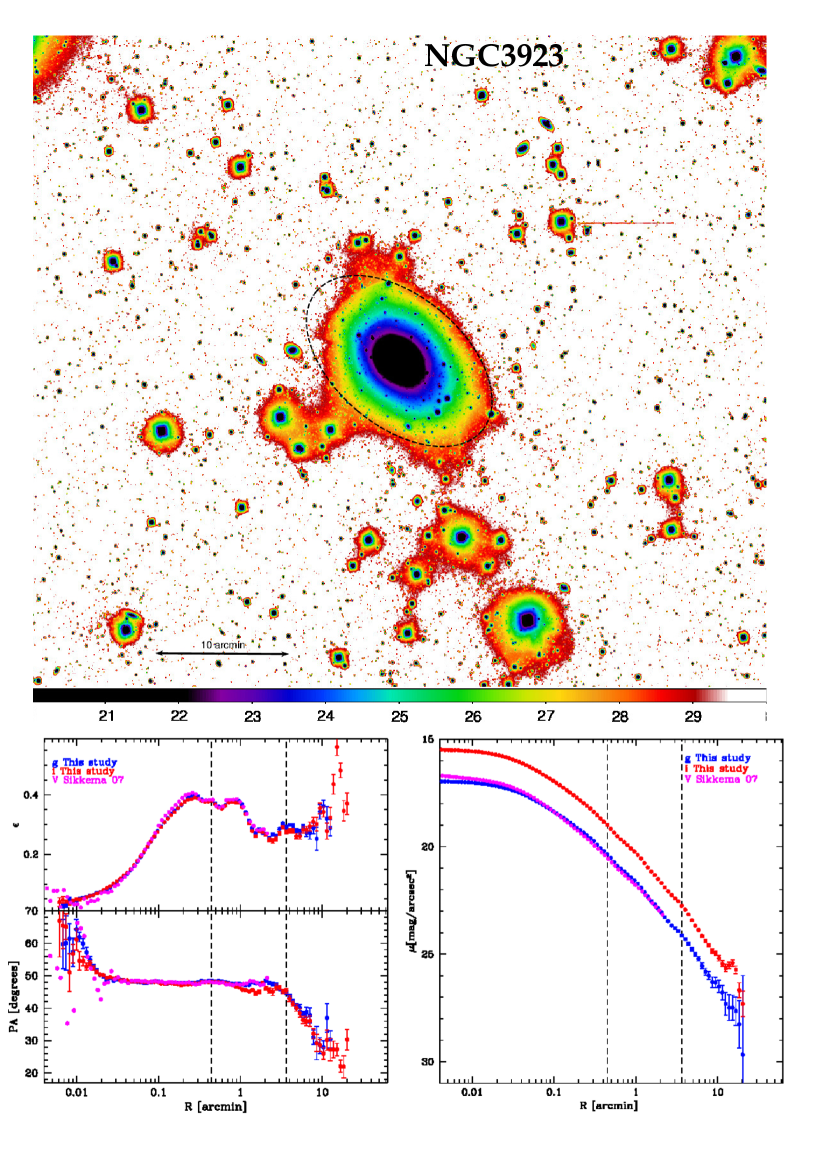
2.2 NGC 3923
NGC 3923, first studied by Malin & Carter (1980), is one of the best examples of a “shell galaxy”, with a vast system of peculiar, concentric shells. Sandage & Bedke (1994) found at least seven dwarf ellipticals in the field centered on NGC 3923, which is the brightest member of this small group. Carter et al. (1998) found that the galaxy has minor axis rotation. This could be either the result of a kinematically decoupled core, or evidence for a triaxial geometry. Buote & Canizares (1998), by studying the X-ray isophotes of NGC 3923, found evidence for a dark matter distribution more flattened and extended than the optical luminosity distribution.
2.3 NGC 4365
NGC 4365 (VCC 0731) is a bright and giant elliptical galaxy located in a group slightly behind the “Virgo subcluster B” centered on NGC 4472. It shows the presence of a small scale disc in the center, bluer than the surrounding galaxy (Ferrarese et al., 2006).
Peng et al. (2006) detected a significant population of globular clusters (GCs) around this object, with a specific frequency higher than in other galaxies of comparable luminosity, probably due to a larger number of red GCs. Moreover, Blom et al. (2012a, b) found the GC system to consist of three subpopulations.
Surma (1993) found evidence for two kinematically distinct stellar components: a bulge-like component and a disc-like subsystem. The most interesting kinematic features of NGC 4365 are its kinematically decoupled core (Davies et al., 2001) and that the galaxy rolls rather than rotates (Arnold et al., 2014). Bogdán et al. (2012) found an extended faint tidal tail between NGC 4365 and NGC 4342 in deep B-band images ( mag/arcsec2), which Blom et al. (2014) claimed to be a sign of ongoing interaction between the two galaxies.
2.4 NGC 4472
NGC 4472 (M49), a giant elliptical galaxy, is the brightest member of the Virgo cluster. It lies in the center of the southern grouping of the cluster, also known as “Virgo subcluster B”. This galaxy has been extensively studied by many authors (see e.g. Kim et al. 2000; Ferrarese et al. 2006; Kormendy et al. 2009; Janowiecki et al. 2010; Mihos et al. 2013) and, together with its companion galaxies, it was the subject of the first VEGAS paper (Capaccioli et al., 2015). NGC 4472 presents extended shells and fans of diffuse material, and Capaccioli et al. (2015) also detected an Intra Cluster Light (ICL) contribution to the surface brightness profile. Irwin & Sarazin (1996) found that the X-ray contours of NGC 4472 are elongated in the northeast-southwest direction, probably as a result of motion toward the center of the Virgo cluster.
2.5 NGC 5044
NGC 5044 is the central and brightest galaxy of a rich and X-ray bright group (Mendel et al., 2008). Dust patches near the center of the galaxy have been detected by Colbert et al. (2001). X-ray observations of NGC 5044 show two cavities and cooler filamentary X-ray emission, thought to have been caused by a dynamical perturbation induced by the accretion of a low mass satellite (Buote et al., 2003; Gastaldello et al., 2009).
2.6 NGC 5846
NGC 5846 is the optically most luminous galaxy in the center of its group. HST images show the presence of a “parabolic” dust lane around the nucleus of the galaxy. X-ray observations (Trinchieri & Goudfrooij, 2002) show a disturbed hot gas morphology on arcsecond scales. Haynes & Giovanelli (1991) found that the three dimensional distribution of galaxies around NGC 5846 is a prolate cloud, pointing toward the Virgo cluster.
3 The Vegas Survey: observation and data reduction
The VEGAS survey and the data reduction procedure adopted in this work are described by Capaccioli et al. (2015). The only significant change we make here concerns the sky background subtraction for objects with large angular extent (i.e. those filling the VST field of view). In Paper I we used a direct polynomial interpolation of regions surrounding our target galaxies that were identified as ‘background’ after masking of bright sources. This procedure, according to our experience, works very well to isolate a statistically significant area for the background interpolation when the target has a angular extent much smaller than the VST field. However, experience gained in reducing images of NGC 4472 highlighted the need for a different approach, which we develop here. This modified approach involves both observations and data reduction.
We decided to adopt a step-dither observing strategy for galaxies with large angular extent, consisting of a cycle of short exposures centered on the target and on offset fields ( degree). With such a technique the background can be estimated from exposures taken as close as possible, in space and time, to the scientific ones. This ensures better accuracy, reducing the uncertainties at very faint surface brightness levels, as found by Ferrarese et al. (2012). This observing strategy allowed us to build an average sky background of the night which was subtracted from each science image.
The main advantage of the step-dither technique is the possibility of obtaining a larger field around galaxies with larger angular sizes. This reduces uncertainties in distinguishing pixels belonging to the target galaxy from the background, particularly in the outskirts of the target. On the other hand, with this technique galaxy and background exposures are not simultaneous, and more telescope time is consumed with respect to the standard dithering strategy.
In the subsample of VEGAS analyzed in this work, the images of NGC 4472 and NGC 4365 were acquired with standard dithering strategy, while for NGC 1399, NGC 3923, NGC 5044 and NGC5846 we adopted the step-dither strategy.
The data used in this paper consist of exposures in g and i SDSS bands (Table 2) obtained with VST + OmegaCAM, both in service and in visitor mode with the following constraints:
-
•
S/N 3 per arcsec2;
-
•
dark time;
-
•
seeing 1”;
-
•
airmass 1.2.
| Object | Band | FWHMa𝑎aa𝑎aMedian value of the FWHM. | ||
|---|---|---|---|---|
| [sec] | [arcsec] | |||
| NGC 3923 | g | 9600 | 1.08 | |
| i | 12450 | 0.70 | ||
| NGC 4365 | g | 5475 | 0.86 | |
| i | 6125 | 0.73 | ||
| NGC 5044 | g | 14100 | 1.13 | |
| i | 4800 | 1.06 | ||
| NGC 5846 | g | 8550 | 0.96 | |
| i | 1650 | 0.90 |
By assuming the above values for the total integration time, the ETC for OmegaCam (version 6.2.0) ensures that we should reach a limiting magnitude in the B band of = 29 mag/arcsec2 ( 28.6 mag/arcsec2 in the g band) with a S/N 3 per arcsec2. The fainter magnitude levels of the azimuthally averaged surface brightness profiles are due to the increasing collecting area with the galactocentric radius.
All the data were processed with the VST-Tube pipeline (Grado et al., 2012). Details about the various steps of the data reduction are described in Appendix A of Capaccioli et al. (2015). The sky background subtraction procedure for data taken with the standard strategy is illustrated in Capaccioli et al. (2015).
For images taken with the step-dither technique, the only difference in our analysis concerns the estimation of the background. In these cases, an average sky image, relative to each night, was derived from the exposures of the offset fields, in which all bright sources were masked. The VST mosaics of galaxies in this work, showing the masking of bright sources in the field, are in Appendix A. This mean sky frame was then scaled to take into account transparency variations, and subtracted from the science frame (see Iodice et al. 2016 for details). In this paper, all magnitudes are quoted in the AB system.
4 Data analysis
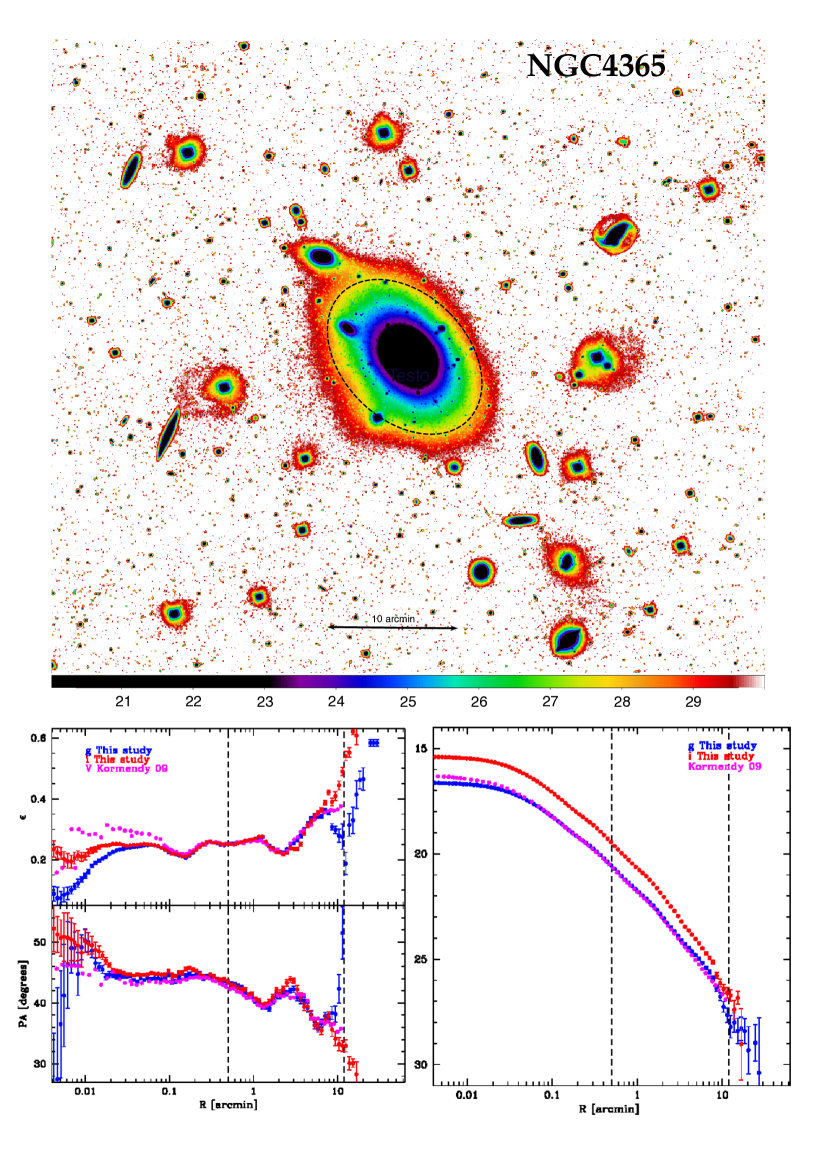
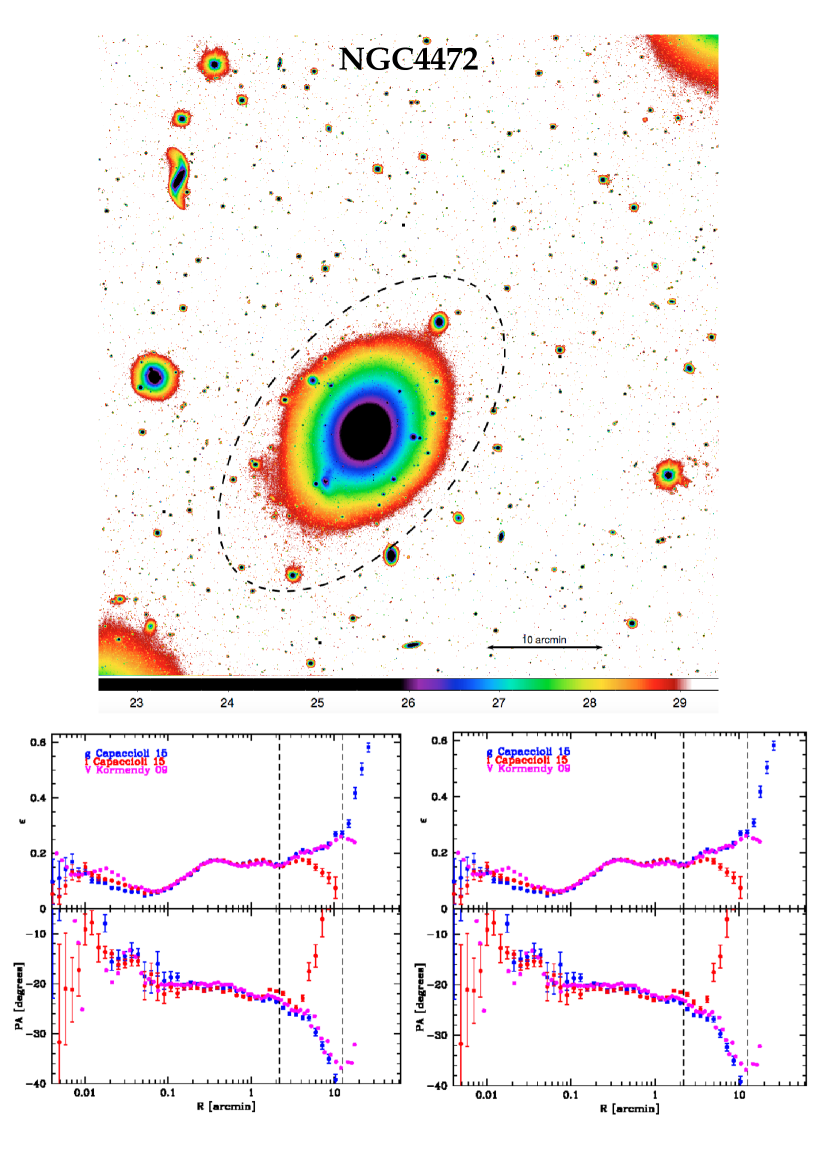
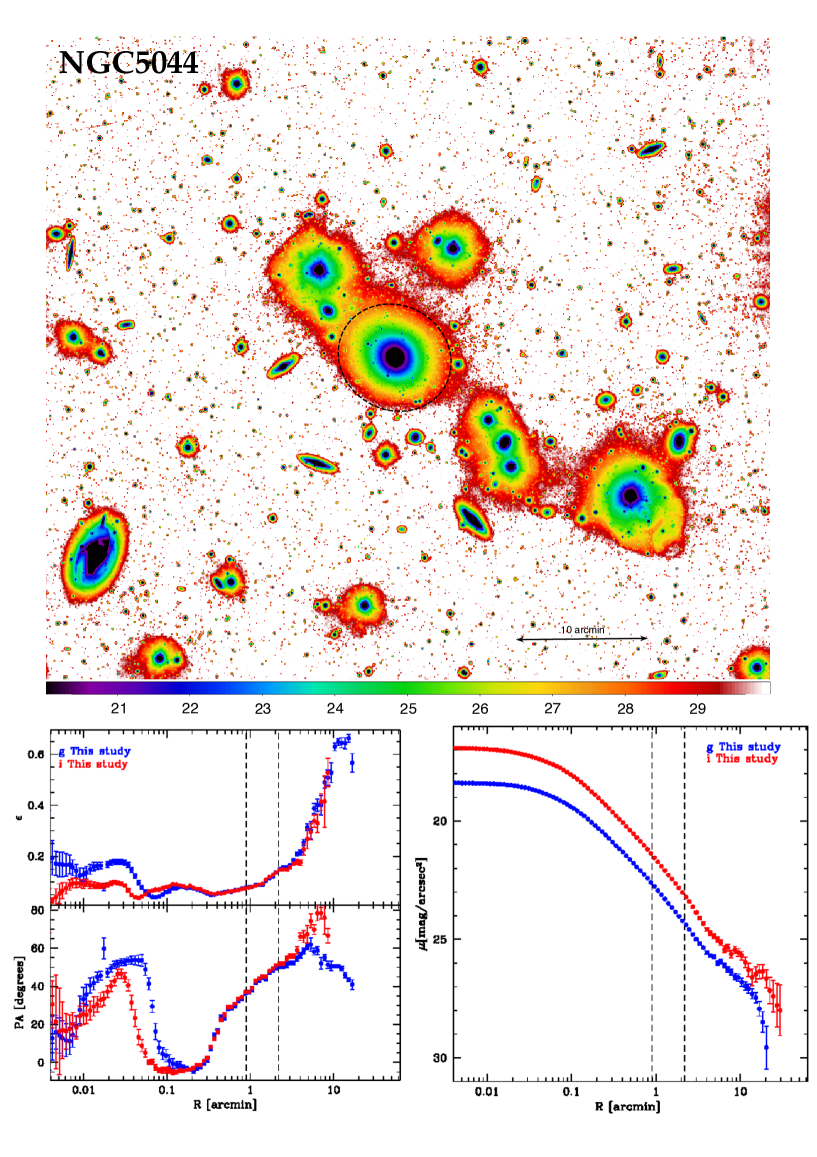
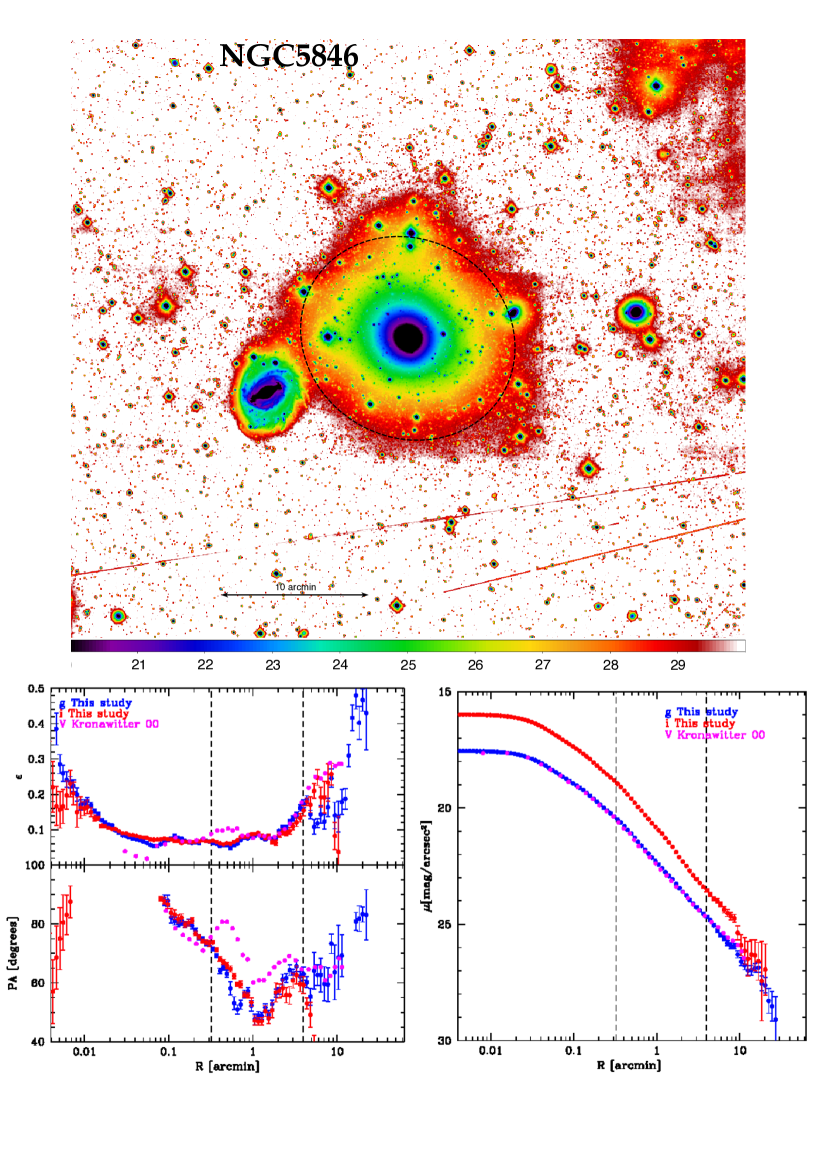
The most critical operation in deep photometric analysis is the estimation and the subtraction of the sky background. In Paper I we discuss pros and cons of a background subtraction made with the direct polynomial interpolation and by using a step-dither technique. After the background subtraction, described in Sec. 3, we applied the methodology described by Pohlen & Trujillo (2006) to quantify the sky variations and subtract any possible residuals. Following this procedure, on the sky-subtracted mosaics in both the g and i bands, we masked all the bright sources and used the IRAF555IRAF (Image Reduction and Analysis Facility) is distributed by the National Optical Astronomy Observatories, which is operated by the Associated Universities for Research in Astronomy, Inc. under cooperative agreement with the National Science Foundation. task ELLIPSE to extract azimuthally averaged intensity profiles in elliptical annuli out to the edges of the frame by fixing both the ellipticity () and the position angle (P.A.) to the values best describing the isophotes at the semi-major axis arcminute. By extrapolating the trend in the outer regions of these intensity profiles for each galaxy in our sample, we found that the error on the average value of the residual background is counts in the g band, and counts in the i band. These fluctuations of the sky background have been taken into account in the error estimates we quote on our surface brightness measurements. VST g band images of NGC 1399, NGC 3923, NGC 4365, NGC 4472, NGC 5044 and NGC 5846, colored by surface brightness, are shown in the top panels of figures 1, 2, 3, 4, 5, and 6 respectively.
In the bottom left panels of the same figures we show the ellipticity () and position angle (P.A.) profiles resulting from our isophotal analysis, performed by using the ELLIPSE task, leaving ellipticity and position angle free and sampling the semi-major axis with a variable bin (as described in Paper I). ELLIPSE computes the intensity, , azimuthally sampled along an elliptical path described by an initial guess for the isophote center, (X,Y), ellipticity, , and semi-major axis position angle, , at different semi-major axis lengths, . At a given , is expanded into a Fourier series as
| (1) |
according to Jedrzejewski (1987). The best-fit parameters are those minimizing the residuals between the actual and the model isophotes; and are the coefficients measuring the deviations from a pure ellipse, including the signature of boxiness and/or diskiness (Bender et al., 1989). At each iteration of the isophote fitting, an image sampling is performed. Three methods are available for sampling an image along the elliptical path: bi-linear interpolation, and either mean or median over elliptical annulus sectors. Integration over elliptical annulii is preferred, in order to extract all the information from an image and to avoid that some pixels in the image will never be sampled. For this reason, the SB profiles in this work have been extracted by performing a median over elliptical annuli, and by applying a k-sigma clipping algorithm for cleaning deviant sample points at each annulus. The combined use of the median and the sigma clipping algorithm improves the isophotal fitting, ensuring the rejection of not entirely masked features such as stars, defects, and outskirts of neighbouring galaxies.
For all the galaxies we find an increase of the ellipticity in the outer regions, indicating the presence of an more flattened outer component, with a significant gradient in the PA. We shall return to this point in Sec. 5.
In the bottom right panels we show g and i band VST surface brightness profiles, including comparisons with other measurements in the literature. No correction for seeing blurring is applied to the inner regions of the profiles. The offsets relative to the VST g band providing the best match to our photometry are +0.7 mag for the V band profile of NGC 3923 by Sikkema et al. (2007), +0.33 mag for the V band profile of NGC 4472 by Kormendy et al. (2009), +0.2 mag for the V band profile of NGC 4365 by Kormendy et al. (2009), and +0.23 mag for the V band profile of NGC 5846 by Kronawitter et al. (2000). Outside the seeing-blurred cores, despite the different color bands, the agreement with the literature is good. The reliability of the surface brightness measurements in the faint outskirts of the galaxies, has been tested by extracting the surface brightness profiles in azimuthal sectors (see App. B for details). The errors associated with our surface brightness measurements were computed as in Paper I, and take into account both the uncertainties on the photometric calibration and on sky subtraction. All the profiles are very extended and deep ( mag/arcsec2), and the azimuthally averaged surface brightness of the four objects spans almost one dex.
As in Paper I, we use the luminosity profiles of the galaxies, together with their ellipticity profiles, to compute the growth curves, which we extrapolate to the derive total magnitudes , effective radii and corresponding effective magnitude (Tab. 3).
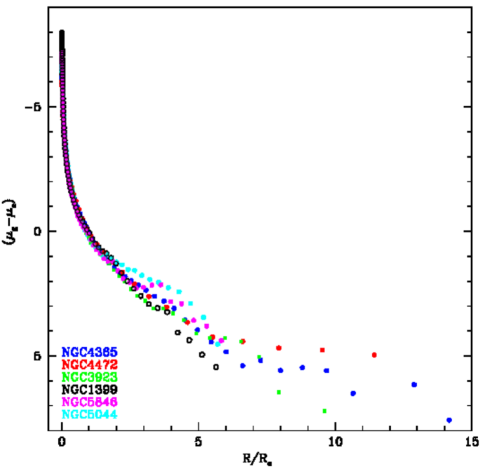
In Fig. 7, we plot all the profiles as a function of galactocentric radius normalized to the effective radius . This comparison shows that, in our sample, we have two kinds of profile: those having an ‘excess’ of light in the outer regions, which tend to flatten in the outer regions, and those for which the surface brightness falls off more rapidly. The differences in the shape of the light profiles may be signatures of different dynamical states for the stellar halos surrounding these galaxies; we will discuss this point in Sec. 7.
| Object | |||||||||||||||
|---|---|---|---|---|---|---|---|---|---|---|---|---|---|---|---|
| [Mpc] | [mag] | [mag] | [mag/arcsec2] | [arcmin] | [kpc] | [mag] | [mag] | [mag/arcsec2] | [arcmin] | [kpc] | [mag] | [mag] | |||
| (a) | (b) | (b) | (c) | (c) | (c) | (c) | (c) | (c) | (d) | (d) | |||||
| NGC 1399 | 20.9 | 0.05 | 0.04 | 24.55 | 5.87 | 35.65 | 8.55 | -23.05 | - | 5.05 | 30.70 | 7.51 | -24.09 | 0.095 | 0.203 |
| NGC 3923 | 22.9 | 0.31 | 0.17 | 23.22 | 2.55 | 16.97 | 9.14 | -22.66 | 22.30 | 3.15 | 20.98 | 7.78 | -24.02 | 0.356 | 0.292 |
| NGC 4365 | 23.1 | 0.08 | 0.04 | 22.82 | 1.90 | 12.79 | 9.41 | -22.41 | 21.15 | 1.40 | 9.41 | 8.52 | -23.30 | 0.238 | 0.282 |
| NGC 4472 | 16.9 | 0.08 | 0.04 | 22.68 | 2.70 | 13.29 | 8.37 | -22.77 | 22.23 | 4.22 | 20.73 | 6.92 | -24.22 | 0.137 | 0.205 |
| NGC 5044 | 31.2 | 0.26 | 0.14 | 25.04 | 3.55 | 32.20 | 9.88 | -22.59 | 24.20 | 3.65 | 33.13 | 8.76 | -23.71 | 0.068 | 0.340 |
| NGC 5846 | 24.9 | 0.21 | 0.11 | 24.72 | 4.62 | 33.41 | 9.21 | -22.77 | 23.32 | 3.70 | 26.80 | 7.99 | -24.00 | 0.067 | 0.167 |
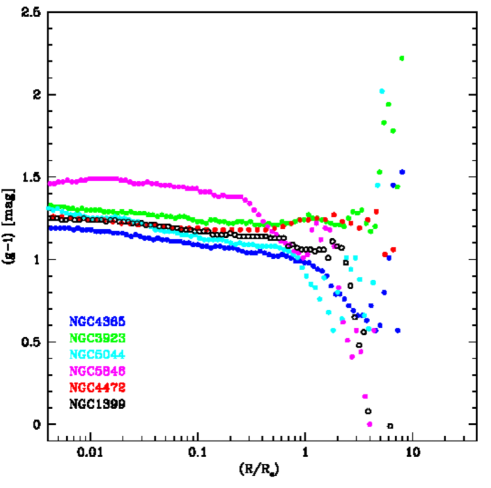
The mean (g-i) color profiles for galaxies in our sample are shown in right panel of Fig. 7. The (g-i) color profile for NGC 1399 is from Iodice et al. (2016), while that for NGC 4472 is from Capaccioli et al. (2015). The colors of all galaxies are redder than those those typically found for ETGs. As shown by Ann (2010), galaxies that are beyond the red edge of the red sequence can have different origins; many of them have dust lanes or are merging galaxies, and the dust obscuration is the main responsible for their red colors. Consistently with this picture, all the galaxies in our sample show the presence of dust lanes, shells and other signs of ongoing interactions. All the color profiles display in the central regions (), where on average the galaxies are redder, small but significant negative gradients typical of early types (La Barbera et al., 2010; Tortora et al., 2010). At a different radius for each galaxy, the colors develop a steeper gradient, becoming bluer (for NGC 1399, NGC 4365, NGC 5044 and NGC 5846) or redder (NGC3923 and NGC 4472). In Sec. 5 we will show that the discontinuities observed in the color profiles correspond to the transition radii observed in each surface brightness profile, which are defined as the locations of the transition between two different fit components.
4.1 Correction for the PSF
It is well known (Capaccioli & de Vaucouleurs, 1983) that the faint outskirts of galaxies can be contaminated by light scattered from the bright core by the telescope and by the atmosphere. In order to account for the artificial halos created by scattered light, the point spread function (PSF) must be mapped out to a radial distance at least comparable to the extent of the galaxian halo. An extended PSF for VST has been derived in Appendix B of Paper I. There we also show how to estimate the amount of scattered light by deconvolving a noiseless model of each galaxy with the IRAF task LUCY, which is based on the Lucy-Richardson algorithm (Lucy, 1974; Richardson, 1972).
As discussed in Paper I, the effect of the scattered light is quite different at the same surface brightness level between galaxies with large and small angular extent. We found that the surface brightness profiles of smaller sources in the field of NGC 4472 were marginally affected ( 0.2 mag) by the extended PSF at mag/arcsec2. Galaxies with a large angular extent, however, were not significantly affected by the PSF.
We also performed a plain numerical convolution for a set of azimuthally averaged light profiles for artificial galaxy models with different sizes. The difference between the model and its convolution provides an estimate of the effect of the extended PSF, at different surface brightness levels, on galaxies with different sizes. Details and results of these numerical experiments will be presented in a forthcoming paper (Spavone et al. in preparation). We conclude that no significant contribution of scattered light to the azimuthally averaged light profile is present in the faintest, outermost regions of the six giant galaxies we study in this paper.
5 Fitting ellipticity and light distribution
5.1 Deprojected flattening
It is not easy to make a meaningful comparison between the apparent ellipticity curves of different ETGs when their intrinsic shapes and inclinations, , are unknown. As a first-order approximation to the average trend in our sample we have deprojected the observed flattening profiles by adopting the classical prescription (Binney & Merrifield, 1998):
| (2) |
where and are the apparent and true axial ratios respectively. We have assumed that the dominant spheroidal components of all our six galaxies are oblate and have (Binney & de Vaucouleurs, 1981).
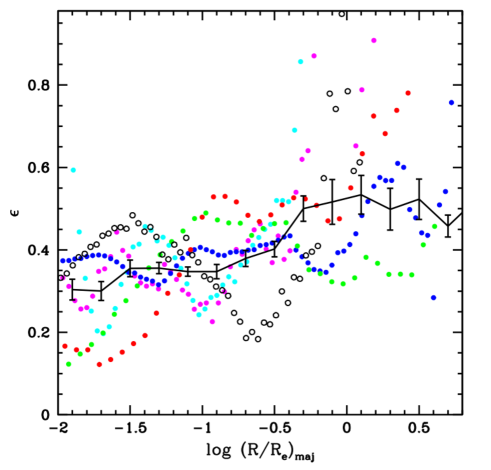
Results are shown in Figure 8, including ellipticity profiles for NGC 1399 and NGC 4472. The solid line represents a running mean of the complete dataset. Individual profiles show a wide dispersion, but an overall increase of flattening from 0.38 to 0.5 is apparent over a range along the major axis. This is broadly consistent with previous findings. For example Gonzalez et al. (2005) found that a sample of BCGs to be well described by a two-component model, in which the outer component was more elongated than the inner component which they associated with the BCG.
5.2 Fitting the light distribution with two-components models
The remainder of our analysis focusses on the projected one-dimensional (ellipsoidally-averaged) surface brightness profiles of our sample galaxies. As noted in the introduction, there is considerable evidence in the literature that the light profiles of many of the most massive ETGs are not well fitted by a single Sérsic law, and at least one additional component is needed (Seigar et al., 2007; Donzelli et al., 2011; Arnaboldi et al., 2012; Iodice et al., 2016). This second component is sometimes (but not universally) interpreted as evidence for a stellar halo or ‘intracluster light’.
Theoretical models suggest that massive ETGs accumulate the bulk of their stellar mass by accretion. For this reason, the ‘stellar halo’ in these galaxies should be identified with the component dominating the stellar mass. From an observational point of view, it is not straightforward to separate the in-situ and the accreted component in ETGs, since they have similar physical properties and are well mixed together. The overall profile is made up by different contributions, and for this reason theory suggests that the surface brightness profile of ETGs should be described by the superposition of different components.
Since we are interested in the study of the stellar distribution in the outer envelopes of our sample galaxies, we do not use the statistics in our fitting procedure. The data points corresponding to the central regions of the galaxies in fact, with their small uncertainties have considerable weight in determining the best fit solution obtained by minimizing the , while the outer regions with bigger errors have no weight. This approach could produce erroneous results when the functional form of the model is not known a priori, and an empirical model has to be assumed to reproduce the light distribution. To avoid this problem, we adopt the same approach described by Seigar et al. (2007), and performed least-square fits, by using a Levenberg–Marquardt algorithm, in which the function to be minimized is the rms scatter, defined as , where is the number of data points and is the ith residual. In all the fit presented below, the innermost seeing-dominated regions (), marked with dashed lines, have been excluded.
It’s worth to notice that, although we average azimuthally in elliptical annulli, this does not mean that the components fit to the resulting radial profile should be mecessarily expected to be elliptical structures, or even azimuthally smooth. This is simply an empirical approach to quantify the amount of stellar material as a function of galaxy radius.
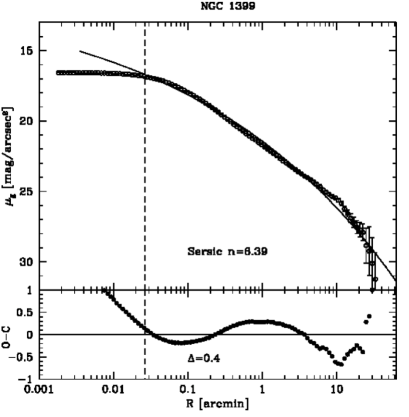
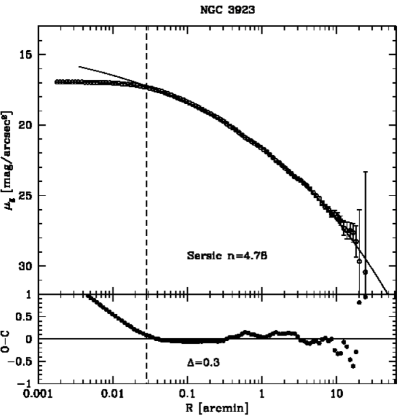
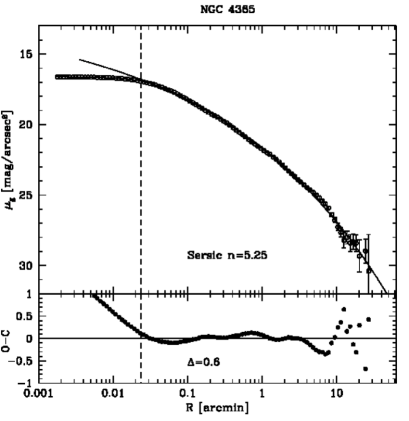
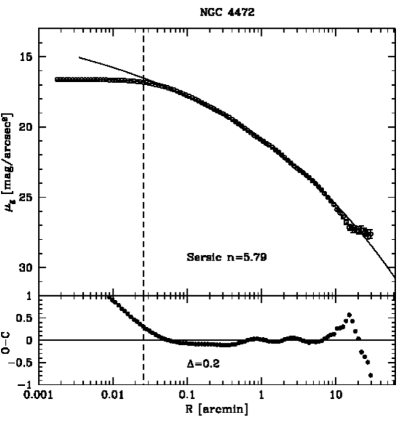
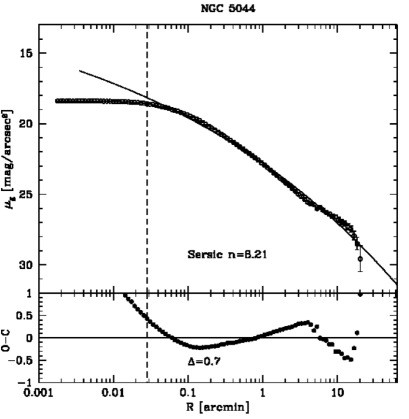
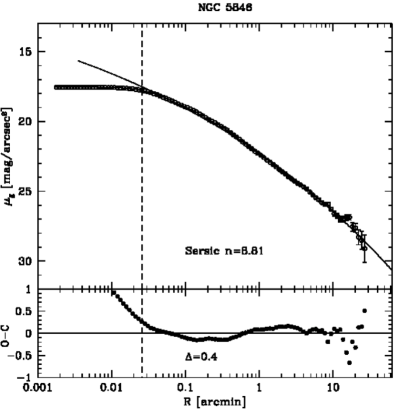
As shown in Sec. 4, we find two apparent types of surface brightness profile in our sample: those with a steeper slope in the outer regions and those with a shallower slope. In either case, the single Sérsic model provides a poor description of the shape of the profile. This can be clearly seen from the residuals with respect to a single Sérsic fit shown in Fig. 9.
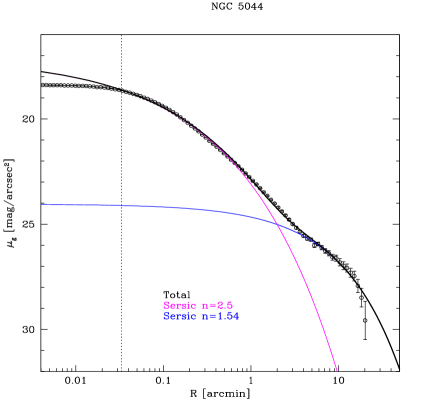
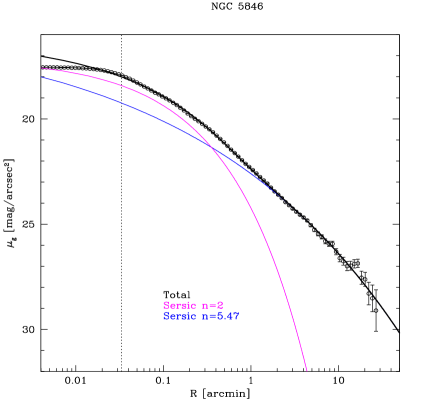
For this reason, we first present models of the surface brightness profiles of galaxies in our sample with a double Sérsic law (Sérsic, 1963; Caon et al., 1993),
| (3) |
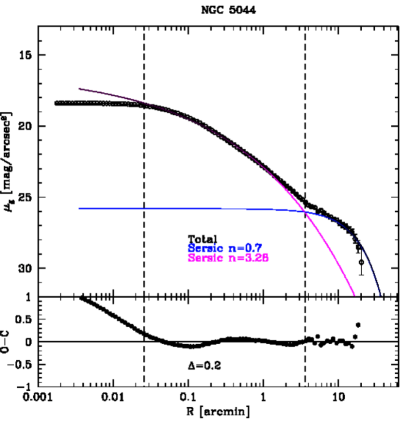
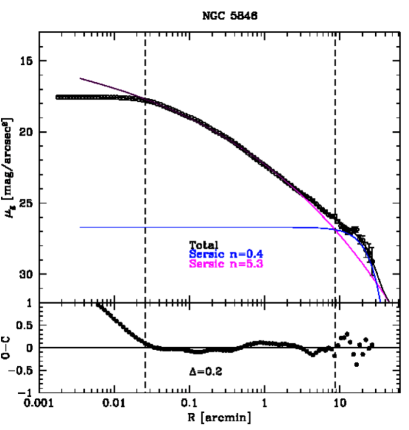
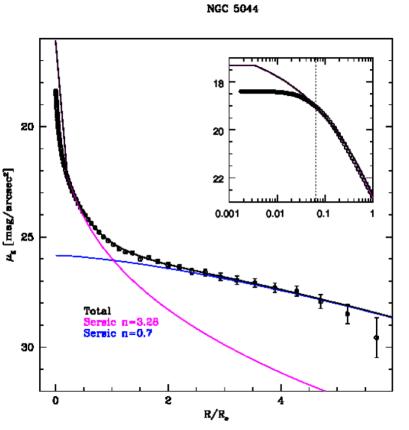
where , is the galactocentric radius and and are the effective radius and surface brightness. This asymptotic expansion provides an accurate fit for (Ciotti & Bertin, 1999; MacArthur et al., 2003). We found that this model converges to a best-fit solution, with physically meaningful value, for only two galaxies, NGC 5044 and NGC 5846. In these cases the fit yields very small Sérsic indices ( and , respectively) for the outer components.
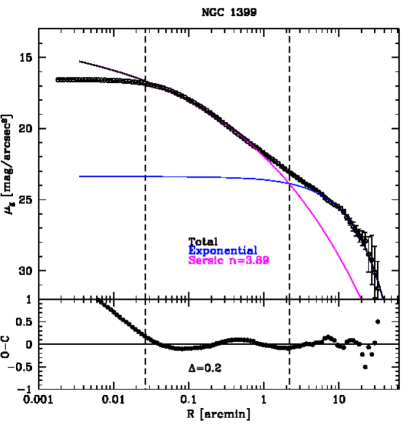
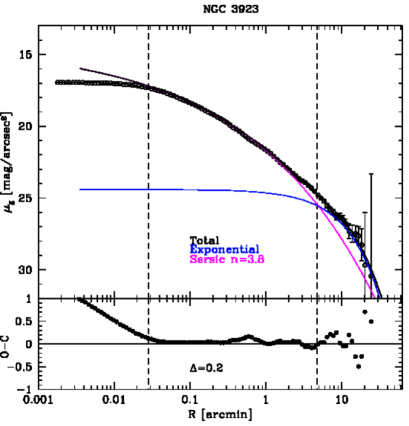
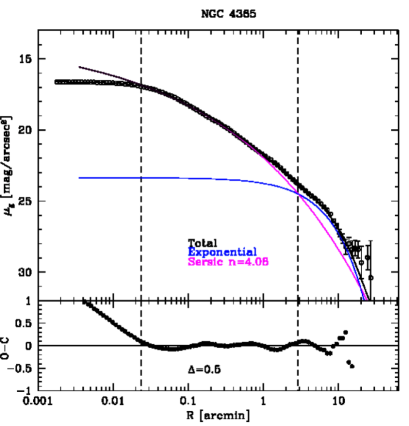
For the cases in which our double- Sérsic fit did not converge, we imposed an exponential profile on the outer component, given by the equation
| (4) |
where and are the central surface brightness and exponential scale length respectively. In these fits a Sérsic component without restrictions was retained for the inner regions.
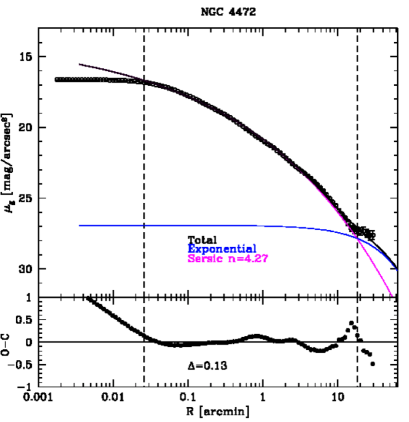
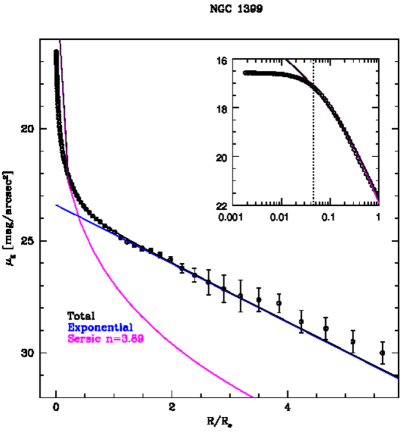
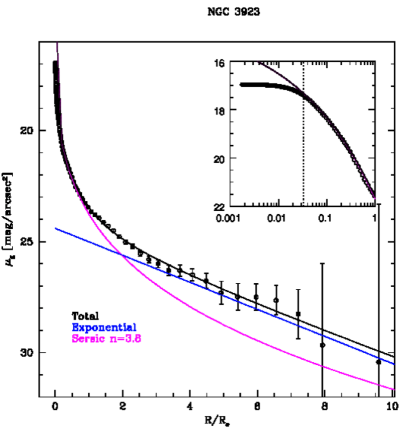
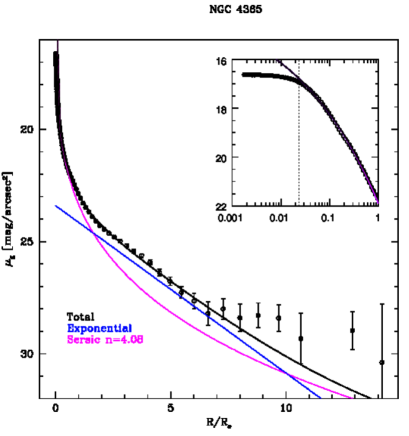
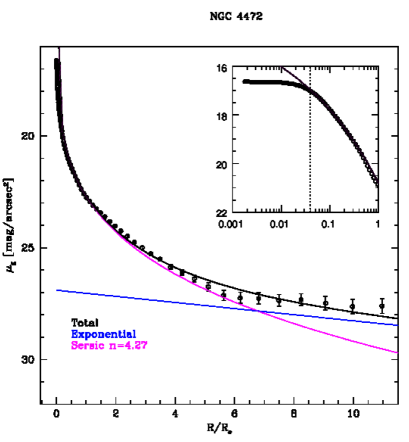
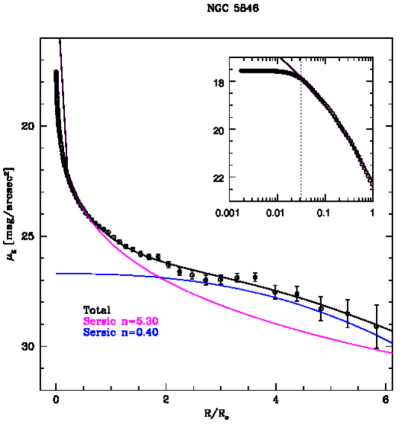
This double Sérsic / Sérsic plus exponential fits were performed on the g band azimuthally averaged light profile, excluding the core of the galaxies ( arcsec). The result of these fits and their residuals are shown in Fig. 10, in which the core of each galaxies is marked by a dashed line. In Tab. 4 we report the structural parameters of the best fit for each galaxy, with the relative 95% confidence intervals. In Fig. 11 we plot the results shown in Fig. 10, but on a linear scale, as a function of . In this figure the distinction between the two types of surface brightness profile are more clear. Specifically, we can distinguish the profiles of NGC 1399, NGC 5044 and NGC 5846 which show a downward inflection, from those of NGC 3923, NGC 4365 and NGC 4472, which instead have an upward inflection. According to our multi-component modelling, all the upward inflections are the result of a transition from a high- inner component to a larger, lower-, outer component. Downward inflection are, instead, the natural cut-off of a low- component. This implies that a downward inflection should be accompanied by an upward inflection at some smaller radius.
We found that the inner components of each fit have effective radii kpc ( arcsec), with an average value of kpc, and Sérsic indices , with an average value of . These values are consistent with those reported by Gonzalez et al. (2003) and Donzelli et al. (2011), who for their samples of BCGs found kpc and .
We used these fits to derive the total magnitude of the inner Sérsic component, , and outer (exponential or Sérsic) component, , as well as the relative contribution of the outer halo with respect to the total galaxy light, , reported in Tab. 4.
From this analysis we have identified a radius for each galaxy in our sample that marks the transition between the inner and outer components of our two-component fit. We label this empirically-defined ‘transition radius’ . This transition occurs at very faint levels of surface brightness () for all our galaxies. As mentioned in Sec. 4, a discontinuity in the ellipticity, P.A., and (g-i) color profiles of all six galaxies occurs around .
For NGC 1399 and NGC 5846 the outer halo component becomes even brighter than the inner component at , where the relative contribution of the outer halo with respect to the total galaxy light () reaches 60% and 55% respectively. For all the other galaxies the inner Sérsic component dominates the light distribution, but the outer halo component is never negligible, with relative fractions between 28% and 39%. Since there is no clear reason to believe that in massive elliptical galaxies the outer component in a fit such as this accounts for most of the accreted mass, the halo mass fractions reported in Tab. 4 should be considered as a lower limit for the total accreted mass. We return to this point in the following section.
In order to investigate the possibility of a correlation between environment and the shape of surface brightness profiles, in Fig. 12 we plot the slope of the outer halo surface brightness profile (Fig.10) against the number of physically related galaxies (the spread of velocities for the individual galaxies is about 150 km/s) in a field of 1 square degree around each galaxy. The profile slope was obtained by performing a power-law fit in the region of the outer envelope derived from the two component model, that is between and the last measured point (see Tab. 5). This figure hints at a trend such that galaxies in more dense environments have halo light profiles that are steeper than those in less dense fields. In order to evaluate the robustness of the correlation between the slopes and the density of the environment in Fig. 12, we have estimated the Spearman’s rank correlation coefficient (SRCC, see Eq. 14.6.1 in Numerical Recipes), which ranges in the [-1, 1] interval and measures the degree of correlation between two variables. According to this test, two variables are positively/negatively correlated if the SRCC is significantly larger/smaller than zero for the two variables. As seen in Fig. 12, the main uncertainty on the correlation is given by the large error bars, hence we decided to use a Montecarlo approach to the Spearman’s test in order to establish the significance of the correlation. We have ran 1000 experiments where we have perturbed the data assuming a Normal distribution around each data point with the standard deviation given by the data error and computed the SRCC at every extraction. The mean SRCC we have obtained after the 1000 random experiments is 0.67. Even if we assume the more conservative standard error on SRCC, i.e. for N=6, this test suggests that the slope and the density of the environment are significantly correlated at least at 2 level. We believe that this is a new and interesting result to check on larger samples.
| Object | |||||||||||||
|---|---|---|---|---|---|---|---|---|---|---|---|---|---|
| [mag/arcsec2] | [arcsec] | [mag/arcsec2] | [arcsec] | [mag/arcsec2] | [arcsec] | [mag] | [mag] | [arcmin] | [mag/arcsec2] | ||||
| NGC 1399 | 21.30.2 | 454 | 3.90.3 | - | - | - | 23.40.1 | 2924 | 9.67 | 9.08 | 64% | 2.20.3 | 24.0 |
| NGC 3923 | 22.20.3 | 7711 | 3.80.3 | - | - | - | 24.40.2 | 27313 | 9.43 | 10.21 | 32% | 4.82.2 | 25.3 |
| NGC 4365 | 21.90.2 | 607 | 4.10.2 | - | - | - | 23.40.1 | 1664 | 9.66 | 10.26 | 36% | 2.90.8 | 24.8 |
| NGC 4472 | 22.50.2 | 14814 | 4.30.2 | - | - | - | 26.90.6 | 1286530 | 8.29 | 9.36 | 27% | 18.28.9 | 27.8 |
| NGC 5044 | 22.90.1 | 62 4 | 3.30.1 | 27.00 0.09 | 685 33 | 0.7 0.1 | - | - | 9.43 | 10.60 | 40% | 3.60.3 | 26.2 |
| NGC 5846 | 24.20.3 | 16725 | 5.30.3 | 27.22 0.12 | 820 17 | 0.40 0.07 | - | - | 9.72 | 9.26 | 60% | 8.72.0 | 27.0 |
| Object | slope | |
|---|---|---|
| NGC 1399 | 54 | 13.13 1.51 |
| NGC 3923 | 3 | 5.64 0.85 |
| NGC 4365 | 51 | 5.82 2.08 |
| NGC 4472 | 39 | 2.26 0.30 |
| NGC 5044 | 127 | 16.65 2.53 |
| NGC 5846 | 85 | 7.10 3.45 |

5.3 Fitting the light distribution with three-components models
Numerical simulations predict that stars accreted by BCGs account for most of the total galaxy stellar mass (% on average), while in situ stars significantly contribute significantly to the surface brightness profile only out to kpc (Cooper et al., 2013, 2015; Rodriguez-Gomez et al., 2016). The overall accreted profile is built up by contributions from several significant progenitors, which can be divided in two broad types. Stars from massive progenitors, which sink rapidly by dynamical friction, are centrally concentrated and have a shape resembling that of the overall galaxy profile, while less significant progenitors have larger effective radii and lower Sérsic indices (a detailed discussion of the dynamical principles is given by Amorisco, 2015).
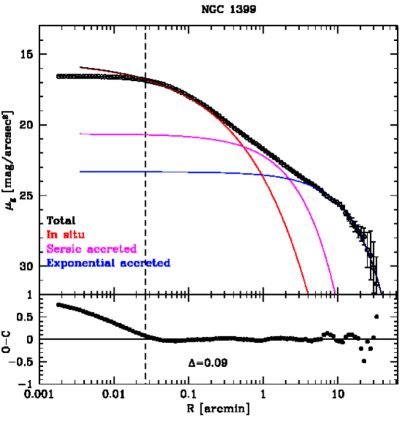
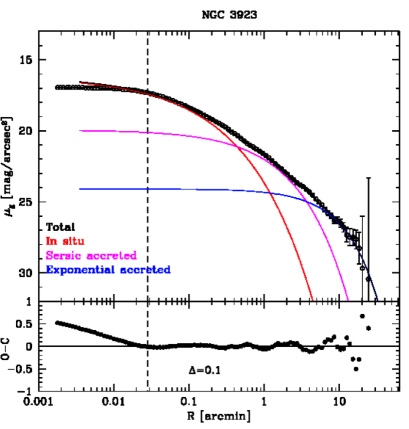
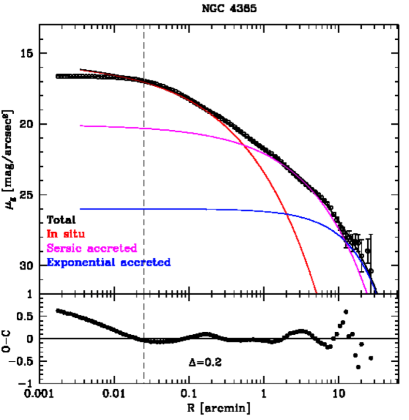
For this reason, theory suggests that the surface brightness profile of an ETG should be well described by the superposition of an inner Sérsic profile representing the (sub-dominant) in situ component in the central regions, another Sérsic profile representing the (dominant) superposition of the “relaxed”, phase-mixed accreted components, and an outer diffuse component representing “unrelaxed” accreted material (‘streams’ and other coherent concentrations of debris) which does not contribute any significant surface density to the brighter regions of the galaxy. (Cooper et al., 2015) found an fitting component to be a reasonable empirical description of this unrelaxed debris in the azimuthal average. The stellar population of the in situ component is expected to be quite similar to the dominant “relaxed” accreted component. As they are well mixed together, the sum of these two components is expected to have a smooth distribution with only faint features to suggest they are distinct.
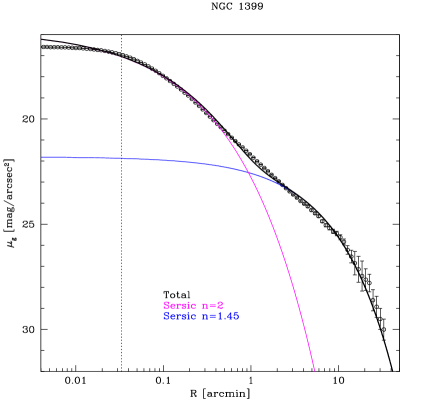
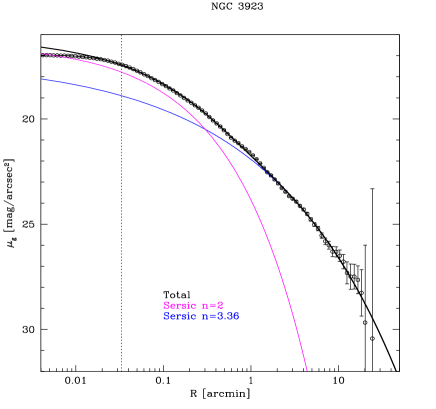
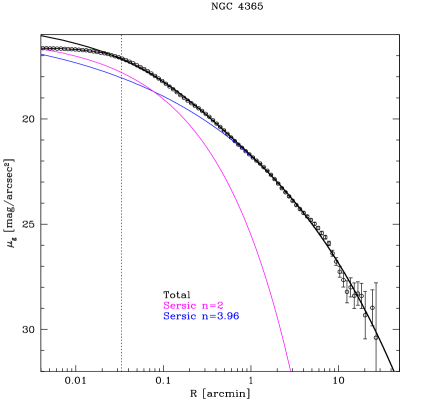
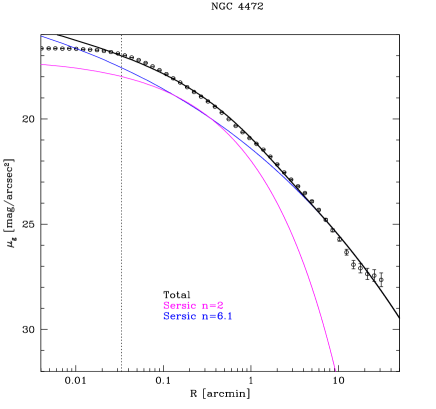
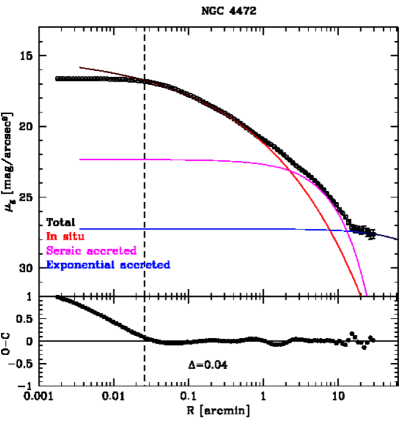
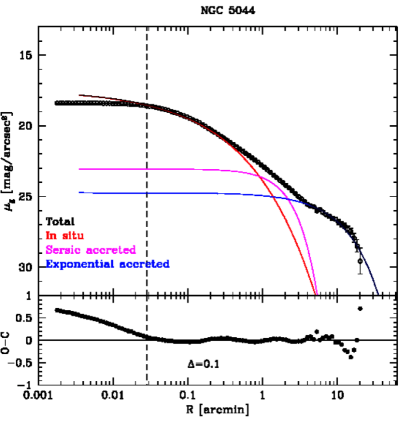
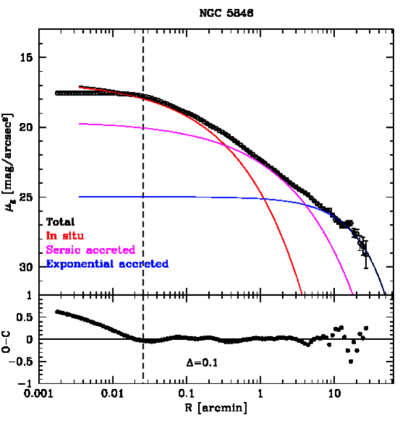
Following these theoretical predictions, we have described the surface brightness profiles of our six galaxies with a three component model: a Sérsic profile for the centrally concentrated in situ stars, a second Sérsic for the “relaxed” accreted component, and an exponential or Sérsic component for the diffuse and “unrelaxed” outer envelope.
A three-component fit may suffer from substantial degeneracy between parameters. However, the numerical simulations cited above also predict that, for early type galaxies in the mass range we are looking at, the variation of with halo mass is weak, especially for the in situ component. There is somewhat more variation with for the accreted stars, particularly with halo mass rather than stellar mass. Therefore, in order to mitigate the degeneracy in parameters and provide estimates of accreted components that are closely comparable to the results of numerical simulations, we fixed for the in situ component of our three-component fits. We allowed small variations of around the mean value of , since this would bracket the range of in the simulations, and allows us to obtain a better fit. The Sérsic parameters for the accreted component were left free. We adopt this typical value of for the in situ component on the basis of the results of Cooper et al. (2013) for massive galaxies (see their Fig. 7 in ).
The reason for the weak variation of with stellar mass and halo mass is because in situ stars are relatively deeply embedded in the oldest and most stable part of their host potential and initially have quasi-exponential density profiles (i.e. are late-type galaxies999This is by construction in the Cooper et al. models but obtained self-consistently in hydrodynamical simulations such as those of Rodriguez-Gomez et al. (2016).). The high-energy (large apocenter) tails of these distributions then diffuse outward slightly in radius following relaxation in the near-equal mass ratio mergers that are responsible for making these massive galaxies early types by (e.g. Hilz et al., 2012). Only very massive mergers (in terms of total mass) affect the central regions of the potential in this way (hence the preservation of stable discs with exponential profiles, characteristic of ongoing dissipative star formation, as the dominant structural component of LTGs). Even in very massive clusters, most of the 10 mergers that contribute significantly to the observed light profile are associated with dark halos of relatively low mass compared to the host (cluster) potential. Consequently, even though each progenitors has roughly similar stellar mass, most of these these mergers is (by the common convention) ‘minor’, and the inner part of the potential with the in situ stars is rarely disturbed.
The results of these fits are shown in Fig. 13, and the best fitting parameters are reported in Tab. 6. As already explained in Sec. 5.2, even if we extract azimuthally averaged light profiles, the components fit to the radial profile are not necessarily elliptical structures. From this plot it appears that, as argued by Cooper et al. (2015), the radius identified in Fig. 10 marks the transition between different accreted components in different states of dynamical relaxation, rather than that between in situ and accreted stars. We found that the Sérsic indices for the accreted components in this case range between 1 and 2. These values appear somewhat lower than those reported by (Cooper et al., 2013), but this is most likely because we have included a third component that accounts for a significant fraction of the outermost regions of the profile. In support of this, in appendix C, we report parameters obtained with this theoretically motivated approach without the outer exponential component, i.e. from a two-component Sérsic fit in which the inner component is fixed to . In that case the index of the outer component ranges . We have derived the total accreted mass fraction in Tab. 6 using the sum of both the ‘accreted’ components in our three-component fit. As discussed further in the next section, this makes it easier to compare our results directly with theoretical predictions for this quantity.
Huang et al. (2013) also report multicomponent fits of a sample of 94 bright ETGs, but without imposing constraints based on simulations. From their analysis they identified three subcomponents: a compact inner component, and intermediate component, and an outer and extended envelope. All the subcomponents in their work had average Sérsic indices . In our work we have imposed a restricted range of models using numerical simulations as ‘prior’ or guide for the decomposition, simply to mitigate the degeneracy in multicomponent fits to ETG profiles. Nevertheless, our approach gives results fully consistent with Huang et al. (2013).
| Object | ||||||||||||||
|---|---|---|---|---|---|---|---|---|---|---|---|---|---|---|
| [mag/arcsec2] | [arcsec] | [mag/arcsec2] | [arcsec] | [mag/arcsec2] | [arcsec] | [mag] | [mag] | [mag] | [arcmin] | [arcmin] | ||||
| NGC 1399 | 19.440.08 | 141 | 2 | 22.7 0.2 | 837 | 1.10.3 | 23.330.06 | 2914 | 10.33 | 9.74 | 9.02 | 84% | 0.50.1 | 2.30.2 |
| NGC 3923 | 20.150.10 | 174 | 2 | 22.80.3 | 9411 | 1.50.6 | 24.10.3 | 26919 | 10.61 | 9.51 | 9.95 | 82% | 0.50.2 | 3.60.8 |
| NGC 4365 | 20.000.09 | 172 | 2.2 | 23.60.2 | 16212 | 1.80.4 | 26.01.1 | 35010 | 10.51 | 9.16 | 11.28 | 80% | 0.50.2 | 122 |
| NGC 4472 | 21.040.03 | 562 | 2.5 | 24.050.06 | 2806 | 0.90.1 | 27.20.2 | 54463200 | 8.90 | 8.42 | 6.56 | 91% | 2.30.1 | 13.11.3 |
| NGC 5044 | 21.440.08 | 232 | 2 | 24.07 0.27 | 82 7 | 0.6 0.2 | 24.740.08 | 32010 | 11.24 | 11.11 | 10.22 | 79% | 0.90.2 | 2.20.2 |
| NGC 5846 | 20.670.09 | 153 | 2 | 23.6 0.2 | 110 13 | 2.0 0.9 | 25.00.2 | 45229 | 11.41 | 10.02 | 9.7 | 89% | 0.40.2 | 4.20.9 |
Moreover, looking at the rms scatter , of each fit, we can clearly see that by adding the third component we achieve an improvement of at least 10% for each galaxy. Since the expected value of scales as (see Seigar et al. 2007), where is the number of measured points ( 70 in our case) and is the number of free parameters, we would need 18 free parameters to obtain an improvement of 10%. This means that the improvement we obtain in our fits is not only due to the introduction of additional free parameters, as already shown by Seigar et al. (2007).
6 Comparison with theoretical predictions for accreted mass fractions
In the previous section, we identified inflections in the surface brightness profiles of galaxies in our sample that may correspond to transitions between regions dominated by debris from different accreted progenitors (or ensembles of progenitors) in different dynamical states. From our fitting procedure, we estimated the contributions of outer exponential ‘envelopes’ to the total galaxy mass, which range from 28% to 60% for the galaxies in our sample, and the fraction of total accreted mass, ranging from 83% to 95%.
We can convert these results to estimates of the stellar mass fractions in the different components by assuming appropriate stellar mass-to-light ratios. To obtain typical colours for the central galaxies regions and for the outer envelopes, we measured the mean g-i color for each galaxy in regions where each of those components dominates. The mean colors are reported in Tab. 7, and have been estimated for , where is the effective radius derived by the 2-component fit (see Tab. 4) for the inner and the outer component.
We used stellar population synthesis models (Vazdekis et al., 2012; Ricciardelli et al., 2012), with a Kroupa IMF, to derive the mass-to-light ratios corresponding to the average colors, and hence the stellar mass of the whole galaxy, of the outer envelope, and of the accreted component. These results are summarized in Table 7.
| Object | |||||||
|---|---|---|---|---|---|---|---|
| [mag] | [mag] | [] | [] | [] | [] | [] | |
| NGC 1399 | 1.2 | 0.8 | 5.2 | 0.6 | |||
| NGC 3923 | 1.3 | 1.4 | 6.2 | 9.1 | |||
| NGC 4365 | 1.1 | 0.9 | 3.4 | 0.9 | |||
| NGC 4472 | 1.2 | 1.1 | 5.2 | 3.4 | |||
| NGC 5044 | 1.2 | 0.7 | 5.2 | 0.5 | |||
| NGC 5846 | 1.4 | 0.7 | 9.1 | 0.5 |
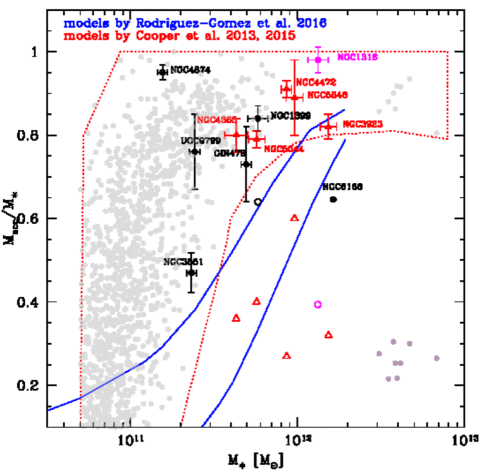
In Fig. 14 we compare the accreted mass ratios we infer from our observations (filled red triangles) with other observational estimates for BCGs by Seigar et al. (2007); Bender et al. (2015) and Iodice et al. (2016), and with theoretical predictions from semi-analytic particle-tagging simulations by Cooper et al. (2013, 2015), and the Illustris cosmological hydrodynamical simulations (Rodriguez-Gomez et al., 2016). We find that the stellar mass fraction of the accreted component derived for galaxies in our sample is fully consistent both with published data for other BCGs (despite considerable differences in the techniques and assumptions involved) and with the theoretical models by Cooper et al. (2013, 2015).
In the same figure we also include the halo mass fraction obtained for NGC 1316, the VEGAS photometry for which will be published in a forthcoming paper (Iodice et al. in preparation). NGC 1316 is a peculiar galaxy in the Fornax cluster, with a very perturbed morphology. The presence of shells, tidal tails and dust indicates that the galaxy has undergone a recent interaction event. The accreted mass fraction and the total stellar mass for this object are consistent with those of NGC 4472 and NGC 3923, which also show peculiar features, such as shells and dust lanes, and evidences of ongoing interactions.
In Fig. 14 we also compare the stellar mass fractions obtained for the outermost exponential component of our multicomponent fit (open red triangles) with the mass fraction associated with unbound debris streams from surviving cluster galaxies in the simulations of Cooper et al. (2015). We found that the mass fraction in this component of our fits is consistent with these values from the simulations, suggesting that such components may give a crude estimate of the mass distribution associated with dynamically unrelaxed components originating from disrupting or recently disrupted galaxies, as argued by Cooper et al. (2015).
7 Discussion and conclusions
We have presented new deep photometry in the g and i bands for four giant ETGs in the VST Early-type Galaxy Survey (VEGAS): NGC 3923, NGC 4365, NGC 5044 and NGC 5846. In particular, we have studied the shapes of their surface brightness profiles to obtain evidence of structural variations that may constrain their assembly history. We have also combined the results of this photometric study with those presented in Paper I, for NGC 4472, and in Iodice et al. (2016), for NGC 1399.
The data used were collected with the VST/OmegaCAM in March and April of 2015 within the Italian Guaranteed Time Observation (GTO). The large field of view (FOV) of OmegaCAM mounted on VST (one square degree), together with its high efficiency and spatial resolution, allows us to map the surface brightness of galaxies out to many effective radii and to very faint levels. We can therefore probe regions associated with the faint stellar envelopes of these galaxies, which, due to their long dynamical timescales, may retain signatures of their assembly history.
Our analysis suggests that the surface brightness profiles of the galaxies in our study are best reproduced by multi-component models. As already pointed out by Mendez-Abreu et al. (2016), this kind of photometric decompositions need a “human-supervised” approach, and the choice of the number of components included in the fit is a relevant source of uncertainty. Since the surface brightness profiles of many galaxies could be fit equally well by a whole range of alternative models, the results of these photometric decompositions, especially for featureless early type galaxies, strongly depends on the model adopted. We took two approaches to constructing such models. Adopting the an empirically-motivated two-component approach most common in the literature we find that four of our six galaxies (NGC 3923, NGC 4365, NGC 4472, NGC 1399) can be modelled by an inner Sérsic component and an outer exponential, while the other two objects (NGC 5044 and NGC 5846) are best fitted with a double Sérsic model. The inner Sérsic components for each galaxy have an average effective radius kpc and Sérsic index , quite similar to the values found (with a similar fitting philosophy) by Gonzalez et al. (2003) and Donzelli et al. (2011), kpc and .
We also used an alternative approach, motivated by the predictions of numerical simulations, in which we fitted the surface brightness profiles of our galaxies with three components: two dominant Sérsic components in and an outer exponential component. To mitigate some of the degeneracy in this approach, we fixed the Sérsic index of the inner component to a representative value from simulations. In those simulations, this component corresponds to a mixture of stars formed in situ and the remnants of mergers subject to violent relaxation. Compared to the traditional empirical fit, this approach allows us to make a more meaningful estimate of the total contribution of accreted stars. The accreted stellar mass fractions we infer for galaxies in our sample with this approach are consistent with the theoretical predictions of Cooper et al. (2013), in which the fraction of accreted stars, and hence the Sérsic index of the overall surface brightness profile, increase strongly with stellar mass.
The most massive galaxies in our study, NGC 3923 and NGC 4472, are in the mass range typically identified with BCGs and ICL phenomena, as is NGC 1316 (Iodice et al., in preparation). These three galaxies show clear signs of ongoing interaction and recent accretion events, indicating that their outer regions are still being assembled, consistent with theoretical expectations for such galaxies (e.g. Cooper et al., 2015). In this regard it is interesting that the mass fractions in the exponential components of our two-components profile decompositions are in good agreement with the mass fractions associated with streams from surviving galaxies in the simulations of Cooper et al. (2015). This suggests these outer exponential components may give a crude estimate of the stellar mass fraction associated with recently disrupted galaxies. We find values for this fraction ranging from 28% to 64%.
Previous works, for example by Gonzalez et al. (2005) and Zibetti et al. (2005), have identified outer components similar to those in our fits with so-called diffuse intracluster light (ICL). Typical claims for the mass fractions in ICL range from . From a theoretical perspective, it is not clear that it is physically meaningful to attempt to distinguish such a component from the outer envelopes of BCGs (see for example the discussion in Cooper et al., 2015). A wide variety of definitions of ICL have been adopted in both the observational and theoretical literature, according to many of which such components cannot be unambiguously identified from photometry alone. We therefore leave open the question of how the outer-component light fractions we derive relate in detail to previous claims regarding the nature of ICL.
For all the galaxies in our study we can identify at least one inflection in the surface brightness profile. These inflections occur at very faint surface brightness levels ( mag/arcsec2). They appear to correlate with changes in the trend of ellipticity, position angle and color with radius, the isophotes becoming flatter and misaligned and the colors bluer beyond the inflections. This suggests that these inflections mark transitions between physically distinct components (or ensembles of similar components) in different states of dynamical relaxation. This sense of the surface brightness inflection is upwards (i.e. a break to a shallower slope) in NGC 3923, NGC 4365 and NGC 4472, and downwards (i.e. a break to a steeper slope) in the other galaxies.
A variety of possible interpretations for such features have been suggested based on theoretical models. Upward inflections (shallower outer slopes) might reflect transitions between either an inner in situ-dominated region and an outer accretion-dominated region, or else between two accreted components (Abadi et al., 2006; Font et al., 2011). Downward inflections can occur within the profiles of debris from a single progenitors alone, corresponding to the characteristic apocentric radius of its stars (Cooper et al., 2010; Deason et al., 2013; Amorisco, 2015) and therefore need not represent a transition between two separate components; however they need not always correspond to a single progenitor, because they can also be created by a drop in the density of only one of a small number of contributions having roughly equal density interior to the break. It has been claimed that the strength and radius of downward inflections in the accreted component encode information on the number of progenitors as well as the orbital properties of the dominant progenitor and its disruption timescale. For example, Deason et al. (2013) examine aspects of these relationships in the context of satellite accretion onto Milky Way analogues, and claim that the properties of the break can be used to infer the accretion time of the progenitor. (In massive ETGs the picture is further complicated by violent relaxation of the central potential Hilz et al. (e.g. 2012).)
Since there are many ways to produce these inflections, any given profile might in principle be expected to have several, in both directions. In practice (as seen in the profile decompositions in Cooper et al. 2010 and Cooper et al. 2015) the fact that the accreted component is the superposition of many contributions tends to blur out most of the individual dynamical downward inflections but nevertheless to preserve a (more gradual) average steepening of the profile to larger radius. In support of such predictions, D’Souza et al. (2014) found that the transition radius between the different accreted components, , varies systematically with the stellar mass, being on average smaller for more massive galaxies, in agreement with the trends predicted by Cooper et al. (2013); Rodriguez-Gomez et al. (2016). We also find a possible correlation between the slope of the surface brightness profiles beyond the inflection point and the density of the field around each galaxy, indicating that objects in more dense fields (hence perhaps more massive dark matter halos) have steeper outer profiles.
For our galaxies with upward profile inflections, the inflection point is well beyond , suggesting that these features are attributable to an excess in the number of weakly-bound stars with large orbital apocenters, perhaps associated with more recent accretion events. We do not observe significant changes in surface brightness or other properties at the transition point between the inner two components of our theoretically-motivated three-component fits. This is perhaps not surprising, because simulations predict that the in situ — accreted transition is hardly noticeable in very massive galaxies, for the most part because the in situ stars account for a relatively small fraction of the total mass even in the bright body of the galaxy. In the most massive galaxies, the accreted mass is expected to be made up from significant contributions with roughly similar mass, and of a similar mass to the in situ component; this is in contrast to Milky Way-mass galaxies which are expected to have stellar halos dominated by only one or two progenitors much less massive than the in situ contribution (Cooper et al., 2013). Moreover the same models predict that the ages and metallicities of in situ stars in massive ETGs are quite similar to those of the most significant “relaxed” accreted components (De Lucia & Blaizot, 2007; Cooper et al., 2013).
That we see a variety of profile inflections in our photometric investigation of this small subset of the VEGAS sample, and that these are broadly consistent with the expectations of state-of-the-art theoretical models, is encouraging. Our results suggests that, with the complete sample of extremely deep surface brightness profiles from the full survey, we will be able to investigate the late stages of massive galaxy assembly statistically, distinguishing dynamically evolved systems from those still reaching dynamical equilibrium and probing the balance between in situ star formation and accretion across a wide range of stellar mass. This is a promising route to constraining cosmological models of galaxy formation such as those we have compared with here, which predict fundamental, relatively tight correlations between the present-day structure of massive galaxies and the growth histories of their host dark matter halos.
Acknowledgements.
This work is based on visitor mode observations taken at the ESO La Silla Paranal Observatory within the VST Guaranteed Time Observations, Program IDs 090.B-0414(D), 091.B-0614(A), 094.B- 0496(A), 094.B-0496(B), 094.B-0496(D) and 095.B-0779(A). The authors wish to thank the anonymous referee for his or her comments and suggestions that allowed us to greatly improve the paper. The authors wish to tank ESO for the financial contribution given for the visitor mode runs at the ESO La Silla Paranal Observatory. M. Spavone wishes to thank the ESO staff of the Paranal Observatory for their support during the observations at VST. APC is supported by a COFUND/Durham Junior Research Fellowship under EU grant [267209] and acknowledges support from STFC (ST/L00075X/1). The data reduction for this work was carried out with the computational infrastructure of the INAF-VST Center at Naples (VSTceN). This research made use of the NASA/IPAC Extragalactic Database (NED), which is operated by the Jet Propulsion Laboratory, California Institute of Technology, under contract with the National Aeronautics and Space Administration, and has been partly supported by the PRIN-INAF “Galaxy evolution with the VLT Survey Telescope (VST)” (PI A. Grado). NRN, EI and MP have been supported by the PRIN-INAF 2014 “Fornax Cluster Imaging and Spectroscopic Deep Survey” (PI. N.R. Napolitano). MS, EI and M. Cantiello acknowledge finacial support from the VST project (P.I. M. Capaccioli).References
- Abadi et al. (2006) Abadi, M. G., Navarro, J. F., & Steinmetz, M. 2006, MNRAS, 365, 747
- Amorisco (2015) Amorisco, N. C. 2015, arXiv:1511.08806
- Ann (2010) Ann, H. B. 2010, Galaxies and their Masks, 195
- Arnaboldi et al. (2012) Arnaboldi, M., Ventimiglia, G., Iodice, E., Gerhard, O., & Coccato, L. 2012, A&A, 545, AA37
- Arnold et al. (2014) Arnold, J. A., Romanowsky, A. J., Brodie, J. P., et al. 2014, ApJ, 791, 80
- Arrigoni Battaia et al. (2012) Arrigoni Battaia, F., Gavazzi, G., Fumagalli, M., et al. 2012, A&A, 543, AA112
- Bender et al. (1989) Bender, R., Surma, P., Doebereiner, S., Moellenhoff, C., & Madejsky, R. 1989, A&A, 217, 35
- Bender et al. (2015) Bender, R., Kormendy, J., Cornell, M. E., & Fisher, D. B. 2015, ApJ, 807, 56
- Bertin & Arnouts (1996) Bertin, E., & Arnouts, S. 1996, A&AS, 117, 393
- Binney & de Vaucouleurs (1981) Binney, J., & de Vaucouleurs, G. 1981, MNRAS, 194, 679
- Binney & Merrifield (1998) Binney, J., & Merrifield, M. 1998, Galactic astronomy / James Binney and Michael Merrifield. Princeton, NJ : Princeton University Press, 1998. (Princeton series in astrophysics) QB857 .B522 1998 ($35.00),
- Blakeslee et al. (2009) Blakeslee, J. P., Jordán, A., Mei, S., et al. 2009, ApJ, 694, 556
- Blom et al. (2012a) Blom, C., Spitler, L. R., & Forbes, D. A. 2012, MNRAS, 420, 37
- Blom et al. (2012b) Blom, C., Forbes, D. A., Brodie, J. P., et al. 2012, MNRAS, 426, 1959
- Blom et al. (2014) Blom, C., Forbes, D. A., Foster, C., Romanowsky, A. J., & Brodie, J. P. 2014, MNRAS, 439, 2420
- Bogdán et al. (2012) Bogdán, Á., Forman, W. R., Zhuravleva, I., et al. 2012, ApJ, 753, 140
- Buote & Canizares (1998) Buote, D. A., & Canizares, C. R. 1998, MNRAS, 298, 811
- Buote et al. (2003) Buote, D. A., Lewis, A. D., Brighenti, F., & Mathews, W. G. 2003, ApJ, 594, 741
- Burstein & Heiles (1982) Burstein, D., & Heiles, C. 1982, AJ, 87, 1165
- Caon et al. (1993) Caon, N., Capaccioli, M., & D’Onofrio, M. 1993, MNRAS, 265, 1013
- Caon et al. (1994) Caon, N., Capaccioli, M., & D’Onofrio, M. 1994, A&AS, 106, 199
- Capaccioli & de Vaucouleurs (1983) Capaccioli, M., & de Vaucouleurs, G. 1983, ApJS, 52, 465
- Capaccioli et al. (1992) Capaccioli, M., Caon, N., & D’Onofrio, M. 1992, MNRAS, 259, 323
- Capaccioli & Schipani (2011) Capaccioli, M., & Schipani, P. 2011, The Messenger, 146, 2
- Capaccioli et al. (2015) Capaccioli, M., Spavone, M., Grado, A., et al. 2015, A&A, 581, A10
- Carter et al. (1998) Carter, D., Thomson, R. C., & Hau, G. K. T. 1998, MNRAS, 294, 182
- Ciotti & Bertin (1999) Ciotti, L., & Bertin, G. 1999, A&A, 352, 447
- Colbert et al. (2001) Colbert, J. W., Mulchaey, J. S., & Zabludoff, A. I. 2001, AJ, 121, 808
- Cole et al. (2000) Cole, S., Lacey, C. G., Baugh, C. M., & Frenk, C. S. 2000, MNRAS, 319, 168
- Cooper et al. (2010) Cooper, A. P., Cole, S., Frenk, C. S., et al. 2010, MNRAS, 406, 744
- Cooper et al. (2013) Cooper, A. P., D’Souza, R., Kauffmann, G., et al. 2013, MNRAS, 434, 3348
- Cooper et al. (2015) Cooper, A. P., Gao, L., Guo, Q., et al. 2015, MNRAS, 451, 2703
- D’Souza et al. (2014) D’Souza, R., Kauffman, G., Wang, J., & Vegetti, S. 2014, MNRAS, 443, 1433
- D’Onofrio et al. (1994) D’Onofrio, M., Capaccioli, M., & Caon, N. 1994, MNRAS, 271, 523
- Davies et al. (2001) Davies, R. L., Kuntschner, H., Emsellem, E., et al. 2001, ApJ, 548, L33
- de Vaucouleurs & Capaccioli (1979) de Vaucouleurs, G., & Capaccioli, M. 1979, ApJS, 40, 699
- De Lucia et al. (2006) De Lucia, G., Springel, V., White, S. D. M., Croton, D., & Kauffmann, G. 2006, MNRAS, 366, 499
- De Lucia & Blaizot (2007) De Lucia, G., & Blaizot, J. 2007, MNRAS, 375, 2
- Deason et al. (2013) Deason, A. J., Belokurov, V., Evans, N. W., & Johnston, K. V. 2013, ApJ, 763, 113
- Donzelli et al. (2011) Donzelli, C. J., Muriel, H., & Madrid, J. P. 2011, ApJS, 195, 15
- Duc et al. (2015) Duc, P.-A., Cuillandre, J.-C., Karabal, E., et al. 2015, MNRAS, 446, 120
- Faltenbacher & Mathews (2005) Faltenbacher, A., & Mathews, W. G. 2005, MNRAS, 362, 498
- Ferrarese et al. (2006) Ferrarese, L., Côté, P., Jordán, A., et al. 2006, ApJS, 164, 334
- Ferrarese et al. (2012) Ferrarese, L., Côté, P., Cuillandre, J.-C., et al. 2012, ApJS, 200, 4
- Font et al. (2011) Font, A. S., McCarthy, I. G., Crain, R. A., et al. 2011, MNRAS, 416, 2802
- Foster et al. (2016) Foster, C., Pastorello, N., Roediger, J., et al. 2016, MNRAS, 457, 147
- Frenk et al. (1985) Frenk, C. S., White, S. D. M., Efstathiou, G., & Davis, M. 1985, Nature, 317, 595
- Gastaldello et al. (2009) Gastaldello, F., Buote, D. A., Temi, P., et al. 2009, ApJ, 693, 43
- Gonzalez et al. (2003) Gonzalez, A. H., Zabludoff, A. I., & Zaritsky, D. 2003, Ap&SS, 285, 67
- Gonzalez et al. (2005) Gonzalez, A. H., Zabludoff, A. I., & Zaritsky, D. 2005, ApJ, 618, 195
- Grado et al. (2012) Grado, A., Capaccioli, M., Limatola, L., & Getman, F. 2012, Memorie della Societa Astronomica Italiana Supplementi, 19, 362
- Guo & White (2008) Guo, Q., & White, S. D. M. 2008, MNRAS, 384, 2
- Hamabe & Kormendy (1987) Hamabe, M., & Kormendy, J. 1987, Structure and Dynamics of Elliptical Galaxies, 127, 379
- Haynes & Giovanelli (1991) Haynes, M. P., & Giovanelli, R. 1991, AJ, 102, 841
- Hilz et al. (2012) Hilz, M., Naab, T., Ostriker, J. P., et al. 2012, MNRAS, 425, 3119
- Huang et al. (2011) Huang, Z., Radovich, M., Grado, A., et al. 2011, A&A, 529, A93
- Huang et al. (2013) Huang, S., Ho, L. C., Peng, C. Y., Li, Z.-Y., & Barth, A. J. 2013, ApJ, 766, 47
- Iodice et al. (2016) Iodice, E., Capaccioli, M., Grado, A., et al. 2016, arXiv:1602.02149
- Irwin & Sarazin (1996) Irwin, J. A., & Sarazin, C. L. 1996, ApJ, 471, 683
- Janowiecki et al. (2010) Janowiecki, S., Mihos, J. C., Harding, P., et al. 2010, ApJ, 715, 972
- Jedrzejewski (1987) Jedrzejewski, R. I. 1987, MNRAS, 226, 747
- Johnston et al. (2008) Johnston, K. V., Bullock, J. S., Sharma, S., et al. 2008, ApJ, 689, 936-957
- Kauffmann et al. (1993) Kauffmann, G., White, S. D. M., & Guiderdoni, B. 1993, MNRAS, 264, 201
- Kim et al. (2000) Kim, E., Lee, M. G., & Geisler, D. 2000, MNRAS, 314, 307
- Kormendy (1977) Kormendy, J. 1977, ApJ, 218, 333
- Kormendy et al. (2009) Kormendy, J., Fisher, D. B., Cornell, M. E., & Bender, R. 2009, ApJS, 182, 216
- Kronawitter et al. (2000) Kronawitter, A., Saglia, R. P., Gerhard, O., & Bender, R. 2000, A&AS, 144, 53
- La Barbera et al. (2010) La Barbera, F., De Carvalho, R. R., De La Rosa, I. G., et al. 2010, AJ, 140, 1528
- Longobardi et al. (2015a) Longobardi, A., Arnaboldi, M., Gerhard, O., & Hanuschik, R. 2015, A&A, 579, A135
- Longobardi et al. (2015b) Longobardi, A., Arnaboldi, M., Gerhard, O., & Mihos, J. C. 2015, A&A, 579, L3
- Lucy (1974) Lucy, L. B. 1974, AJ, 79, 745
- MacArthur et al. (2003) MacArthur, L. A., Courteau, S., & Holtzman, J. A. 2003, ApJ, 582, 689
- Malin & Carter (1980) Malin, D. F., & Carter, D. 1980, Nature, 285, 643
- Mei et al. (2007) Mei, S., Blakeslee, J. P., Côté, P., et al. 2007, ApJ, 655, 144
- Mendel et al. (2008) Mendel, J. T., Proctor, R. N., Forbes, D. A., & Brough, S. 2008, MNRAS, 389, 749
- Mendez-Abreu et al. (2016) Mendez-Abreu, J., Ruiz-Lara, T., Sanchez-Menguiano, L., et al. 2016, arXiv:1610.05324
- Mihos et al. (2013) Mihos, J. C., Harding, P., Rudick, C. S., & Feldmeier, J. J. 2013, ApJ, 764, L20
- Oser et al. (2010) Oser, L., Ostriker, J. P., Naab, T., Johansson, P. H., & Burkert, A. 2010, ApJ, 725, 2312
- Paolillo et al. (2002) Paolillo, M., Fabbiano, G., Peres, G., & Kim, D.-W. 2002, ApJ, 565, 883
- Peng et al. (2006) Peng, E. W., Jordán, A., Côté, P., et al. 2006, ApJ, 639, 95
- Pillepich et al. (20.pdf14) Pillepich, A., Vogelsberger, M., Deason, A., et al. 2014, MNRAS, 444, 237
- Pohlen & Trujillo (2006) Pohlen, M., & Trujillo, I. 2006, A&A, 454, 759
- Purcell et al. (2007) Purcell, C. W., Bullock, J. S., & Zentner, A. R. 2007, ApJ, 666, 20
- Ricciardelli et al. (2012) Ricciardelli, E., Vazdekis, A., Cenarro, A. J., & Falcón-Barroso, J. 2012, MNRAS, 424, 172
- Richardson (1972) Richardson, W. H. 1972, Journal of the Optical Society of America (1917-1983), 62, 55
- Rodriguez-Gomez et al. (2016) Rodriguez-Gomez, V., Pillepich, A., Sales, L. V., et al. 2016, MNRAS, 458, 2371
- Seigar et al. (2007) Seigar, M. S., Graham, A. W., & Jerjen, H. 2007, MNRAS, 378, 1575
- Sandage & Bedke (1994) Sandage, A., & Bedke, J. 1994, The Carnegie Atlas of Galaxies. Volumes I, II., by Sandage, A.; Bedke, J.. Carnegie Institution of Washington Publ., No. 638,,
- Schlegel et al. (1998) Schlegel, D. J., Finkbeiner, D. P., & Davis, M. 1998, ApJ, 500, 525
- Sérsic (1963) Sérsic, J. L. 1963, Boletin de la Asociacion Argentina de Astronomia La Plata Argentina, 6, 41
- Sikkema et al. (2007) Sikkema, G., Carter, D., Peletier, R. F., et al. 2007, A&A, 467, 1011
- Surma (1993) Surma, P. 1993, European Southern Observatory Conference and Workshop Proceedings, 45, 669
- Tonry et al. (2001) Tonry, J. L., Dressler, A., Blakeslee, J. P., et al. 2001, ApJ, 546, 681
- Tortora et al. (2010) Tortora, C., Napolitano, N. R., Cardone, V. F., et al. 2010, MNRAS, 407, 144
- Trinchieri & Goudfrooij (2002) Trinchieri, G., & Goudfrooij, P. 2002, A&A, 386, 472
- Vazdekis et al. (2012) Vazdekis, A., Ricciardelli, E., Cenarro, A. J., et al. 2012, MNRAS, 424, 157
- Villumsen (1983) Villumsen, J. V. 1983, MNRAS, 204, 219
- White & Frenk (1991) White, S. D. M., & Frenk, C. S. 1991, ApJ, 379, 52
- Zibetti et al. (2005) Zibetti, S., White, S. D. M., Schneider, D. P., & Brinkmann, J. 2005, MNRAS, 358, 949
| Object | |||||||||
|---|---|---|---|---|---|---|---|---|---|
| [mag/arcsec2] | [arcsec] | [mag/arcsec2] | [arcsec] | [mag] | [mag] | ||||
| NGC 1399 | 19.760.06 | 19.480.89 | 2 | 24.600.06 | 38211 | 1.450.08 | 9.92 | 8.30 | 82% |
| NGC 3923 | 20.410.14 | 17.341.90 | 2 | 24.110.15 | 21516 | 3.360.45 | 10.83 | 9.06 | 84% |
| NGC 4365 | 20.060.24 | 10.721.60 | 2 | 23.560.15 | 15911 | 3.960.36 | 11.52 | 9.17 | 90% |
| NGC 4472 | 21.080.33 | 39.957.50 | 2 | 25.320.49 | 547118 | 6.100.69 | 9.68 | 8.24 | 79% |
| NGC 5044 | 22.160.05 | 39.31.8 | 2.5 | 27.03 0.17 | 678 55 | 1.54 0.27 | 10.80 | 9.49 | 77% |
| NGC 5846 | 21.110.16 | 18.91.1 | 2 | 26.87 0.28 | 757 101 | 5.47 0.68 | 11.34 | 9.09 | 89% |
Appendix A Masking of bright sources
In Fig. 15, we show the masks used in this work for the photometric analysis of NGC 1399, NGC 3923, NGC 4365, NGC 4472, NGC 5044, and NGC 5846, respectively. All sources have been masked out by using ExAM131313ExAM is a code developed by Z. Huang during his PhD. A detailed description of the code can be found in his PhD thesis, available at the following link: http://www.fedoa.unina.it/id/eprint/8368 (Huang et al., 2011), a program based on SExtractor (Bertin & Arnouts, 1996), which was developed to accurately mask background and foreground sources, reflection haloes, and spikes from saturated stars.
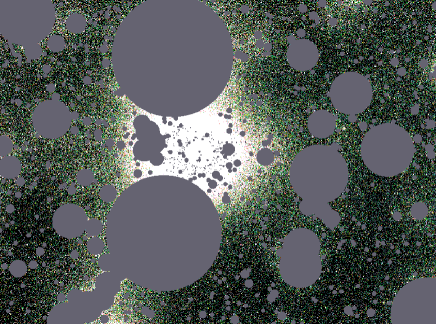
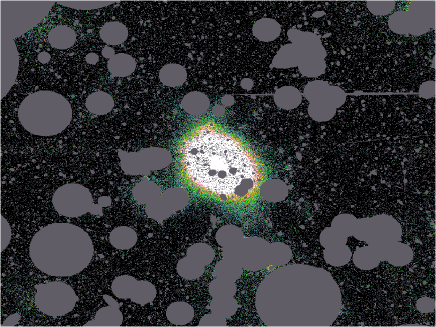
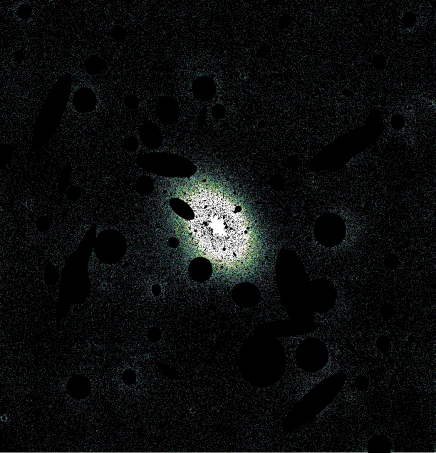
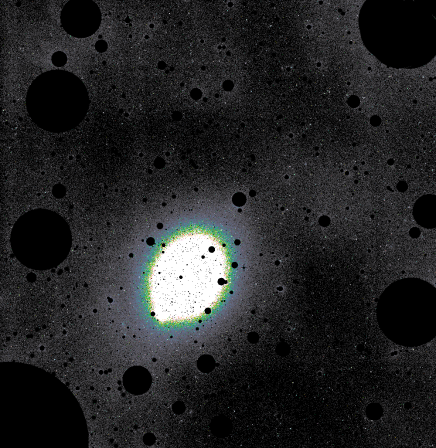
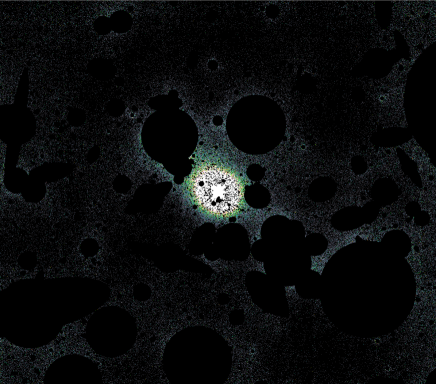
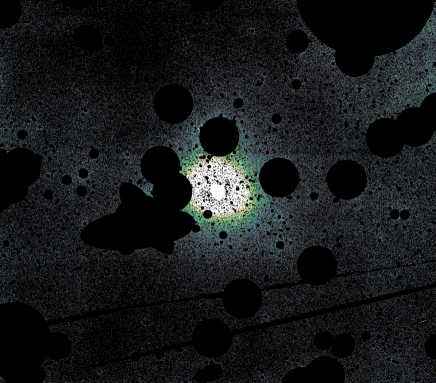
Appendix B Surface brightness profiles in azimuthal sectors
We measured the surface brightness profiles for each galaxy in four azimuthal sectors, in order to test the reliability of the profile measurements at large galaxy radii, and to quantify the combined systematic uncertainties due to masking, assumption of elliptical isophotes, stray-light, etc. The same has been already done for NGC 1399 by Iodice et al. (2016).
We found that the surface brightness profiles in the outskirts of almost all galaxies are on average the same as the azimuthally averaged ones. The only exception is NGC 5044 in the SW sector, where it shows an excess of light. Such excess is observed at bright magnitudes ( 25 mag/arcsec2) and it is in the direction where most of the galaxies belonging to the group are located. Since NGC 5044 belongs to a fossil group of galaxies (Faltenbacher & Mathews, 2005), the excess of light observed in the SW direction could be the signature of the presence of intracluster light.
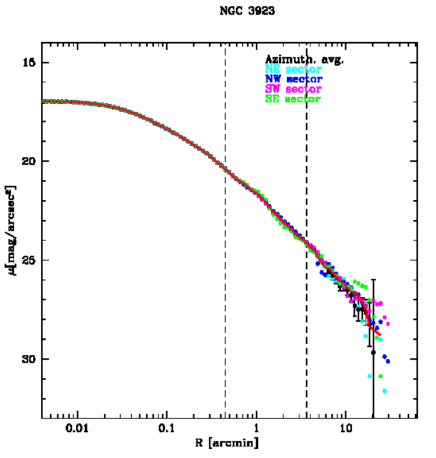
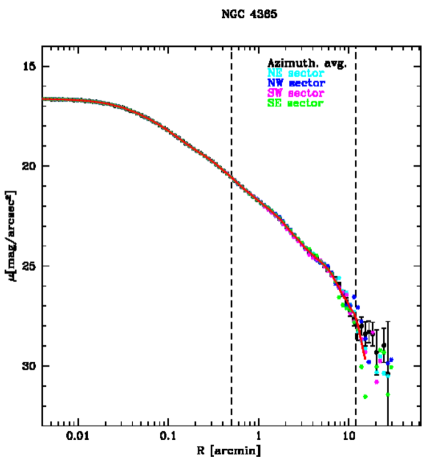
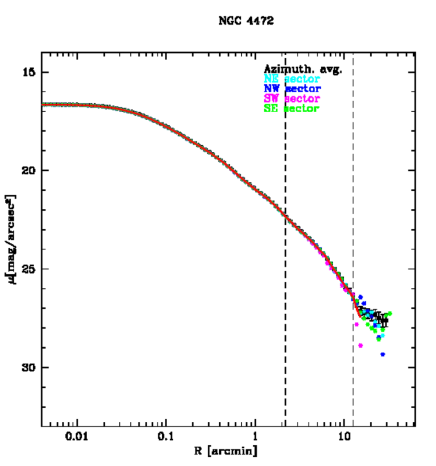
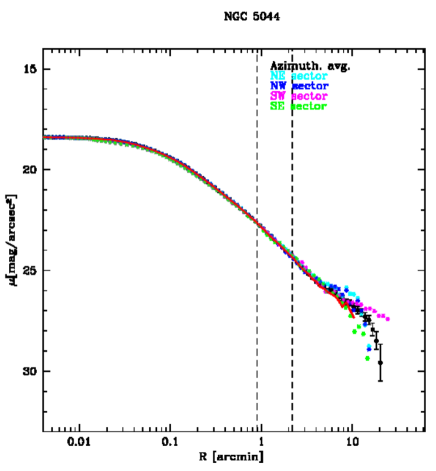
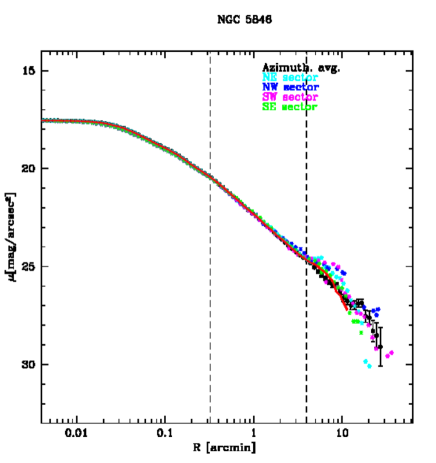
Appendix C Two-component models fixing the innermost (in situ) component
In Sec. 5.3 we presented three-component fits to our sample of ETG light profiles using a theoretically motivated constraint on the Sersic index of the innermost component (representing stars formed in situ) and the outermost component (representing unrelaxed debris). In Fig. 17 and Tab. 8 we present analogous results for the dominant component (representing relaxed accreted stars) when we do not include an exponential outer component. The parameters obtained in this way are more directly comparable to those of other work using two-component fitting (note in particular the higher values of ) but less representative of the behaviour of the outermost part of the profiles in our deep observations.