Do AGN outflows quench or enhance star formation?
Abstract
AGN outflows can remove large quantities of gas from their host galaxy spheroids, potentially shutting off star formation. On the other hand, they can compress this gas, potentially enhancing or triggering star formation, at least for short periods. We present a set of idealised simulations of AGN outflows affecting turbulent gas spheres, and investigate the effect of the outflow and the AGN radiation field upon gas fragmentation. We show that AGN outflows of sufficient luminosity shut off fragmentation while the nucleus is active, but gas compression results in a burst of fragmentation after the AGN switches off. Self-shielding of gas against the AGN radiation field allows some fragmentation to occur during outbursts, but too much shielding results in a lower overall fragmentation rate. For our idealised simulation setup, there is a critical AGN luminosity which results in the highest fragmentation rate, with outflows being too efficient at removing gas when and not efficient enough to compress the gas to high densities otherwise. These results, although preliminary, suggest that the interaction between AGN and star formation in their host galaxies is particularly complex and requires careful study in order to interpret observations correctly.
keywords:
galaxies: evolution — galaxies: active — ISM: evolution — stars:formation1 Introduction
Over the last two decades, essentially irrefutable evidence has been gathered that all massive galaxies (e.g., Kormendy & Ho, 2013), and perhaps even some dwarf galaxies (Lemons et al., 2015) contain supermassive black holes (SMBHs) in their centres and that the masses of these SMBHs correlate with various galaxy parameters, such as the stellar velocity dispersion in the spheroidal component (the relation; Ferrarese & Merritt, 2000; Gültekin et al., 2009; McConnell & Ma, 2013) or the stellar mass of the spheroid (the relation; Häring & Rix, 2004; McConnell & Ma, 2013; Kormendy & Ho, 2013). The usual interpretation of these relations is that they are a signature of co-evolution between SMBHs and their hosts over cosmological timescales (Kauffmann & Haehnelt, 2000; Di Matteo et al., 2005), although this is not a universally accepted explanation (e.g., Hirschmann et al., 2010); for a review, see Kormendy & Ho (2013). A way for the SMBH to impact the properties of the host galaxy is via large-scale outflows driven during the AGN phases; such outflows have been observed in numerous nearby galaxies (Feruglio et al., 2010; Sturm et al., 2011; Cicone et al., 2014). We note, however, that large-scale outflows are not the only possible explanation of co-evolution. See, e.g., Sazonov et al. (2005) for a radiative-feedback-based model and Anglés-Alcázar et al. (2015, 2017) for a model based on gravitational torque-driven SMBH accretion. It is even possible that the correlations appear due to statistical effects of galaxy mergers, rather than any causal connection (Jahnke & Macciò, 2011).
The mass, energy and momentum fluxes of these outflows are well explained by the AGN wind-driven feedback model (King, 2003, 2010; Zubovas & King, 2012). The primary mechanism responsible for inflating the outflows is radiation pressure from the AGN accretion disc (although MHD-driven winds have also been suggested, see Fukumura et al., 2015), which launches a quasi-relativistic () wide-angle wind, carrying of the AGN luminosity as kinetic power. The wind shocks against the ambient medium and heats up to very high temperatures. Theoretical arguments (Faucher-Giguère & Quataert, 2012) and lack of observational evidence of cooling wind shocks (Bourne & Nayakshin, 2013) suggest that under realistic circumstances, the shocked wind bubble cools inefficiently and hence transfers most of its energy to the surrounding medium. This results in the formation of an energy-driven outflow, which expands with a velocity of order km s-1 and can have a mass flow rate of yr-1. The momentum flux of the outflow is more than an order of magnitude higher than the momentum flux of the AGN radiation field (Zubovas & King, 2012); Faucher-Giguère et al. (2012) and Stern et al. (2016) predict similarly large momentum-loading factors.
The outflow has the potential to clear out gas from the spheroid of its host galaxy, thus quenching further star formation (Hopkins & Elvis, 2010; Zubovas & King, 2012). On the other hand, the outflow might compress dense gas clouds as it flows around them, potentially enhancing star formation (Silk, 2005, 2013; Ishibashi & Fabian, 2012; Nayakshin & Zubovas, 2012; Zubovas et al., 2014). It has been suggested that AGN-induced star formation may be responsible for ultraluminous starbursts (Silk, 2005) and the size growth of galaxies from to present day (Ishibashi et al., 2013; Ishibashi & Fabian, 2014). Other models of AGN-induced star formation have been proposed as well, such as the interaction of an AGN jet with the interstellar medium (Silk et al., 2012; Gaibler et al., 2012) or the shocks and compression induced by the backflow of a jet-inflated bubble on to the galactic disc (Bieri et al., 2016). There is some observational evidence for the triggering of star formation by jet coccoons (Crockett et al., 2012). It is currently not clear which of the two processes - gas removal or triggering of star formation - is more important. Observational evidence does not clarify this picture either: starbursts are sometimes observed to occur before the onset of nuclear activity in galaxies (e.g., Schawinski et al., 2009), but an opposite situation, that is, a starburst caused by an AGN, would be impossible to distinguish due to the short lifetimes of AGN (Schawinski et al., 2015; King & Nixon, 2015). Silk & Nusser (2010) even suggest, based on analytical calculations, that AGN-induced star formation is necessary for gas removal from galaxies by outflows, further complicating the issue.
In this paper, we present results of a number of idealised simulations designed to investigate the effect of AGN outflows on the fragmentation of a turbulent gas distribution. With these, we set out to answer two questions:
-
•
What is the effect of outflows driven by AGN of various luminosities upon the spatially-integrated fragmentation rate in a turbulent gas distribution?
-
•
What properties does the gas that eventually turns into stars have just before the passage of the outflow? In other words, what kind of gas is susceptible to fragmentation due to (or despite) the passage of the AGN outflow, and what kind of gas is removed from the galaxy instead?
We find that during the period of activity, AGN radiation and outflows typically quench or at least limit fragmentation rates, but fragmentation resumes after the AGN switches off. There is a critical AGN luminosity which leads to the highest average post-AGN star formation rate. Sink particles tend to form either in dense infalling filaments or at the edges of outflow bubbles. In the latter case, the sink particles have systematically higher radial velocities than gas does on average, which could lead to corresponding stars being observationally distinguishable from stars formed elsewhere in the galaxy. On smaller scales, most of the pre-existing dense clumps are obliterated by AGN outflows and the material that fragments after the AGN switches off is different than the material that would have fragmented without AGN influence.
We structure the paper as follows. In Section 2, we present the numerical model of our simulations. The results are shown in Section 3. Finally, we discuss and summarize these results in Section 4, with particular emphasis on how they can inform more detailed simulations and analysis of observations.
2 Simulation setup
The simulation set-up is similar to that used in our previous simulations of AGN outflows (e.g., Nayakshin & Zubovas, 2012; Bourne et al., 2015; Zubovas et al., 2016). We use the hybrid SPH/N-body code GADGET-3 (a modified version of the publically available GADGET-2 Springel, 2005), with the SPHS (Read et al., 2010; Read & Hayfield, 2012) flavour of SPH and the Wendland kernel (Wendland, 1995; Dehnen & Aly, 2012) with 100 neighbours.
The initial conditions for all simulations are a spherical shell of gas with inner and outer radii and kpc, respectively. The shell has a density profile and a total mass of , tracked with particles, giving a particle mass of . The shell is placed in a background isothermal potential with a 1D velocity dispersion km s-1 and is initially given a turbulent velocity field, with a characteristic velocity . We allow the gas to evolve for Myr before turning the AGN on (see below), in order for the density field to become inhomogeneous. During this relaxation period, the gas is affected by all relevant processes - its own gravity, the gravity of the background potential, hydrodynamic forces, including the initial turbulent velocity field, as well as cooling using the same Sazonov et al. (2005) prescription as is done during the rest of the simulation (see below).
After the initial relaxation period, the AGN is turned on in the centre of the gas distribution. The AGN luminosity is fixed to a constant value for the whole duration of its activity ; and are the free parameters in our simulations. The AGN affects gas by heating it directly, and by producing wind feedback. Gas heating and cooling is treated using the prescription from Sazonov et al. (2005), which is specifically designed to follow optically thin gas exposed to a standard AGN spectrum. This cooling function was modified to neglect Compton cooling, a change appropriate for the two-temperature plasma, which is the state of the hottest outflowing material. The prescription does not include the effects of radiation pressure. In principle, this is a drawback, however in our particular case, the energy-driven AGN outflow provides a momentum rate at least one order of magnitude greater than the momentum rate (pressure force) of the radiation field, therefore we think it is not unreasonable to neglect the effect of radiation pressure.
In addition, in several simulations we implement a crude approximation of gas optical depth, by calculating the radial profile of optical depth of the initial gas distribution, and multiplying that value by the local gas density:
| (1) |
Here, cm2 g-1 is the electron scattering opacity, is a dimensionless free parameter, and are the density and radial coordinate of the gas particle, and kpc is the inner edge of the initial gas distribution. This approximation implicitly assumes that all significant deviations from the initial density distribution happen in the vicinity of the particle in question. This is not accurate, but does not require almost any extra computation time, while providing some shielding from the effects of AGN radiation in the densest regions and allowing them to cool and fragment more efficiently than otherwise.
The Sazonov et al. (2005) cooling function is valid only for temperatures above K; for colder gas, we adopt the cooling function of Mashchenko et al. (2008), which allows cooling down to K, incorporating atomic, molecular and dust-mediated cooling in Solar-metallicity gas.
AGN wind feedback is modelled with the virtual particle method of Nayakshin et al. (2009). The AGN emits tracer particles spherically symmetrically; these particles represent the AGN wind, which is too dilute and too fast for full hydrodynamical modelling to be feasible in SPH simulations. The virtual particles carry momentum and energy in straight lines, and transfer these quantities to SPH particles encountered along the way. The transfer of momentum and energy represents the interaction between the wind and the surrounding ISM. This method does not produce a reverse wind shock, however the contact discontinuity and the forward shock are produced and evolve consistently with the analytical predictions (Zubovas & Nayakshin, 2012; Zubovas & King, 2012). Since we consider situations where the wind shock cools inefficiently, we allow all of the virtual particle energy to be transferred to the SPH particles. This method, by construction, takes into account different optical depths along different lines of sight from the AGN and allows simultaneous gas inflows and outflows to form in a multiphase medium (Zubovas et al., 2016).
The mass resolution of our simulations does not allow us to track the formation of individual stars. Instead, we adopt a density-based temperature floor, which ensures that the Jeans mass of all gas particles does not fall below the resolution limit:
| (2) | ||||
where is the mean molecular weight and is the number of SPH neighbours. Particles that lie on this temperature floor can turn into sink particles with a probability , where is the current particle time-step and is the local free-fall time. The sink particles represent dense molecular clouds, which we expect to form stars rather quickly. This expression assumes that the efficiency of fragmentation is , i.e. of the gas that can fragment will do so in one dynamical time. The actual star formation efficiency (SFE) is not straightforward to determine. In an unperturbed ISM, for structures of the mass scale equivalent to the particle masses in our simulations, it is of order a few percent (McKee & Ostriker, 2007), so our estimates of fragmentation rate could be taken as an upper limit to the star formation rate. On the other hand, external compression can enhance the star formation efficiency (Whitworth et al., 1994; Zubovas et al., 2014), so the actual SFE might be greater than quoted above. Stellar feedback complicates the issue further, as it can both reduce the density of the surrounding gas and hence the fragmentation rate (Bate, 2009) or compress surrounding material and enhance fragmentation; neither process is modelled in our simulations. Therefore we caution the reader to not interpret the fragmentation rates given in the Results section as equivalent to the star formation rates, however the qualitative behaviour and comparison of different systems should still be valid even with this approximation in place.
3 Results
3.1 Simulation parameters
There are two free parameters that we vary in most of our simulations. The AGN luminosity is given one of seven values: erg s-1, where or . The luminosity value with corresponds to the Eddington luminosity for a SMBH. It is also the critical luminosity required for the AGN wind momentum to clear the gas from a km s-1 potential, assuming that the gas is smoothly distributed and the outflow propagates spherically symmetrically. As we have shown in previous papers (Bourne et al., 2015; Zubovas et al., 2016) and show again below, this luminosity is not high enough to drive an outflow in a turbulent medium.
The duration of the AGN episode is either constrained to Myr, or kept infinite. Although a Myr duration is longer than the timescale over which AGN are expected to flicker ( yr, Schawinski et al., 2015; King & Nixon, 2015), we expect that multiple flickering episodes combine to produce a single outflow. Myr might be a reasonable duration for a single AGN feeding event, i.e. the time required for a several-parsec-scale gas reservoir to be consumed. Thus the two cases of allow us to investigate how the surrounding gas reacts both to a driven AGN outflow and to a coasting one.
We also run three simulations investigating the effect of gas self-shielding, as described above. These simulations are based on the one with the luminosity value and Myr and differ by the adopted self-shielfing factor ; we use to investigate these differences.
Each simulation is labelled using the following convention: L#[T1[Sz]], where is the value of luminosity (see above), T1 identifies simulations with Myr and the number next to S gives the value of ; simulations without a T1 identifier have , while simulations without an Sz identifier have .
3.2 Outflow propagation


In all simulations, the gas is allowed to relax for Myr before the AGN is switched on. This creates a turbulent density structure, with the ratio between the highest and lowest effective gas fraction () of order 30. Approximately of the gas is swallowed by the SMBH sink particle and of the gas is turned into sink particles during this time.
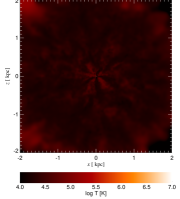
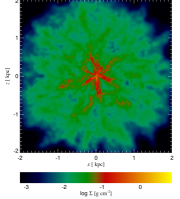
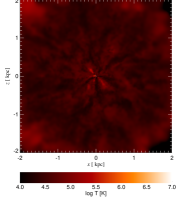
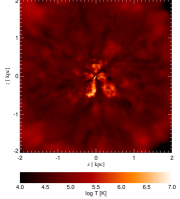
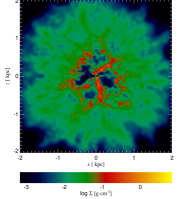
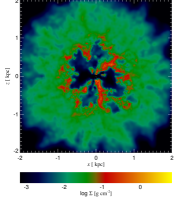
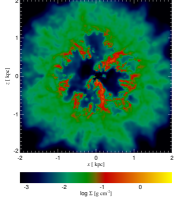
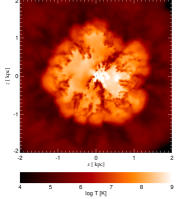
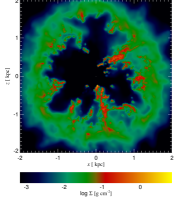
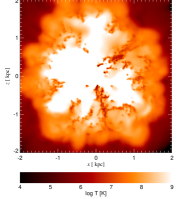
Once the AGN switches on, an outflow begins to propagate through the system, provided that the AGN luminosity is large enough (see Figure 1, left panels). It is unable to stop the accretion of the densest gas, and produces bubbles which contain most of the input energy. Dense filaments form in between the bubbles and continue feeding the SMBH. As expected, the bubbles are more pronounced and the mass outflow rates are higher in the higher luminosity simulations.
The density contrast increases during AGN activity, as material is removed from some parts of the simulation but not others. In the L0.5, L1 and L2 simulation pairs (all pairs evolve identically until Myr), the density contrast is not much higher at Myr than in the control simulation at the same time. In L3 simulations, the ratio between highest and lowest effective gas fractions increases to , i.e. by a factor ten, from Myr to Myr. This ratio is in L4 simulations, in L5 and in L10. The highest effective gas fraction is always at the radius where the outer edges of the outflow bubbles are. As expected, the more powerful the AGN is, the more effective it is at compressing gas at the leading edge of the outflow bubble. If the AGN was active for a longer time, or if the mean gas density was lower, these bubbles would escape from the gas shell and the density contrast would decrease.
3.3 Integrated fragmentation rates
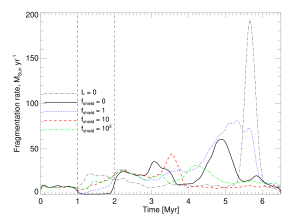
The right panels of figure 1 show the fragmentation rates in the simulations with AGN phase duration of Myr, plus a control simulation with no AGN. All fragmentation rates in this and subsequent figures are sampled every yr, but smoothed using a normalised kernel with weights in order to reduce spurious noise. The fragmentation rate before the AGN switches on is a few yr-1, and remains at that rate in the control simulation until Myr and then increases to yr-1, due to material falling inwards and reaching higher densities. Later, as material is consumed, the fragmentation rate drops down to its initial values, except for a significant peak at Myr, which happens because turbulent motions decay and are no longer able to support the gas against dynamical collapse toward the centre.
In the simulations with , AGN activity rapidly suppresses fragmentation. In L3T1, L4T1 and L5T1 simulations, this suppression lasts until the AGN switches off. The suppression is caused by two effects: AGN heating evaporates some clumps and heats the gas overall, slowing its fragmentation (see Figure 1, middle panels), while the AGN wind outflow pushes gas away from the centre, thus diluting it. In the L0.5T1, L1T1 and L2T1 simulations, the wind is not powerful enough to prevent gas accretion toward the centre, and dense filaments of inflowing gas form and begin fragmenting even before the AGN switches off. The fragmentation rate is higher in the L2T1 simulation than in the L1T1 because the filaments are further compressed by the outflow bubbles. When the densest gas fragments, the less dense leftover material is again pushed away by the outflow and further fragmentation decreases until the AGN switches off. At later times, simulations L0.5T1, L1T1 and L2T1 follow closely the control simulation, because the effect of the outflow upon the global gas properties was negligible.
Once the AGN switches off, the outflow stalls and begins collapsing back to the centre. In the L3T1 simulation, fragmentation resumes immediately and its rate increases to yr-1, as the dense filaments that fragment had already begun their fall toward the centre even before the AGN switched off (see the discussion regarding the L3 simulation later in this Section). A similar effect can be seen at Myr in the L4T1 simulation. The outflow itself stalls and begins collapsing somewhat later, resulting in peaks in the fragmentation rate: at Myr for L3T1, Myr for L4T1 and Myr for L5T1. It is worth noting that both the mean and the peak fragmentation rates in the L5T1 simulation are lower than in the L3T1 and L4T1 simulations. This happens because in L5T1, the AGN is powerful enough to remove some of the gas to very large distances, so there is less gas available for star formation. This effect is even clearer in L10T1, which shows a fragmentation rate rather similar to the control simulation.
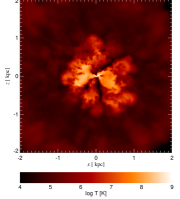
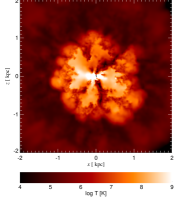
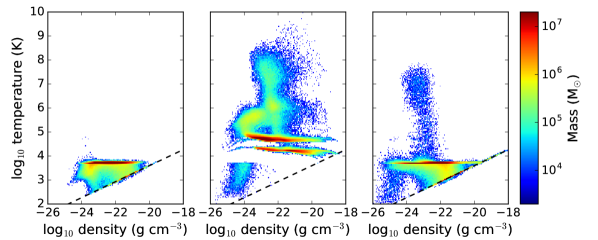
The effect of AGN activity upon the gas distribution can be understood by considering the phase diagrams of the gas. In Figure 3, we show the density-temperature plots of the gas in the L3T1 simulation at Myr, Myr and Myr (left, middle and right panels, respectively). At early times, a lot of gas has cooled down to the temperature floor (the dashed line) and is able to fragment. AGN activity pushes the gas away from this floor by heating it. The heating-cooling prescription of Sazonov et al. (2005) that we use allows gas to be in approximate thermal equilibrium at two temperatures, with rather weak dependence on density K and K. Both of these temperatures are much higher than the temperature floor for all except the densest gas, therefore gas can fragment into resolved clumps with masses , where cm-3. Clumps of this mass and density have electron scattering optical depth , therefore the assumption that the gas is optically thin to the radiation field is valid (but see Section 3.6 for discussion of this assumption in general). This heated gas, as a result, is kept from fragmenting and forming stars. The gas is also compressed, but that effect is not powerful enough to compensate for the heating and therefore fragmentation ceases. Once the AGN switches off, gas can cool down, and fragment again, but typically cools down while being compressed by the surrounding hot gas, leading to an increase in density.
Beyond Myr, simulations L0.5T1, L1T1, L2T1 and, to some extent, L3T1 and L4T1 enter a different evolutionary phase. By this time, the initial turbulence has decayed significantly and material is falling toward the centre in dense filaments. These filaments reach the threshold density for fragmentation and therefore produce a lot of sink particles, with fragmentation rates rising to yr-1 for a short while. These peaks are not realistic, because in a real system, stellar feedback would prevent such coherent filaments from maintaining these high densities.
The mean fragmentation rate in the period between and Myr ( Myr for L5T1, to encompass the peak at Myr) is and yr-1 for L0.5T1, L1T1, L2T1, L3T1, L4T1, L5T1 and L10T1, respectively. In the control simulation over the same period, yr-1. We see that the L0.5T1, L1T1 and L2T1 simulations do not show significant enhancement of mean fragmentation rate over the control simulation, while L3T1, L4T1 and L5T1 do; L10T1, once again, shows a fragmentation rate similar to that of the control simulation. In particular, L4T1 shows a mean fragmentation rate which is nearly five times greater than that in the control simulation. We interpret this result as a sign that there is a critical luminosity which leads to the highest post-AGN star formation rate. At luminosities higher than critical, the AGN outflow removes some of the gas from the galaxy, reducing the amount of fuel available for star formation. At luminosities lower than critical, the outflow is not as efficient in compressing the gas to high densities and creating conditions favorable to star formation The precise value of the critical luminosity certainly depends on the properties of the gas distribution and the galactic potential, but exploration of these parameters is beyond the scope of the current paper.
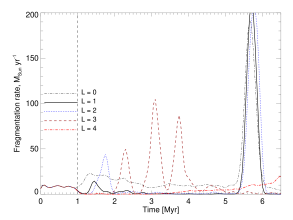
In Figure 4, we show fragmentation rates of gas in five simulations with continuous AGN activity; we do not show or analyse simulation L0.5, since its fragmentation rate are either identical to the control simulation, or simulations L5 and L10, since their fragmentation rates are negligible, after Myr. Simulations L1 and L2 do not experience significant fragmentation after a short burst between and Myr until Myr. This happens because AGN heating keeps the gas above the temperature floor, even though the outflow is unable to remove the gas from the galaxy (see also Figure 3). After Myr, once turbulence has decayed, the AGN is unable to heat up the dense infalling filaments and a burst of fragmentation occurs as in the control simulation. Simulation L4 quite predictably shows very little fragmentation, as the AGN outflow efficiently removes gas out of the potential well; even though this gas cools, it never reaches high enough densities for fragmentation. The L3 simulation is most interesting, showing three peaks of fragmentation. In this simulation, the gas undergoes a cycle of expulsion to large distances, cooling, recollapse toward the centre and significant fragmentation, then heating and expulsion again as the densest gas is turned into sink particles. After three such cycles, the outflowing shell is no longer dense enough to cool and collapse efficiently.
3.4 Locations of fragmentation
In order to get a better understanding of the properties of the gas which turns into sink particles, we consider the locations where sink particles appear. We choose two representative simulations, L3T1 and L5T1. For each sink particle that appears in those simulations during the first Myr of evolution, we check the location where it appeared and consider its properties at the moment of formation.
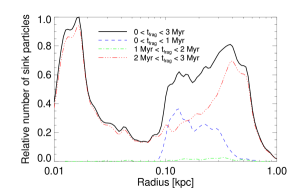
Figure 5 shows the radial coordinates where sink particles appeared in simulations L3T1 (left) and L5T1 (right), separated into three time bins: particles appearing before the AGN switches on at Myr, particles appearing during the period of AGN activity ( Myr Myr) and particles appearing after the AGN switches off ( Myr).
As expected, fragmentation before the AGN switches on is confined to the inner edge of the shell, located at kpc (blue dashed line). During the period of AGN activity, there is very little fragmentation (green dot-dashed line), and it happens slightly further outward than before AGN activity, as the gas is being pushed away by the outflow. Once the AGN switches off, fragmentation rates increase significantly. In the L3T1 simulation, a two-peaked radial distribution emerges (red triple-dot-dashed line). Some of the gas falls in toward the SMBH and fragments as its density increases close to the accretion boundary at kpc. However, a significant amount of fragmentation happens at the outer edge of the outflow bubble at kpc kpc. This shows that the outflow compresses some gas and induces fragmentation there. This effect is even more evident in L5T1, where most of the fragmentation after Myr happens in a shell with kpc kpc.
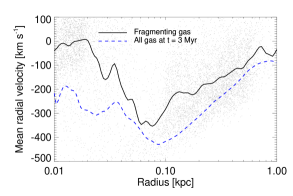
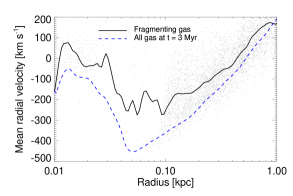
Figure 6 highlights the radial velocities of sink particles at the moment of formation and compares them with the radial velocities of gas at Myr in the two simulations. The general trend in both L3T1 (left panel) and L5T1 (right panel) is similar: fragmenting gas has significantly higher mean radial velocity than all gas. The difference in velocities can be as large as km/s, especially at kpc and kpc in L3T1 and kpc in L5T1. Typically fragmenting gas has a km/s higher mean radial velocity than all gas. This behaviour is expected, because a lot of fragmentation occurs at the edges of the outflowing bubbles, rather than in the infalling filaments.
It is rather interesting that the radial velocity difference is so large at low radii in L3T1. This happens because gas that is falling in radially toward the centre, with large negative radial velocity, gets stretched out and its density decreases, preventing fragmentation. However, the gas that has some angular momentum and begins orbiting the SMBH accumulates and fragments into sink particles. Therefore the sink particles tend to have very low absolute radial velocities, but rather high tangential velocities, in the central regions of the simulation. This is another effect of the AGN: it helps redistribute the angular momentum of gas, providing avenues for parcels of gas with nonzero angular momentum to fall close to the centre and begin orbiting the SMBH, rather than falling in after losing angular momentum due to dynamical interactions with the rest of the gas (this effect has been analysed before by Dehnen & King, 2013).
One more point to note is that the stars forming at the edge of the outflow bubble inherit its expansion velocity, and therefore some of them have radial velocities of several hundred km/s. Such stars would be distinguishable by their kinematics, and may provide evidence of recent AGN activity in the host galaxy. We return to this point in Section 4.2.
3.5 AGN effects on individual gas clumps
We have shown that AGN activity has a global effect on fragmentation rates in the host galaxy spheroid. However, this global effect can be achieved in several ways. For example, the AGN outflow may push already dense gas clumps above the density threshold. Alternatively, outflow compression might be strong enough to produce new clumps which would otherwise disperse or not form at all. In order to distinguish between these possibilities, we consider the properties and evolution of three related subsets of particles:
-
•
Those gas particles which turn into sink particles between Myr and Myr in the control simulation;
-
•
Those gas particles which turn into sink particles between Myr and Myr in the simulation L3T1;
-
•
Those gas particles which turn into sink particles between Myr and Myr in the simulation L5T1.
We track the first subset of particles in all three simulations - control, L3T1 and L5T1. By considering how the particles that would have turned into sink particles without AGN activity evolve in the presence of an AGN outflow, we can quantify the quenching effect of AGN activity on star formation. The other two subsets are tracked in their respective simulations and in the control simulation. This way, we can quantify the enhancing effect of AGN activity.
In the control simulation, we select 5113 particles. Of these, only 182 turn into sink particles in the L3T1 simulation. The rest are either accreted by the SMBH (1648 particles) or remain in the gas phase by Myr (3283 particles). Conversely, of the 7020 particles selected in the L3T1 simulation, 5952 are accreted in the control simulation and 886 remain in the gas phase by Myr, with the remaining 182 being the particles that turn into sink particles in both L3T1 and control simulations.
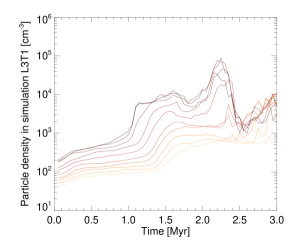
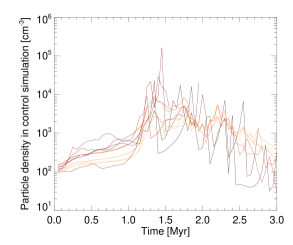
Next, we consider the density histories of the particles that turn into sink particles in one of the simulations, but remain gaseous in another. Figure 7 shows the density evolution of these particles. On the left, we represent the 3283 particles which turn into sink particles in the control simulation, but remain gaseous by Myr in the L3T1 simulation, by grouping them into ten subsets by time of fragmentation in the control simulation and averaging the density histories in each subset. The line colours, from darkest to brightest, indicate increasing from Myr to Myr in intervals of Myr. On the right, we represent, in analogous fashion, the 886 particles which turn into sink particles in L3T1, but not in the control simulation. For the particles selected from the control simulation (left panel), there is a trend of initially increasing density, which jumps up and plateaus soon after Myr. In the control simulation, these particles experience further density increase and turn into sink particles, but AGN feedback prevents them from doing so in L3T1. Later, once the AGN activity ceases, the sudden reduction in heating rate results in further contraction of the densest gas and increase in their densities. However, after Myr, a lot of dense clumps evaporate in the outflow bubbles and the mean density of the constituent particles decreases significantly. The particles which fragment at late times in the control simulation (brightest lines) experience a rather gradual density increase throughout the period until Myr, as they are further from the AGN and/or better shielded from the outflow by dense filaments.
Among the particles selected from simulation L3T1, only a single trend is evident independently of fragmentation time. In simulation L3T1, these particles enter dense filaments that get further compressed by the outflow bubbles, leading to fragmentation. In the control simulation, the filaments are not compressed as much, so there is less fragmentation there. At first (up to Myr), the formation and contraction of filaments is the dominant process, so the particle density increases. At later times, stretching of the filaments starts to dominate, leading to a gradual decrease in density.
The difference between the control simulation and simulation L5T1 is even more striking: only 76 particles turn into sink particles between and Myr in both simulations. 460 particles that turn into sinks in the control simulation are accreted by the SMBH in L5T1, while 4577 remain in the gaseous state. 2903 particles that turn into sinks in L5T1 are accreted in the control simulation, and 708 remain gaseous. The density histories look qualitatively similar to those depicted in Figure 7.
Overall, these results suggest that AGN activity has a very powerful effect on the gas distribution, but that effect is neither purely quenching star formation, nor purely enhancing. Individual dense gas clumps, with densities of a few times cm-3, can survive for some time in AGN outflows, but are eventually dispersed. Their fragmentation can be suppressed by the AGN radiation field. On the other hand, AGN outflows push together material which can then cool down and form new dense clumps which experience significant fragmentation and subsequent star formation. In other words, the effect of AGN activity upon star formation in its host galaxy is more global (changing which has forms stars) than local (affecting pre-existing star formation regions), even though local effects are not completely negligible either.
3.6 Effects of self-shielding
So far, we have assumed that all the gas in the simulations is optically thin to the AGN radiation field. This is not generally true, as a column density of cm-2 is enough to make the gas Compton-thick. Such large column densities might not be reached on large scales (although some of AGN in the local Universe might be Compton-thick; cf. Akylas et al., 2012), but individual clumps might be strongly shielded. A detailed analysis of this shielding is beyond the scope of the paper, but we can estimate the impact of gas self-shielding by reducing the ionisation parameter of the gas assuming the gas has an optical depth proportional to the local density and distance from the AGN, as described in equation (1).
Figure 8 shows the fragmentation rates of simulations L5T1, L5T1A1, L5T1A10 and L5T1A1000, with progressively stronger shielding, in addition to the control simulation with . Considering the time period , even allows some fragmentation to occur, while and result in almost identical fragmentation rates, both times lower than that in the control simulation. From this we can conclude that both the kinetic power of AGN outflows and the AGN radiation field reduce the fragmentation rate by similar amounts, so that when the radiation field effect is negated by shielding, the fragmentation rate drops only by .
After the AGN switches off, all four simulations evolve in a similar manner at first, with statistically insignificant differences up to Myr. At that point, the efficiently shielded simulations ( and ) continue to have fragmentation rates not much higher than those in the control simulation, while the less shielded ones experience bursts of fragmentation. This seemingly paradoxical outcome can be understood as a result of isobaric gas cooling. When gas self-shielding is low or nonexistent, more gas heats up to intermediate temperatures K during the AGN phase. When the AGN switches off, this gas cools down while still being compressed by the hottest material with K. Since the hottest material cools down inefficiently, the cooling of the intermediate-temperature gas is mostly isobaric, i.e. its density increases as temperature decreases. In the unshielded simulations, this results in a lot of gas cooling down to the temperature floor at very high density and rather large temperature K. On the other hand, in the shielded simulations, a lot of gas piles up at K without reaching the temperature floor first. Therefore, the unshielded simulations have more material available for fragmentation, resulting in a higher fragmentation rate.
The true effect of gas self-shielding is likely to be somwhere between the extremes explored here. Diffuse gas, especially that within outflows, is most likely less shielded than assumed here, while dense gas might be shielded better. Long filaments, which tend to form especially in lower-luminosity simulations, also shield gas behind them, potentially increasing the fragmentation rate during the AGN phase, but reducing it afterward. We plan to explore these issues in the future (see also Section 4.4).
4 Discussion and conclusions
4.1 Summary of results
In this paper, we presented results of a number of simulations designed to showcase the effects that AGN activity has upon fragmentation rates in a surrounding turbulent gas shell. The idealised initial conditions can mimic a gas-rich galaxy bulge. We ran simulations with five values of AGN luminosity (equal to Eddington luminosity for a SMBH) and two values of duration of activity (1 Myr and infinity), plus a control simulation, as well as considering the effects of gas self-shielding against the AGN radiation field. The main results are:
-
•
AGN activity efficiently stops gas fragmentation while the AGN is active, so long as the AGN is powerful enough. In the two lowest-luminosity simulations, fragmentation resumes before the AGN switches off, even though those luminosities are formally large enough to drive a large-scale outflow through the gas of density equal to the mean density in the simulations.
-
•
Once the AGN switches off, fragmentation resumes very quickly, as gas compressed by the outflowing bubbles cools down.
-
•
There is a critical AGN luminosity which produces a maximum enhancement of fragmentation rate. For our setup, this luminosity is erg s-1, approximately four times higher than the formal luminosity necessary for the AGN momentum to drive a large-scale outflow. At this critical luminosity, the fragmentation rate is enhanced by almost a factor 5.
-
•
In the gas shell affected by the AGN outflow, fragmentation occurs in two regions: dense filaments as they fall in toward the SMBH and the edges of the outflow bubbles. The second region becomes progressively more important with increasing AGN luminosity.
-
•
Fragmenting gas has systematically higher radial velocities than all gas. In particular, at the edge of the AGN bubbles, fragments form with positive radial velocities and may be expected to move far out from their locations of formation.
-
•
Most of the fragmenting particles are different between the control simulation and simulations with AGN. This shows that AGN outflows tend to destroy the majority of dense gas clumps, but later produce conditions favourable for the formation of new dense clumps.
4.2 Kinematics of young stars
The gas that fragments in simulations with AGN, and the sink particles themselves (and hence the stars they represent) move with systematically higher radial velocities than the mean velocities of the gas. This is not unexpected: sink particles appear preferentially on the outskirts of outflow bubbles and inherit the velocity of those bubbles, which keep expanding for a long time (up to an order of magnitude longer than the AGN phase itself, c.f. King et al., 2011) after the AGN has switched off. In simulations where the outflow bubbles can escape from the galaxy (L4T1, L5T1 and L10T1), sink particles forming among them have almost only positive radial velocities, with of all sink particles forming with . This leads to two consequences for observing such systems:
-
•
The stellar population in the spheroid of a galaxy that recently underwent a period of AGN activity has a velocity structure biased toward positive radial velocities.
-
•
Some newborn stars might move to the halo of the host galaxy or escape from it altogether.
The importance of these two effects depends strongly on the gas content of the galaxy spheroid at the time the outflow is inflated. In gas-poor galaxies, the outflow propagates rapidly, but gas density does not reach large enough values for fragmentation. In gas-rich galaxies, star formation is rapid, but the outflow might not attain large enough radial velocities to produce outflowing stars. We plan to investigate this dependence in future work (see also Section 4.4).
A radial anisotropy of stellar velocity dispersion would be difficult to identify and to interpret as evidence of recent AGN activity due to difficulties in modelling stellar orbits and their anisotropies in external galaxies (Cappellari et al., 2013; Falcón-Barroso, 2016). Nevertheless, we predict that galaxies showing evidence of recent AGN activity, such as hot gas bubbles on galactic outskirts (analogous to the Fermi bubbles, Su et al., 2010) or young stars very close to the nucleus (analogous to the disc of young stars in the Galactic centre, Paumard et al., 2006) may also have radially-biased stellar velocity dispersions. By itself, this feature would not distinguish galaxies which recently underwent an AGN phase, because radially-biased velocities may appear for other reasons. However, in combination with other lines of evidence, information about stellar velocity dispersion would strengthen the case for recent AGN activity. A more detailed analysis, showing higher radial velocities for young stars than for old ones, would strengthen this argument further.
Several authors predicted the possibility of high-velocity stars forming due to AGN activity. For example, Silk et al. (2012) proposed that AGN jets can induce star formation and lead to formation of hypervelocity stars. In Zubovas et al. (2013a), we also predicted that stars forming in AGN outflows might escape galaxies, using a more idealised spherical initial gas distribution than here. In particular, this process would produce high-metallicity stars in galactic outskirts, which may be used as another piece of evidence for recent AGN activity. Although identifying individual stars may be difficult, stacking observations can help reveal their influence upon extragalactic light (Zibetti et al., 2005).
It is interesting to note that recently, star formation has been detected within a galactic outflow. Observations of a merging system IRAS F23128-5919 revealed a spatially-resolved outflow with clear evidence of star formation occurring within, at rates of yr-1 (Maiolino et al., 2017). More such systems may be discovered in the near future, and exploration of the correlations between AGN properties and star formation rates in their outflows will provide new insights into AGN-galaxy coevolution.
Finally, some of the stars ejected from the bulge of a disc galaxy by this mechanism may not be able to escape from the galaxy altogether, but might end up falling on to the galaxy disc, contributing to its stellar population. The numbers of such stars are unlikely to be large, but they might be discernible due to having abnormally large metallicity compared with the average for their present location.
4.3 Implications for interpretation of outflow observations
It is generally thought that starbursts precede AGN activity by a period of yr (Davies et al., 2007; Schawinski et al., 2009; Wild et al., 2010). Here we show that the opposite might also be true: a starburst may be seen in a galaxy for several Myr after the AGN phase ends. Such starbursts would occur in the spheroidal component of the galaxy (although the disc might experience a starburst of its own due to the outflow compressing its gas vertically; see Zubovas et al., 2013b; Zubovas & King, 2016). They might be accompanied by the presence of a fading AGN, which is no longer able to prevent gas from collapsing and fragmenting. We note that AGN are sometimes associated with elevated star formation both throughout the host galaxy (Santini et al., 2012) and in the central regions (LaMassa et al., 2013), but determining the causal connection between the two processes may be very difficult. There are several ways to disentangle this relationship:
-
•
In this paper, we show that SFR enhancement should be correlated with the fading of the AGN, so detection of a fading AGN together with a starburst in the central region of the galaxy would suggest that the AGN has enhanced the host galaxy’s SFR.
-
•
Observations with high spatial resolution would help determine whether the starburst is spatially correlated with the AGN outflow. For example, Carniani et al. (2016) present observations of high-z AGN outflows, showing some evidence that star formation might be enhanced along the edges of the outflow bubbles, consistent with the results of our simulations.
-
•
Small-scale numerical simulations of the star formation process in AGN-outflow-affected gas might help distinguish this mode of star formation from regular star formation. For example, AGN-enhanced star formation would have higher gas densities in the star-forming regions: in our simulations, sink particles that appear after the AGN switches off form from times denser gas on average than sink particles that appear before the AGN switches on. A more detailed analysis of these aspects is left for a future study.
4.4 Drawbacks and possible improvements
While our simulations reveal interesting behaviour, they are idealised in many ways, limiting their usefulness in directly predicting observational signatures of AGN-influenced star formation. We plan to address these issues in future publications. Here we briefly comment on the major drawbacks of the current simulations.
The complex evolution of AGN outflows and their interaction with the ISM depend significantly on the distribution of the ISM in phase space. Therefore, more realistic initial conditions are necessary in order to be able to predict AGN outflow effects upon star formation in various galaxies. We plan to run similar simulations for galaxies with bulges with different gas content, size and shape, to estimate the importance of AGN-induced star formation at different redshifts (represented by gas fraction) and for different galaxy morphological types (represented by bulge size and shape).
As discussed above, in Section 3.6, gas self-shielding may have a significant impact upon gas fragmentation rates. Here we estimated its effect by assuming that gas density is never very different from an isothermal distribution, which is clearly incorrect, especially with high-luminosity AGN driving a large outflow. A more realistic estimate of the optical depth is required. A full radiative transfer implementation would make the simulation unfeasibly slow, but using a separate set of virtual particles to represent photon packets of the AGN radiation field, in addition to the virtual particles representing the relativistic wind, may solve the issue. We are currently working on developing such a feedback prescription (Sabulis & Zubovas, in preparation) and will use it to update AGN outflow simulations when it is ready. This improvement might also help understand how star formation occurs while the AGN is still active and heating the gas.
Small-scale simulations of individual clumps evolving within a hotter AGN outflow would help understand the star formation process better. In idealised simulations, we showed that fragmentation is more efficient in externally-compressed clouds (Zubovas et al., 2014), but those simulations did not include stellar feedback. Feedback, in the form of radiation and winds from newborn stars, might heat dense clumps and perhaps break them up, reducing the numbers and masses of stars forming there. Therefore, including stellar feedback in both small-scale and larger simulations of AGN-induced star formation is an important step.
Finally, our current simulations had no connection between the accretion on to the SMBH particle and the AGN luminosity. While it is unlikely that such a connection would exist on the short (several Myr) timescales probed here, it matter for longer-term simulations. AGN activity regulates the SMBH mass supply; it is important to understand how this self-regulation is affected by star formation within the AGN outflow.
The interaction between AGN outflows and star formation in the host galaxy is a complex issue, involving many spatial and temporal scales. The possibility of star formation within the outflows themselves is a rather new aspect of the problem, and our simulations are one of the first analysing when and where this star formation might occur. In this way, our work complements others in the field of AGN-galaxy coevolution.
Acknowledgments
KZ is funded by the Research Council Lithuania through the National Science Programme grant no. LAT-09/2016. MAB acknowledges support by the ERC starting grant 638707 “BHs and their host galaxies: co-evolution across cosmic time.” Simulations were performed on resources at the High Performance Computing Center “HPC Sauletekis” in Vilnius University Faculty of Physics.
References
- Akylas et al. (2012) Akylas A., Georgakakis A., Georgantopoulos I., Brightman M., Nandra K., 2012, A&A, 546, A98
- Anglés-Alcázar et al. (2015) Anglés-Alcázar D., Özel F., Davé R., Katz N., Kollmeier J. A., Oppenheimer B. D., 2015, ApJ, 800, 127
- Anglés-Alcázar et al. (2017) Anglés-Alcázar D., Davé R., Faucher-Giguère C.-A., Özel F., Hopkins P. F., 2017, MNRAS, 464, 2840
- Bate (2009) Bate M. R., 2009, MNRAS, 392, 1363
- Bieri et al. (2016) Bieri R., Dubois Y., Silk J., Mamon G. A., Gaibler V., 2016, MNRAS, 455, 4166
- Bourne & Nayakshin (2013) Bourne M. A., Nayakshin S., 2013, MNRAS, 436, 2346
- Bourne et al. (2015) Bourne M. A., Zubovas K., Nayakshin S., 2015, MNRAS, 453, 1829
- Cappellari et al. (2013) Cappellari M., et al., 2013, MNRAS, 432, 1709
- Carniani et al. (2016) Carniani S., et al., 2016, A&A, 591, A28
- Cicone et al. (2014) Cicone C., et al., 2014, A&A, 562, A21
- Crockett et al. (2012) Crockett R. M., et al., 2012, MNRAS, 421, 1603
- Davies et al. (2007) Davies R. I., Müller Sánchez F., Genzel R., Tacconi L. J., Hicks E. K. S., Friedrich S., Sternberg A., 2007, ApJ, 671, 1388
- Dehnen & Aly (2012) Dehnen W., Aly H., 2012, MNRAS, 425, 1068
- Dehnen & King (2013) Dehnen W., King A., 2013, ApJ, 777, L28
- Di Matteo et al. (2005) Di Matteo T., Springel V., Hernquist L., 2005, Nature, 433, 604
- Falcón-Barroso (2016) Falcón-Barroso J., 2016, Galactic Bulges, 418, 161
- Faucher-Giguère & Quataert (2012) Faucher-Giguère C.-A., Quataert E., 2012, MNRAS, 425, 605
- Faucher-Giguère et al. (2012) Faucher-Giguère C.-A., Quataert E., Murray N., 2012, MNRAS, 420, 1347
- Ferrarese & Merritt (2000) Ferrarese L., Merritt D., 2000, ApJ, 539, L9
- Feruglio et al. (2010) Feruglio C., Maiolino R., Piconcelli E., Menci N., Aussel H., Lamastra A., Fiore F., 2010, A&A, 518, L155+
- Fukumura et al. (2015) Fukumura K., Tombesi F., Kazanas D., Shrader C., Behar E., Contopoulos I., 2015, ApJ, 805, 17
- Gaibler et al. (2012) Gaibler V., Khochfar S., Krause M., Silk J., 2012, MNRAS, 425, 438
- Gültekin et al. (2009) Gültekin K., et al., 2009, ApJ, 698, 198
- Häring & Rix (2004) Häring N., Rix H.-W., 2004, ApJ, 604, L89
- Hirschmann et al. (2010) Hirschmann M., Khochfar S., Burkert A., Naab T., Genel S., Somerville R. S., 2010, MNRAS, 407, 1016
- Hopkins & Elvis (2010) Hopkins P. F., Elvis M., 2010, MNRAS, 401, 7
- Ishibashi & Fabian (2012) Ishibashi W., Fabian A. C., 2012, MNRAS, 427, 2998
- Ishibashi & Fabian (2014) Ishibashi W., Fabian A. C., 2014, MNRAS, 441, 1474
- Ishibashi et al. (2013) Ishibashi W., Fabian A. C., Canning R. E. A., 2013, MNRAS, 431, 2350
- Jahnke & Macciò (2011) Jahnke K., Macciò A. V., 2011, ApJ, 734, 92
- Kauffmann & Haehnelt (2000) Kauffmann G., Haehnelt M., 2000, MNRAS, 311, 576
- King (2003) King A., 2003, ApJ, 596, L27
- King (2010) King A. R., 2010, MNRAS, 402, 1516
- King & Nixon (2015) King A., Nixon C., 2015, MNRAS, 453, L46
- King et al. (2011) King A. R., Zubovas K., Power C., 2011, MNRAS, 415, L6
- Kormendy & Ho (2013) Kormendy J., Ho L. C., 2013, ARA&A, 51, 511
- LaMassa et al. (2013) LaMassa S. M., Heckman T. M., Ptak A., Urry C. M., 2013, ApJ, 765, L33
- Lemons et al. (2015) Lemons S. M., Reines A. E., Plotkin R. M., Gallo E., Greene J. E., 2015, ApJ, 805, 12
- Maiolino et al. (2017) Maiolino R., Russell H. R., Fabian A. C., Carniani S., Gallagher R., Cazzoli S., Arribas S., Belfiore F., et al., 2017, Nature, 544, 202
- Mashchenko et al. (2008) Mashchenko S., Wadsley J., Couchman H. M. P., 2008, Science, 319, 174
- McConnell & Ma (2013) McConnell N. J., Ma C.-P., 2013, ApJ, 764, 184
- McKee & Ostriker (2007) McKee C. F., Ostriker E. C., 2007, ARA&A, 45, 565
- Nayakshin & Zubovas (2012) Nayakshin S., Zubovas K., 2012, MNRAS, 427, 372
- Nayakshin et al. (2009) Nayakshin S., Cha S.-H., Hobbs A., 2009, MNRAS, 397, 1314
- Paumard et al. (2006) Paumard T., et al., 2006, ApJ, 643, 1011
- Read & Hayfield (2012) Read J. I., Hayfield T., 2012, MNRAS, 422, 3037
- Read et al. (2010) Read J. I., Hayfield T., Agertz O., 2010, MNRAS, 405, 1513
- Santini et al. (2012) Santini P., et al., 2012, A&A, 540, A109
- Sazonov et al. (2005) Sazonov S. Y., Ostriker J. P., Ciotti L., Sunyaev R. A., 2005, MNRAS, 358, 168
- Schawinski et al. (2009) Schawinski K., Virani S., Simmons B., Urry C. M., Treister E., Kaviraj S., Kushkuley B., 2009, ApJ, 692, L19
- Schawinski et al. (2015) Schawinski K., Koss M., Berney S., Sartori L. F., 2015, MNRAS, 451, 2517
- Silk (2005) Silk J., 2005, MNRAS, 364, 1337
- Silk (2013) Silk J., 2013, ApJ, 772, 112
- Silk & Nusser (2010) Silk J., Nusser A., 2010, ApJ, 725, 556
- Silk et al. (2012) Silk J., Antonuccio-Delogu V., Dubois Y., Gaibler V., Haas M. R., Khochfar S., Krause M., 2012, A&A, 545, L11
- Springel (2005) Springel V., 2005, MNRAS, 364, 1105
- Stern et al. (2016) Stern J., Faucher-Giguère C.-A., Zakamska N. L., Hennawi J. F., 2016, ApJ, 819, 130
- Sturm et al. (2011) Sturm E., et al., 2011, ApJ, 733, L16+
- Su et al. (2010) Su M., Slatyer T. R., Finkbeiner D. P., 2010, ApJ, 724, 1044
- Wendland (1995) Wendland H., 1995, Advances in computational Mathematics, 4, 389
- Whitworth et al. (1994) Whitworth A. P., Bhattal A. S., Chapman S. J., Disney M. J., Turner J. A., 1994, A&A, 290, 421
- Wild et al. (2010) Wild V., Heckman T., Charlot S., 2010, MNRAS, 405, 933
- Zibetti et al. (2005) Zibetti S., White S. D. M., Schneider D. P., Brinkmann J., 2005, MNRAS, 358, 949
- Zubovas & King (2012) Zubovas K., King A., 2012, ApJ, 745, L34
- Zubovas & King (2016) Zubovas K., King A., 2016, MNRAS, 462, 4055
- Zubovas & Nayakshin (2012) Zubovas K., Nayakshin S., 2012, MNRAS, 424, 666
- Zubovas et al. (2013a) Zubovas K., Nayakshin S., Sazonov S., Sunyaev R., 2013a, MNRAS, 431, 793
- Zubovas et al. (2013b) Zubovas K., Nayakshin S., King A., Wilkinson M., 2013b, MNRAS, 433, 3079
- Zubovas et al. (2014) Zubovas K., Sabulis K., Naujalis R., 2014, MNRAS, 442, 2837
- Zubovas et al. (2016) Zubovas K., Bourne M. A., Nayakshin S., 2016, MNRAS, 457, 496