Exploring Cosmic Origins with CORE: Cluster Science
Abstract
We examine the cosmological constraints that can be achieved with a galaxy cluster survey with the future CORE space mission. Using realistic simulations of the millimeter sky, produced with the latest version of the Planck Sky Model, we characterize the CORE cluster catalogues as a function of the main mission performance parameters. We pay particular attention to telescope size, key to improved angular resolution, and discuss the comparison and the complementarity of CORE with ambitious future ground-based CMB experiments that could be deployed in the next decade.
A possible CORE mission concept with a 150 cm diameter primary mirror can detect of the order of 50,000 clusters through the thermal Sunyaev-Zeldovich effect (SZE). The total yield increases (decreases) by 25% when increasing (decreasing) the mirror diameter by 30 cm. The 150 cm telescope configuration will detect the most massive clusters () at redshift over the whole sky, although the exact number above this redshift is tied to the uncertain evolution of the cluster SZE flux-mass relation; assuming self-similar evolution, CORE will detect clusters at redshift . This changes to 800 (200) when increasing (decreasing) the mirror size by 30 cm. CORE will be able to measure individual cluster halo masses through lensing of the cosmic microwave background anisotropies with a 1- sensitivity of , for a 120 cm aperture telescope, and for a 180 cm one.
From the ground, we estimate that, for example, a survey with about 150,000 detectors at the focus of 350 cm telescopes observing 65% of the sky from Atacama would be shallower than CORE and detect about 11,000 clusters, while a survey from the South Pole with the same number of detectors observing 25% of sky with a 10 m telescope is expected to be deeper and to detect about 70,000 clusters. When combined with such a South Pole survey, CORE would reach a limiting mass of and detect 220,000 clusters (5 sigma detection limit).
Cosmological constraints from CORE cluster counts alone are competitive with other scheduled large scale structure surveys in the 2020’s for measuring the dark energy equation-of-state parameters and (, ). In combination with primary CMB constraints, CORE cluster counts can further reduce these error bars on and to 0.05 and 0.13 respectively, and constrain the sum of the neutrino masses, , to (1 sigma).
The wide frequency coverage of CORE, 60 - 600 GHz, will enable measurement of the relativistic thermal SZE by stacking clusters. Contamination by dust emission from the clusters, however, makes constraining the temperature of the intracluster medium difficult. The kinetic SZE pairwise momentum will be extracted with in the foreground-cleaned CMB map. Measurements of using CORE clusters will establish competitive constraints on the evolution of the CMB temperature: , with an uncertainty of at low redshift ().
The wide frequency coverage also enables clean extraction of a map of the diffuse SZE signal over the sky, substantially reducing contamination by foregrounds compared to the Planck SZE map extraction. Our analysis of the one-dimensional distribution of Compton- values in the simulated map finds an order of magnitude improvement in constraints on over the Planck result, demonstrating the potential of this cosmological probe with CORE.
1 Introduction
Galaxy clusters are important cosmological probes, primarily because their abundance and their evolution are very sensitive to the growth rate of large-scale structure [1, 2]. This makes them powerful tools for constraining dark energy and possible modifications to gravity [3], and motivates large cluster surveys [4]. Clusters can be selected as overdensities of galaxies observed in the visible and/or near-infrared (NIR) bands [e.g., 5, 6], as extended sources of X-ray emission [e.g., 7] and through the Sunyaev-Zel’dovich effect [SZE, 8] [9, 10, 11, 12]. Surveys in all these wavebands will produce catalogs containing tens of thousands of clusters in the coming decade. These missions include stage-IV dark energy observatories such as the Euclid [13] and the WFIRST [14] space missions, the Large Synoptic Survey Telescope [LSST, 15], the eROSITA X-ray satellite [16], and the next generation of cosmic microwave background (CMB) experiments, such as the Advanced Atacama Cosmology Telescope [AdvACT, 17], the South Pole Telescope with third generation detector technology [SPT-3G, 18] and the proposed CMB-S4 [19].
In this paper, we study cluster science that would be enabled by the CORE mission. The mission is proposed to survey the sky in intensity and polarization across 19 broad-bands spanning the frequency domain from 60 to 600 GHz. It is proposed in response to the European Space Agency’s (ESA) call for a medium-class mission for its M5 opportunity. This paper is one of a series presenting the CORE science goals.
CORE will image galaxy clusters through their SZE, in which the Cosmic Microwave Background photons undergo inverse Compton scattering off electrons from the hot intracluster gas, leaving a cold spot in the CMB at frequencies below 220 GHz and a hot spot above this frequency. CORE data will enable the construction of a large catalogue of clusters detected via the thermal SZE (tSZE) out to redshifts and their use to constrain cosmological parameters, including the dark energy equation-of-state. The advantage of tSZE detection with respect to other cluster detection techniques is the excellent control it offers on the survey selection function, which is crucial for cosmological applications.
Another critical aspect of this research program is the calibration of the mass-observable scaling relation. This is a difficult task, because it requires cluster mass measurements. Systematic uncertainties in the scaling relations currently limit cluster constraints on cosmological parameters [20, 21]. Gravitational lensing provides the most robust mass measurements [22, 23, 24], and the large optical/NIR imaging surveys (e.g., Euclid, WFIRST and LSST) will use gravitational lensing shear observations to calibrate optical/NIR-mass scaling relations for their surveys.
For its part, CORE will be able to calibrate the tSZE signal-mass scaling relation through lensing of the cosmic microwave background (CMB) anisotropies in temperature and polarization [25, 26, 27]. This CMB-lensing methodology makes CORE self-sufficient for cosmology with cluster counts; moreover, the method enables mass measurements to higher redshifts than possible with galaxy (shear) lensing, which will be important for clusters at . This is important not only for the CORE cluster sample, but will be valuable for cluster surveys proposed by Euclid, WFIRST, LSST and eROSITA.
The broad frequency coverage of CORE opens the door to additional cosmological studies with clusters. It will be possible to measure the relativistic corrections (rSZE) in a large sample of massive clusters, which then provide direct measurements of cluster temperatures. The kinetic SZE (kSZE) effect will be used to measure pairwise peculiar velocities of clusters, thereby probing the instantaneous rate of structure growth and hence constraining modifications of General Relativity. Finally, the tSZE can be used for an accurate test of a basic tenant of the standard cosmological model: the redshift dependence of the CMB temperature.
We quantify the scientific reach of CORE in each of these areas using detailed simulations of the sky and mission performance. We consider what CORE can achieve alone, comparing to a ground-based survey representative of what can be achieved with a future CMB-S4 observatory, as well as the added value of combining the ground-based observatory and space mission data sets. Particular attention is given to the impact of the choice of the CORE primary telescope aperture (120, 150 and 180 cm) in each case.
The paper is organized as follows. In Section 2, we describe our simulations, followed by a discussion of the expected CORE cluster catalogues in Section 3. Section 4 presents forecasts for a variety of studies using the CORE sample. This section includes Subsection 4.1, which describes the expected constraints on cosmological parameters from the cluster counts that depend on the precision with which we can calibrate the tSZE signal-mass scaling relation with CMB lensing, a topic that is presented in Subsection 4.2. In Subsection 4.3, we forecast the potential of using CORE to measure the intracluster medium temperature through the relativistic SZE. Subsection 4.4 contains a discussion of the kinetic SZE and a forecast of associated cosmological constraints. In Subsection 4.5, we consider how well we will be able to constrain the redshift evolution of the CMB temperature. We then turn briefly in Section 5 to science related to the SZ map extracted from the CORE frequency maps. We conclude in Section 6.
Throughout, we adopt the Planck 2015 CDM best-fit cosmological parameters [Table 9 of 28]: , , , , and .
2 Synthetic sky maps
We create synthetic observations using the current version of the Planck Sky Model [29]. The maps contain primary CMB, galactic emission (dust, free-free and synchrotron), cosmic infrared background, radio and infrared point sources, and cluster signal. We pay careful attention to the cluster signal. The clusters are simulated using the Delabrouille-Melin-Bartlett model [30]: clusters are drawn from the Tinker mass function [31] and their intracluster medium pressure is modeled using the circular generalized NFW profile [32, 33]. The clusters are then placed at random sky positions. We assume clusters are isothermal [adopting the M-T relation from 34], derive the density profile from the pressure, and model the non-relativistic and relativistic thermal Sunyaev-Zel’dovich effects [35, 36, 37]. We also include the kinetic SZE, assuming uncorrelated Gaussian velocities with zero mean and a standard deviation extracted using linear theory. In addition to the tSZE and the kSZE, we include emission from dust within clusters, which is an improvement on previous simulations of this kind. We adopt a modified blackbody spectrum (, ) for the dust in clusters [38], and we use a spatial profile that is more extended than that of the pressure that has been found to be a good fit to stacked Planck clusters [39].
| Channel | Beam FWHM | Noise |
|---|---|---|
| [arcmin] | [-] | |
| 60 | 14.3 | 5.3 |
| 70 | 12.3 | 5.0 |
| 80 | 10.8 | 4.8 |
| 90 | 9.7 | 3.6 |
| 100 | 8.7 | 3.5 |
| 115 | 7.6 | 3.5 |
| 130 | 6.8 | 2.8 |
| 145 | 6.1 | 2.5 |
| 160 | 5.6 | 2.6 |
| 175 | 5.2 | 2.5 |
| 195 | 4.7 | 2.5 |
| 220 | 4.2 | 2.7 |
| 255 | 3.7 | 4.0 |
| 295 | 3.2 | 5.2 |
| 340 | 2.8 | 7.8 |
| 390 | 2.4 | 15.6 |
| 450 | 2.1 | 32.5 |
| 520 | 1.8 | 82.4 |
| 600 | 1.6 | 253.4 |
We observe this synthetic sky using five instruments: three versions of the proposed space mission, CORE-150, CORE-120, CORE-180, and two possible components of a future ground-based observatory that we call CMB-S4 (Atacama) and CMB-S4 (South Pole), which are representative of what one could think of building in the next decade.
CORE as proposed in answer to the M5 call of ESA is not fully optimized for SZ science, its main focus and design driver being CMB polarisation. In this paper we consider as a baseline study case a modest extension of the mission concept proposed to M5, CORE-150, better suited to SZ science. CORE-150 has the same frequency channels as the mission proposed to M5, but a slightly larger telescope (150 cm diameter aperture) and slightly better sensitivity (an improvement by a factor of in sensitivity, which could be obtained straightforwardly with either dual polarisation detectors, or a mission duration extended by a factor of 2). The angular resolution and sensitivity of each frequency channel of the instrument is given in Table 1. We also consider two other scenarios with a smaller (120 cm) or larger (180 cm) telescope, but same frequency channels and same raw sensitivity per channel. Only the size of the instrument beam is scaled, for each channel, by a factor of 150/120 or 150/180.
| Channel | Beam FWHM | Noise |
|---|---|---|
| [arcmin] | [-] | |
| 40 | 12.4 | 5.3 |
| 95 | 5.2 | 1.5 |
| 150 | 3.5 | 1.5 |
| 220 | 2.4 | 4.3 |
| 270 | 2.0 | 8.5 |
| Channel | Beam FWHM | Noise |
|---|---|---|
| [arcmin] | [-] | |
| 40 | 3.8 | 3.2 |
| 95 | 1.6 | 0.9 |
| 150 | 1.1 | 0.9 |
| 220 | 1.0 | 2.7 |
| 270 | 0.9 | 5.3 |
We consider two study cases for the ground-based observatory, oberving from either the South Pole or the Atacama plateau. We assume that the South Pole site will be equipped with an antenna comparable to the current 10 m SPT [40], but a large focal plane array of 155,000 detectors observing the sky in five different frequency channels, and that the Atacama site will be equipped with several new 3.5 m telescopes (similar to those used by POLARBEAR [41]), with the same detector count observing in the same frequency bands, between 40 and 270 GHz. Observing 65%/25% of the sky from the Atacama plateau and the South Pole, respectively, during two years of effective observations (i.e., assuming 100% efficiency) leads to the sensitivities given in Tables 2 and 3. We note that effective observing efficiencies are typically of the order of 20% rather than 100%, and hence that the actual observations would require significantly more time (about 10 years) to complete.
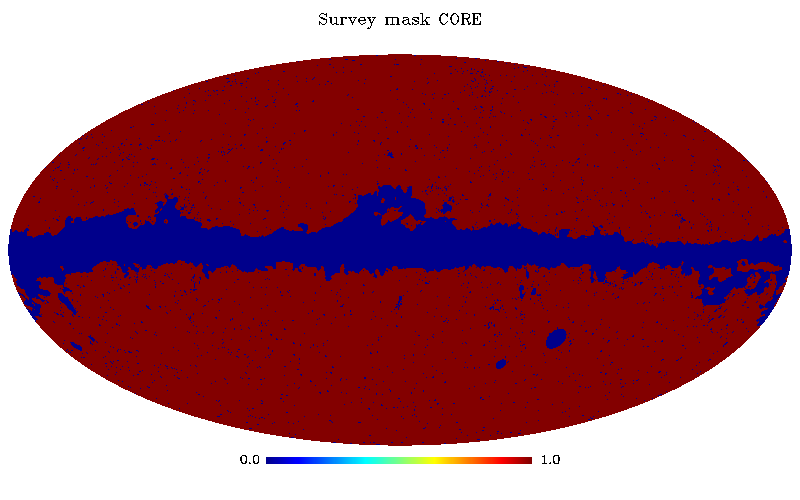
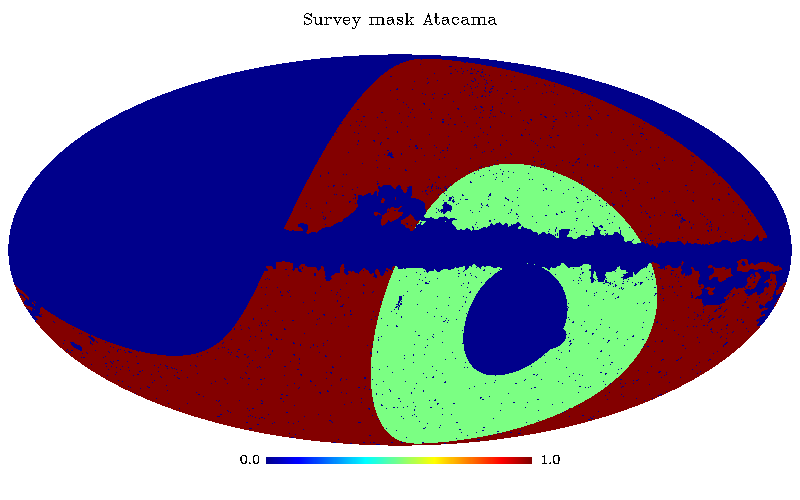
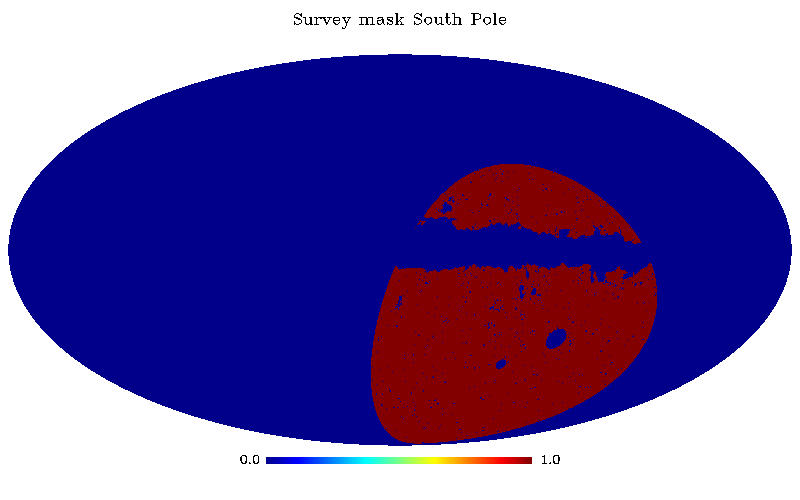
None of the five considered experiments – CORE-150, CORE-120, CORE-180, CMB-S4 (Atacama), CMB-S4 (South Pole) – will use the full sky for cluster science because of the galactic contamination and – in the case of ground-based facilities – the limited sky accessibility. Given the current mission concept, CORE will be able to use of the sky. We use in our present analysis the Planck survey mask built for the cluster catalogue (see Fig. 1, top panel). The Atacama/South Pole mask corresponds to observations with a maximum zenith angle of 45/60 deg around the corresponding latitudes of each site -22.9/-90 deg respectively. We use for the Atacama/South Pole surveys the same galactic mask as for the space mission, which masks regions most contaminated by the Milky Way (see two bottom panels of Fig. 1).
3 Cluster Catalogues
In our analysis, we follow the procedure adopted by the Planck collaboration for cluster science, which are described in detail elsewhere [42, 11, 43]. For each of the five surveys – CORE-120, CORE-150, CORE-180, CMB-S4 (Atacama), CMB-S4 (South Pole) – we divide the all-sky maps into 504 overlapping tangential patches of . For each patch, we compute the noise power matrix corresponding to instrumental noise and sources of astrophysical signal except for the tSZE. We then estimate the expected noise level through a Matched Multifilter optimized for tSZE detection [44]
| (3.1) |
with the column vector containing the beam convolved cluster profile at each frequency and the expected frequency dependance of the tSZE . We then re-assemble the 504 functions into a single all-sky HEALPix map. We thus obtain an all-sky tSZE noise map for each experiment. Clusters from the simulated catalogue are considered as being detected by a given experiment with if their integrated tSZE flux and size obey
| (3.2) |
and if they are located inside the survey area of the experiment. Note that this selection criterion is similar to the selection applied to build the Planck catalogues, and that we carefully normalize the tSZE flux-mass relations in our simulations so our predicted counts are compatible with the cluster counts observed by Planck.
Expected counts are shown in Table 4. CORE-150 will detect of the order of 50,000 clusters over 85% of sky while CMB-S4 (South Pole) will detect clusters over 25% of sky. CMB-S4 (Atacama) is expected to be shallower with clusters over the 38% sky that do not overlap with the South Pole survey, and about 11,000 clusters in total over its 55% useful sky. Combining the multi-frequency CORE-150 and higher angular resolution CMB-S4 (South Pole) datasets would enable significant reduction in the effect of astrophysical noise sources, such as galactic dust or infrared point sources, allowing one to lower the mass limit significantly and to detect around objects in the 25% sky visible from the South Pole. This large increase in cluster counts is possible thanks to the large number of CORE observing bands at and between CMB-S4 (South Pole) frequencies, which allow for a more efficient reduction of foreground contamination. Changing the CORE telescope size to 120cm/180cm would lead to a loss/gain of in the number of detected clusters.
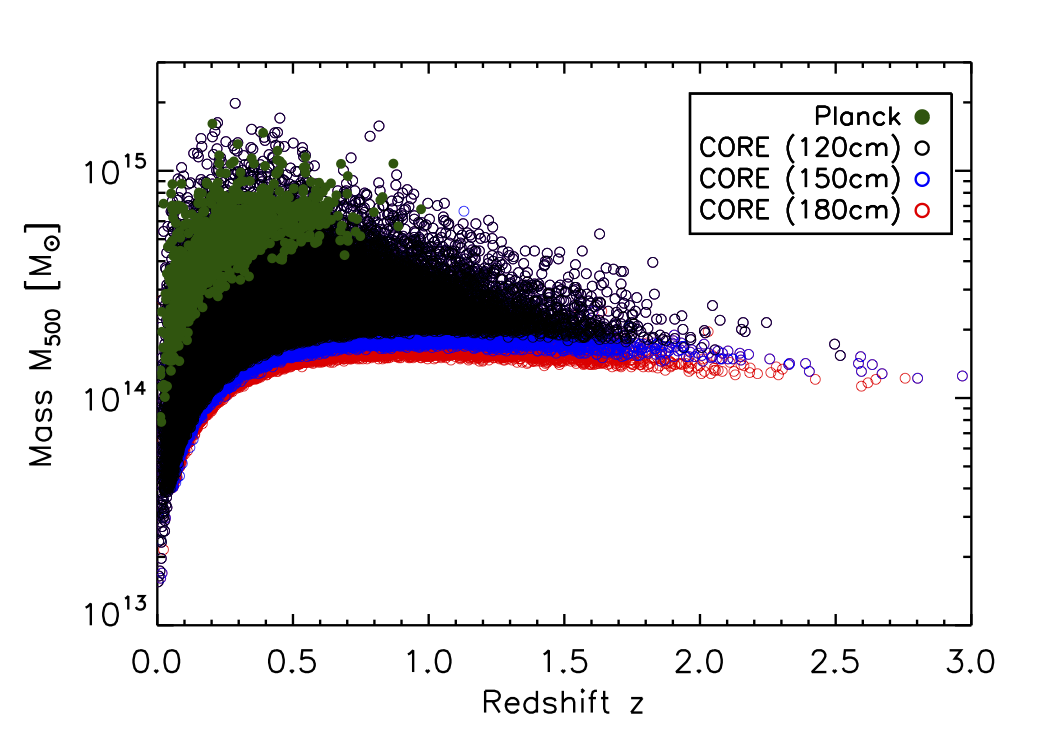
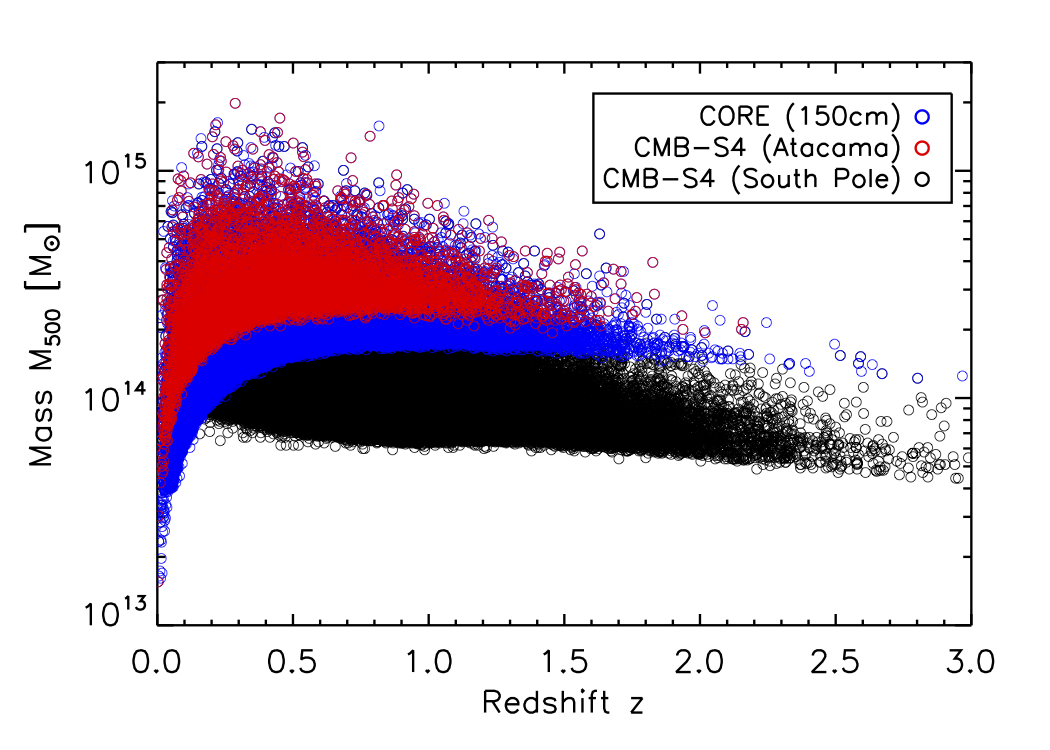
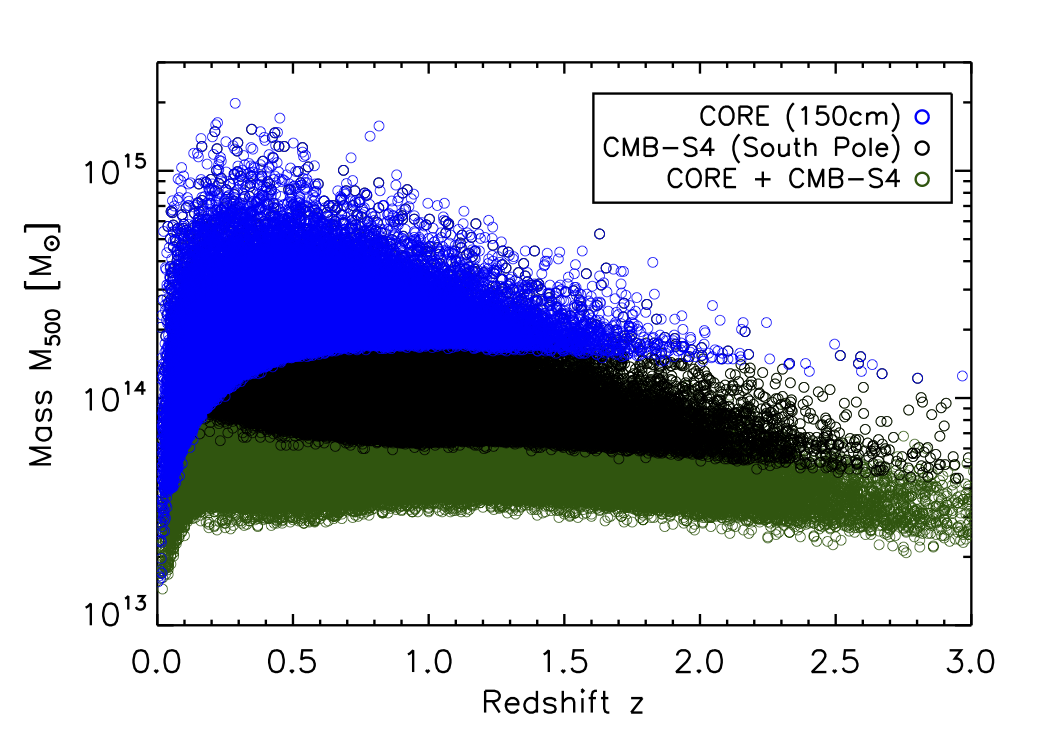
Fig. 2 presents the expected mass - redshift distribution of the detected clusters. CORE will detect clusters down to a limiting mass lying between and , while CMB-S4 (Atacama) is shallower with a limiting mass between and . CMB-S4 (South Pole) is deeper and should reach masses approaching . The combination of CORE-150 and CMB-S4 would permit us to reduce the mass threshold to between and . The combination of CORE and CMB-S4 (South Pole) should allow – for the first time – the possibility of tSZE cluster selection in the redshift range . The exact number is rather uncertain, because it depends on the evolution of the intracluster medium properties in redshift ranges that have not yet been sampled. Moreover, predictions from hydrodynamical simulations have not yet reached a consensus on the tSZE properties of such high redshift clusters [45, 46, 47, 48, 49, 50]. In our synthetic observations, we have assumed that the local scaling law evolves self-similarly over the full redshift range. If this is the case, CORE-150 should detect objects at , CMB-S4 would find around and a combination of the two would allow one to increase this number by as much as a factor of four to . The number of expected high clusters for each survey is provided in the right column of Table 4.
In comparison, the eROSITA mission (launch in 2017) is expected to detect clusters up to in the X-ray, and the Euclid mission (launch in 2020) will reach in optical/NIR. CORE will complement these two large X-ray and optical cluster experiments in the millimeter range and will enable the detection of many high redshift clusters.
| Experiment | |||
|---|---|---|---|
| CORE-120 | 1.1 | ||
| CORE-150 | 1.5 | ||
| CORE-180 | 1.85 | ||
| CMB-S4 (Atacama) | 0.47 | ||
| CMB-S4 (South Pole) | 6.9 | ||
| CORE-150+CMB-S4 (Atacama) | 2.5 | ||
| CORE-150+CMB-S4 (South Pole) | 21.5 |
4 Science with the CORE Cluster Sample
In the following subsections we present forecasts for particular scientific analyses that the CORE dataset will enable.
4.1 Cosmological Constraints from CORE Cluster Counts
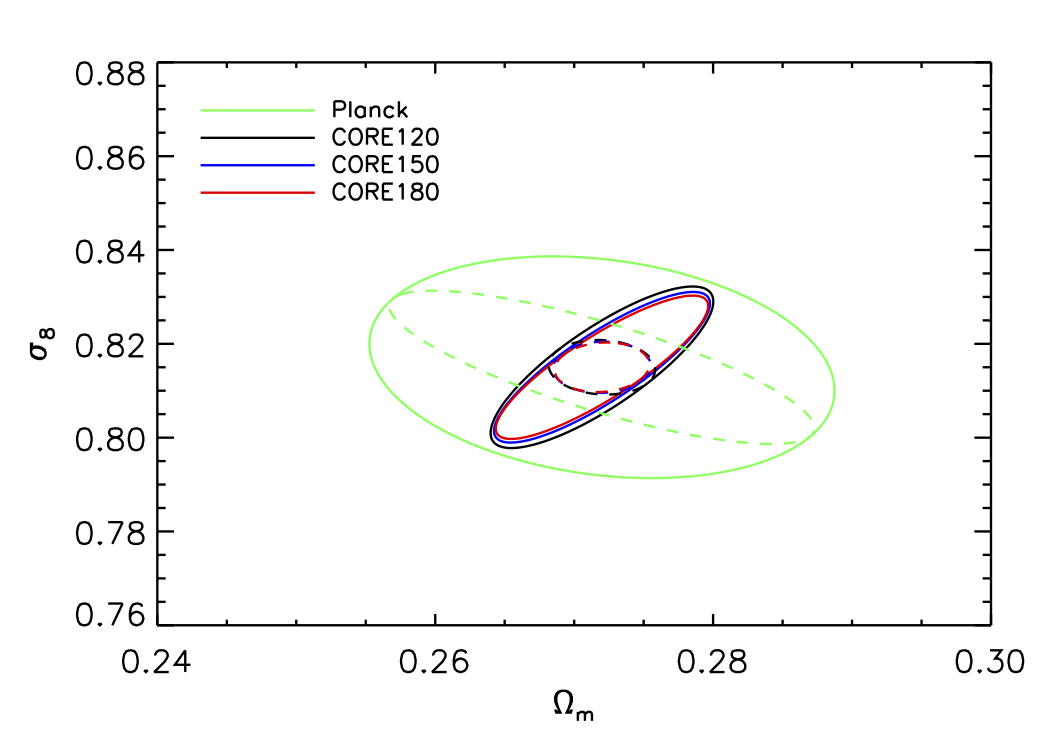
This section presents cosmological constraints assuming the selection function based on thermal SZE noise maps computed in Section 3. We adopt a Markov Chain Monte Carlo (MCMC) approach, and we test our contours against those derived using a Fisher matrix technique in the case of constraints on (, ).

4.1.1 Impact of Mass Calibration and Parameter Degeneracies
We first focus on and . Although these two parameters will likely be constrained to a few parts in a thousand in the early 2020’s after the end of dedicated large scale structure missions such as DESI and Euclid (see for example [51]), we want to compare the gain in sensitivity from Planck to CORE using only SZE cluster counts. For this first test, we fix all the cosmological and scaling law parameters except , and , where is a single fractional mass bias parameter assumed to hold for all masses and redshifts [52]. Although this approach does not allow for as much freedom as the cosmological analyses undertaken with the current datasets [53, 21], the precise mass constraints from CMB lensing (see Section 4.2 and Figure 9 below) will dramatically reduce the systematic uncertainties and make it less important to include this additional freedom.
Results are shown in Figure 3 (left) for the Fisher matrix analysis of the cluster samples arising from the three different CORE telescope sizes and from the Planck sample in the case of 5% (dashed line) and 1% (solid line) priors on . For Planck, improving our prior on from 5% to 1% reduces the contour perpendicularly to the well known parameter degeneracy as described in the recent Planck analysis [20]. For CORE, the orientation of the degeneracy line is similar to that for Planck in the case of a 1% calibration error but is different for a 5% calibration error. Note that the expected CORE constraints are much stronger than the Planck constraints (gain of factor 4 on and factor 3 on for a 1% prior on ). Interestingly, the three CORE telescope sizes lead to comparable constraints when the error on is fixed through an external prior. The significant difference between the 5% and 1% cases is indicating that the uncertainties on and are dominated by the uncertainty on the cluster mass scale for CORE, if that uncertainty is bigger than 1%. This demonstrates the importance of having a mass calibration good to 1% to be able to use the full information in the CORE cluster counts.
The results from a MCMC analysis are shown in the right panel of Figure 3. As for the Fisher matrix case, we show results for the two different assumed accuracies of the mass calibration. In addition, we show results for a constrained case (hereafter c-case) where only , and are free to vary as in the Fisher case, and for a full run case (hereafter f-case) where all the cosmological parameters are free and priors are adopted on the mass-observable relation parameters (, , and ) as in the recent Planck analysis [20]. The c-case is in good agreement with the Fisher matrix results on the left, whereas in the f-case the constraints are significantly broadened by the additional cosmological and mass-observable relation parameters. In this f-case there is a clear advantage to having 1% mass calibration, but the impact is less dramatic than for the c-case run.
4.1.2 Impact of Cosmic Variance
For this analysis, we have binned our sample in redshift assuming that cluster counts are uncorrelated, and we have employed a Poisson likelihood based on the Cash statistic [54]. This approximation is valid for large redshift bins () and medium size cluster samples such as Planck’s and SPT’s where the statistical error budget is dominated by shot noise. With larger samples such as that from CORE, we expect this approximation to break down due to large scale correlations in the underlying matter density field. The cluster counts within each bin then fluctuate due to the large scale structure [55],
| (4.1) |
where is the overdensity within the redshift bin, is the average cluster bias and we denote averaged quantities with overbars. If the bin size is large enough, the density fluctuations are Gaussian and fully characterised by their variance
| (4.2) |
with the window function picking out radial shells around the observer. Because CORE will observe a large number of clusters in each redshift bin, , the likelihood to find objects is then given by a Gaussian with variance , receiving contributions from both shot noise and sample variance due to fluctuations in the density field [56]:
| (4.3) |
In Figure 4, we compare the Poisson likelihood result to the Gaussian which takes into account the cosmic variance contribution. For the c-case (left), it widens the contour perpendicular to the usual - degeneracy direction, while for the f-case (right) the effect is smaller because statistical errors are less dominant when taking into account marginalization over additional cosmological and mass-observable relation parameters.


4.1.3 Dark Energy Equation of State
We now study the CDM model with dark energy equation of state parameters using . We leave all the cosmological parameters free and adopt the same priors on the mass observable relation parameters (, , , ) as in the recent analysis of the Planck sample [20]. For this specific parameter combination, knowing the cluster mass scale parameter is less important than for the previous case ( vs. ), because and constraints are mainly dependent on the evolution of the cluster counts and are less sensitive to their overall normalization. Constraints on are shown in Figure 5. Using cluster counts only, we
forecast fully marginalized 68% confidence constraints of and for our CORE-150 baseline configuration. Constraints from CORE primary CMB only are limited to and . Combining the CORE primary CMB constraints to CORE cluster counts breaks the degeneracy and provides and . If the redshift trend parameter is known, cluster counts constraints tighten to and . These constraints are competitive and complementary to the constraints expected from weak lensing and galaxy clustering in the 2020’s: Euclid forecasts and [Table 2.2 of 13] and LSST and [Fig. 15.1 of 15].

4.1.4 Neutrino Mass Constraints
tSZE cluster counts alone cannot provide competitive constraints on the sum of the neutrino masses , because the mass sum is degenerate with the normalization of the primordial power spectrum. Combining CORE primary CMB and CORE cluster counts strengthens significantly the constraints on this parameter in the CDM+ model. To explore this, we use the chains from the Exploring Cosmic Origins paper on cosmological parameters [57] in combination with our cluster MCMC. Figure 6 (left) presents the probability distribution function of for CORE-150 primary CMB TT, TE and EE (solid black line), CORE-150 primary CMB + cluster counts (solid red line) and CORE-150 primary CMB + cluster counts in combination with CMB-S4 (South Pole) cluster counts (solid blue line). We obtain the following constraints on the sum of the neutrino masses , 39, and 33 meV for CORE-150 CMB, CORE-150 CMB+SZ and CORE-150 CMB+SZ + CMB-S4 (South Pole), respectively. Figure 6 (right) presents the degeneracies of with the mass-observable scaling relation parameters and . Improving our knowledge of cluster masses would strengthen further our constraints on the sum of the neutrino mass.


4.1.5 Information Gain

To evaluate the performance of a future experiment and how it is affected by specific choices such as the mirror size, Figures of Merit (FoM) are employed. Recently, in addition to the traditional Dark Energy Task Force (DETF) FoM [59] and variations thereof, the so–called Information Gain has been introduced and applied to cosmology [see e.g. 60, 61, 62, 63, 64, 58, 65]. Given a prior covariance , and a posterior covariance , the Information Gain can be computed as [60, 64]:
| (4.4) |
where is the identity matrix.
The unit of the information gain depends on the base of the logarithm used in its derivation. If the natural logarithm is used, as in Eq. 4.4, it is ‘nats’; if Eq. 4.4 is divided by , the unit is the more familiar ‘bits’222 Consider a single free parameter in a Poisson system. In this case where is the ratio of the number of samples in the prior and posterior case. For an increase in sample size of an order of magnitude, the number of bits of information would be 8.2., which corresponds to using the logarithm base 2, which is what we use in this work.
Contrary to the traditional DETF FoM, which considers the determinant of the Fisher matrix, the information gain is motivated by information theory [66, 67], and quantifies the amount of information on the model parameters that is gained when updating the prior to the posterior (for application to past observations, see [63, 58]). For this reason, the information gain has been proposed as a FoM for experimental forecasting [60, 62, 64]. The advantages of the information gain compared to other FoM are discussed in detail elsewhere [60, 64].
Let us first consider the information gained when CORE SZE cluster counts are combined with the cosmological constraints from the primary CORE CMB in different cosmological models. We consider the base flat CDM model, the curved CDM, the flat CDM with massive neutrinos, and the flat CDM with dynamical Dark Energy Equation of state. In each of these models, we use the primary CMB Fisher matrices [57] as priors, and investigate how things improve when one includes the SZE number counts. The results are shown in the uppermost panel of Figure 7.
In flat CDM, CORE SZE provides very little information when added to primary CORE CMB, as the latter already constrains the cosmological parameters to better than percent accuracy. Therefore, in this model, assessing the consistency between CORE SZE and CORE primary CMB will be a valuable cross check. This situation changes when extended models are considered. When curvature is allowed, the addition of CORE SZE gives a modest improvement of 3.3 bits, mainly due to the improvement of the constraint on the curvature density. However, much larger Information Gains are expected in models with massive neutrinos (7.5 bits), and even more so in models with dynamical Dark Energy. In this model, the addition of CORE SZE will provide a boost of 13.4 bits of information. This results from the ability of CORE SZE constraints to break the well known parameter degeneracies of the primary CMB present in these models. In summary, the synergy between CORE cluster counts and primary CMB manifests itself most in the ability to dramatically improve constraints on neutrino masses and the Dark Energy Equation of state parameters.
We also investigate the information gain of moving from the Planck 2015 SZE number counts to the CORE SZE number counts, as a function of the mirror size. For this purpose, in Eq. 4.4 we assume the Planck SZE covariance as a prior , and the CORE SZE Fisher matrix as a posterior . The results are shown in the second panel of Figure 7. Moving from Planck SZE number counts to CORE SZE number counts will provide an information gain of 6.7-7.8 bits, depending on the mirror size. This corresponds to a large amount of additional cosmological information, comparable to the improvement obtained in moving from the WMAP 9 primary CMB results to the Planck 2015 primary CMB results [58]. Naturally, the mirror size affects the information gain, with a larger mirror resulting in more detected objects and therefore more cosmological information. This effect is, however, not linear in mirror size: reducing the mirror size by 30 cm (from 150 cm to 120 cm), results in a loss of 0.7 bits of information, whereas increasing the mirror size by 30 cm (from 150 cm to 180 cm), yields a smaller difference of 0.4 bits.
Besides the noticeable improvement CORE SZE would provide relative to Planck SZE, and its synergies with CORE primary CMB, we also investigate how much information CORE SZE would provide when added to the ground-based SZE experiments CMB-S4 (South Pole) and CMB-S4 (Atacama). In this case, we assume the CMB-S4 Fisher matrices as priors, and the combination of these with CORE SZE as posterior. We fix the mirror size to 150 cm. The results are summarized in the two lower panels of Figure 7. Considering the large information gains obtained by adding CORE SZE to the ground based experiments (6.7-7.3 bits with CMB-S4 (South Pole), 4.1-4.9 bits with CMB-S4 (Atacama)), we conclude that CORE would significantly improve the cosmological constraints of ground based experiments and provide a good amount of new cosmological information on models of dynamical Dark Energy with and without free curvature. Furthermore, we find a larger information gain when CORE SZE is added to CMB-S4 (South Pole) rather than CMB-S4 (Atacama). This effect is due to the fact that the joint CMB-S4 (South Pole)+CORE sample is in itself larger, and, furthermore, spans a larger portion of mass–redshift space (see Figure 2 and Table 4).
4.2 Cluster Mass Calibration
Cluster masses will be calibrated using lensing of the primary CMB by clusters, a technique called CMB Halo Lensing. Planck, ACT and SPT recently reported first detections of this effect by stacking hundreds to thousands of objects [20, 27, 26]. In this section we provide forecasts for the three CORE concepts we consider (CORE-120, CORE-150, CORE-180) based on a new detection method [25].
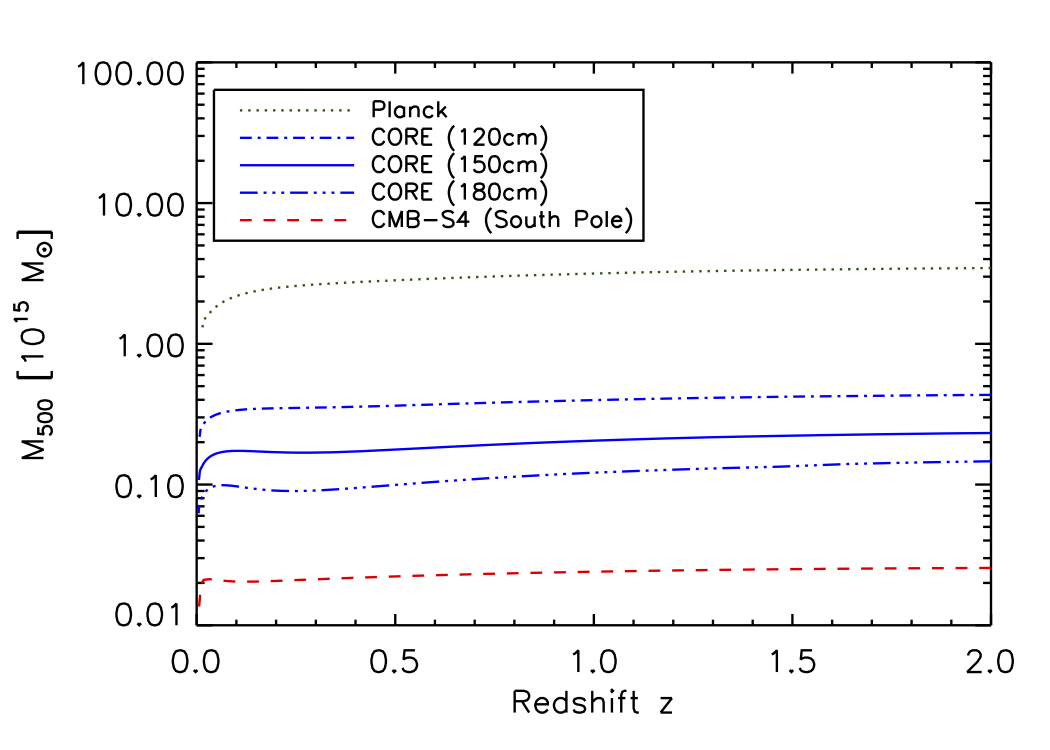
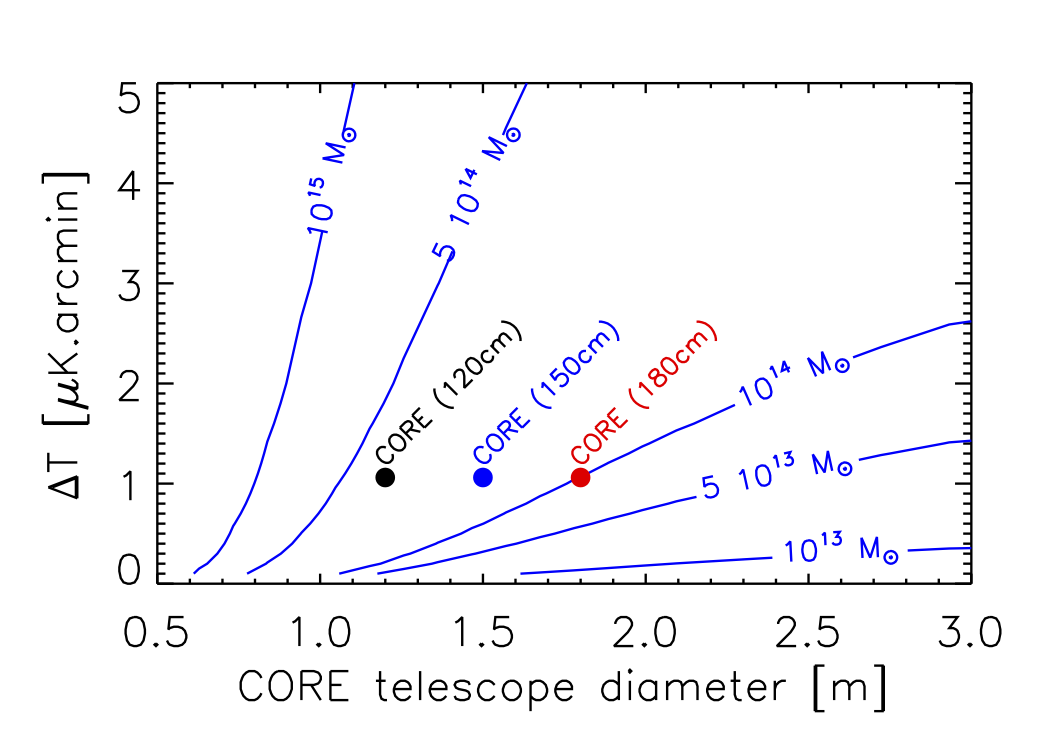
Figure 8 left shows the error on CMB halo lensing mass as a function of redshift for Planck (green dotted line), the three CORE concepts (blue lines) and the CMB-S4 (South Pole; red dashed line) experiment. While detecting individual cluster mass was out of reach for Planck, CORE-120/CORE-150/CORE-180 will be able to provide individual cluster masses with 1 statistical uncertainties of , respectively.
CMB-S4 (South Pole) could reach the mass range if the experiment has sufficient frequency coverage to separate the SZE from point sources in clusters.
The right panel of Figure 8 presents mass isocurves at () for varying CORE telescope apertures and instrumental noise levels. It illustrates in particular how quickly we gain in sensitivity on cluster mass when increasing the telescope aperture.
CMB halo lensing stacks will be used to calibrate cluster mass in scaling relations (e.g. ) to allow for improved cosmological constraints. Assuming that does not depend upon redshift or mass, CORE-120/CORE-150/CORE-180 will constrain this parameter to 0.7%/0.4%/0.2% (statistical error) if we stack all the clusters detected at (numbers given in Table 4 for each concept). If depends on the redshift, CORE-120 can still constrain it at the few percent level up to , while CORE-150 and CORE-180 should be able to reach this precision up to (Figure 9 left). The right panel of Figure 9 shows that the mass dependence can also be constrained at the few percent level for clusters with masses between 2 and using stacking.
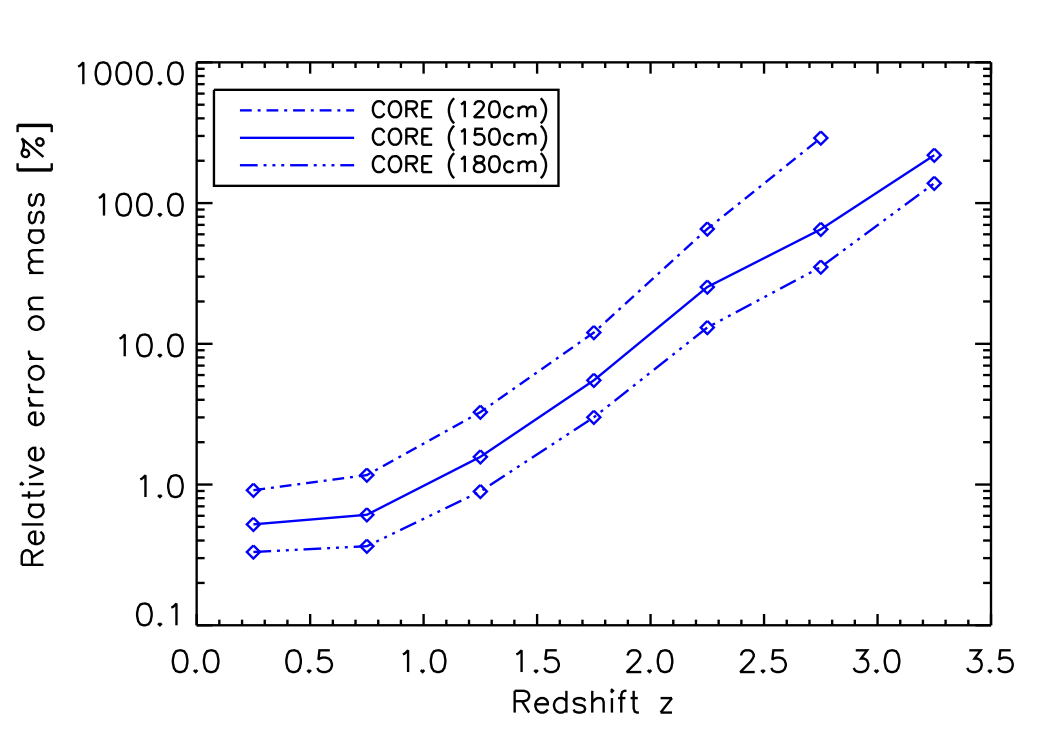
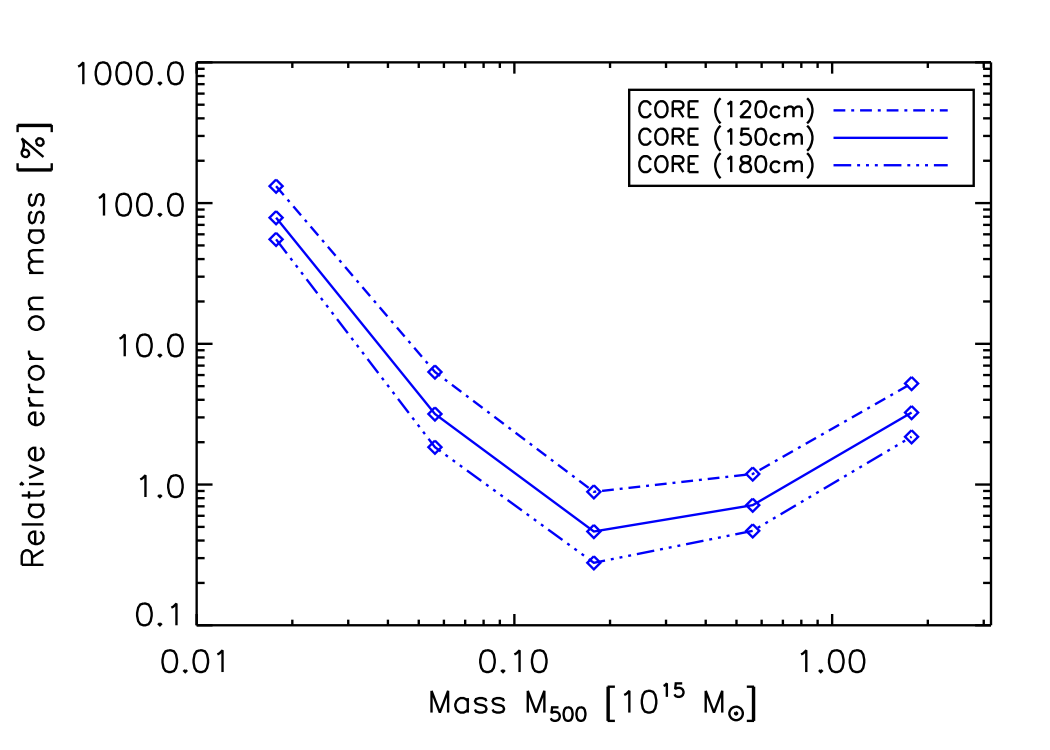
These numbers are competitive with– and complementary to– forecasts for Euclid shear measurements (1% calibration of the mass) in the redshift range. CORE will provide access to lensing halo mass calibration at a few percent level for redshifts higher than (and up to for telescope sizes greater than 1.5 m).
4.3 Studies of the Relativistic Thermal Sunyaev-Zel’dovich effect
We also explore the possibility of measuring the relativistic thermal SZE [35, 36, 37] with CORE-150. This is particularly interesting to constrain cluster temperature without external X-ray follow-up. The analysis is based on the 100 highest temperature clusters in the CORE sample. All these systems have temperatures at or above T=12.6 keV. After extracting square patches of 2.5 degrees (on a side) around each cluster and for each band, the maps above 115 GHz are smoothed to a common resolution of 7 arcminutes. The maps at 115 GHz and below are left at their native resolution.
The maps are then preprocessed to remove point sources, Galactic emission and the primary CMB. Point sources are subtracted based on the difference map between the 60 GHz and the 70 GHz map (radio sources) and the 800 GHz map (IR sources). A Mexican Hat Wavelet filter is applied to detect and mask IR sources while the radio sources are identified as peaks () in the difference map (60-70 GHz). To remove the contribution from the thermal dust emission of the Galaxy, a modified black body with spectral index and variable temperature is fit to the dust spectrum. The spectrum of the dust is obtained as the mean flux beyond a region of 20 arcminutes away from the cluster position (and up to the boundary of the field of view of 2.5 degrees). A consistent best fit of 18 K is found for all the cluster regions. Only the bands above 390 GHz (inclusive) are used to fit the spectral energy distribution of the thermal dust emission. The normalization of the model is taken such that the 800 GHz band is reproduced exactly by the model. This model (, K, Norm=800 GHz) is subtracted from all bands. Finally, the CMB is removed by subtracting the cleaned 220 GHz band (where point sources are masked and the Galactic emission has been subtracted). The resulting SZE maps are dominated by SZE signal but potentially also contain some residual point source and IR emission (Galactic and extragalactic) that was not perfectly removed as well as instrumental noise. An advantage of the CORE frequency coverage is the ability to make this correction quite accurately.
We use these maps to measure the SZE spectrum. The SZE flux is estimated in each band from the SZE maps as the minimum/maximum flux in a disc of 6 arcminutes centered on the cluster minus the average signal in a ring with inner radius equal to 30 arcminutes and outer radius equal to 60 arcminutes. The error on the flux is taken as the dispersion of the entire field of view after excluding the cluster region divided by the square root of the number of samples. The measured SZE spectrum is finally used to derive the best temperature taking advantage of the dependency of the relativistic correction on the cluster temperature. Fitting the SZE spectrum is done excluding the bands below 130 GHz (poor resolution and sensitivity), the band at 220 GHz (used to subtract the CMB component) and the band at 800 GHz (used to remove the Galactic component). The approach is highlighted in Figure 10.
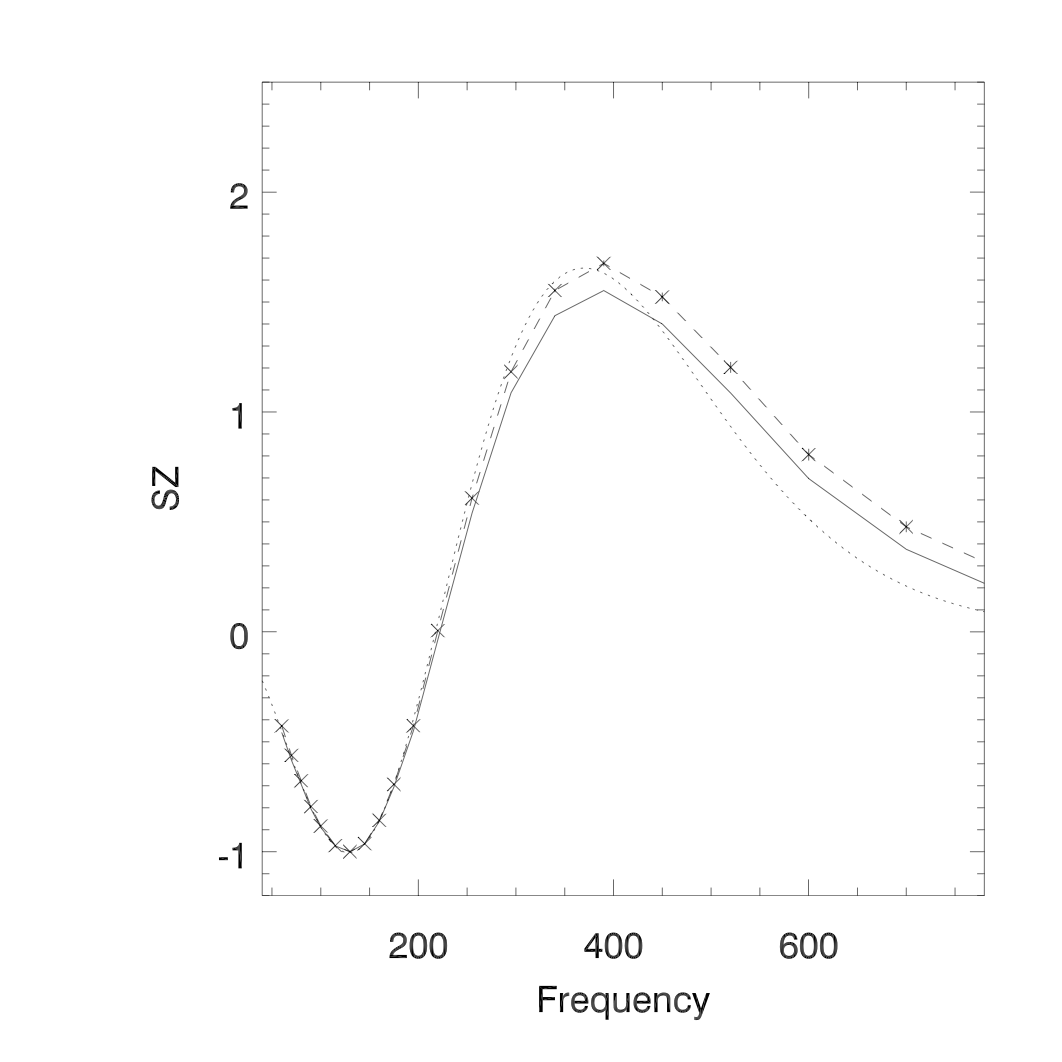
The stacked normalized SZE spectrum for 100 stacked clusters (symbols) shows an excess at high frequencies with respect to the expected SZE spectrum (solid line) and the SZE spectrum without a relativistic correction (dotted line). This excess is due to the relativistic model being for a 12.6 keV cluster, which is the minimum temperature of the sample rather than the best fit mean temperature. The measurement uncertainties are exceedingly small and reflect the uncertainty on the mean when considering the cluster to cluster spectral variation. It is clear that even with a small number of clusters the CORE data will enable precise measurements of the SZE spectrum. Crucially important in this analysis is the ability to remove infrared source contamination, and that requires the broad frequency range of CORE and especially the high frequency bands that are only available in a space mission.
4.4 Constraints on the Kinetic Sunyaev-Zel’dovich Effect
In this section, we present forecasts on the sensitivity of the CORE mission for studies of the kinetic SZE [68]. This effect expresses the Doppler kick experienced by CMB photons as they Thomson scatter off moving clouds of ionized electrons. This process results in a perturbation of the brightness temperature of the CMB that is proportional to the line-of-sight (LOS) component of the electron cloud peculiar velocity [69]:
| (4.5) |
where is the electron number density, is the Thomson cross-section, is the peculiar velocity vector of the cloud in units of the speed of light, and is the unit vector defining the LOS.
In our forecasts we study the CORE sensitivity to the kSZE pairwise momentum on our set of galaxy clusters, which is given by this sum over galaxy cluster pairs:
| (4.6) |
where are the kSZE temperature estimates of the -th cluster and the weights are given by [70]
| (4.7) |
As discussed in detail elsewhere [71], and are the comoving distance vectors corresponding to the locations of the -th and -th clusters on the sky, and is the vector pointing to cluster from cluster . The symbol denotes a unit vector in the direction of , and is the angle separating the two directions and . Similarly, is the unit vector defining the direction of the separation vector .
For the theoretical modeling of this statistic, we follow an approach [72] where the pairwise momentum is defined as
| (4.8) |
where is the average galaxy cluster bias, is the scale and redshift dependent linear density–density correlation function (i.e. the Fourier transform of the linear matter density power spectrum), and refers to the density – distance projected peculiar velocity correlation function, given by
| (4.9) |
with the Hubble parameter, is the logarithmic derivative of the density linear growth factor with respect to the cosmological scale factor, and is the scale and redshift dependent matter power spectrum.
We use the simulated maps of the baseline CORE-150 mission in the different frequency bands to compute an estimate of the signal-to-noise (S/N) ratio for the detection of the kSZE pairwise momentum for each of those bands. For this, we compute an estimate of the kSZE pairwise momentum in 100 rotated/displaced configurations of the positions of the 52,000 clusters on each frequency map. That is, we first consider the angular positions of our simulated cluster set and rotate them in galactic longitude on 100 rotated/displaced configurations. This procedure preserves the real relative angular distances among galaxy clusters. For each rotated configuration, aperture photometry (AP) is conducted on the displaced position of each cluster, with an aperture that equals the maximum between arcmin and the FWHM of each map. This is motivated by the fact that the average angular virial radius of our cluster sample is close to arcmin.
Each rotated configuration of our cluster sample provides an estimate of the kSZE pairwise momentum on angular positions where we expect to find no kSZE signal. Thus the ensemble of the 100 estimates can be used to estimate a covariance matrix for its measurement,
| (4.10) |
where the denote averages of the 100 rotated/displaced configurations. With this covariance matrix, we next adopt a matched filter approach in which the observed data would be fit to our fiducial expectation provided by Eq. 4.8, yielding an amplitude :
| (4.11) |
In this equation, refers to the observed kSZE pairwise momentum in the form of a vector evaluated over a set of cluster pair separations , while corresponds to the fiducial model of Eq. 4.8. The formal variance of the amplitude is given by
| (4.12) |
If we also assume that our kSZE pairwise momentum is unbiased, then and the S/N is given by
| (4.13) |
In Figure 11 (left), we plot the S/N obtained for each of the CORE frequency maps, where the three CORE configurations with diameters of 120, 150 and 180 cm are color coded with green, black and red, respectively. In the low frequency channels the S/N increases with frequency because the beam FWHM is falling and the CMB contamination of kSZE estimates decreases with the aperture size [see Figure 6 of 73]. This trend is however reversed at frequencies close to and above GHz, because at those frequencies the presence of dust emission in our simulated maps becomes dominant. We have found that this dust emission contaminating kSZE measurements is predominantly generated within our galaxy. In the 120 and 180 cm diameter cases the FWHM of the channels are scaled with respect to the nominal case and this explains why for the low frequency channels the 180 cm (120 cm) diameter case is yielding slightly higher (lower) estimated S/N. At high frequencies (GHz), the FWHM is typically smaller than 5 arcmin and the three mirror sizes should yield identical results. However, small-scale dust emission leaks more easily inside the AP filter for larger mirror sizes, thus slightly decreasing the S/N in these cases. The S/N for a linear combination of the different CORE channels that projects out exactly the non-relativistic thermal Sunyaev-Zel’dovich component [74] is given by the blue square, for the nominal case of 150 cm diameter size. Because the channels achieving the highest S/N are dominated by CMB residuals, the gain of combining different channels is modest, reaching a maximum of S/N.
The behavior of these S/N estimates obtained from realistic frequency maps simulated for the CORE mission can be checked against a simple modeling of the kSZE angular power spectrum which can be made dependent on the number of clusters available, their average mass, the quality of the velocity reconstruction, the FWHM or beam size of the CMB experiment, and the instrumental noise level. The predictions for this versatile S/N estimation approach is given in Figure 11 right, which is in rough agreement with the more realistic estimates of Figure 11 left.
The kSZE pairwise momentum is dependent on the Thomson optical depth (), the Hubble parameter and the velocity growth factor (see Eq. 4.8 above). Using the covariance matrix inferred from the simulated maps, it is also possible to provide Fisher-matrix forecasts for the sensitivity of CORE to the factor after assuming some prior knowledge on the gas content of clusters () and the Hubble parameter. In fact, a Gaussian prior on the error equal to 5 % of the fiducial values of those two parameters yields a typical error in at the level of 7 % for the entire cluster set. This level of uncertainty is comparable to (and slightly better than) that current measurements from experiments like BOSS or WiggleZ [75, 76]. Constraints on this parameter from Euclid will be typically provided for higher redshifts (), while other experiments like J-PAS [77] and SKA [e.g. 78] are expected to be significantly more sensitive (at the percent and sub-percent level), and split into multiple redshift shells. However, further kSZE-based constraints on can be obtained from smaller and more abundant halos (of M⊙) which should shrink further kSZE derived uncertainties, and whose contribution could also be split in different redshift intervals. Even in a case where kSZE derived measurements may not be the most precise, they will likely contribute to shrinking the uncertainties in this factor while suffering from different systematics, and thus providing robustness to the joint estimates, [see 79, for more detailed forecasts].


4.5 CMB Temperature Evolution with Redshift
If the expansion of the Universe is adiabatic and the CMB spectrum was a black-body at the time it originated, this shape will be preserved with its temperature evolving as
| (4.14) |
This is a robust prediction of standard cosmology, but there are many non-standard, but nevertheless theoretically well-motivated physical processes in which photon number is not conserved. Examples include a non-perfectly transparent Universe, decaying vacuum cosmologies with photon injection mechanisms, models in which the fine-structure constant varies [80], string theory motivated scenarios where photons mix with other particles such as axions [81], many modified gravity scenarios, and so on. We note that in such models the distance-duality—or Etherington [82]—relation is also violated [83], and that mechanisms that lead to deviations from the standard evolution would, in general, create spectral distortions [see e.g. 84].
At a purely phenomenological level, deviations from the standard law have often been parametrized by [85]
| (4.15) |
Various measurements of already exist, but the currently large uncertainties do not allow for strong constraints on the underlying models to be set. At low redshifts, the relation can be measured via the tSZE towards galaxy clusters. This method was first applied to ground-based CMB observations [86, 87], which demonstrated its potential. With a new generation of ground based SZE experiments and the all-sky Planck SZE survey, it became possible to use this method to place tight constraints on the redshift evolution of the CMB temperature [88, 89, 90, 91].
At higher redshifts (typically ), can be evaluated from the analysis of quasar absorption line spectra which show atomic and/or ionic fine structure levels excited by the photon absorption of the CMB radiation. The CMB is an important source of excitation for species with transitions in the sub-millimeter range. Although the suggestion is more than four decades old, measurements (as opposed to upper bounds) were only obtained in the last two decades [92], and the best ones so far still have errors at the ten percent level [93]. The current best constraints, combining both direct SZE and spectroscopic measurements as well as indirect distance duality measurements, are333Constraints on can also be obtained using primary CMB only at (see e.g. [Section 6.7.3 of 94] and [57]). [95]:
| (4.16) |
Spectroscopic measurements of using CO are currently signal-to-noise limited and will significantly improve with ELT-HIRES. Individual measurements of the temperature are expected to reach K, which corresponds to . This single-measurement constraint further improves as the square-root of the number of measurements at , of which one can reasonably expect approximately 10. Overall we thus expect ELT-HIRES to deliver a constraint of .
The possibility of determining from measurements of the SZE was suggested long ago [96, 97]. Compton scattering of the CMB in a cluster causes an intensity change, , that can be written as:
| (4.17) |
where is the optical depth, is the CMB temperature at redshift , where is the cluster electron temperature (we are assuming isothermality), where is the radial component of the peculiar velocity of the cluster, , and the function includes relativistic corrections [98, 99, 100].
The spectral signature of the SZE, , depends on the frequency through the dimensionless frequency : it is redshift-invariant only for the standard scaling of . In all other non-standard scenarios, the ‘almost’ universal dependence of SZE on frequency becomes -dependent, resulting in a small dilation/contraction of the SZE spectrum on the frequency axis. In terms of thermodynamic temperature, of the CMB due to the SZE is given by
| (4.18) |
If we assume that scales with as , while the frequency scales as as usual, then the dimensionless frequency will be and will be slightly different from the local temperature as measured by COBE-FIRAS. In this way it is possible to measure the temperature of the CMB at the redshift of the cluster, thus directly constraining scenarios such as those discussed above. Actually, what we measure is the temperature change integrated over the solid angle corresponding to the chosen aperture radius (as defined in [91]), so we have:
| (4.19) |
In the following we will use the integral of in a sphere of radius with the angular diameter distance of the cluster.
We have simulated the observations of a cluster sample selected from the CORE cluster catalog according to the following requirements:
-
•
redshift , because of the higher lever arm on ;
-
•
arcmin, to keep under control the level of foregrounds (at this step assumed to be previously removed) in the aperture photometry;
-
•
, this last choice is done mainly to keep high S/N clusters.
This selection provides a sample of 48 high S/N clusters.
The frequency bands considered in the simulation are between 90 GHz and 340 GHz, because the lower and higher frequencies are best suited for foreground extraction and are not useful for the reconstruction of the SZE signal. CMB and foregrounds are removed first, adopting the procedure described in [91].
The forecast for the SZE signal for the clusters has been obtained from the mock cluster catalog, assuming a generalized NFW pressure model. We have used the CORE noise level (values as reported in Table 1) to estimate the errors in the observed spectra. The beam dilution effect has been taken into account to estimate errors on the SZE signal for each channel.
The mock dataset was then analyzed to recover the original input parameters of the cluster. The analysis has been performed through a MCMC algorithm, which allows us to explore the full space of the cluster parameters (integrated optical depth , peculiar velocity , electron temperature ) and the CMB brightness temperature at the redshift of the cluster. In the analysis we allow for calibration uncertainties, considered as an uncertain scale factor, which was modeled with a Gaussian distribution with mean 1 and standard deviation . We assume that the maps have been cleaned of foregrounds and CMB. To take into account possible CMB and kinematic SZE residuals after the removal, we model them as a kinematic SZE component and adopt as a prior a Gaussian with zero mean and with a standard deviation. We include a prior on the cluster gas temperature, assuming that these clusters have an X-ray counterpart with electron temperatures known with a error of 0.1 keV. These priors can be obtained with eROSITA, which can measure cluster temperatures to an accuracy of 10 - 35%, depending on the cluster temperature (ranging from 1-2 to 10 keV) [16]. The need for a good knowledge of is mainly dictated by the fact that the MCMC converges more quickly with respect to the case in which the prior on is broad. We have tried for a small sample of 25 clusters using a broader prior on and the resulting constraints on are unchanged.
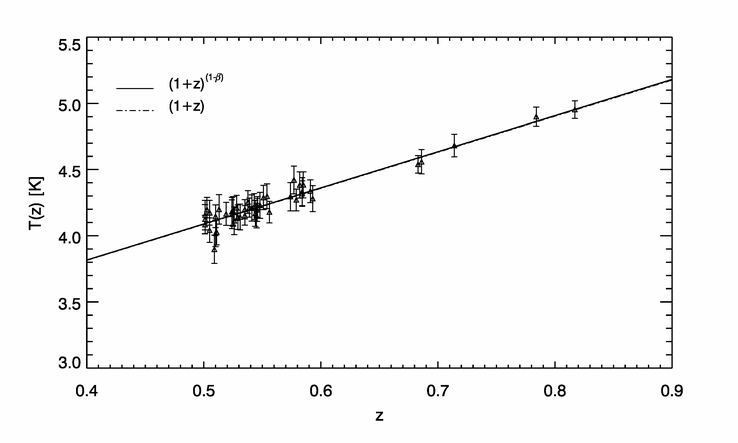
To obtain we have performed a fit of the data points as shown in Figure 12. The final value we get by fitting the data points obtained with the MCMC treatment is
| (4.20) |
CORE will do significantly better than Planck. The study has been restricted to a few tens of clusters for simplicity. With a sample of clusters of a few hundreds, we would end up with an error bar that is more than two times lower (). There is, of course, room for improvement by enlarging the sample size. Therefore, CORE— in combination with ELT-HIRES — offers the possibility of mapping the redshift evolution of the CMB temperature at the percent level or better for individual sources all the way from to beyond , and to improve current constraints on the parameter by at least one order of magnitude.
5 Diffuse SZ Emission
Additional information is available from analysis of the map of the diffuse SZ emission over the sky. Here we examine how well CORE can extract an SZ map of the sky and how to use the one-dimensional PDF of that map as a cosmological probe.
5.1 SZE Map
We reconstruct the Compton- parameter map of the tSZE effect with the Needlet Internal Linear Combination [NILC, 101, 74, 102]. NILC performs a weighted linear combination of the CORE sky frequency maps such that the combination is of minimum variance, while the weights assigned to each frequency map offer unit response to the tSZE frequency spectrum. While the second condition guarantees a reconstruction of the tSZE signal without any bias by projecting the observations onto the tSZE frequency scaling vector, the first condition ensures that the emission from other foreground components and the noise are minimized. By decomposing the CORE sky maps onto a frame of spherical wavelets, called needlets [103], NILC adapts foreground cleaning to the local conditions of contamination both over the sky and over the angular scales, therefore optimizing the component separation. The inverse squared RMS of the global ’noise’ (foregrounds + instrumental) residual contamination in the NILC -map is the sum of the inverse squared RMS of the noise in each CORE frequency map, such that the NILC reconstruction will always benefit from an increased number of frequency channels.
The large number of frequency bands () of CORE allows us to reconstruct the tSZE emission with unprecedented accuracy on the sky. Fig. 13 compares the NILC tSZE y-map with the input tSZE y-map of the simulation in a area of the sky centred at . We can see how accurately CORE extracts the tSZE emission from a large number of galaxy clusters, with minimum residual contamination from foregrounds and noise.
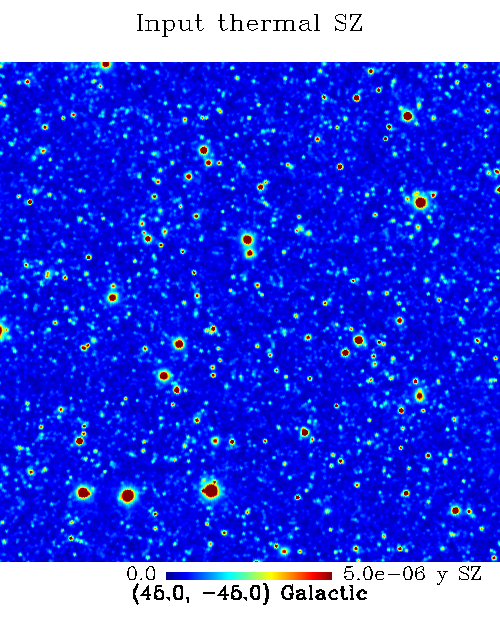
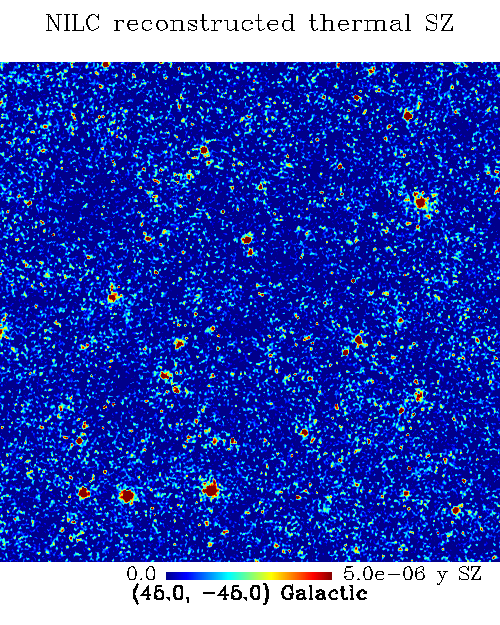
In Fig. 14 we show the angular power spectrum of the CORE tSZE map (solid red line) along with the power spectrum of the residual foreground components and residual noise (coloured solid lines) leaking into the CORE tSZE map after component separation with NILC. The power spectra of the residual contamination have been computed by applying the NILC weights that go in the reconstructed tSZE map to the individual component maps of the simulation. We also plot in Fig. 14 the power spectrum of the fiducial tSZE signal (dashed black line). The reconstructed tSZ power spectrum by CORE matches almost perfectly the input tSZE power spectrum on angular scales . Galactic foregrounds, CIB, radio sources, CMB, and instrumental noise are clearly controlled and minimized by more than one order of magnitude with respect to the cosmological tSZE signal. For the sake of comparison, we over-plot as dashed green line the reconstructed tSZE power spectrum by NILC for a simulation of the Planck mission, in which case residual foreground contamination after component separation clearly dominates the tSZE signal over the whole range of angular scales. While Planck requires marginalizing a posteriori over foreground residuals in the likelihood estimation of from the reconstructed tSZE power spectrum [104], and therefore is model-dependent, CORE allows us to accurately recover the tSZE signal over a large range of angular scales without the need of a posteriori marginalization over residuals. CORE enables a fully data-driven reconstruction of the tSZE signal over the sky at high angular resolution.

5.2 SZ Map Statistics: Estimating with the thermal SZE 1-PDF from CORE simulations
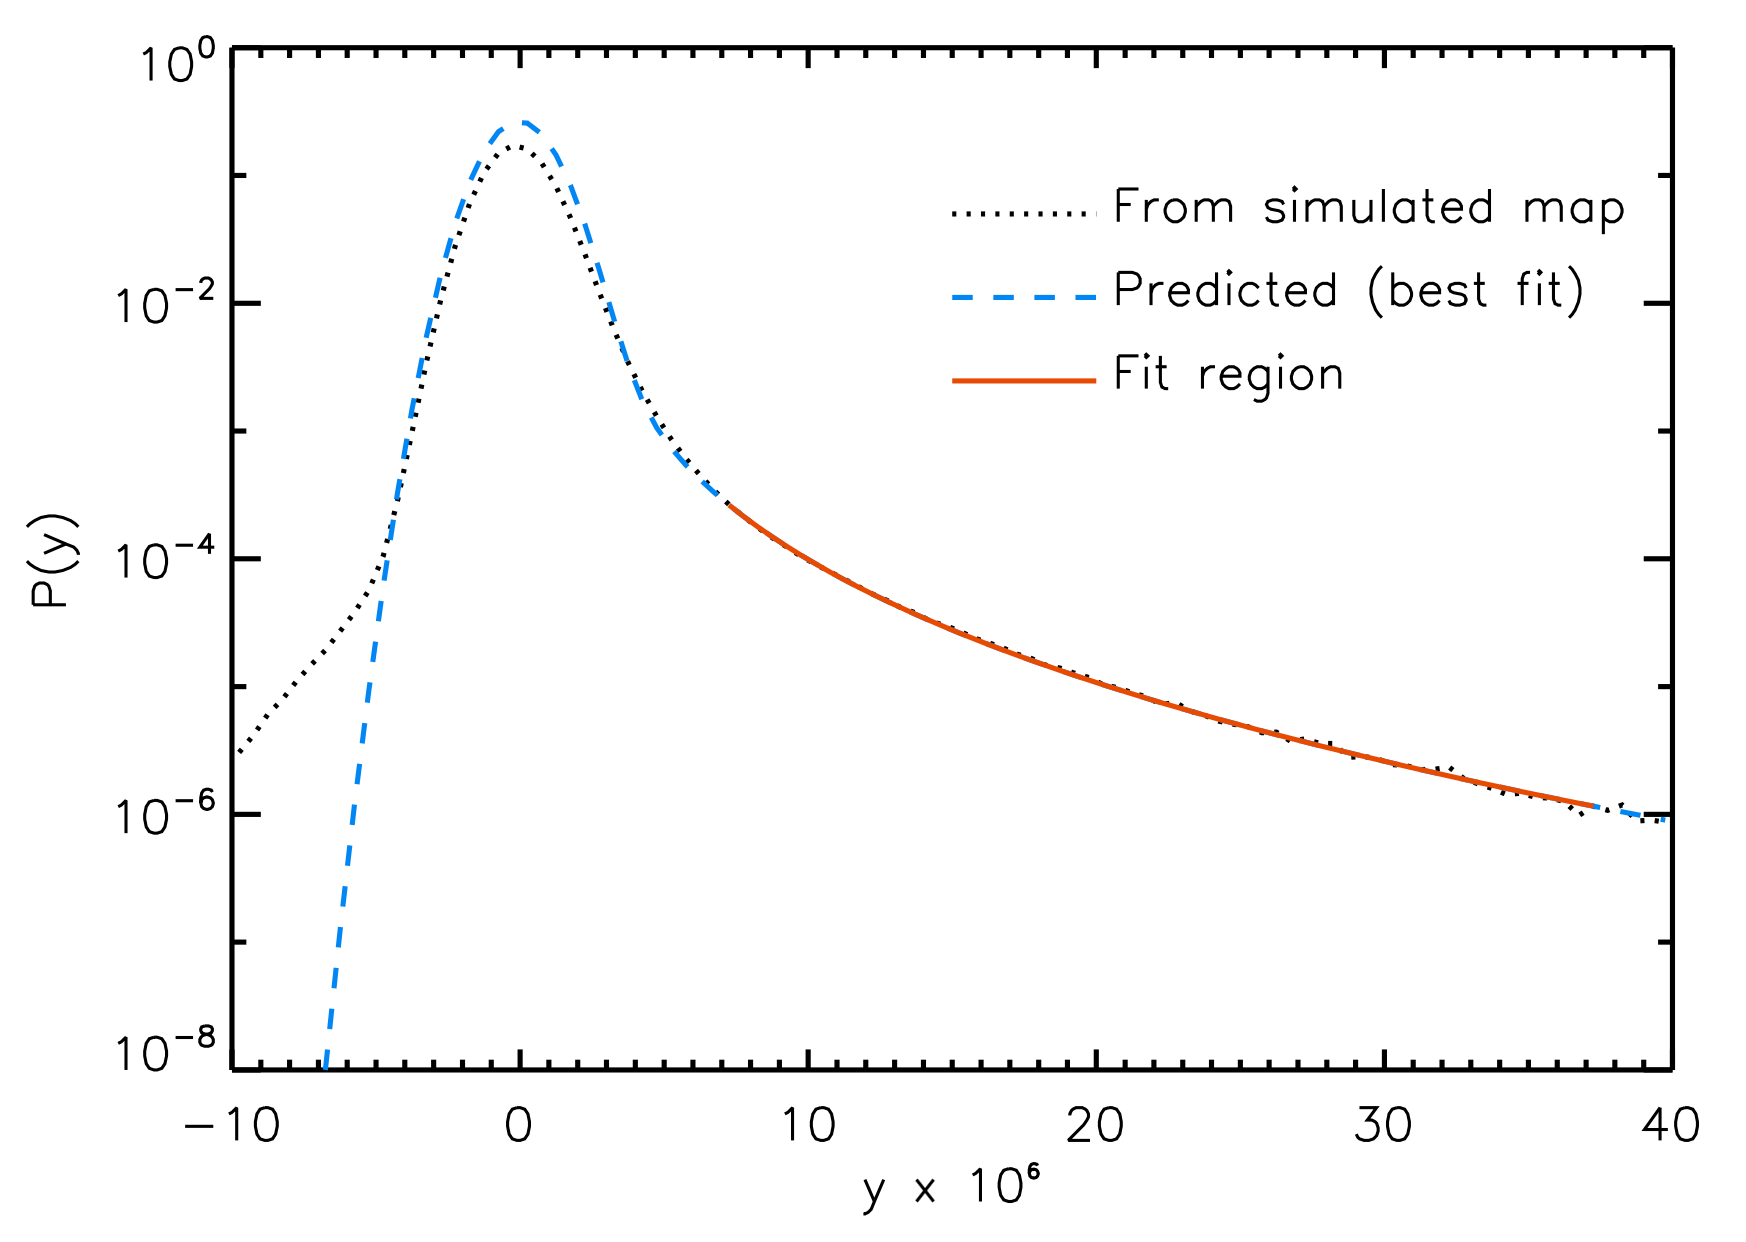
We also performed an analysis of the 1D probability distribution function (PDF) of the reconstructed Compton parameter map. For the tSZ effect, we expect an asymmetric 1D PDF distribution with a significantly positive tail [105]. Using this fact, we can derive a constraint on the parameter by fitting that positive tail against the one extracted from simulated Compton -maps. The simulated PDF was built from the map by binning the values of after applying the sky mask, obtaining the reference distribution . The theoretical PDF was computed following the formalism described in [106]. We used the same set of cosmological parameters employed for simulating the Compton map, and considered the [31] mass function. The Compton profile for individual clusters was determined using the [33] pressure profile, normalized using the scaling relations described in [52], and considering the same mass bias parameter employed for the simulation, . The Compton profile was smoothed with a Gaussian kernel to account for the CORE 4 arcmin beam.
We fixed all cosmological parameters except for , which we varied to build a likelihood function by fitting the theoretical histogram with the reference one. The cluster -profile introduces correlations between different bins. This was accounted for when computing the likelihood by using a multivariate Gaussian with a covariance matrix which was evaluated numerically, accounting also for the pixel to pixel Poisson term. The range of values of chosen for the fit was the one dominated by the cluster contribution. We chose to use the interval from to . In this way we discarded the very high region, were noise due to poor statistics becomes a major issue, and the very low region, where the distribution is dominated by other foregrounds and the approximation of non-overlapping clusters, implicit in our computation of the , is no longer applicable.
We found the final estimate ( C.L.). This value is compatible with the one used for generating the simulated map, . In [107] a similar analysis was performed to estimate from the Planck all-sky Compton parameter map, yielding the estimate . We note that our result reduces the uncertainty by a factor . We also checked that this estimate is robust when choosing a different upper limit for the interval considered for the fit.
6 Conclusions
We have examined in detail the capabilities of the CORE mission for galaxy cluster science, exploring the impact of primary mirror size, and comparing CORE to options for a future ground-based CMB-S4 experiment. CORE-150 (1.5 m primary) will detect clusters in its all-sky survey ( sky mask). The yield increases (decreases) by if one increases (decreases) the telescope primary mirror size by 30 cm. An observatory with 3.5 m telescopes and 155,000 detectors observing in five frequency bands from the Atacama plateau, CMB-S4 (Atacama) would be shallower than CORE, while a South Pole observatory observing with a 10 m telescope instead, CMB-S4 (South Pole), would be significantly deeper. The combination of catalogues from the two ground sites (Atacama+South Pole) would provide clusters. In combination with CMB-S4 (South Pole), CORE-150 would reach a limiting mass of and detect well over 200,000 clusters, including clusters at if we assume that the gas in these young structures follows scaling laws similar to the local scaling laws with self-similar evolution in redshift – an open question that such future CMB observations will allow us to investigate in some depth.
In the base CDM framework, CORE cluster counts alone will provide competitive constraints on and when the other parameters are constrained by, e.g., primary CMB and/or non-CMB external datasets. Full exploitation of the catalogue, however, requires the cluster mass scale to be determined to better than a few percent (<5%) accuracy (Sec. 4.1.1); this will be achieved over a broad redshift range using CMB halo lensing stacks. CORE cluster counts will also be competitive for constraining the dark energy equation of state parameter and its possible redshift evolution in the CDM model when marginalizing over all other parameters (, ). Adding cluster counts to CORE primary CMB will tighten the constraints on the dark energy equation–of–state parameters (, ), and improve the ability to measure neutrino mass, reaching an uncertainty of ().
CORE will measure cluster masses using CMB halo lensing out to the highest redshifts, well beyond the range of galaxy shear observations. Individual masses can be measured with uncertainties of (at ) using CMB halo lensing for CORE-120/CORE-150/CORE-180, respectively. A large telescope () would be required to determine individual masses with uncertainties at the level . Stacking the CMB lensing signal on many clusters will calibrate cluster scaling relations to a few percent out to redshift for CORE-120, and out to for CORE-150 and CORE-180. This component of the CORE science is crucial for constraining cosmology with cluster counts.
CORE will use clusters in a number of additional studies. It will provide extremely precise and accurate measurements of the composite SZE spectrum for combinations of ten or more clusters. With this information one can study the effects of the relativistic thermal SZE as well as contaminants like intracluster dust. For the highest mass clusters, it will be possible to measure ICM temperatures using the relativistic effect, although cluster temperature measurements may well be hampered by emission from the intracluster dust that contaminates the measured flux at the higher frequencies. The broad frequency coverage afforded by CORE enables this experiment. Pairwise momentum through the kSZE can be extracted to in individual frequency channels between 150 and 300 GHz; at higher frequencies, dust from our Galaxy decreases the S/N. Finally, the tSZE can be used as a precision test of one of the basic tenants of the standard model, the redshift evolution of the CMB temperature. Deviation from the standard evolution of will be constrained to better than .
The size of the CORE primary telescope mirror only weakly impacts detection of the relativistic tSZE, the kSZE pairwise momentum significance and the measurement of , but wide frequency coverage is needed to disentangle the various signals (primary CMB, Galactic emission and cluster contaminants such as intracluster dust emission). Cosmological parameters from cluster counts also depend only weakly on telescope size, provided the cluster mass scale is determined to a few percent. This will be enabled through a CMB halo lensing analysis using the CORE dataset; however, this measurement benefits from a larger aperture. An aperture is needed to determine the cluster mass scale to a few percent out to redshift , and to measure individual masses with uncertainties of the order of . The aperture would also enable detection of hundreds of clusters at and push the redshift limit of the survey well beyond the limits of the eROSITA and Euclid surveys.
Finally, we have shown that the broad frequency coverage of CORE enables clean extraction of a full-sky map of diffuse SZE signal, much improved over the Planck SZE map by significantly reducing contamination from foregrounds. Our analysis of the one-dimensional distribution of Compton- values in the simulated map finds an order of magnitude improvement in the possible constraints on over a similar analysis carried out on the Planck data, demonstrating that this will be a powerful cosmological probe.
Acknowledgments
Some of the results in this paper have been derived using the HEALPix [108] package. Parts of the cosmological analysis was made using Cosmo MC [109], CLASS [110] and MontePython [111]. C.H.-M. acknowledges financial support of the Spanish Ministry of Economy and Competitiveness via I+D project AYA-2015-66211-C2-2-P. CJM is supported by an FCT Research Professorship, contract reference IF/00064/2012, funded by FCT/MCTES (Portugal) and POPH/FSE. J.G.N. acknowledges financial support from the Spanish MINECO for a ’Ramon y Cajal’ fellowship (RYC-2013-13256) and the I+D 2015 project AYA2015-65887-P (MINECO/FEDER).
References
- [1] L. Wang and P. J. Steinhardt, Cluster Abundance Constraints for Cosmological Models with a Time-varying, Spatially Inhomogeneous Energy Component with Negative Pressure, ApJ 508 (Dec., 1998) 483–490.
- [2] S. W. Allen, A. E. Evrard and A. B. Mantz, Cosmological Parameters from Observations of Galaxy Clusters, ARAA 49 (Sept., 2011) 409–470, [1103.4829].
- [3] D. H. Weinberg, M. J. Mortonson, D. J. Eisenstein, C. Hirata, A. G. Riess and E. Rozo, Observational probes of cosmic acceleration, Physics Reports 530 (Sept., 2013) 87–255, [1201.2434].
- [4] Z. Haiman, J. J. Mohr and G. P. Holder, Constraints on Cosmological Parameters from Future Galaxy Cluster Surveys, ApJ 553 (June, 2001) 545–561.
- [5] M. D. Gladders and H. K. C. Yee, A new method for galaxy cluster detection. i. the algorithm, AJ 120 (Oct., 2000) 2148–2162.
- [6] E. S. Rykoff, E. Rozo, D. Hollowood, A. Bermeo-Hernandez, T. Jeltema, J. Mayers et al., The RedMaPPer Galaxy Cluster Catalog From DES Science Verification Data, ApJS 224 (May, 2016) 1, [1601.00621].
- [7] P. Rosati, S. Borgani and C. Norman, The Evolution of X-ray Clusters of Galaxies, ARAA 40 (2002) 539–577, [astro-ph/0209035].
- [8] R. A. Sunyaev and Y. B. Zeldovich, The Observations of Relic Radiation as a Test of the Nature of X-Ray Radiation from the Clusters of Galaxies, Comments on Astrophysics and Space Physics 4 (Nov., 1972) 173.
- [9] Z. Staniszewski, P. A. R. Ade, K. A. Aird, B. A. Benson, L. E. Bleem, J. E. Carlstrom et al., Galaxy Clusters Discovered with a Sunyaev-Zel’dovich Effect Survey, ApJ 701 (Aug., 2009) 32–41, [0810.1578].
- [10] M. Hasselfield, M. Hilton, T. A. Marriage, G. E. Addison, L. F. Barrientos, N. Battaglia et al., The Atacama Cosmology Telescope: Sunyaev-Zel’dovich selected galaxy clusters at 148 GHz from three seasons of data, JCAP 7 (July, 2013) 8, [1301.0816].
- [11] Planck Collaboration, P. A. R. Ade, N. Aghanim, C. Armitage-Caplan, M. Arnaud, M. Ashdown et al., Planck 2013 results. XXIX. The Planck catalogue of Sunyaev-Zeldovich sources, A&A 571 (Nov., 2014) A29, [1303.5089].
- [12] L. E. Bleem, B. Stalder, T. de Haan, K. A. Aird, S. W. Allen, D. E. Applegate et al., Galaxy Clusters Discovered via the Sunyaev-Zel’dovich Effect in the 2500-Square-Degree SPT-SZ Survey, ApJS 216 (Feb., 2015) 27, [1409.0850].
- [13] R. Laureijs, J. Amiaux, S. Arduini, J. . Auguères, J. Brinchmann, R. Cole et al., Euclid Definition Study Report, ArXiv e-prints (Oct., 2011) , [1110.3193].
- [14] D. Spergel, N. Gehrels, C. Baltay, D. Bennett, J. Breckinridge, M. Donahue et al., Wide-Field InfrarRed Survey Telescope-Astrophysics Focused Telescope Assets WFIRST-AFTA 2015 Report, ArXiv e-prints (Mar., 2015) , [1503.03757].
- [15] LSST Science Collaboration, LSST Science Book, Version 2.0, ArXiv e-prints (Dec., 2009) , [0912.0201].
- [16] A. Merloni, P. Predehl, W. Becker, H. Böhringer, T. Boller, H. Brunner et al., eROSITA Science Book: Mapping the Structure of the Energetic Universe, ArXiv e-prints (Sept., 2012) , [1209.3114].
- [17] M. D. Niemack, P. A. R. Ade, J. Aguirre, F. Barrientos, J. A. Beall, J. R. Bond et al., ACTPol: a polarization-sensitive receiver for the Atacama Cosmology Telescope, in Millimeter, Submillimeter, and Far-Infrared Detectors and Instrumentation for Astronomy V, vol. 7741 of Proc. SPIE, p. 77411S, July, 2010. 1006.5049. DOI.
- [18] B. Benson, The South Pole Telescope: Latest Results and Future Prospects, in Astrophysics from Antarctica (M. G. Burton, X. Cui and N. F. H. Tothill, eds.), vol. 288 of IAU Symposium, pp. 76–79, Jan., 2013. DOI.
- [19] K. N. Abazajian, P. Adshead, Z. Ahmed, S. W. Allen, D. Alonso, K. S. Arnold et al., CMB-S4 Science Book, First Edition, ArXiv e-prints (Oct., 2016) , [1610.02743].
- [20] Planck Collaboration, P. A. R. Ade, N. Aghanim, M. Arnaud, M. Ashdown, J. Aumont et al., Planck 2015 results. XXIV. Cosmology from Sunyaev-Zeldovich cluster counts, A&A 594 (Sept., 2016) A24, [1502.01597].
- [21] T. de Haan, B. A. Benson, L. E. Bleem, S. W. Allen, D. E. Applegate, M. L. N. Ashby et al., Cosmological Constraints from Galaxy Clusters in the 2500 Square-degree SPT-SZ Survey, ApJ 832 (Nov., 2016) 95, [1603.06522].
- [22] A. von der Linden, M. T. Allen, D. E. Applegate, P. L. Kelly, S. W. Allen, H. Ebeling et al., Weighing the Giants - I. Weak-lensing masses for 51 massive galaxy clusters: project overview, data analysis methods and cluster images, MNRAS 439 (Mar., 2014) 2–27, [1208.0597].
- [23] H. Hoekstra, R. Herbonnet, A. Muzzin, A. Babul, A. Mahdavi, M. Viola et al., The Canadian Cluster Comparison Project: detailed study of systematics and updated weak lensing masses, ArXiv e-prints (Feb., 2015) , [1502.01883].
- [24] K. Umetsu, A. Zitrin, D. Gruen, J. Merten, M. Donahue and M. Postman, CLASH: Joint Analysis of Strong-lensing, Weak-lensing Shear, and Magnification Data for 20 Galaxy Clusters, ApJ 821 (Apr., 2016) 116, [1507.04385].
- [25] J.-B. Melin and J. G. Bartlett, Measuring cluster masses with CMB lensing: a statistical approach, A&A 578 (June, 2015) A21, [1408.5633].
- [26] E. J. Baxter, R. Keisler, S. Dodelson, K. A. Aird, S. W. Allen, M. L. N. Ashby et al., A Measurement of Gravitational Lensing of the Cosmic Microwave Background by Galaxy Clusters Using Data from the South Pole Telescope, ApJ 806 (June, 2015) 247, [1412.7521].
- [27] M. Madhavacheril, N. Sehgal, R. Allison, N. Battaglia, J. R. Bond, E. Calabrese et al., Evidence of Lensing of the Cosmic Microwave Background by Dark Matter Halos, Physical Review Letters 114 (Apr., 2015) 151302, [1411.7999].
- [28] Planck Collaboration, R. Adam, P. A. R. Ade, N. Aghanim, Y. Akrami, M. I. R. Alves et al., Planck 2015 results. I. Overview of products and scientific results, ArXiv e-prints (Feb., 2015) , [1502.01582].
- [29] J. Delabrouille, M. Betoule, J.-B. Melin, M.-A. Miville-Deschênes, J. Gonzalez-Nuevo, M. Le Jeune et al., The pre-launch Planck Sky Model: a model of sky emission at submillimetre to centimetre wavelengths, A&A 553 (May, 2013) A96, [1207.3675].
- [30] J. Delabrouille, J.-B. Melin and J. G. Bartlett, Simulations of Sunyaev-Zel’dovich Maps and Their Applications, in AMiBA 2001: High-Z Clusters, Missing Baryons, and CMB Polarization (L.-W. Chen, C.-P. Ma, K.-W. Ng and U.-L. Pen, eds.), vol. 257 of Astronomical Society of the Pacific Conference Series, p. 81, 2002. astro-ph/0109186.
- [31] J. Tinker, A. V. Kravtsov, A. Klypin, K. Abazajian, M. Warren, G. Yepes et al., Toward a Halo Mass Function for Precision Cosmology: The Limits of Universality, ApJ 688 (Dec., 2008) 709–728, [0803.2706].
- [32] D. Nagai, A. V. Kravtsov and A. Vikhlinin, Effects of Galaxy Formation on Thermodynamics of the Intracluster Medium, ApJ 668 (Oct., 2007) 1–14, [arXiv:astro-ph/0703661].
- [33] M. Arnaud, G. W. Pratt, R. Piffaretti, H. Böhringer, J. H. Croston and E. Pointecouteau, The universal galaxy cluster pressure profile from a representative sample of nearby systems (REXCESS) and the YSZ - M500 relation, A&A 517 (July, 2010) A92, [0910.1234].
- [34] E. Pointecouteau, M. Arnaud and G. W. Pratt, The structural and scaling properties of nearby galaxy clusters. I. The universal mass profile, A&A 435 (May, 2005) 1–7, [arXiv:astro-ph/0501635].
- [35] N. Itoh, Y. Kohyama and S. Nozawa, Relativistic Corrections to the Sunyaev-Zeldovich Effect for Clusters of Galaxies, ApJ 502 (July, 1998) 7–15, [astro-ph/9712289].
- [36] S. Y. Sazonov and R. A. Sunyaev, Cosmic Microwave Background Radiation in the Direction of a Moving Cluster of Galaxies with Hot Gas: Relativistic Corrections, ApJ 508 (Nov., 1998) 1–5.
- [37] A. Challinor and A. Lasenby, Relativistic Corrections to the Sunyaev-Zeldovich Effect, ApJ 499 (May, 1998) 1–6, [astro-ph/9711161].
- [38] Planck Collaboration, R. Adam, P. A. R. Ade, N. Aghanim, M. Ashdown, J. Aumont et al., Planck intermediate results. XLIII. The spectral energy distribution of dust in clusters of galaxies, ArXiv e-prints (Mar., 2016) , [1603.04919].
- [39] J.-B. Melin and al., in prep, .
- [40] J. E. Carlstrom, P. A. R. Ade, K. A. Aird, B. A. Benson, L. E. Bleem, S. Busetti et al., The 10 Meter South Pole Telescope, PASP 123 (May, 2011) 568–581, [0907.4445].
- [41] Z. D. Kermish, P. Ade, A. Anthony, K. Arnold, D. Barron, D. Boettger et al., The POLARBEAR experiment, in Millimeter, Submillimeter, and Far-Infrared Detectors and Instrumentation for Astronomy VI, vol. 8452 of Proc. SPIE, p. 84521C, Sept., 2012. 1210.7768. DOI.
- [42] Planck Collaboration, P. A. R. Ade, N. Aghanim, M. Arnaud, M. Ashdown, J. Aumont et al., Planck early results. VIII. The all-sky early Sunyaev-Zeldovich cluster sample, A&A 536 (Dec., 2011) A8, [1101.2024].
- [43] Planck Collaboration, P. A. R. Ade, N. Aghanim, M. Arnaud, M. Ashdown, J. Aumont et al., Planck 2015 results. XXVII. The second Planck catalogue of Sunyaev-Zeldovich sources, A&A 594 (Sept., 2016) A27, [1502.01598].
- [44] J.-B. Melin, J. G. Bartlett and J. Delabrouille, Catalog extraction in SZ cluster surveys: a matched filter approach, A&A 459 (Nov., 2006) 341–352, [arXiv:astro-ph/0602424].
- [45] N. Battaglia, J. R. Bond, C. Pfrommer and J. L. Sievers, On the Cluster Physics of Sunyaev-Zel’dovich and X-Ray Surveys. I. The Influence of Feedback, Non-thermal Pressure, and Cluster Shapes on Y-M Scaling Relations, ApJ 758 (Oct., 2012) 74, [1109.3709].
- [46] S. T. Kay, M. W. Peel, C. J. Short, P. A. Thomas, O. E. Young, R. A. Battye et al., Sunyaev-Zel’dovich clusters in Millennium gas simulations, MNRAS 422 (May, 2012) 1999–2023, [1112.3769].
- [47] F. Sembolini, M. De Petris, G. Yepes, E. Foschi, L. Lamagna and S. Gottlöber, The MUSIC of Galaxy Clusters - III. Properties, evolution and Y-M scaling relation of protoclusters of galaxies, MNRAS 440 (June, 2014) 3520–3531, [1309.5387].
- [48] A. M. C. Le Brun, I. G. McCarthy, J. Schaye and T. J. Ponman, The scatter and evolution of the global hot gas properties of simulated galaxy cluster populations, MNRAS (Dec., 2016) , [1606.04545].
- [49] N. Truong, E. Rasia, P. Mazzotta, S. Planelles, V. Biffi, D. Fabjan et al., Hydrodynamic Simulations of Galaxy Clusters: Scaling Relations and Evolution, ArXiv e-prints (June, 2016) , [1607.00019].
- [50] D. J. Barnes, S. T. Kay, M. A. Henson, I. G. McCarthy, J. Schaye and A. Jenkins, The redshift evolution of massive galaxy clusters in the MACSIS simulations, MNRAS 465 (Feb., 2017) 213–233, [1607.04569].
- [51] B. Sartoris, A. Biviano, C. Fedeli, J. G. Bartlett, S. Borgani, M. Costanzi et al., Next generation cosmology: constraints from the Euclid galaxy cluster survey, MNRAS 459 (June, 2016) 1764–1780, [1505.02165].
- [52] Planck Collaboration, P. A. R. Ade, N. Aghanim, C. Armitage-Caplan, M. Arnaud, M. Ashdown et al., Planck 2013 results. XX. Cosmology from Sunyaev-Zeldovich cluster counts, ArXiv e-prints (Mar., 2013) , [1303.5080].
- [53] S. Bocquet, A. Saro, J. J. Mohr, K. A. Aird, M. L. N. Ashby, M. Bautz et al., Mass Calibration and Cosmological Analysis of the SPT-SZ Galaxy Cluster Sample Using Velocity Dispersion v and X-Ray Y X Measurements, ApJ 799 (Feb., 2015) 214, [1407.2942].
- [54] W. Cash, Parameter estimation in astronomy through application of the likelihood ratio, ApJ 228 (Mar., 1979) 939–947.
- [55] W. Hu and J. D. Cohn, Likelihood methods for cluster dark energy surveys, Phys. Rev. D 73 (Mar., 2006) 067301, [astro-ph/0602147].
- [56] M. Takada and D. N. Spergel, Joint analysis of cluster number counts and weak lensing power spectrum to correct for the super-sample covariance, MNRAS 441 (July, 2014) 2456–2475, [1307.4399].
- [57] E. Di Valentino, T. Brinckmann, M. Gerbino, V. Poulin, F. R. Bouchet, J. Lesgourgues et al., Exploring Cosmic Origins with CORE: Cosmological Parameters, ArXiv e-prints (Nov., 2016) , [1612.00021].
- [58] S. Grandis, S. Seehars, A. Refregier, A. Amara and A. Nicola, Information gains from cosmological probes, JCAP 5 (May, 2016) 034, [1510.06422].
- [59] A. Albrecht, G. Bernstein, R. Cahn, W. L. Freedman, J. Hewitt, W. Hu et al., Report of the Dark Energy Task Force, ArXiv Astrophysics e-prints (Sept., 2006) , [astro-ph/0609591].
- [60] M. P. Hobson, A. H. Jaffe, A. R. Liddle, P. Mukherjee and D. Parkinson, Bayesian Methods in Cosmology. Dec., 2009.
- [61] M. C. March, R. Trotta, L. Amendola and D. Huterer, Robustness to systematics for future dark energy probes, MNRAS 415 (July, 2011) 143–152, [1101.1521].
- [62] A. Amara and A. Refregier, Model breaking measure for cosmological surveys, PRD 89 (Apr., 2014) 083501, [1309.5955].
- [63] S. Seehars, A. Amara, A. Refregier, A. Paranjape and J. Akeret, Information gains from cosmic microwave background experiments, PRD 90 (July, 2014) 023533, [1402.3593].
- [64] P. Paykari, S. Pires, J.-L. Starck and A. H. Jaffe, Sparsely sampling the sky: Regular vs. random sampling, AAP 581 (Sept., 2015) A113, [1306.3035].
- [65] M. Raveri, M. Martinelli, G. Zhao and Y. Wang, Information Gain in Cosmology: From the Discovery of Expansion to Future Surveys, ArXiv e-prints (June, 2016) , [1606.06273].
- [66] S. Kullback and R. A. Leibler, On information and sufficiency, Ann. Math. Stat. 22 (March, 1951) 79–86.
- [67] T. M. Cover and J. A. Thomas, Elements of Information Theory. John Wiley & Sons, Inc., 2012.
- [68] R. A. Sunyaev and I. B. Zeldovich, The velocity of clusters of galaxies relative to the microwave background - The possibility of its measurement, MNRAS 190 (Feb., 1980) 413–420.
- [69] R. A. Sunyaev and Y. B. Zeldovich, Small-Scale Fluctuations of Relic Radiation, Ap&SS 7 (Apr., 1970) 3–19.
- [70] P. G. Ferreira, R. Juszkiewicz, H. A. Feldman, M. Davis and A. H. Jaffe, Streaming Velocities as a Dynamical Estimator of , ApJL 515 (Apr., 1999) L1–L4, [astro-ph/9812456].
- [71] N. Hand, G. E. Addison, E. Aubourg, N. Battaglia, E. S. Battistelli, D. Bizyaev et al., Evidence of Galaxy Cluster Motions with the Kinematic Sunyaev-Zel’dovich Effect, Physical Review Letters 109 (July, 2012) 041101, [1203.4219].
- [72] B. Soergel, S. Flender, K. T. Story, L. Bleem, T. Giannantonio, G. Efstathiou et al., Detection of the kinematic Sunyaev-Zel’dovich effect with DES Year 1 and SPT, ArXiv e-prints (Mar., 2016) , [1603.03904].
- [73] C. Hernández-Monteagudo, L. Verde, R. Jimenez and D. N. Spergel, Correlation Properties of the Kinematic Sunyaev-Zel’dovich Effect and Implications for Dark Energy, ApJ 643 (June, 2006) 598–615, [arXiv:astro-ph/0511061].
- [74] M. Remazeilles, J. Delabrouille and J.-F. Cardoso, CMB and SZ effect separation with constrained Internal Linear Combinations, MNRAS 410 (Feb., 2011) 2481–2487, [1006.5599].
- [75] S. Satpathy, S. Alam, S. Ho, M. White, N. A. Bahcall, F. Beutler et al., BOSS DR12 combined galaxy sample: The clustering of galaxies in the completed SDSS-III Baryon Oscillation Spectroscopic Survey: On the measurement of growth rate using galaxy correlation functions, ArXiv e-prints (July, 2016) , [1607.03148].
- [76] C. Contreras, C. Blake, G. B. Poole, F. Marin, S. Brough, M. Colless et al., The WiggleZ Dark Energy Survey: measuring the cosmic growth rate with the two-point galaxy correlation function, MNRAS 430 (Apr., 2013) 924–933, [1302.5178].
- [77] N. Benitez, R. Dupke, M. Moles, L. Sodre, J. Cenarro, A. Marin-Franch et al., J-PAS: The Javalambre-Physics of the Accelerated Universe Astrophysical Survey, ArXiv e-prints (Mar., 2014) , [1403.5237].
- [78] F. B. Abdalla, P. Bull, S. Camera, A. Benoit-Lévy, B. Joachimi, D. Kirk et al., Cosmology from HI galaxy surveys with the SKA, Advancing Astrophysics with the Square Kilometre Array (AASKA14) (Apr., 2015) 17, [1501.04035].
- [79] N. S. Sugiyama, T. Okumura and D. N. Spergel, Will Kinematic Sunyaev-Zel’dovich Measurements Enhance the Science Return from Galaxy Redshift Surveys?, ArXiv e-prints (June, 2016) , [1606.06367].
- [80] C. J. A. P. Martins, Fundamental cosmology in the E-ELT era: The status and future role of tests of fundamental coupling stability, Gen. Rel. Grav. 47 (2015) 1843, [1412.0108].
- [81] J. Jaeckel and A. Ringwald, The Low-Energy Frontier of Particle Physics, Ann. Rev. Nucl. Part. Sci. 60 (2010) 405–437, [1002.0329].
- [82] I. M. H. Etherington, On the Definition of Distance in General Relativity., Philosophical Magazine 15 (1933) .
- [83] A. Avgoustidis, G. Luzzi, C. J. A. P. Martins and A. M. R. V. L. Monteiro, Constraints on the CMB temperature redshift dependence from SZ and distance measurements, JCAP 1202 (2012) 013, [1112.1862].
- [84] J. Chluba, Tests of the CMB temperature-redshift relation, CMB spectral distortions and why adiabatic photon production is hard, MNRAS 443 (Sept., 2014) 1881–1888, [1405.1277].
- [85] J. A. S. Lima, Thermodynamics of decaying vacuum cosmologies, Phys. Rev. D54 (1996) 2571–2577, [gr-qc/9605055].
- [86] E. S. Battistelli, M. DePetris, L. Lamagna, F. Melchiorri, E. Palladino, G. Savini et al., Cosmic microwave background temperature at galaxy clusters, Astrophys. J. 580 (2002) L101, [astro-ph/0208027].
- [87] G. Luzzi, M. Shimon, L. Lamagna, Y. Rephaeli, M. De Petris, A. Conte et al., Redshift Dependence of the CMB Temperature from S-Z Measurements, Astrophys. J. 705 (2009) 1122–1128, [0909.2815].
- [88] G. Hurier, N. Aghanim, M. Douspis and E. Pointecouteau, Measurement of the evolution from the Sunyaev-Zel’dovich effect, Astron. Astrophys. 561 (2014) A143, [1311.4694].
- [89] A. Saro, J. Liu, J. J. Mohr, K. A. Aird, M. L. N. Ashby, M. Bayliss et al., Constraints on the CMB temperature evolution using multiband measurements of the Sunyaev-Zel’dovich effect with the South Pole Telescope, MNRAS 440 (May, 2014) 2610–2615, [1312.2462].
- [90] I. de Martino, R. Génova-Santos, F. Atrio-Barandela, H. Ebeling, A. Kashlinsky, D. Kocevski et al., Constraining the Redshift Evolution of the Cosmic Microwave Background Blackbody Temperature with PLANCK Data, Astrophys. J. 808 (2015) 128, [1502.06707].
- [91] G. Luzzi, R. T. Génova-Santos, C. J. A. P. Martins, M. De Petris and L. Lamagna, Constraining the evolution of the CMB temperature with SZ measurements from Planck data, JCAP 1509 (2015) 011, [1502.07858].
- [92] R. Srianand, P. Petitjean and C. Ledoux, The microwave background temperature at the redshift of 2.33771, Nature 408 (2000) 931, [astro-ph/0012222].
- [93] P. Noterdaeme, P. Petitjean, R. Srianand, C. Ledoux and S. Lopez, The evolution of the Cosmic Microwave Background Temperature: Measurements of TCMB at high redshift from carbon monoxide excitation, Astron. Astrophys. 526 (2011) L7, [1012.3164].
- [94] Planck Collaboration, P. A. R. Ade, N. Aghanim, M. Arnaud, M. Ashdown, J. Aumont et al., Planck 2015 results. XIII. Cosmological parameters, A&A 594 (Sept., 2016) A13, [1502.01589].
- [95] A. Avgoustidis, R. T. Génova-Santos, G. Luzzi and C. J. A. P. Martins, Subpercent constraints on the cosmological temperature evolution, Phys. Rev. D93 (2016) 043521, [1511.04335].
- [96] R. Fabbri, F. Melchiorri and V. Natale, The Sunyaev-Zel’dovich effect in the millimetric region, Ap&SS 59 (Nov., 1978) 223–236.
- [97] Y. Rephaeli, On the determination of the degree of cosmological Compton distortions and the temperature of the cosmic blackbody radiation, ApJ 241 (Nov., 1980) 858–863.
- [98] Y. Rephaeli, Cosmic microwave background comptonization by hot intracluster gas, ApJ 445 (May, 1995) 33–36.
- [99] N. Itoh, T. Sakamoto, S. Kusano, Y. Kawana and S. Nozawa, Radiative processes in the intracluster plasma, A&A 382 (Feb., 2002) 722–729.
- [100] M. Shimon and Y. Rephaeli, Cosmic Microwave Background Comptonization by Energetic Nonthermal Electrons in Clusters of Galaxies, ApJ 575 (Aug., 2002) 12–17, [astro-ph/0204355].
- [101] J. Delabrouille, J.-F. Cardoso, M. Le Jeune, M. Betoule, G. Fay and F. Guilloux, A full sky, low foreground, high resolution cmb map from wmap, Astronomy & Astrophysics 493 (2009) 835–857.
- [102] M. Remazeilles, N. Aghanim and M. Douspis, Reconstruction of high-resolution Sunyaev-Zeldovich maps from heterogeneous data sets using needlets, MNRAS 430 (Mar., 2013) 370–385, [1207.4683].
- [103] F. Narcowich, P. Petrushev and J. WardSIAM J. Math. Anal. 38 (2006) 574.
- [104] Planck Collaboration, N. Aghanim, M. Arnaud, M. Ashdown, J. Aumont, C. Baccigalupi et al., Planck 2015 results. XXII. A map of the thermal Sunyaev-Zeldovich effect, A&A 594 (Sept., 2016) A22, [1502.01596].
- [105] J. A. Rubiño-Martín and R. A. Sunyaev, Discriminating between unresolved point sources and ‘negative’ Sunyaev-Zel’dovich clusters in cosmic microwave background maps, MNRAS 344 (Oct., 2003) 1155–1174, [astro-ph/0211430].
- [106] J. C. Hill, B. D. Sherwin, K. M. Smith, G. E. Addison, N. Battaglia, E. S. Battistelli et al., The Atacama Cosmology Telescope: A Measurement of the Thermal Sunyaev-Zel’dovich One-Point PDF, ArXiv e-prints (Nov., 2014) , [1411.8004].
- [107] Planck Collaboration, N. Aghanim, M. Arnaud, M. Ashdown, J. Aumont, C. Baccigalupi et al., Planck 2015 results. XXII. A map of the thermal Sunyaev-Zeldovich effect, A&A 594 (Sept., 2016) A22, [1502.01596].
- [108] K. M. Górski, E. Hivon, A. J. Banday, B. D. Wandelt, F. K. Hansen, M. Reinecke et al., HEALPix: A Framework for High-Resolution Discretization and Fast Analysis of Data Distributed on the Sphere, ApJ 622 (Apr., 2005) 759–771, [astro-ph/0409513].
- [109] A. Lewis and S. Bridle, Cosmological parameters from CMB and other data: A Monte Carlo approach, Phys. Rev. D 66 (Nov., 2002) 103511, [astro-ph/0205436].
- [110] D. Blas, J. Lesgourgues and T. Tram, The Cosmic Linear Anisotropy Solving System (CLASS). Part II: Approximation schemes, JCAP 7 (July, 2011) 034, [1104.2933].
- [111] B. Audren, J. Lesgourgues, K. Benabed and S. Prunet, Conservative Constraints on Early Cosmology: an illustration of the Monte Python cosmological parameter inference code, JCAP 1302 (2013) 001, [1210.7183].