Extended ionized gas clouds in the Abell 1367 cluster 111Based on data collected at Subaru Telescope, which is operated by the National Astronomical Observatory of Japan.
Abstract
We surveyed a central 0.6 deg2 region of Abell 1367 cluster for extended ionized gas clouds (EIGs) using the Subaru prime-focus camera (Suprime-Cam) with a narrow-band filter that covers H. We discovered six new EIGs in addition to five known EIGs. We also found that the H tail from the blue infalling group (BIG) is extended to about 330 kpc in projected distance, which is about twice longer than previously reported. Candidates of star-forming blobs in the tail are detected. The properties of the EIG parent galaxies in Abell 1367 basically resemble those in the Coma cluster. A noticeable difference is that the number of detached EIGs is significantly fewer in Abell 1367, while the fraction of blue member galaxies is higher. The results suggest a difference in the evolutionary stage of the clusters; Abell 1367 is at an earlier stage than the Coma cluster.
1 Introduction
Gas loss from star-forming galaxies is an important processe in galaxy evolution. In clusters of galaxies quiescent galaxies outnumber star-forming galaxies, and some gas-loss mechanisms should have worked efficiently. Various physical mechanisms for the gas-loss have been investigated: internal consumption by a star formation (Larson et al., 1980), ram-pressure stripping (Gunn & Gott, 1972), viscous stripping (Nulsen, 1982), a tidal interaction (Toomre & Toomre, 1972; Icke, 1985; Moore et al., 1996, 1999), expelling by a galactic wind caused by an active galactic nucleus (AGN) and/or starburst (Veilleux et al., 2005), etc (see Boselli & Gavazzi, 2006, for review). If the interstellar gas was not consumed in a galaxy but expelled, the gas could be found around the galaxy. Such gas around galaxies in cluster has been found in X-ray (e.g., Fabian et al., 2003; Wang et al., 2004; Sun & Vikhlinin,, 2005; Sun et al., 2006; Randall et al., 2008; Sun et al., 2010; Ehlert et al., 2013; Gu et al., 2013; Zhang et al., 2013; Schellenberger & Reiprich, 2015), H line (e.g., Kenney et al., 1995; Gavazzi et al., 1995; Kenney & Koopmann, 1999; Gavazzi et al., 2001a; Conselice et al., 2001; Yoshida et al., 2002; Chemin et al., 2005; Cortese et al., 2006; Yagi et al., 2007; Sun et al., 2007; Kenney et al., 2008; Yagi et al., 2010; Sun et al., 2010; Arrigoni Battaia et al., 2012; Fossati et al., 2012; Yagi et al., 2013b; Kenney et al., 2014; Yagi et al., 2015a; Boselli et al., 2016), radio continuum (e.g., Gavazzi, 1978; Miley et al., 1980; Kotanyi & Ekers, 1983; Gavazzi et al., 1984; Dickey & Salpeter, 1984; Hummel & Saikia, 1991), H I (e.g., Oosterloo & van Gorkom, 2005; Hota et al., 2007; Chung et al., 2007; Scott et al., 2013), and molecular lines (e.g., Boselli et al., 1994; Salomé et al., 2006, 2011; Scott et al., 2013; Jachym et al., 2014; Scott et al., 2015). Different phases of the gas are observed at different wavelengths, while their spatial distributions often resemble each other (e.g. Sun et al., 2010).
By imaging in H narrow-band, we can observe an ionized gas with high spatial resolution and high sensitivity. The H gas around a galaxy in a cluster suggests a recent or ongoing gas-loss event of the parent galaxy, since the gas is heated by the ambient hot plasma and will eventually get mixed with it. Such extended ionized gas (EIG) was reported in various nearby clusters; in Abell 1367 (e.g., Gavazzi et al., 2001a; Iglesias-Páramo et al., 2002; Sakai et al., 2002; Gavazzi et al., 2003a; Cortese et al., 2006; Sakai et al., 2012), in the Virgo cluster (e.g., Kenney & Koopmann, 1999; Yoshida et al., 2002; Kenney et al., 2008; Arrigoni Battaia et al., 2012; Kenney et al., 2014), in the Coma cluster (e.g., Yagi et al., 2007; Yoshida et al., 2008; Yagi et al., 2010; Yoshida et al., 2012; Fossati et al., 2012), in Abell 3627 (e.g., Sun et al., 2007, 2010), and in some distant clusters (e.g.. Abell 851 Yagi et al., 2015a). Yagi et al. (2010) found 14 EIGs in the central 1 Mpc of the Coma cluster, a nearby rich cluster. In addition, Yagi et al. (2015a) searched for EIGs in two clusters at z0.4. In one of them, nine EIGs were found, and eight of their parents are spectroscopically confirmed members of the cluster. In the other cluster, no EIG was found. These studies suggest that the relative EIGs number normalized by the cluster richness is significantly different. It is therefore intriguing to investigate what characteristics of cluster affect the number of EIGs, and a survey for EIGs in clusters with different characteristics from the Coma cluster is important.
The Abell 1367 cluster at z = 0.0217 (6494 km s-1 Gavazzi et al., 2010) lies at the intersection of two filaments (West et al., 2000). Abell 1367 is thought to be a young cluster from its high fraction of spiral galaxies (Butcher & Oemler, 1984), low central galaxy density (Butcher & Oemler, 1984), and the irregular shape of the hot gas distribution (Jones et al., 1979; Bechtold et al., 1983; Grebenev et al., 1995). Moreover, Abell 1367 would have experienced a multiple merger of substructures. From the analysis of 273 redshift measurements, Cortese et al. (2004) confirmed that the cluster has two main density peaks associated with two substructures. The northwest subcluster is probably in the early phase of merging into the southeast substructure. Donnelly et al. (1998) presented the existence of a strong localized shock in the intra-cluster medium (ICM). Chandra observations (Sun & Murray, 2002) indicate the presence of cool gas streaming into the cluster core, supporting a multiple merger scenario. The evidence for infall of galaxies at high velocity in the NW subcluster is provided by three further galaxies: CGCG 097-073, 097-079 and 097-087 that display extended cometary emission exceeding the galaxy length by approximately 50 kpc in the direction opposite to the cluster center. Gavazzi (1978) discovered extended radio continuum (1420 MHz) emission trailing behind them, further analyzed by Gavazzi et al. (1984), Gavazzi & Jaffe (1987), and Gavazzi et al. (1995). These three galaxies appear marginally H I deficient (Gavazzi, 1987, 1989) and have normal CO content (Boselli et al., 1994).
Moreover, Abell 1367 is one of the best-studied nearby clusters in H. Gavazzi et al. (2001a) discovered H cometary trails coinciding in length and direction with the radio continuum ones. Iglesias-Páramo et al. (2002) gives the H emitter catalog of the Abell 1367 (including the Coma cluster) using four exposures of 0.5 degree2 each obtained with the WFC camera attached to the 2.5m William Herschel Telescope (WHT), with a sensitivity of approximately erg s-1 cm-2 obtained with one hour exposures per field. The total number of galaxies with H in this sensitivity was 41. Sakai et al. (2002) discovered a group of dwarf star-forming galaxies near the X-ray center of Abell 1367 from a deep H survey, and discussed their tidal origin. Gavazzi et al. (2003a) independently investigated this star-forming compact group and suggested that it is in fact infalling onto Abell 1367 (the group was dubbed BIG from Blue Infalling Group). Cortese et al. (2006) provided deeper H imaging and multi-slit spectroscopy of BIG providing further evidence for a high velocity encounter between the compact group and the cluster as a whole.
Thus, many intensive studies in H have been performed on Abell 1367 including a uniform survey in H (Iglesias-Páramo et al., 2002, e.g.,). Meanwhile no uniform survey of EIGs has been carried out yet, as it requires a deep and wide-field H observation. In this paper, we present a catalog of EIGs in the Abell 1367 cluster found in our H narrowband imaging with the Subaru Prime Focus Camera (Suprime-Cam). We assume that the distance modulus to Abell 1367 is and (,,) = (0.697,0.282,0.718) (Hinshaw et al., 2013). Under these assumptions, 1 arcsec corresponds to 0.463 kpc. We use AB-magnitude system of the instrument unless otherwise noted.
2 Data
2.1 Observation
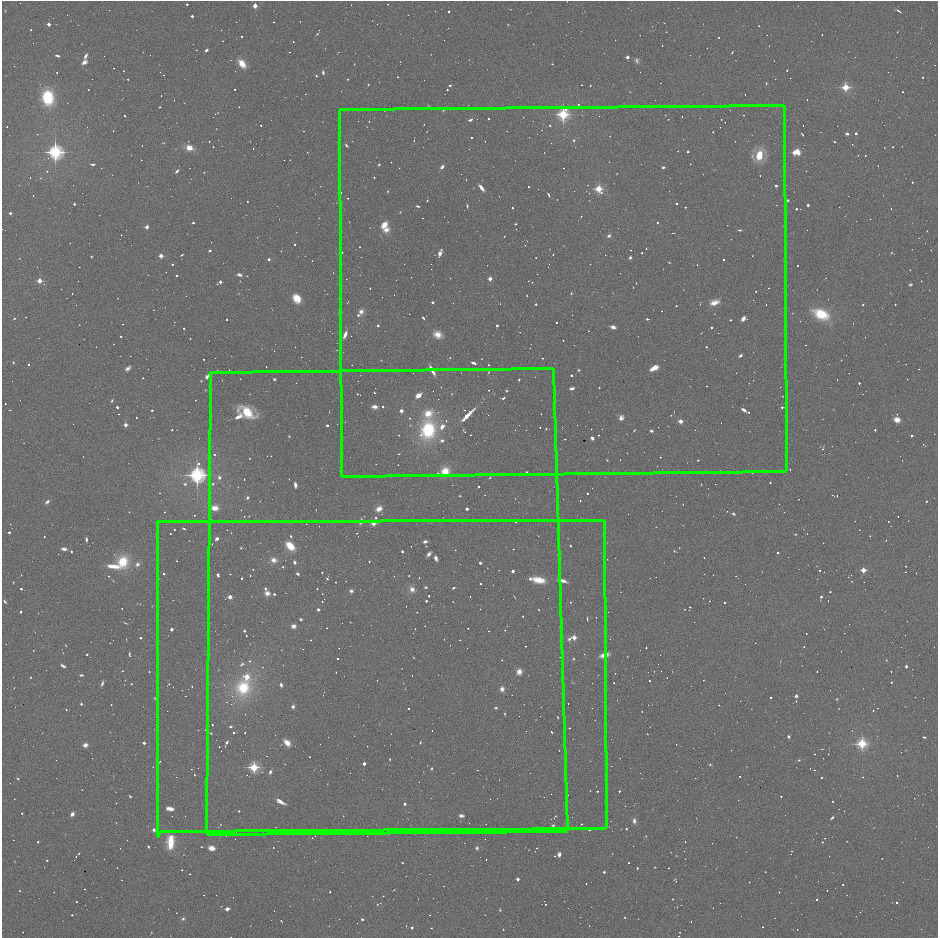
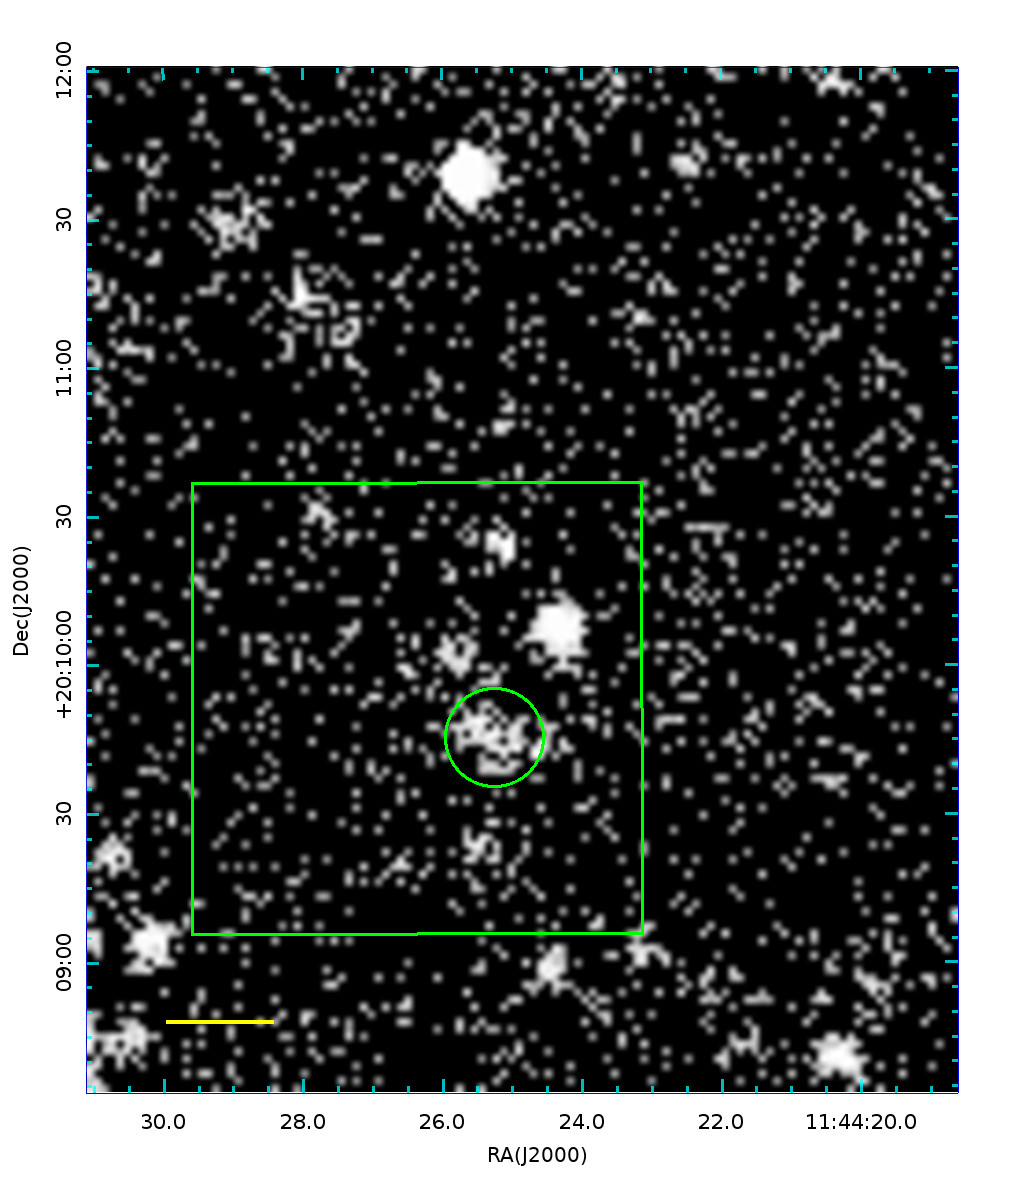
Three fields of Abell 1367 were observed with Suprime-Cam (Miyazaki et al., 2002) at the Subaru Telescope (Iye et al., 2004) in Apr–May 2014 in UTC. The field position and orientation are shown in Figure 1, and the observations are summarized in Table 1. The pixel scale of the data is 0”.202 pixel-1. The total survey area is 2207 arcmin2, which corresponds to 1.7 Mpc2. We dithered to fill the gap between CCDs by 1.1 arcmin, typically by five exposures.
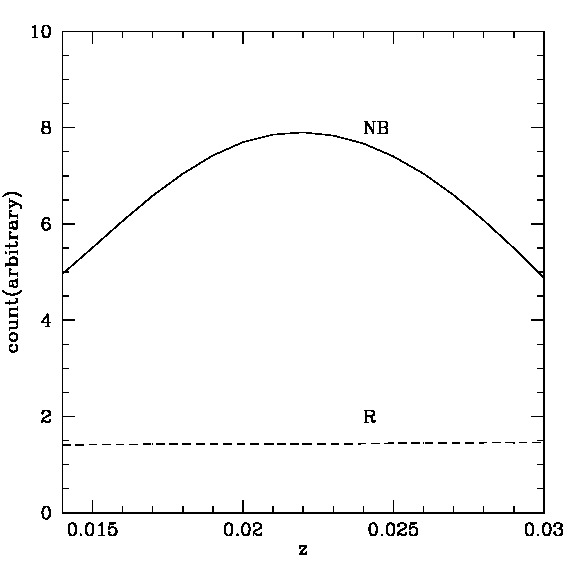
We used three broadband filters (B, R, i), and a narrowband filter (N-A-L671, hereafter NB). The NB-filter was originally designed for observing H emitting objects in the Coma cluster at z = 0.0225, and has bell-shaped transmittance with a central wavelength of 6712 Å and FWHM of 120 Å (Yagi et al., 2007; Yoshida et al., 2008). Since the redshift of Abell 1367 (z = 0.0217) is comparable to the Coma cluster, the filter is also capable of observing H in Abell 1367.
2.2 Data Reduction
The data reduction was mostly the same as Yagi et al. (2010): overscan subtraction, flat-fielding, distortion correction, background subtraction and mosaicking were performed. The sky background was subtracted with a mesh size of 512 pixels (1.7 arcmin) square. We applied several improved processing, too. Crosstalk is corrected by the method by Yagi et al. (2012), blooming was masked automatically, and some optical ghosts were corrected by new algorithms (Yagi et al., 2015b). For the reference of the bright stars in the field, PPM-Extended (PPMX) catalog (Röser et al., 2008) was used to obtain the position at the epoch of the observation, after world coordinate system (WCS) calibration using astrometry.net (Lang et al., 2010). The star positions were used for the ghost correction.
2.3 Photometric Calibration
The flux zero point was calibrated using Sloan Digital Sky Survey III (SDSS-III) Ninth Data Release (DR9) photometric catalog(Ahn et al., 2012). The color conversion procedure was the same as Yagi et al. (2013a), and the color conversion coefficients are given in Yoshida et al. (2016). About 300–900 stars were used for the calibration, and the root mean square(rms) was 0.04–0.05 mag.
We measured the flux in a 2” apertures at random position in the combined images and estimated the rms from the median of the absolute deviation (MAD) as rms = 1.4826 MAD. In the combined images, northeast and southwest regions have no data, and we abandoned the apertures in the regions. As a result, valid aperture positions were . The calculated rms is given in Table 1 as a limiting surface brightness (SB).
We adopted the Galactic extinction values of 0.084, 0.050, 0.050, and 0.039, for B, R, NB, and i-bands, respectively, from NASA/IPAC Extragalactic Database (NED) 111http://ned.ipac.caltech.edu/, which uses Schlalfy & Finkbeiner (2011) recalibration of Schlegel et al. (1998) data. The same extinction correction was applied to the whole field.
2.4 Search for EIGs
For detecting H clouds, we subtracted the R-band image from the NB image. Here, we refer to the R-band subtracted NB-band image as NB-R image, or simply H image when it is not confusing. Note that this NB-R image includes [N II] emission, and possible residual flux of the continuum. Following Yagi et al. (2010), we adopted for the R-band subtraction from the NB image. The color determined the relative flux scaling between and for a typical continuum spectrum of objects without H emission/absorption at z0.02.
If the underlying continuum is bluer, the is smaller (Figure 3 of Yagi et al., 2010). An excess recognized in NB-R image is thus not always an emission but could be a residual of a red continuum. The H flux estimation is largely affected by the continuum subtraction. In this study, we therefore focused on the excess in the NB-R image where continuum is negligible. Such an excess would be the ionized gas out of galaxies, EIG. Meanwhile, quantitative discussion about star formation in the galactic disk, for example, is beyond the scope of this paper. Later we investigate possible star formations in EIGs, but we should be careful that a future spectroscopic confirmation is necessary (e.g., Yagi et al., 2013b).
The seeing sizes were estimated using SExtractor(Bertin & Arnouts, 1996) version 2.19.5. The NB image has a seeing size variation among the field; 0”.7 at NW, while 0”.9 at SE. The seeing size of most NB data is smaller than that of R-band images. For detecting extended H clouds out of galaxies the difference of the seeing size affects little. The oversubtraction of R-band is small around pure H emissions, while it is large around objects with continuum (e.g., foreground stars).
In the H (NB-R) image, extended H clouds were searched by visual inspection. Then B, R, and i-band images were used to reject possible residuals of bright continuum. In Table 2, the newly detected H emitting clouds extending beyond galaxies are listed. Already known EIGs (CGCG 097-073, CGCG 097-079, CGCG 097-087, CGCG 097-087N, and BIG) are also shown as a reference.
In the first inspection, we did not match the point spread function (PSF), because the NB images have better resolution than the R-band images and PSF matching would make the fine H structures blurred. A slight debris of background subtraction sometimes mimics an H emitting object, but the high spatial resolution of the H image enables us to distinguish artifacts from EIGs. Moreover, a blur of R-band due to the PSF mismatch does not affect the visual inspection since we focused on the objects with a weak continuum flux. In our previous study of the Coma cluster (Yagi et al., 2010), all the EIGs detected in the same procedure as in this study are spectroscopically confirmed to be real EIGs in the Coma cluster (Yoshida et al., in preparation).
As the exposure time and the transparency of the atmosphere were not uniform in our data, the S/N should vary among the positions by 10 percent. In this study, however, the detection of extended H clouds was not affected by the S/N variation. As a test, we made a low S/N image, half of the original, by adding artificial noise, and searched for EIGs again. We can find the same set of the EIGs in the lower S/N image, though the detail structures of EIGs were buried with the noises in the eye inspection. Because we adopted a threshold of a constant SB in the net H and focused on extended features, the measurement of the EIGs would not largely affected by the change of S/N, either. For another test, we performed a visual inspection in PSF matched images and confirmed that the detected objects were unchanged. In the following analyses and figures, the PSF matched images were used unless otherwise noted.
2.5 Conversion of NB-R to H
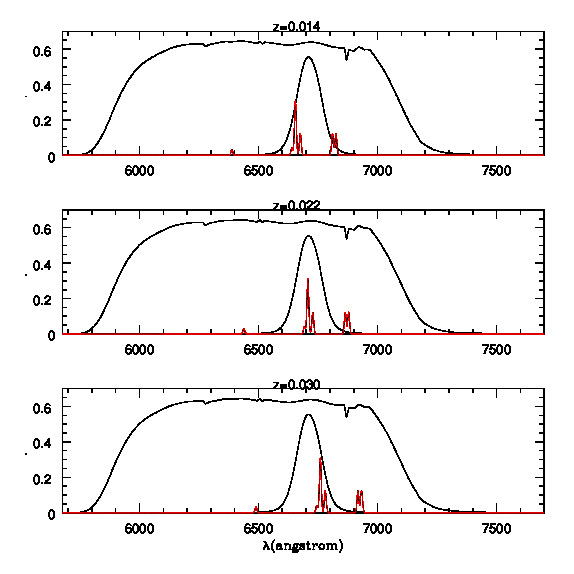
Pixel values (renormalized counts) in NB-R image are proportional to the H SB. We calculated pixel value that corresponds to H SB of s-1 cm-2 pixel-1 and converted the NB-R counts to the H SB. As the NB filter has a bell-shaped transmittance curve, the response to H emission is dependent on the redshift. In order to take the redshift effect into account, we construct a simple model spectral energy distribution (SED) for each cloud assuming its redshift and measure the model magnitude with the NB and R-band filters. The filter model includes CCD’s quantum efficiency, transmittance of the optics, and the atmospheric transmittance (Yagi et al., 2013a).
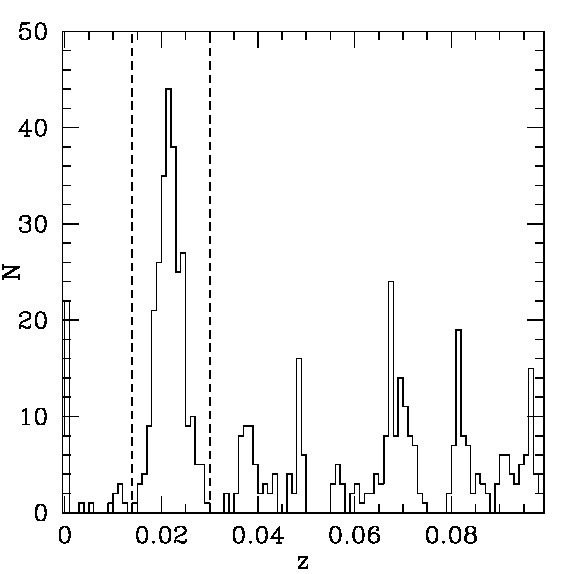
Figure 2 shows the redshift distribution of galaxies taken from SDSS DR12 spectroscopic catalog (Alam et al., 2012). The galaxies brighter than mag and within 1.5 degrees from the cluster center are counted. We adopted RA(J2000) = 11h44m36.s5, Dec(J2000)=+19∘45’32” for the cluster center (Piffaretti et al., 2011). Based on Figure 2, we defined the galaxies with z as the member galaxies of Abell 1367. From the distribution, standard deviation of the recession velocity is estimated as 815 km s-1. The maximum change of the transmittance of the NB filter for H line is about 0.6 mag (factor 0.6) in . The result of the H SB and flux in the following analyses may suffer 40% error if the redshift of the emission is uncertain.
Spectra of EIGs in previous studies (Yoshida et al., 2004; Yagi et al., 2007; Yoshida et al., 2012) show wide variety in [N II]/H ([N II]/H). The [N II]/H around BIG given by Cortese et al. (2006) also varies within [N II]/H. In this study, we adopted log([N II]/H) = , i.e. [N II]/H= 0.4, for model SED for the conversion. The systematic error by this [N II]/H uncertainty is 60%. Other emission lines in R-band, [S II] and [O I] are added in the R-band model magnitude assuming [S II]/H= and log([O I]/H) = , according to Yoshida et al. (2012). Possible contamination of [S II] in the NB-band in lower redshift is also taken into account. The transmittance and the model SEDs at different redshifts are shown in Figure 3.
We also estimated the oversubtraction of the H flux in the R-band using the model SED at each redshift. Because our continuum subtraction is not performed in magnitude but in the renormalized counts, the oversubtracted flux is proportional to the NB-R pixel value regardless of the H equivalent width. In the redshift range, the oversubtraction is 18–30%. It is comparable to the estimation in a z = 0.023 galaxy by Yoshida et al. (2016) (23%). The redshift dependence is shown as Figure 4. As expected from Figure 3, the pixel count in R-band is almost constant, while that in NB-band changes according to the redshift. The oversubtraction is corrected when converting NB-R counts to the H SB.
2.6 Error of H flux
We estimated the error of the H flux of EIGs in two steps. One is the uncertainty in NB-R count with a calibrated zero point, and the other is the uncertainty in the conversion of the NB-R count to the H flux.
The limiting surface brightness is shown in Table 1, which is a 1- fluctuation of the SB measured in an aperture of 2 arcsec diameter. The value includes the photon noise of the background sky, the readout noise, and errors in the data reduction. The effect of possible remnant of optical ghost is also included as an average value. As the adopted isophote in this study was comparable to or larger than the 1- fluctuation and the area of the object is much larger than that of 2 arcsec circle, the S/N of the isophotal flux is high. Even for the faintest object, the estimated relative error of the count is three percent.
The absolute calibration of NB and R-bands relies on the SDSS photometry and the color conversion models. The conversion may have 0.04 mag error in each band (Yagi et al., 2013a). The residual of continuum of overlapping objects (e.g., disk of the parent galaxy) may remain in the NB-R counts. In Yagi et al. (2010), the change of R-NB magnitude of continuum is about 0.15 mag peak-to-peak. It means that the error of NB-R count could be 10% of the rescaled R-band count. In the regions where the rescaled R-band count is comparable to or larger than the NB-R counts, this error is the dominant one. We summed the rescaled R-band count where the count is larger than NB-R counts, and used 10% of the sum as the estimated error of the NB-R counts. The errors given in Table 2 include the errors described above; the background variation, the zero-point uncertainty, and the possible continuum error, assuming that the three errors are independent.
In the conversion of the NB-R count to the H flux, various uncertainties exist, since we don’t have spectroscopic information of EIGs. As shown in Figure 3, the redshift should change the observed count in NB-band. Thus the error of the redshift can introduce an error in H flux. As mentioned in Section 2.5, the error is 40% if no parent galaxy is identified. Even if the redshift of the parent galaxy is known, the EIG may have a recession velocity different by several hundred km s-1 from the parent as in the Coma EIGs (Yoshida et al., 2012). If the offset is 300 km s-1, for example, it may introduce 10% error. In the conversion from NB-R to the H flux, we adopted a model SED with several assumptions in emission line ratios; [N II]/H, [S II]/H, and [O I]/H. The uncertainty of [N II]/H directly affects the conversion, which may introduce 40% error. The uncertainty of [S II]/H, and [O I]/H only affects the correction of the oversubtraction, which would be 10% at most.
3 Newly Detected Extended Ionized Gas clouds (EIGs)
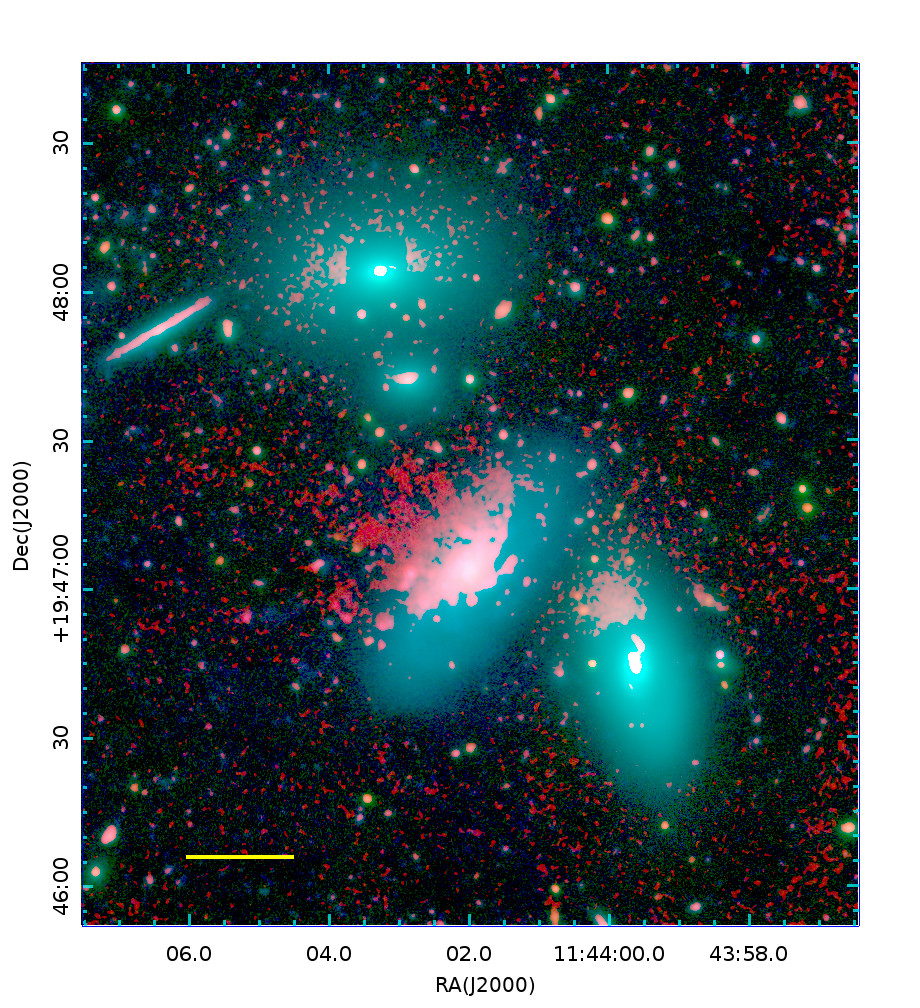
In Abell 1367, several EIGs were reported in the literature. CGCG 097-073 and CGCG 097-079 are well known with their prominent tails (e.g., Gavazzi & Jaffe, 1987; Gavazzi, 1989; Boselli et al., 1994; Gavazzi et al., 1995, 1998, 2001a; Scott et al., 2010). In Boselli & Gavazzi (2014), we showed a preliminary image from the data in this study. Their prominent tails were well recognized in Gavazzi et al. (2001a) as a whole. CGCG 097-087 (UGC 6697) is also the best-studied galaxies in Abell 1367 (e.g., Gavazzi & Jaffe, 1987; Gavazzi, 1989; Boselli et al., 1994; Gavazzi et al., 1995, 1998, 2001b; Scott et al., 2010). Gavazzi et al. (2001b) presented H image and spectra of the galaxy and a part of the tail with a detailed investigation. H distribution around BIG shows quite complicated morphology, and has been studied intensively (e.g., Iglesias-Páramo et al., 2002; Sakai et al., 2002; Gavazzi et al., 2003a). Cortese et al. (2006) investigated the detailed H structure around BIG.
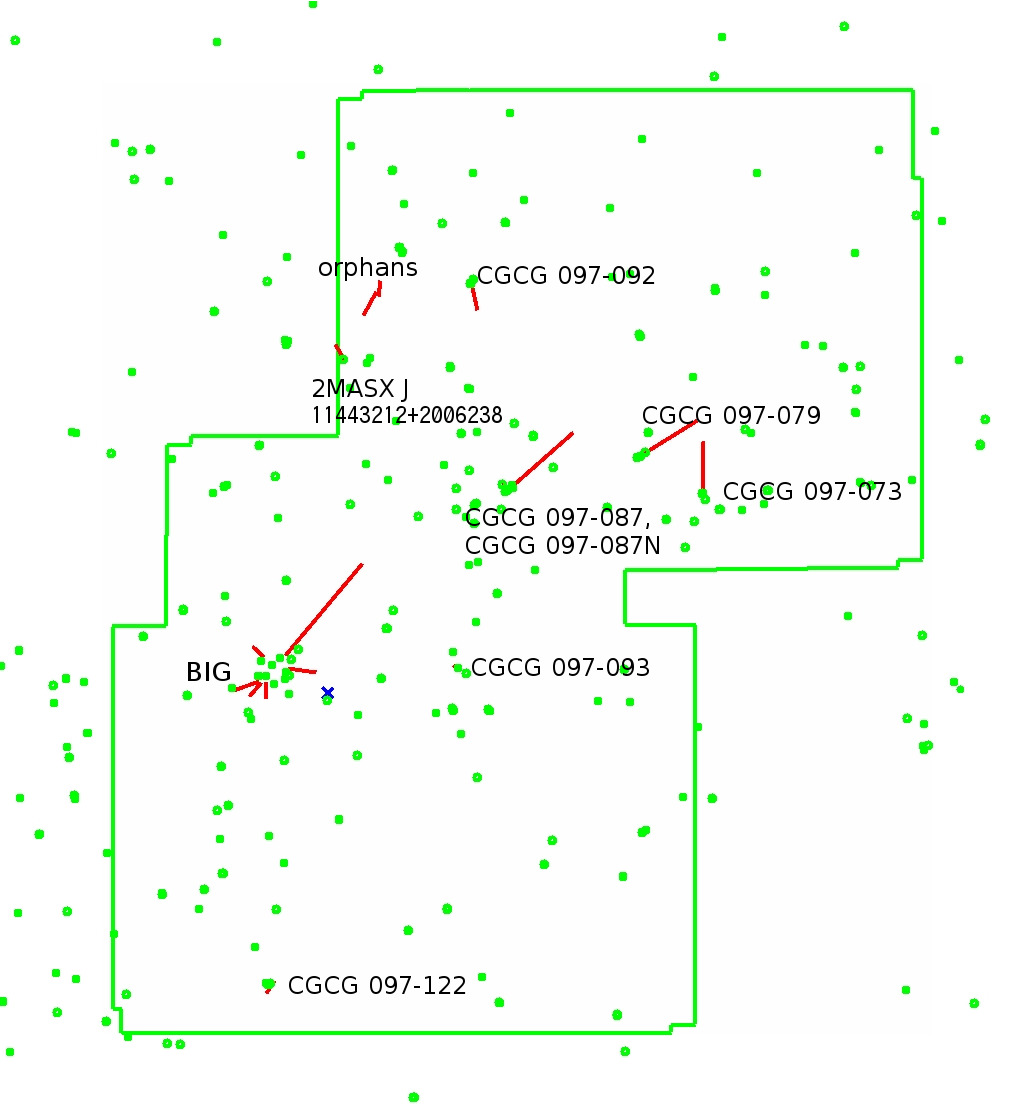
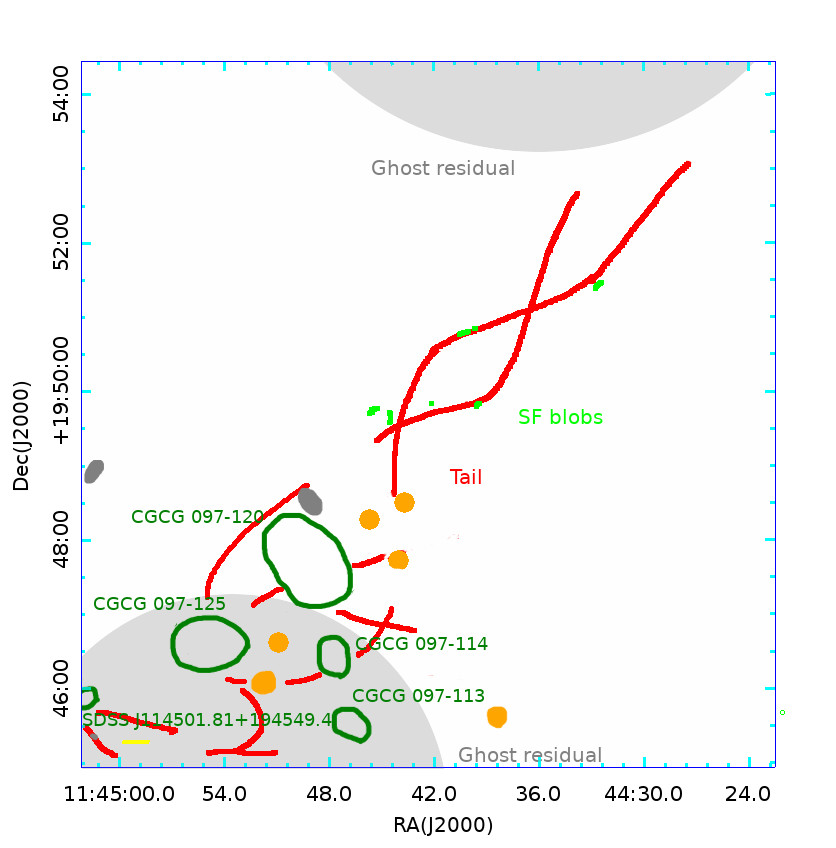
In addition to the well-studied EIGs, we found several new EIGs in Abell 1367 as given in Table 2. The distribution of the EIGs is shown in Figure 5. As most of the EIGs in this study have clear relation to a galaxy (parent galaxy) which would be the origin of the gas, the EIGs are named after their parent galaxy. The exceptions are the orphan clouds, and the clouds and the tail around BIG. The total mass of the ionized clouds is roughly estimated and given in Table 2. The detail of the mass estimation is given in Appendix.
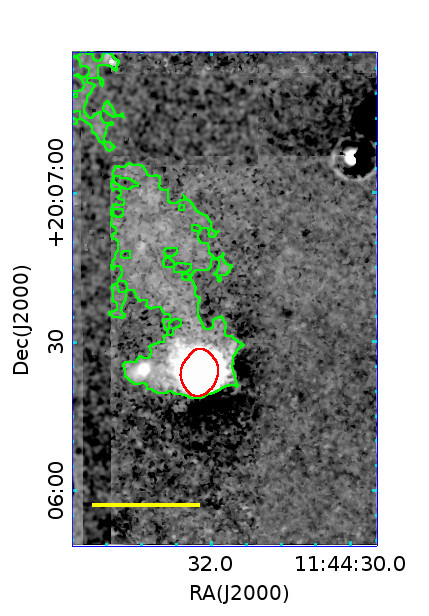
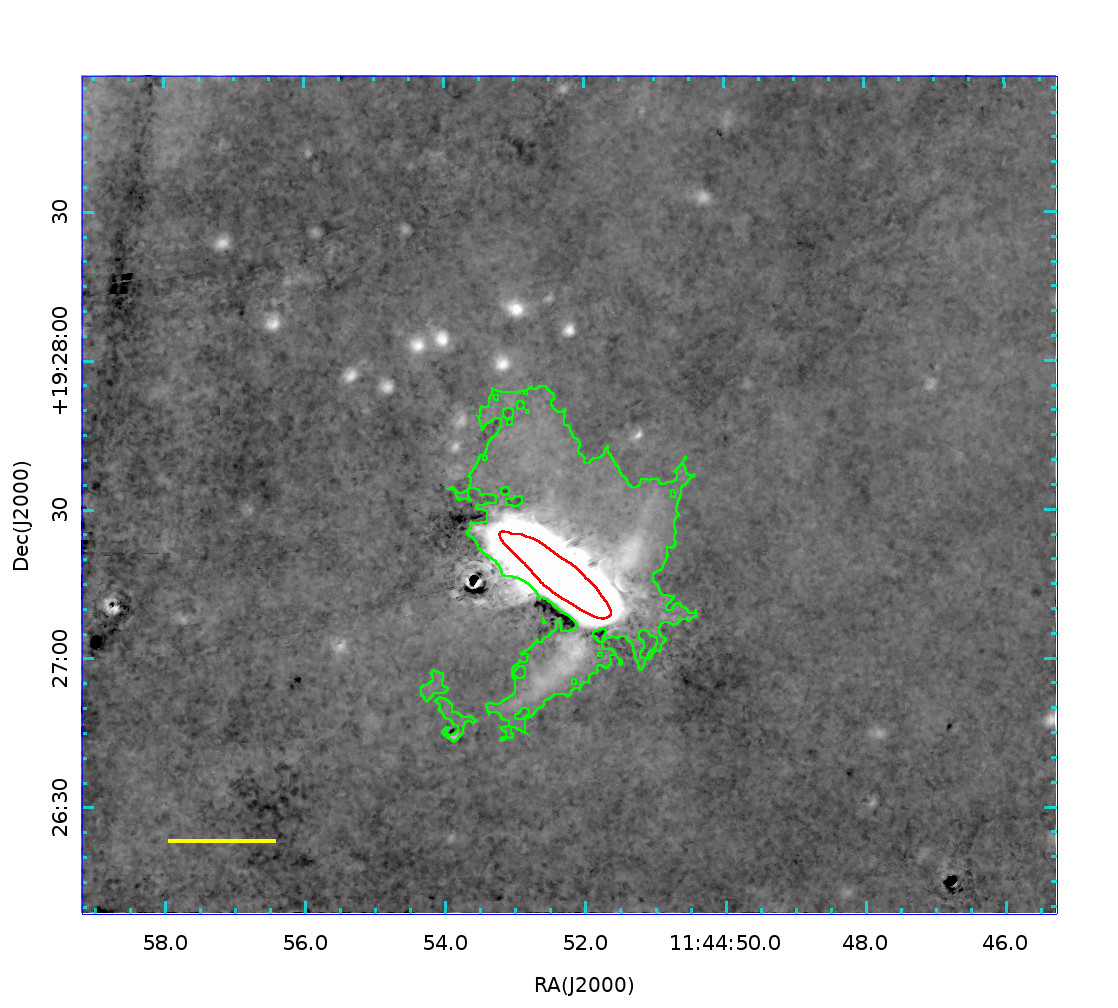
In following subsections, the new EIGs are shown from the north to the south. For each EIG, we present a B, i, and H composite before PSF matching, and H image after PSF matching. In the H image, the green contour represents H isophote of 2.5 10-18 erg s-1 cm-2 arcsec-2. The depth is adopted from the previous study in the Coma cluster (Yagi et al., 2010). To suppress the fluctuation around the isophote, we smoothed the image by a Gaussian with = 2.5 pixels before the measurement of the isophote. If the redshift of the parent galaxy was available, the redshift was used for the calculation of the isophote level. When it is not available, the cluster’s redshift, z = 0.0217, is used. In order to remove false detections of clump of noises, we used SExtractor and only sampled large clumps of H excess. We adopted DETECT_MINAREA = 500 pixels. Then remnant of noise clumps and debris of bright star subtraction are carefully removed by visual inspection of B, R, i and NB images. The flux and the mean H SB are measured inside the contour, and the extension and the bounding rectangle are measured based on the contour.
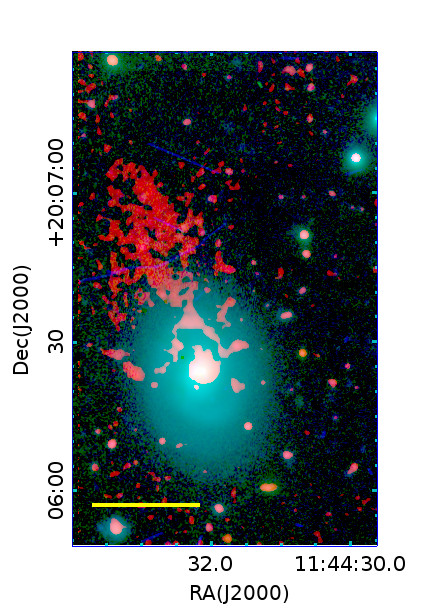
3.1 Orphan clouds
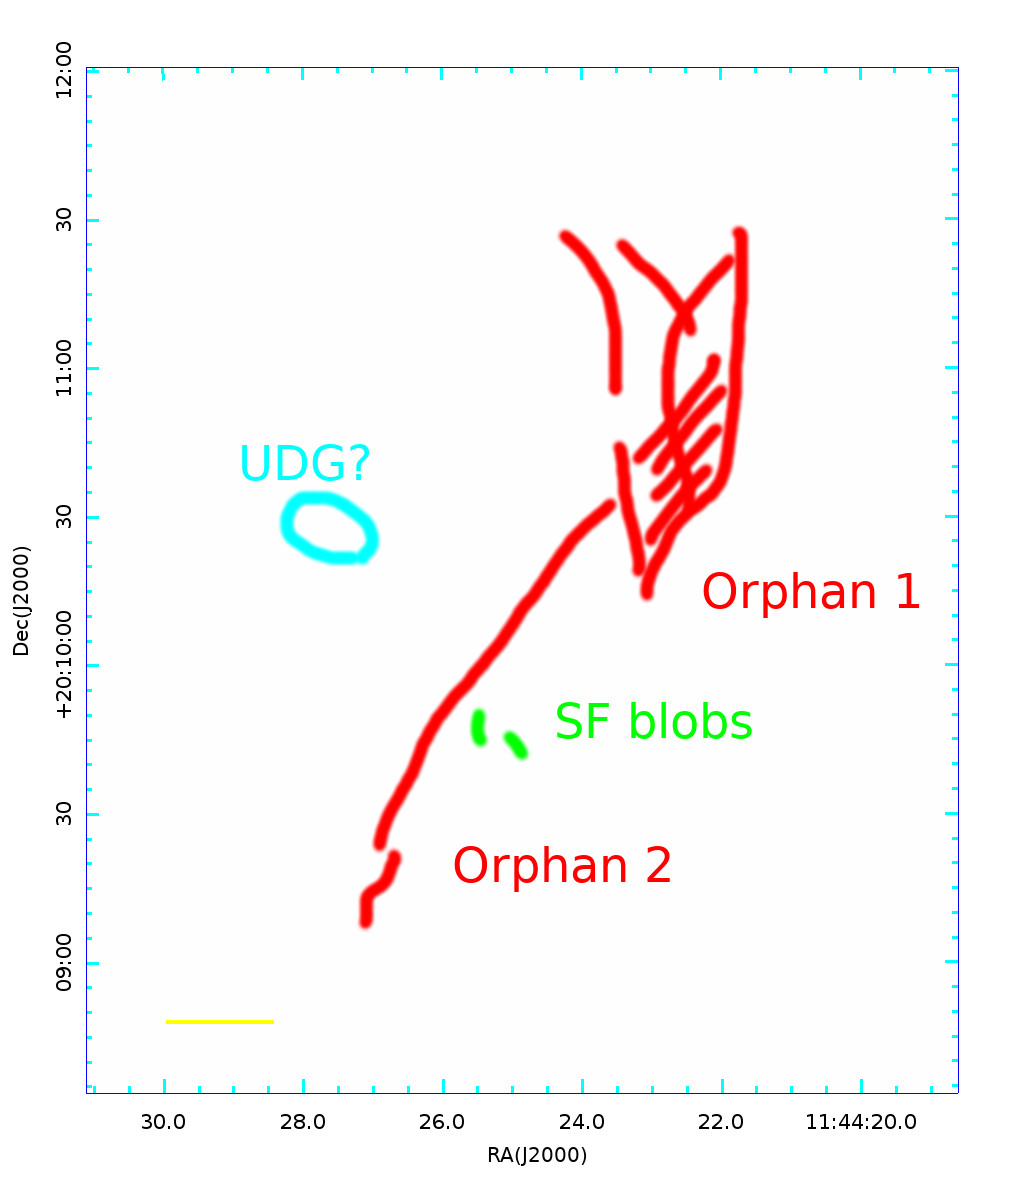
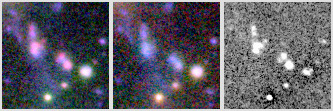
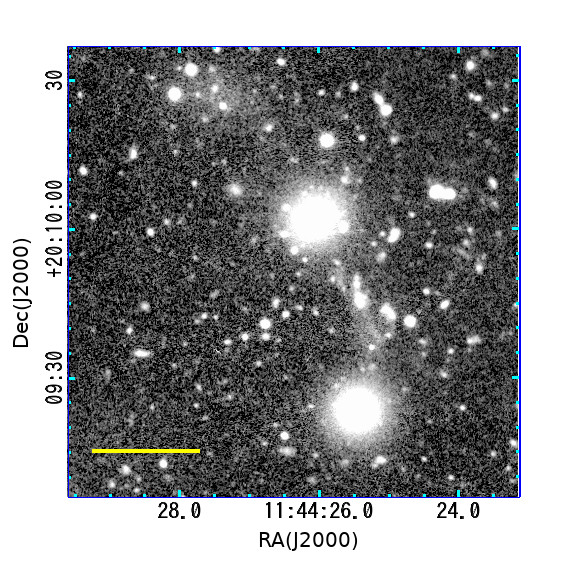
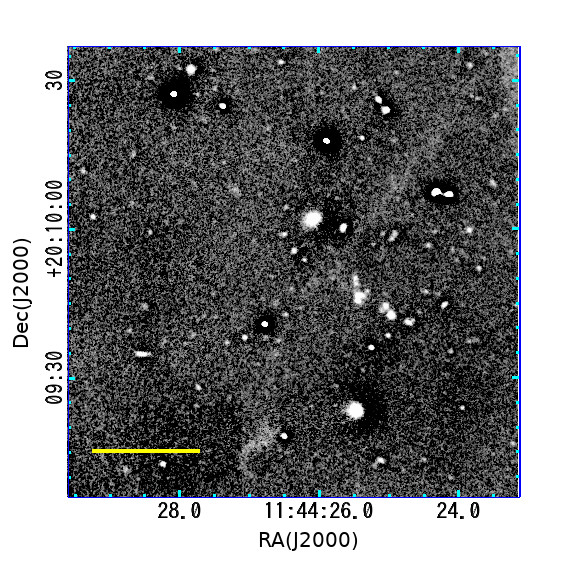
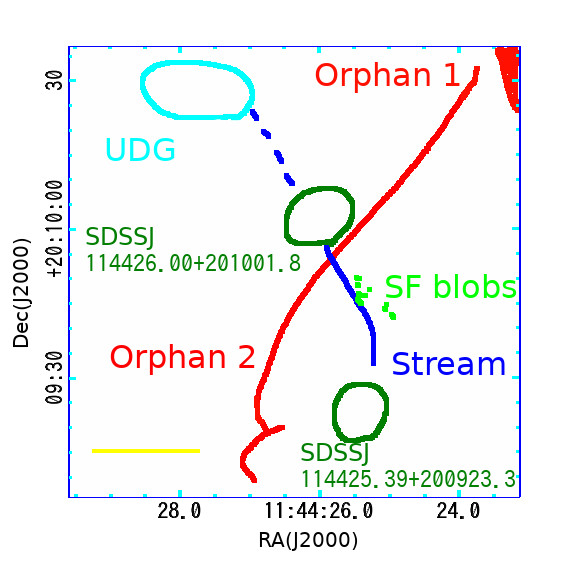
The “orphan clouds” appear to be floating in the intergalactic space (Figure 6).
If the clouds are in Abell 1367, the size of the north clump (orphan1) is 3320 kpc, and the south-east clump (orphan2) is 123 kpc. Though the isophote of 2.5 10-18 erg s-1 cm-2 arcsec-2 at z=0.0217 separates the two clouds, a faint filamentary cloud is connecting the clouds and possible star-forming(SF) blobs are found between the two as seen in the left panel. It is uncertain whether they are physically related to each other.
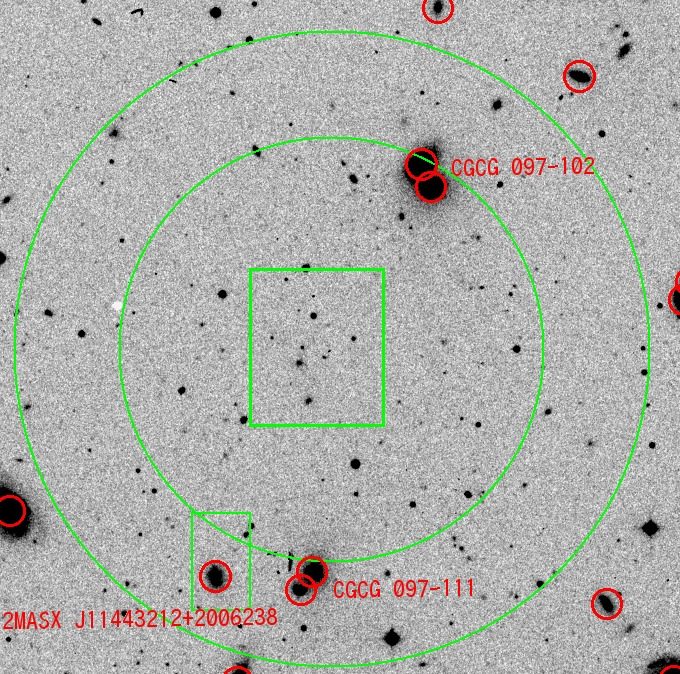
At least within 80 kpc, there are no possible parent galaxy candidates. The nearest giant (-17) galaxy is CGCG 097-102S whose projected distance is 80 kpc (Figure 7). Such parent-less clouds were not found in the Coma cluster (Yagi et al., 2010), or in Abell 851 (Yagi et al., 2015a). In Abell 1367, the tip of EIG of CGCG 097-083 is 170 kpc in the projected distance from the center of the parent galaxy. The tip however seems connected to the parent galaxy as a long tail.
There are several questions about the orphan clouds; the ionizing source and the origin of the gas. The ionizing source is a big problem for all EIGs. Possible mechanisms are a star-formation in situ, illumination of the young stars in the parent galaxy, illumination of AGN, inside shock heating, UV from ambient hot gas, etc. Since the orphan clouds are at least 80 kpc away from giant galaxies, a UV from parent galaxy disk is unlikely. A possible star formation around the cloud is seen in a part of the clouds. In Figure 6, H emission and blue continuum is recognized near orphan2, which is marked as SF blobs.
The region is also visible in Galaxy Evolution Explorer (GALEX) NUV image in the archive222http://galex.stsci.edu/GR6/. If the SF blobs are the ionizing source of the whole clouds, however, a gradient of H SB is expected. The SB should be bright near the region and fainter in distant regions. No such gradient is seen in the data, and thus the ionization by the SF blobs is unlikely. More details of the SF blobs are discussed in Section 5.2.
For examining the possibility of AGN illumination, we compared them with an example of a known AGN illuminated cloud, Hanny’s Voorwerp (Lintott et al., 2009; Keel et al., 2012) at z=0.050. Hanny’s Voorwerp is a famous extended ionizing cloud in a less crowded environment found in SDSS imaging data by the Galaxy Zoo project (Lintott et al., 2008). The ionizing source of Hanny’s Voorwerp was revealed to be AGN of the parent galaxy(IC 2497) 50 kpc away. The size of the Hanny’s Voorwerp (1833 kpc) is comparable to that of orphan1( kpc). Meanwhile, Hanny’s Voorwerp is much brighter than the orphan clouds. According to Table 2 of Lintott et al. (2009), the mean surface brightness of H+[N II] is erg s-1cm-2arcsec-2, which corresponds to 21.7 mag arcsec-2 in our NB-R image. The mean surface brightness of the orphan clouds is 26.6 mag arcsec-2, about 1/90 in flux. The nearest AGN from the orphan clouds is CGCG 097-121 at 180 kpc in Gavazzi et al. (2011), which is classified as a LINER. If the orphan clouds are also ionized by the AGN, the ionizing flux from the AGN would be weaker by an order or more than that at Hanny’s Voorwerp because of the distance. Added to that, if the ionizing flux of CGCG 097-121 is an order weaker than the source AGN of Hanny’s Voorwerp, the mean surface brightness of mag arcsec-2 of the orphan clouds could be reproduced. Thus the AGN illumination is one of promising scenarios. Shock heating and UV from the hot gas are also promising ionizing mechanisms.
The origin of the gas is another question. They would have been ejected from a galaxy, but the mechanism is unclear. It can be a ram-pressure stripping, a jet, a wind, a tidal interaction, etc. The clouds are away from their parent at least by 80 kpc, if their parent is a giant galaxy. Assuming that their speed to the parent galaxy is 1000 km s-1, they should have survived in the cluster environment for 70 Myrs. As no counterpart is found near the clouds in H I survey of Abell 1367 (Scott et al., 2010), it is rather unlikely that the orphan clouds are re-ionized portions of a long tail, such as the long tail of NGC 4388 in the Virgo cluster (Yoshida et al., 2002; Oosterloo & van Gorkom, 2005).
Another possibility is that the parent galaxy is a very faint dwarf. A possible ultra diffuse galaxy (UDG; e.g., van Dokkum et al., 2015a, b; Koda et al., 2015; Yagi et al., 2016) is detected near the possible star-forming region, and the elongation of the SF blobs seems to align to the galaxy. The galaxy is visible in Figure 6 bottom-left, but shows no H emission. At Abell 1367 distance, the R-band absolute magnitude of the galaxy is -14.5 mag and its effective radius is 4 kpc, measured by GALFIT (Peng et al., 2002, 2010).
If the redshift of the UDG is comparable to the SF blobs, the SF blobs may be associated to the galaxy, and it will be a hint to understand the formation of UDGs. Meanwhile, the shape of the whole orphan clouds is unlikely to have been stripped from the possible UDG. There are many other faint dwarfs whose redshift is unknown. Current data are insufficient to investigate more on the parent galaxy of the clouds.
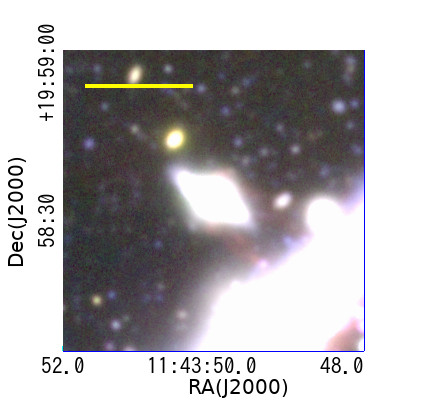
3.2 CGCG 097-092
CGCG 097-092 (Figure 8) shows a EIG of a cone-like appearance extended to 30 kpc. The parent galaxy does not show a sign of AGN (Gavazzi et al., 2011), while the spectrum of the center of the parent galaxy shows a starburst feature. The UV light from the starburst would be the source of the ionization. In Table 2, we also showed the property of the tail excluding the core region. The origin of the EIG could be a ram-pressure stripping or a superwind by the central starburst(Veilleux et al., 2005). The two will be distinguished if the recession velocity profile will be available in future. The velocity of EIG should be comparable to the parent near the galaxy if the ram-pressure is the mechanism, while the difference should be seen if a wind is the origin.
The direction of the tail is somehow “toward” the cluster center; the angle is about 30 degrees. The recession velocity of the parent galaxy has small difference from that of the cluster ( -40 km s-1). If ram-pressure stripping is the origin, it suggests that the parent galaxy moves away from the cluster center in the projected plane.
3.3 2MASX J11443212+2006238
The EIG of 2MASX J11443212+2006238 was detected at the very edge of our field 5. The EIG may have a much longer extension. In Figure 9, residuals of CCD chip edge pattern remain. The sharp cutoff on the left would be an artifact. Thus the size and total H flux are unreliable. Meanwhile, the S/N of the EIG is enough, and the mean SB is reliable.
SDSS spectrum of the parent galaxy shows clear H emission from the core, and Gavazzi et al. (2011) classified it as HII. Kriwattanawong et al. (2011) also reported H from the galaxy.
Interestingly, the parent galaxy is red, as shown in Section 4.2. We checked color in Consolandi et al. (2016) and confirmed that is also red (). In the NB-R image, the central 15” region shows an excess, which may be the remaining star formation, though the NB-R color is unreliable for H estimator in the galactic disk. In the disk, no obvious spiral pattern is recognized in H. In the H image, the southern half of the galaxy shows a sign of negative NB-R, while positive in the northern half. This morphology resembles IC 4040 in the Coma cluster (Yoshida et al., 2008) and implies that 2MASX J11443212+2006238 suffers strong ram-pressure stripping from the south direction. The red color and negative NB-R may be implying that this galaxy is partly in a transition phase from star-forming galaxy to post-starforming galaxy.
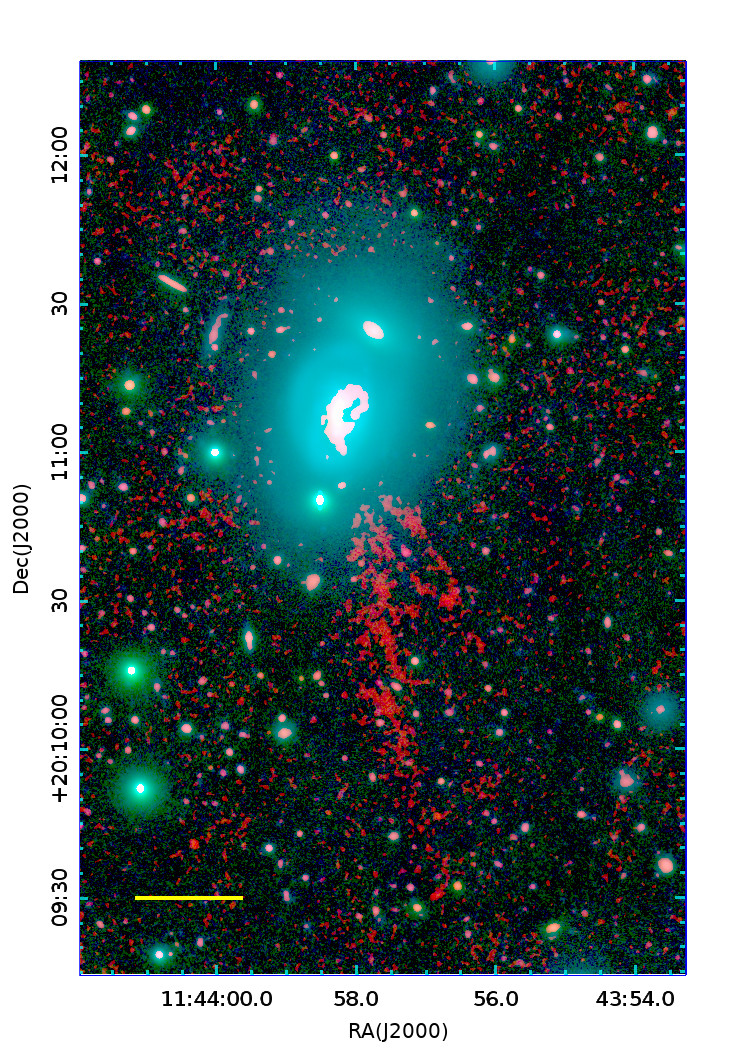
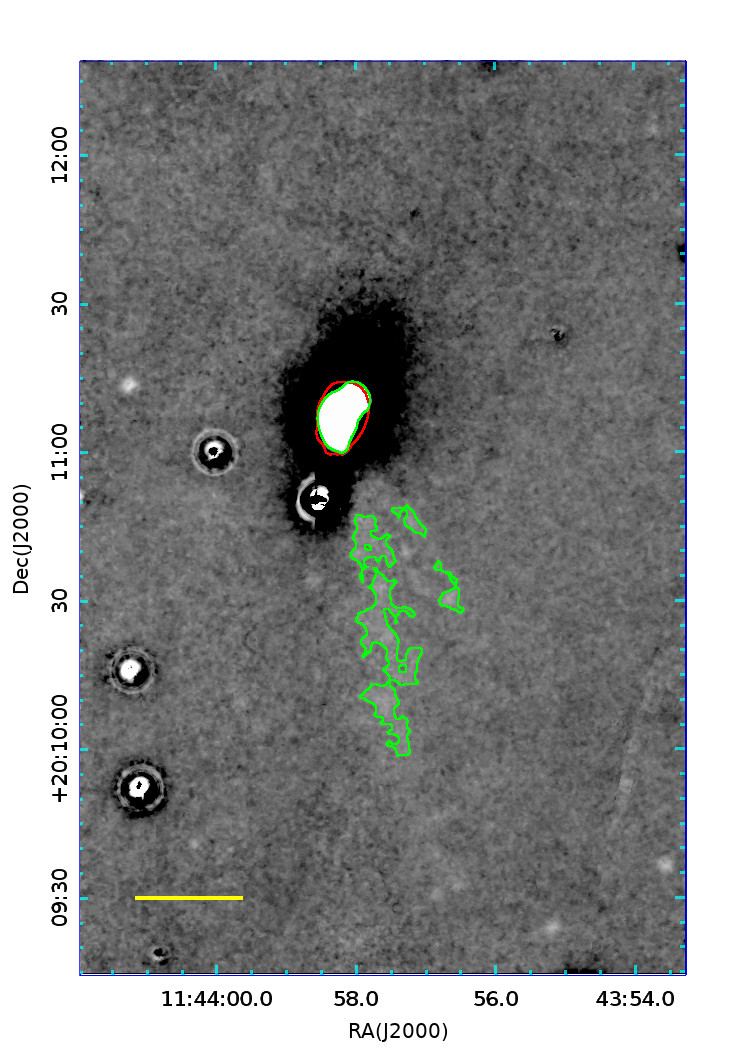
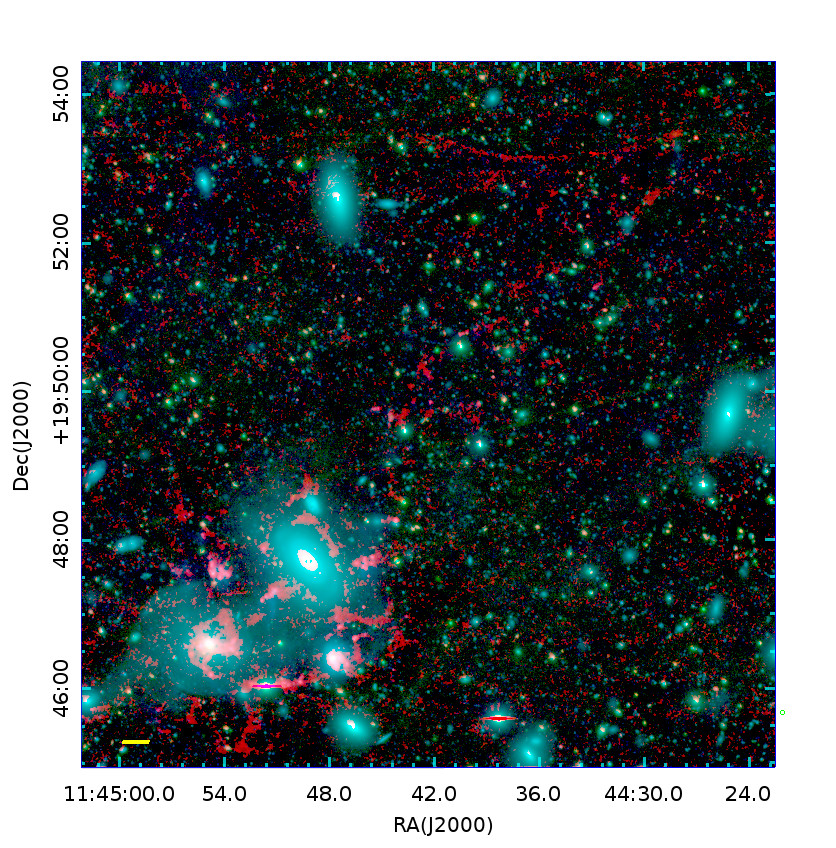
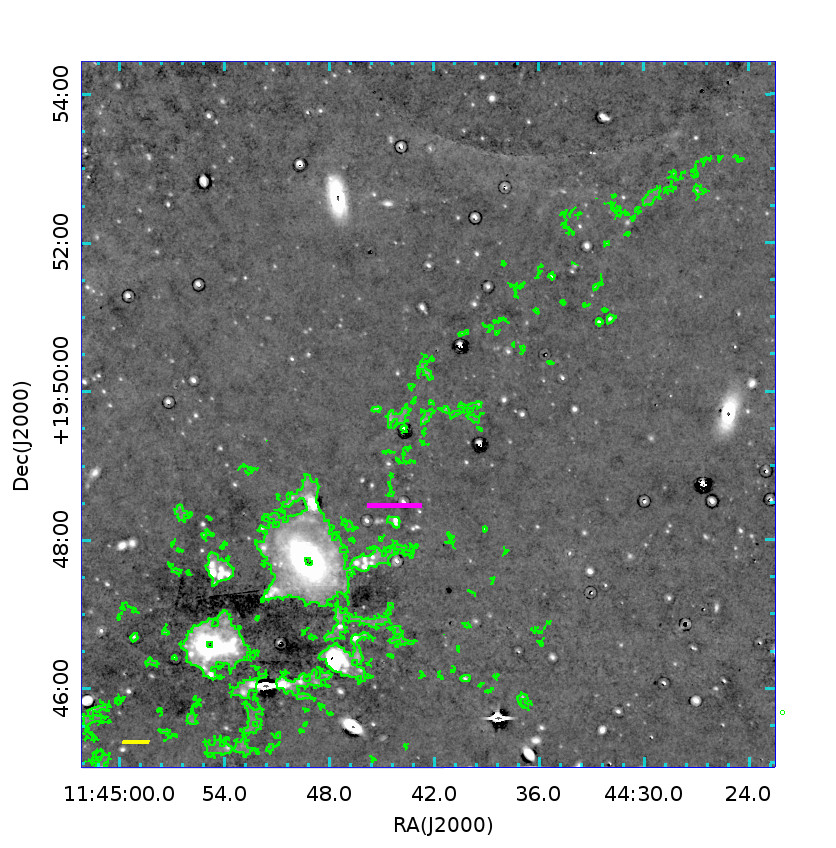
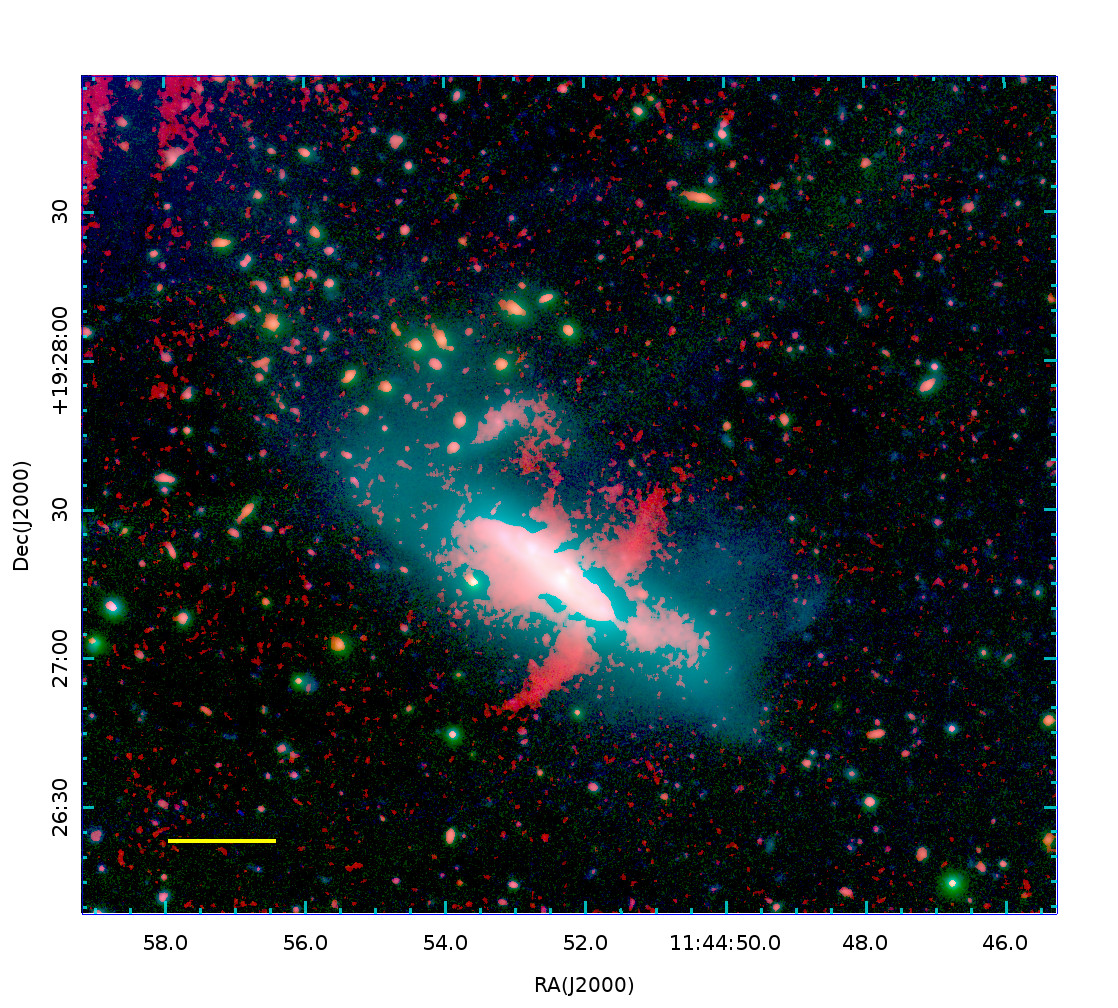
3.4 H tail from BIG
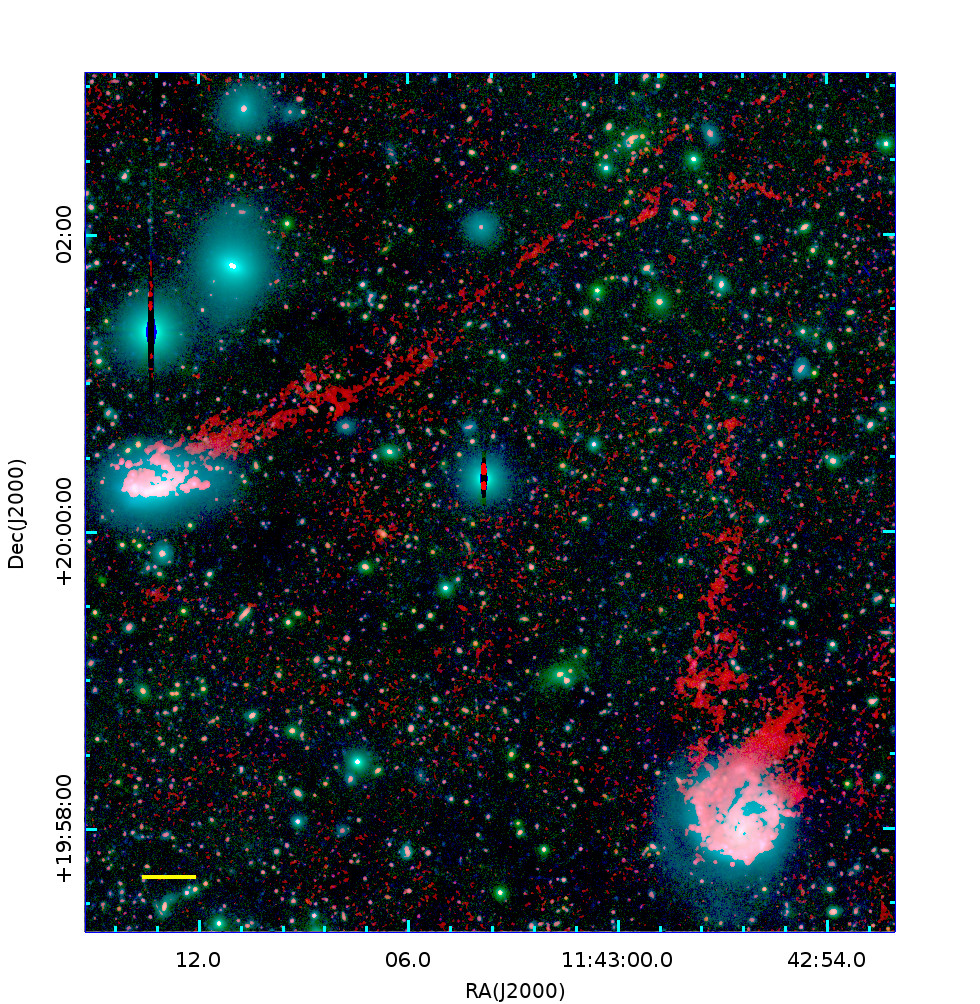
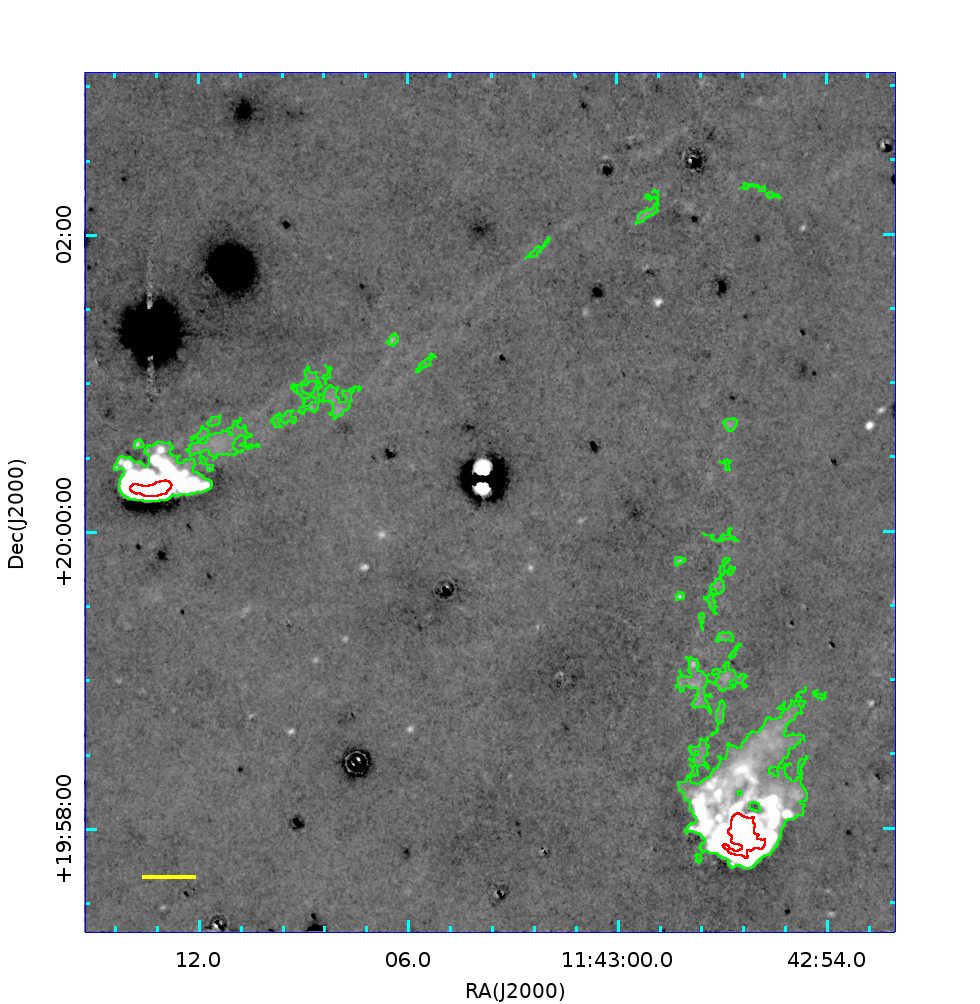
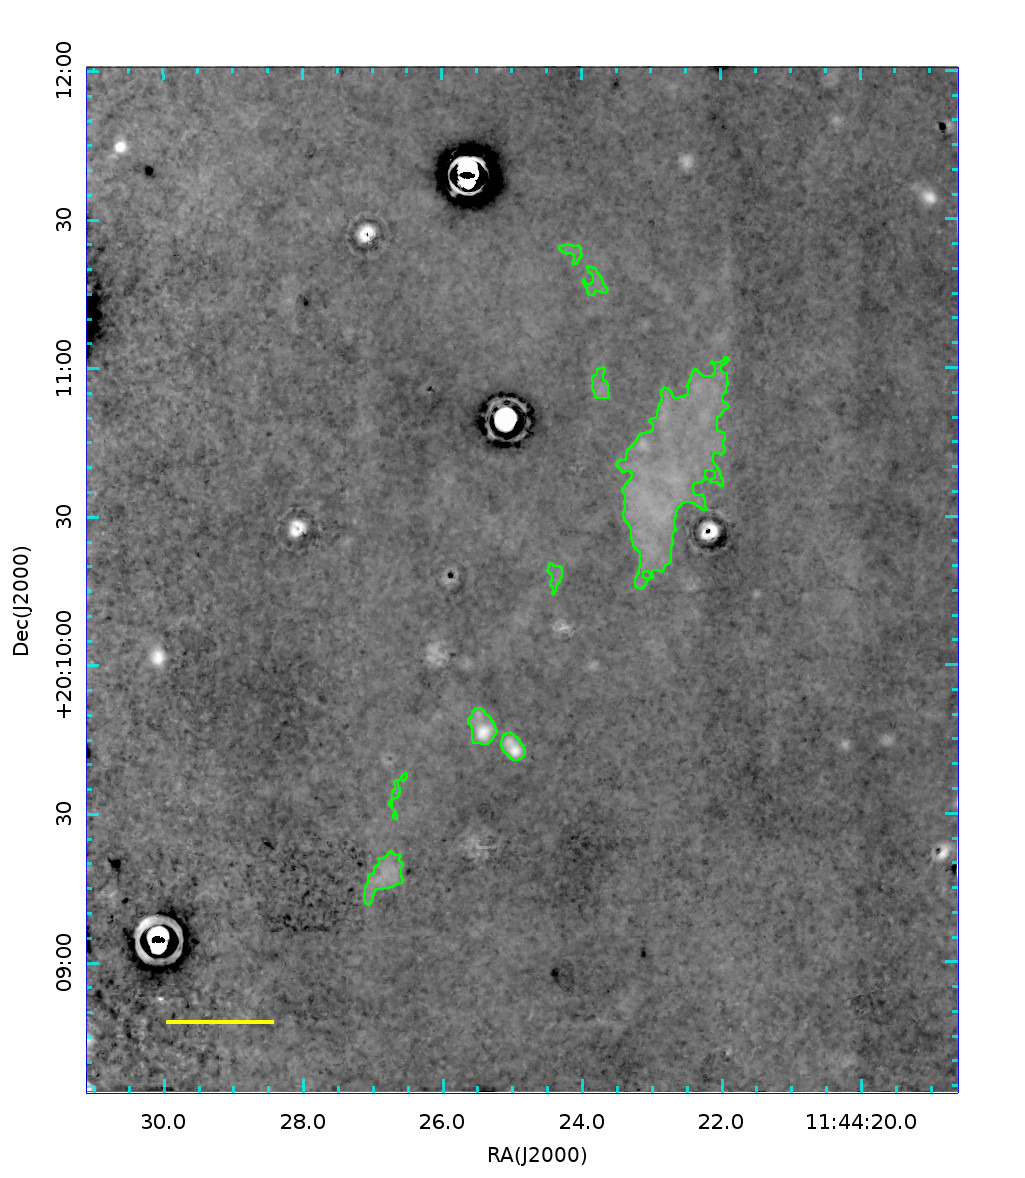
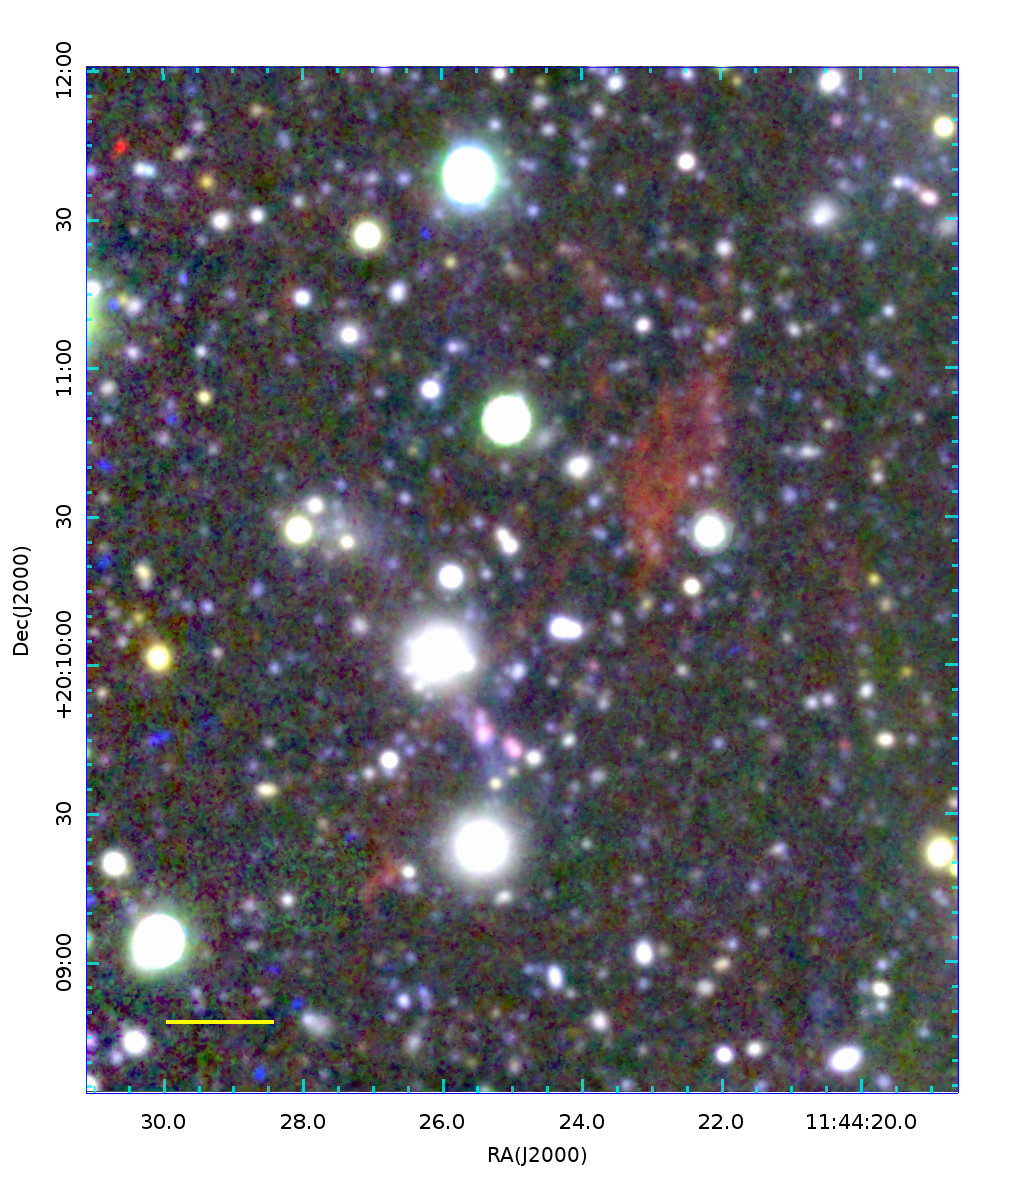
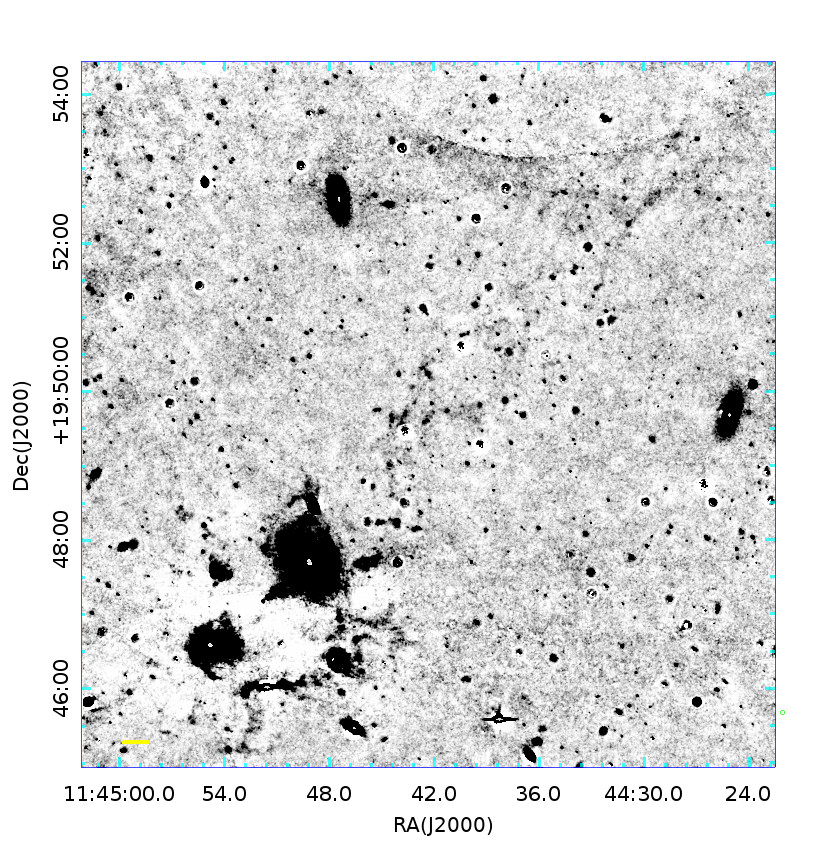
We found that the H tail from BIG continued about twice longer than reported by Cortese et al. (2006) reaching a projected distance of 330 kpc (Figure 10). The tail was called “NW” in Cortese et al. (2006).
In Table 2, two measurements are given. We first measured the whole H including BIG regions, Then, we set the north-west boundary of BIG as the knot named K1 in Gavazzi et al. (2003a) and Cortese et al. (2006), and measured the tail out of the boundary. Total H gas mass of BIG+tail is calculated to be , where is the volume filling factor. Excluding the H around BIG, the tail mass would be . The long tail implies that the group would have suffered the ram-pressure from the intra-cluster gas of Abell 1367 for several hundred Myrs, while the group have moved roughly straight toward the southeast.
The ionizing source of long H tail is a big mystery in EIGs (e.g., Yoshida et al., 2004; Cortese et al., 2006; Yagi et al., 2007; Kenney et al., 2008). Boselli et al. (2016) discussed that the ionizing mechanism of 80 kpc long tail of NGC 4569 in the Virgo cluster could be shocks, MHD waves, or heat conduction. The discovery of the 330 kpc-long H tail of BIG sets constraints on possible models. In B, R, and NB composite image, we detected several SF blob candidates. The zoomed-up images are shown in Figure 11. All of them have counterparts in GALEX NUV data. Though they may ionize some gas around, they are insufficient to ionize the distant part of the tail. The details of the SF blobs are investigated later in Section 5.2.
As seen in Figure 10, the tail of BIG shows a sign of winding with 40 kpc width. An idea to explain the morphology is that the winding results from the internal motion of the galaxy in the group. Though merger and interactions among the members of BIG is suggested (Cortese et al., 2006), here we calculate a simple model. Assuming that a typical velocity of group member galaxies around the center of the group is 200 km s-1 (Gavazzi et al., 2003a), the crossing time of 40 kpc would be 200 Myr. In the H image, one or two possible periods are barely recognized in the tail. The projected length of 330 kpc tail might have been formed in 400–800 Myr, and the tangential velocity of BIG would be 400–800 km s-1. As a result, the H tails form helices, and we see them as winding shapes by projection. This speculation can be examined by measuring the velocity profile of the tail along the winding by future spectroscopic observations.
3.5 CGCG 097-093
CGCG 097-093 (Figure 12) shows a morphology like jellyfish galaxies (e.g., Cortese et al., 2007; Smith et al., 2010; Ebeling et al., 2014; Poggianti et al., 2016). Enhancement of faint blue stars and H emission are seen to the northeast. Inside of the disk, an asymmetry of spiral arms is recognized, which may be a sign of a recent tidal interaction. The recession velocity of CGCG 097-093 is 7298 km s-1. Its south-west neighbor, CGCG 097-088 is 5616 km s-1, and north neighbor CGCG 097-094 is 7998 km s-1. If the H ejection is affected by interaction with the neighbor, it would be with CGCG 097-094.
Meanwhile the morphology in H suggests ram-pressure origin, as the galaxy-wide gas flow would be difficult to be made by a tidal interaction only. Though the asymmetric stellar distribution suggests a tidal interaction, some ram-pressure stripped galaxies also show the asymmetry (Abramson & Kenney, 2014; Jachym et al., 2014). Vollmer (2003) suggested a mixture of a tidal interaction and a ram pressure for NGC 4656 in the Virgo cluster which shows an extended gas tail and an asymmetric stellar distribution.
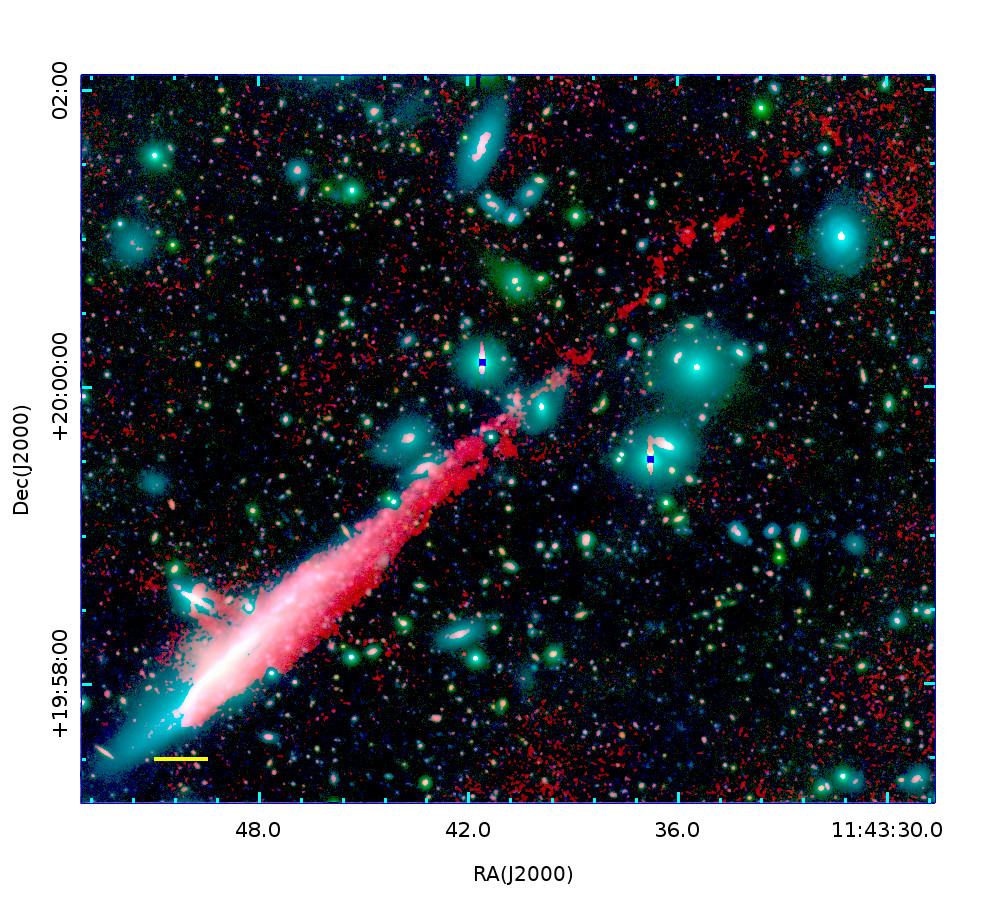
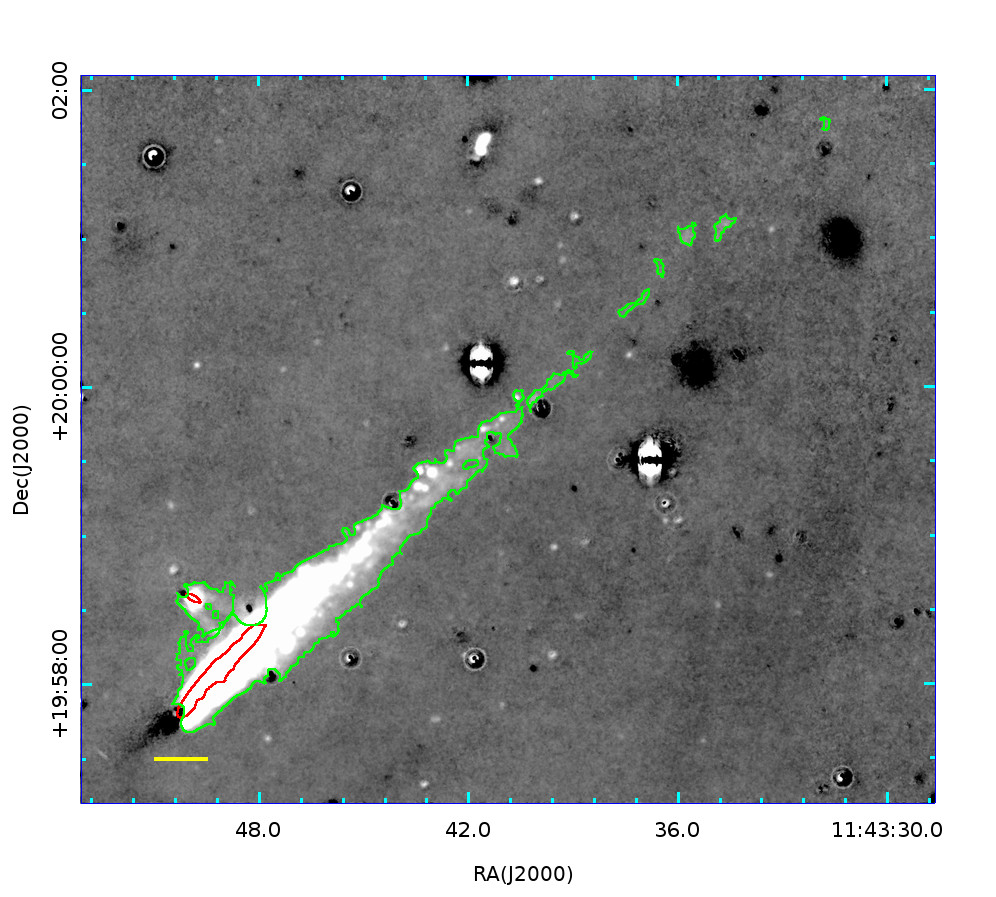
3.6 CGCG 097-122
CGCG 097-122 (NGC 3859) looks like an edge-on spiral galaxy with a distorted faint halo which was revealed by our deep imaging (Figures 13). The halo is elongated toward the northeast almost along the major axis of the galaxy. At the southwest side of the galaxy, the halo is extended to the projected distance of 10 kpc above the galaxy disk. At the north of the galaxy, a small galaxy which is possibly an interacting dwarf companion is seen. A part of the extended halo may be formed by the interaction between this companion and CGCG 097-122.
The bright disk H emission together with the very blue color of the galaxy and the emission line dominated nuclear spectrum indicate that the star formation of this galaxy is very active. Its nuclear spectrum is typical of starburst galaxies (Gavazzi et al., 2013) and has no sign of AGN activity (Gavazzi et al., 2011). The total H+[N II]flux of CGCG 097-122 is erg s-1 cm-2 (Gavazzi et al., 2006), and [N II]/H= 0.36 (Gavazzi et al., 2013). The H luminosity is calculated to be erg s-1, which is slightly larger than the typical value of the H luminosity of nearby starburst galaxies (– erg s-1; e.g., Strickland et al., 2004).
The morphology of the H emission is peculiar (Figures 13). It is characterized by its two narrow spurs whose widths are 2 kpc extended 10 kpc to the northwest and the southeast from the galaxy disk, and strong disk H emission. The spurs look like two wings of a flying bird. The north part of the H nebula of CGCG 097-122 seems to be flowing toward the northeast. In addition, the two spurs also are bending to the same direction. These morphological characteristics suggest that the hot gas of the galaxy is pushed by the ram pressure from the southwest. However, in contrast to the extended nebulae seen around other galaxies in this study, there is no clear indication of one-sided elongation of the ionized gas. There is no sharp cutoff at the southwest edge of the H nebula, and no extended part of H out of the galaxy at the northeast, but rather shows an extension toward east-southeast. In addition, the northern faint flowing part of the nebular continuum is overlapped by the dwarf companion mentioned above suggesting that this part of the nebula could be formed by a galaxy-galaxy interaction rather than ram pressure. Therefore, the ram pressure stripping may not be strong enough to create the overall structure of the EIG around CGCG 097-122, though it possibly affects the slight bending of the spurs and the positional offset between the bright part of the H and the stellar continuum.
The two narrow spurs would be parts of a bipolar bubble driven by the nuclear starburst. It is well known that active star formation drives a large-scale outflow from the star-forming region; a starburst superwind (Veilleux et al., 2005). In its early phase, the outflow forms a large bubble of ionized gas, a superbubble, then the bubble is broken due to a continuous energy input from the starburst (e.g., Strickland & Stevens, 2000). The morphology and size of the spurs resemble broken superbubbles observed in nearby starburst galaxies such as NGC 253 (Strickland et al., 2002), NGC 1482 (Hoopes et al., 1999), and NGC 3628 (Fabbiano et al., 1990). Sometimes the superbubble or the superwind has an antisymmetric morphology in the ionized gas emission; one side of the bubble is much brighter than the other side. For example, the superwind of NGC 3628 is seen as a long plume from the galaxy disk (Fabbiano et al., 1990). The large-scale faint H nebula of NGC 253 is characterized by the 9 kpc long bidirectional plumes extending from the disk (Strickland et al., 2002). The morphology and size of the two spurs of CGCG 097-122 are quite similar to these features, suggesting that the spurs are originate in a starburst superbubble/superwind.
4 Results
We compared the EIGs and their parents with those in the Coma cluster (Yagi et al., 2010). The redshifts of Abell 1367 and the Coma cluster are almost the same; z=0.0217 and 0.0225, and the two data were obtained with the filter sets, the instrument and the telescope, and analyzed in the same way. Regarding the data quality, the 1 of the SB in a 2 arcsec aperture in NB and R bands in our previous study in the Coma were 27.5(NB) and 28.1(R) mag arcsec-2(Yagi et al., 2010), while they were 27.7(NB) and 27.9(R) mag arcsec-2 in Abell 1367 in this study, respectively. The difference of S/N in NB-R image is about six percent. The small difference is negligible compared with other factors. The projected survey area was 1.2 Mpc2(Coma) and 1.7 Mpc2(Abell 1367), respectively.
In this section, we give several results from the comparison of EIGs and their parents in Abell 1367 and in the Coma. Interpretation of the result is given later in Section 5.1.
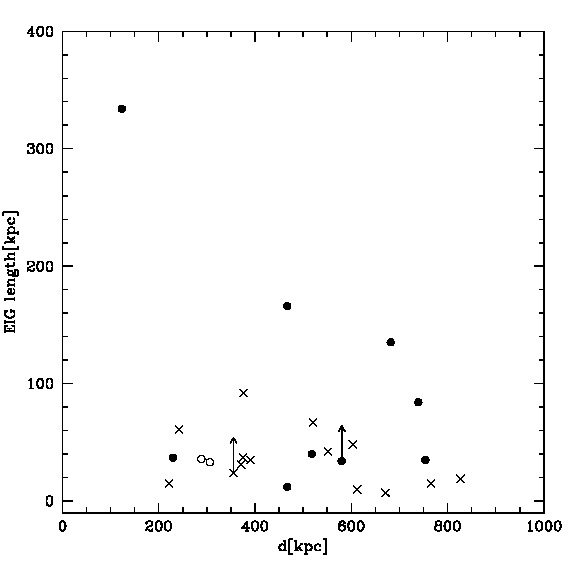
4.1 EIG length
We found that EIGs in Abell 1367 are typically longer than those in the Coma. In Figure 14, the cluster-centric projected distance versus the long side of the bounding box of EIGs in both clusters are plotted. It does not mean that the EIG is continuously extended to the length. The length rather approximates the distance of the tip of EIG from the parent. As the virial radius of the Coma is larger than that of Abell 1367, the difference gets larger if we normalize it by the cluster virial radius. In Figure 14, the longest one is the tail of BIG. The parents of other long (50 kpc) EIGs are three bright spirals, CGCG 097-073, 097-079, and 097-087 in Abell 1367, and GMP2559(IC4040), GMP4060(RB199) and GMP2910(D100) in the Coma. All of them are thought to be made by ram-pressure stripping (Gavazzi et al., 2001a, b; Yagi et al., 2007; Yoshida et al., 2008, 2012). Among them, two in the Coma, GMP4060 and GMP2910, show a post-starburst signature.
4.2 Color of parent galaxies and EIG parent fraction
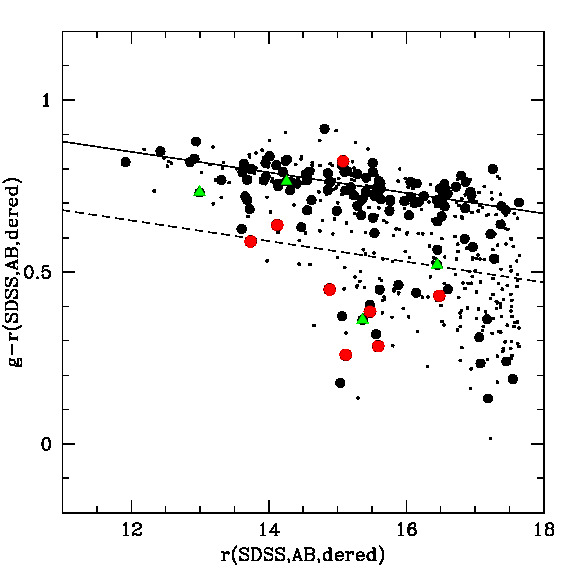
For investigating the color of parent galaxies, we first used SDSS DR12 spectroscopic catalog for the member selection of Abell 1367. Selection criteria were z, mag, and in the region where our observation covered. We refer to the list as an “unbiased member list.” Though the spectroscopic target selection of SDSS is not complete, it is expected to be unbiased. Next, the galaxies in SDSS DR12 photometric catalog whose spectroscopic information is not available in SDSS DR12 were cross-identified with other spectroscopic catalogs (Iglesias-Páramo et al., 2002; Gavazzi et al., 2003a; Cortese et al., 2003, 2004, 2008; Smith et al., 2004; Kriwattanawong et al., 2011), and added if their redshift satisfied z and mag. We used our Suprime-Cam data for visual inspection of the cross-identification, and thus only the galaxies in our observed field are added. Though the completeness is higher in the list, the sampling is heterogeneous. We refer to the sample as an “extended member list.” The color magnitude diagram (CMD) of the member galaxies is shown as Figure 15 using the extended member list. The AB magnitude offset adopted by K-correct (Blanton & Roweis, 2007) v4; = 0.012(g) and 0.010(r), and the Galactic extinction correction ( = 0.076 and = 0.053) are applied. The color magnitude relation (CMR) of early type members of Abell 1367 is
| (1) |
which is obtained from fitting to the data. If we classify the galaxies into red/blue at 0.2 mag redder than the CMR (broken line in Figure 15), six parents are blue and two (2MASX J11443212+2006238 and CGCG 097-122) are red. Regarding the BIG members, CGCG 097-114 is blue, while CGCG 097-120 and CGCG 097-125 are red. SDSS J114501.81+194549.4 is marginally (by 0.01 mag) red.
The number of members and EIGs are given in Table 5. For statistical test, we didn’t count CGCG 097-087N, as it isn’t in the unbiased member list. The CMR and color threshold of the Coma is taken from Yagi et al. (2010), and the unbiased member list of the Coma is constructed from SDSS DR12 applying criteria that z, mag, and in the region where the observation covered.
Because the population size is very small, most of the differences are within statistical error. Only the blue member fraction of Abell 1367 is significantly higher than that of Coma. The whole EIG parent fraction is six percent in the Coma and nine percent in Abell 1367. The difference is marginal (, upper).
4.3 Distribution in velocity-distance plane
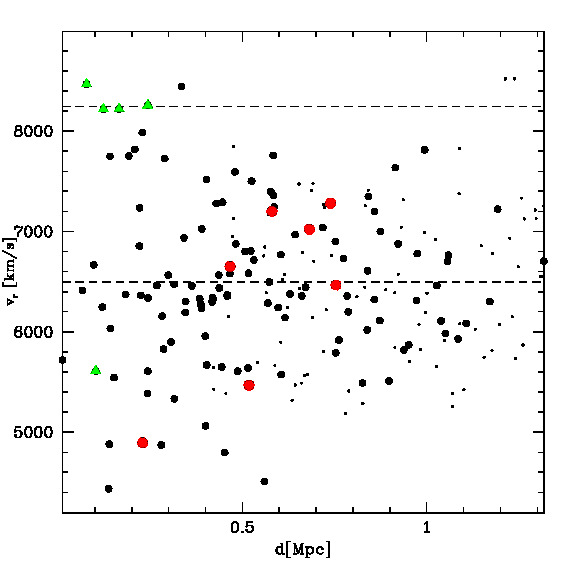
Figure 16 shows the distribution of galaxies in the projected distance from the cluster center versus the recession velocity plane. The galaxies with a spectroscopic redshift by SDSS are plotted. Many of the parents have a large difference from the cluster’s recession velocity. This trend is similar to that in the Coma cluster (Yagi et al., 2010).
The two parents near the cluster’s velocity are CGCG 097-087 and CGCG 097-092. As the tail of CGCG 097-087 points opposite to the direction to the cluster center (Figure 5), it is natural to think that CGCG 097-087 would be entering the cluster directly to the center on the tangential plane. Meanwhile, the tail of 097-092 shows no alignment toward the cluster center (Figure 5).
4.4 Morphology of the Cloud-Parent Connection
As in Yagi et al. (2010), the EIGs of Abell 1367 are classified into three types; (1) connected H clouds with a disk-wide star formation in the parent, (2) connected H clouds without a disk-wide star formation in the parent, and (3) detached H clouds. Type-1 includes CGCG 097-073, CGCG 097-079, CGCG 097-087, CGCG 097-087N, CGCG 097-093, CGCG 097-122, and three BIG galaxies (CGCG 097-120, CGCG 097-114, and CGCG 097-125). Type-2 includes 2MASX J11443212+2006238. Though star formation partly remains in the galaxy, it resembles GMP3779 and GMP3896 in Yagi et al. (2010), which were classified as type-2. Type-3 includes CGCG 097-092, SDSS J114501.81+194549.4, and the orphan clouds. The type classification is given in Tables 2 and 3.
In the Coma cluster, the number of each type was 4 (Type 1), 4 (Type 2), and 6 (Type 3). In Abell 1367, the fraction of Type 1 is larger and Types 2 and 3 are smaller. In the Coma cluster, four faint blue parents with detached clouds (Type 3) are found, and they show post-starburst spectrum. In Abell 1367, there are fewer post-starburst parents. Only SDSS J114501.81+194549.4 in BIG shows a sign of post-starburst signature, whose color is barely red (0.01 mag redder than the demarcation line).
5 Discussion
5.1 The difference in EIGs and parents in Abell 1367 and in Coma
Though many statistical properties of EIGs and their parents are similar in Abell 1367 and the Coma, there are several differences. In Abell 1367 the EIGs are longer, and tend to be connected to parents. The EIG parents in Abell 1367 have more star formation in the disk, and post-starburst ones are fewer. The fraction of EIG parents and blue galaxies is higher in Abell 1367.
Under the assumption that the EIG-parents connection would evolve from Type 1 to Type 3, the larger number of Type 1 in Abell 1367 and fewer Type 3 suggest that the EIGs and parents in Abell 1367 is in an earlier stage of the evolution on average. Most of EIG parents are thought to be galaxies which infell into the clusters. The gas in the galaxy will be lost due to certain processes, while part of the gas may form an EIG. After some time, the star formation in the galaxy will cease, and the color of the galaxy will eventually become redder. The larger fraction of blue galaxies in Abell 1367 suggests that not only the EIG parents but also other galaxies are still unprocessed. As the dominant mechanism of the gas removal in cluster environment is thought to be a ram-pressure stripping (e.g., Boselli et al., 2016), it is natural that that the evolution is slower in Abell 1367. From the X-ray observation by ASCA (Fukazawa et al., 2004), the central gas density of Abell 1367 is about 1/5 of that of the Coma, the mass is about 1/14, and the core radius is 30% larger. Thus the ram pressure, which is proportional to the density and the square of the velocity, should be weaker in Abell 1367. The smaller number of parents with post-starburst signature in Abell 1367 is also explained by the lower efficiency of the ram-pressure stripping.
The longer length of EIGs in Abell 1367 requires another explanation. The length of EIGs shows the distribution of the ejected gas from the parents and/or the reach of the ionization photons. If the ionization mechanism is something that is spatially restricted, such as an UV from the young stars of the parent galaxy or inside of EIG, or AGN, the EIG length would be determined by the range of the flux. If it is the case, however, a gradient of SB according to the distance from the UV source is expected, which is not observed in the EIGs in Abell 1367 and in the Coma. Therefore the length would mainly represent the distribution of the ionized gas. According to GOLDMine (Gavazzi et al., 2003b), the parent galaxies of a long EIG in Abell 1367 have a stellar mass comparable to those in the Coma. Thus the original gas before stripping would have been comparable, too. We present two possible explanations on the longer distribution of the ionized gas in Abell 1367. One is that the removal of the gas is relatively slower and longer lasting in Abell 1367, because of the low efficiency of the ram-pressure stripping. Another possibility is that the short length of EIGs in the Coma does not mean the short duration of the gas removal, but the distant part of the gas was heated up and got invisible in H(Tonnesen & Bryan, 2010; Tonnesen et al., 2011). The length reflects the survival time scale of the ionized gas in the cluster. Though the uncertainty is large, the estimated masses of the ionized gas of EIGs in Abell 1367 are larger than those in the Coma by about an order, while the difference in the length of EIGs is about twice. The mean surface brightness in H is also brighter in EIGs in Abell 1367. These results suggest that the slow heating scenario would be more likely.
5.2 Star-forming Blobs in or near EIGs
There are several studies on star formation in stripped tail; inside BIG (Gavazzi et al., 2003a), and galaxies in other clusters (e.g. Sun et al., 2007, 2010; Cortese et al., 2007; Yoshida et al., 2008; Hester et al., 2010; Yoshida et al., 2012; Yagi et al., 2013b; Kenney et al., 2014). Results from simulations are also reported (e.g., Kronberger et al., 2008; Kapferer et al., 2008, 2009; Tonnesen & Bryan, 2010; Tonnesen et al., 2011; Tonnesen & Bryan, 2012). Regarding the tail of BIG, Cortese et al. (2006) predicted that star formation may occur since the mean column density is high enough to start star formation.
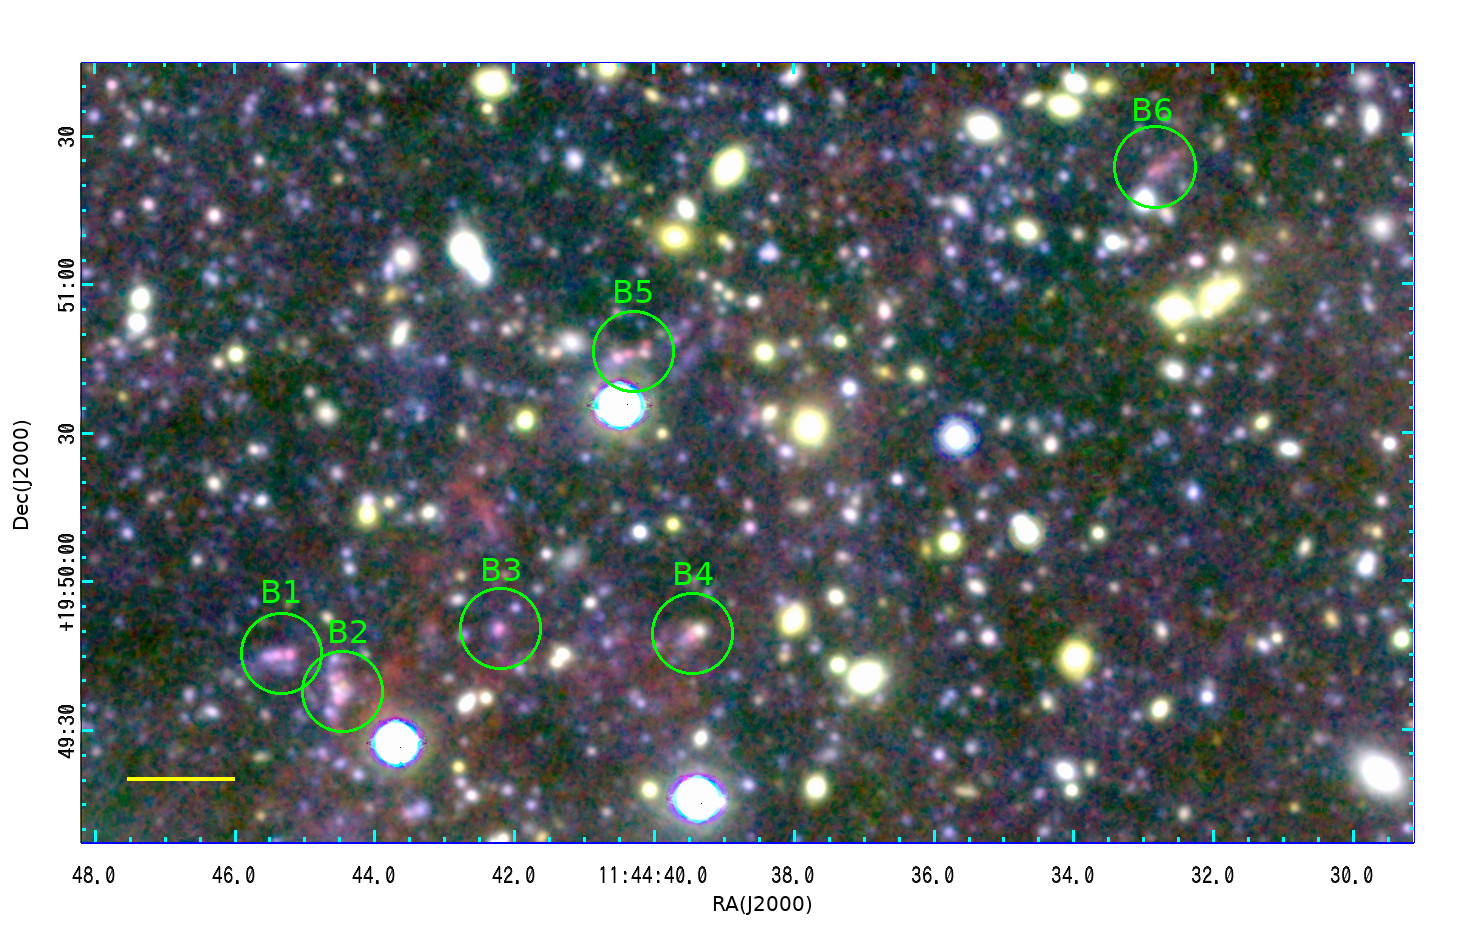
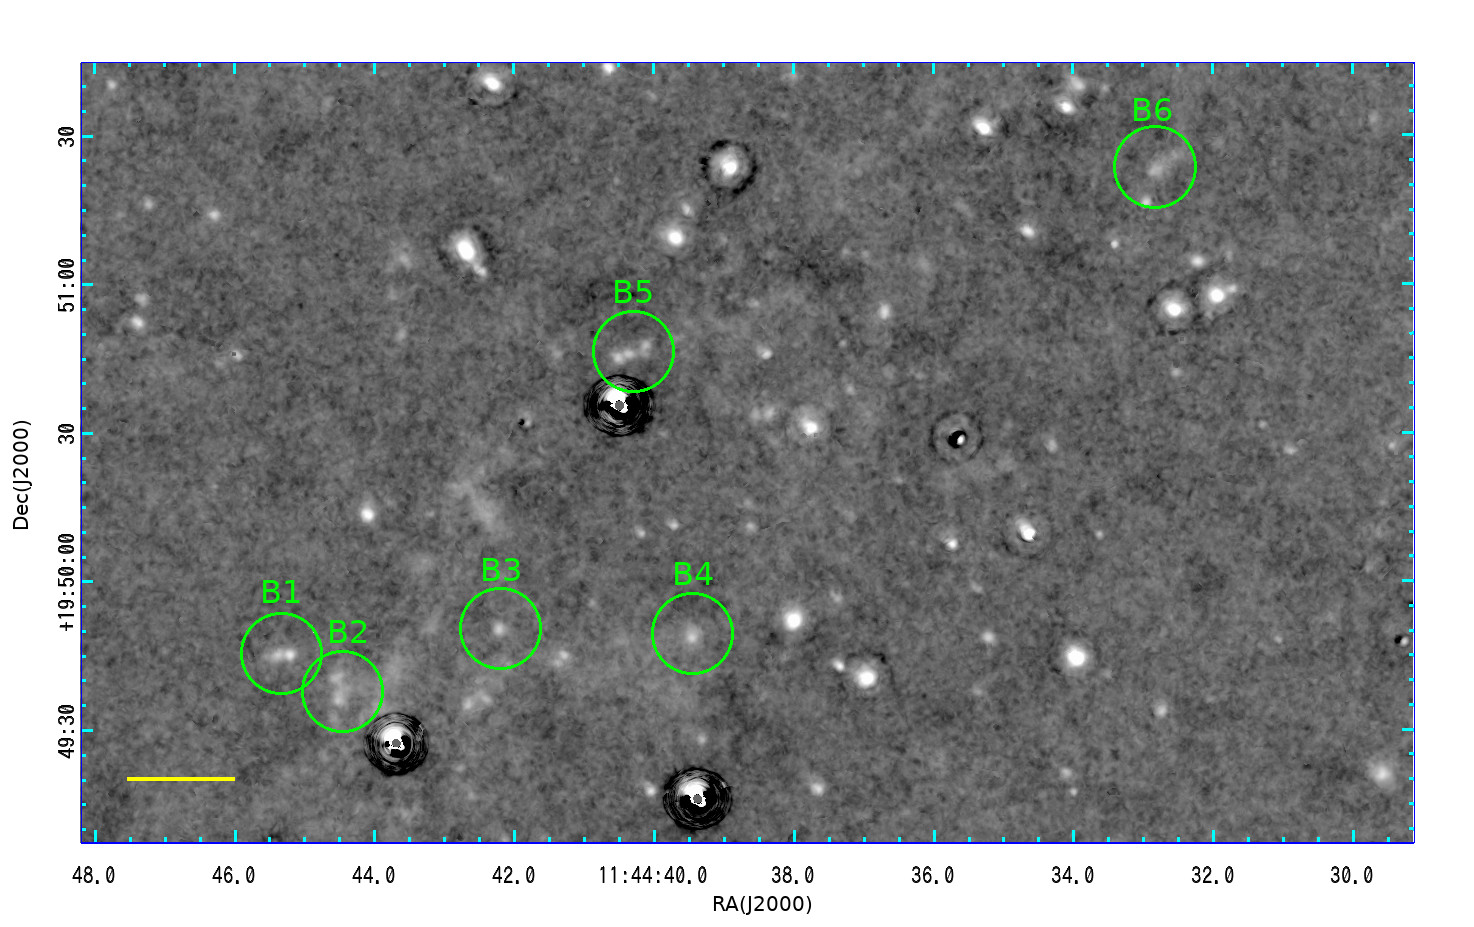
In the B, R, and NBcomposite image in this study, we detected possible SF blobs in the tail of BIG and near the orphan clouds (Figures 6,11, and Table 4.) We checked the GALEX image from the archive, and found that they are also detected in UV. We refer to the candidates as SF blobs for simplicity, hereafter, though spectroscopic confirmation is needed to confirm that they are genuine SF blobs in Abell 1367. We named SF blobs in the tail of BIG B1 – B6, according to the distance from BIG, and the one near the orphan clouds (orphan2) as O1. Their properties are shown in Table 4, and cutouts are shown as Figures 17 and 18. In this section, we mainly used images before PSF matching to make use of higher spatial resolution in NB band. Meanwhile the magnitude shown in Table 4 was measured in PSF matched images for consistency. The magnitude and H flux were measured within the isophote of 2.5 erg s-1 cm-2 arcsec-2. We assumed z=0.0275 for B1–B6, and z=0.0217 for O1, respectively. In B, R, and NBcomposite of B2, B4, and B5, possible blended fore/background objects are recognized as yellow color objects. Thus their magnitudes are contaminated by the blend. Also it should noted that since the PSF and deblending is different, the magnitude in optical and UV is not directly comparable.
The regions are very blue in UV (FUV-NUV) and in optical (B-R and R-i); FUV-NUV, B-R, and R-i, before internal extinction correction. The color implies that they are SF blobs and do not suffer heavy dust extinction. The H luminosity of SF blobs is estimated to be 2–7 erg s-1, though the value has quite large uncertainty as discussed in Section 2.6.
5.2.1 SF blobs in the tail of BIG
The tangential distance of the SF blobs from galaxies in BIG is 63–150 kpc from CGCG 097-120, 120–190 kpc from CGCG 097-114, or 110–200 kpc from CGCG 097-125. The most distant SF blob, B6, is 150 kpc away. Even if the tangential motion of the blob relative to BIG is as high as 1000 km s-1, B6 requires 1.5 years to reach the distance. Thus it would not be a stripped star-forming region from the parent, but in-situ star formation.
In B4, possible offset between B and H is recognized; B-band emission is stronger near BIG. In Figure 17 top, the blue component is extended to bottom-left. They resemble “fireball” features found in EIG of RB199 in the Coma cluster (Yoshida et al., 2008); the ram pressure works at the regions, and H emitting clouds were swept downstream while formed young stars were not. The offset roughly aligns to the tail and points in the direction of CGCG 097-120 and CGCG 097-125. This supports the assumption that B4 is a part of the tail.
5.2.2 SF blobs near orphan2
The SF blobs near orphan2 align almost perpendicularly to the H filament from orphan2 (Figure 19). Though SF blobs are resolved into several compact sources in B and NBimages before smoothing, they are merged in PSF matched images, and we measured the magnitude as a whole in Table 4.
In Figure 18 right, several residuals remain in H image. Figure 18 center, B, R, and i composite is shown as a reference; the objects that show orange–yellow color in B, R, and i composite are not SF blobs, and the H excess are fake, because of PSF mismatch, and disappear in PSF matched H image.
In broadband images, a faint stream is seen near the SF blobs. B-band image is shown as 19 bottom-left. Because H is weak along the stream (Figure 18) the stream would be stars and might be a tidal tail. The stream seems to connect two galaxies, SDSS J114425.39+200923.2, and SDSS J114426.00+201001.8 across the orphan2 filament. Their projected distance is 18.3 kpc, if they are at the Abell 1367 distance. At the opposite side of SDSS J114426.00+201001.8, the stream is vague but possibly reaches to the UDG, which is about 34 kpc away from the south galaxy (SDSS J114425.39+200923.2). As the three galaxies, SDSS J114425.39+200923.2, SDSS J114426.00+201001.8, and the UDG does not have spectroscopic information, the galaxies may not be an Abell 1367 member. Meanwhile, as the SF blobs show strong excess in H, they would be in Abell 1367.
As the SF blobs align to the blue stream perpendicular to the H filament of orphan2, and they are 4–8 kpc away from the H filament, they would be an accidental overlap on the orphan clouds. In Table 2, the flux of orphan2 therefore does not include the SF blobs.
6 Summary
We investigated H images of Abell 1367 taken with Suprime-Cam, and made a catalog of extended ionized gas clouds (EIGs) and their parents. Though Abell 1367 is one of the best-studied clusters, we added six new EIGs to enable a statistical discussion and a comparison with EIGs in the Coma cluster. The deep H image also revealed that the H tails are extended in fainter surface brightness much longer than previously known. The tail of blue infalling group(BIG) shows a sign of winding which could be a result of motion of galaxies inside the group. We also found several candidates of star-forming blobs (SF blobs) far from parent galaxies. The comparison of the parent galaxies of EIGs in Abell 1367 and in the Coma cluster showed that the properties of the parents are basically similar. Meanwhile the length of EIGs is longer and more often connected to star-forming parents in Abell 1367. The difference suggests that the EIGs and parents in Abell 1367 are, on average, younger than those in the Coma cluster, and in Abell 1367, the gas removal from the parent and/or the heating of EIG is slower. It would reflect a different evolutionary stage of the clusters.
References
- Abramson & Kenney (2014) Abramson, A., Kenney, J.D.P. 2014, AJ, 147, 63
- Ahn et al. (2012) Ahn, C.P., Alexandroff, R., Allende Prieto, C., et al. 2012, ApJS, 203, 21
- Alam et al. (2012) Alam, S, Albareti, F.D, Allende Prieto, C. et al. 2015, ApJS, 219, 12
- Arrigoni Battaia et al. (2012) Arrigoni Battaia, F., Gavazzi, G., Fumagalli, M., et al. 2012, A&A, 543, A112
- Bechtold et al. (1983) Bechtold, J., Forman, W., Jones, C., Schwarz, J., van Speybroeck, L., Giacconi, R., Tucker, W. 1983, ApJ, 265, 26
- Bertin & Arnouts (1996) Bertin, E., Arnouts, S. 1996, A&AS, 317, 393
- Blanton & Roweis (2007) Blanton, M.R., Roweis, S. 2007, AJ, 133, 734
- Butcher & Oemler (1984) Butcher, H., Oemler, A., Jr. 1984, ApJ, 285, 426
- Boselli et al. (1994) Boselli, A., Gavazzi, G., Combes, F., Lequeux, J., Casoli, F. 1994, A&A, 285, 69
- Boselli & Gavazzi (2006) Boselli, A., Gavazzi, G. 2006, PASP, 118, 517
- Boselli & Gavazzi (2014) Boselli, A., Gavazzi, G. 2014, A&A Rev., 22, 74
- Boselli et al. (2016) Boselli, A., Boissier, S., Voyer, E., et al. 2016, A&A, 585, A2
- Chemin et al. (2005) Chemin, L., Cayatte, V., Balkowski, C., et al. 2005, A&A, 436, 469
- Chung et al. (2007) Chung, A., van Gorkom, J. H., Kenney, J.D.P.; Vollmer, B. 2007, ApJ, 659, L115
- Conselice et al. (2001) Conselice, C.J., Gallagher, J.S., III, Wyse, R.F.G. 2001, AJ, 122, 2281
- Consolandi et al. (2016) Consolandi, G., Gavazzi, G., Fumagalli, M., Dotti, M., Fossati, M. 2016, A&A, 591, A38
- Cortese et al. (2003) Cortese, L., Gavazzi, G., Iglesias-Paramo, J., Boselli, A., Carrasco, L. 2003, A&A, 401, 471
- Cortese et al. (2004) Cortese, L., Gavazzi, G., Boselli, A., Iglesias-Paramo, J., Carrasco, L. 2004, A&A, 425, 429
- Cortese et al. (2006) Cortese, L., Gavazzi, G., Boselli, A., et al. 2006, A&A, 453, 847
- Cortese et al. (2007) Cortese, L., Marcillac, D., Richard, J., et al. 2007, MNRAS, 376, 157
- Cortese et al. (2008) Cortese, L. et al. 2008, MNRAS, 383, 1519
- Dickey & Salpeter (1984) Dickey, J. M., Salpeter, E. E. 1984, ApJ, 284, 461
- Donnelly et al. (1998) Donnelly, R. H., Markevitch, M., Forman, W., et al. 1998, ApJ, 500, 138
- Ehlert et al. (2013) Ehlert, S., Werner, N., Simionescu, A., et al. 2013, MNRAS, 430, 2401
- Ebeling et al. (2014) Ebeling, H., Stephenson, L. N., Edge, A. C. 2014, ApJ, 781, L40
- Fabian et al. (2003) Fabian, A. C., Sanders, J. S., Allen, S. W., et al. 2003, MNRAS, 344, L43
- Fabbiano et al. (1990) Fabbiano, G., Heckman, T., Keel, W. C. 1990, ApJ, 355, 442
- Fossati et al. (2012) Fossati, M., Gavazzi, G., Boselli, A., Fumagalli, M. 2012, A&A, 544, A128
- Fukazawa et al. (2004) Fukazawa, Y., Makishima, K., Ohashi, T. 2004, PASJ, 56, 965
- Gavazzi (1978) Gavazzi, G. 1978, A&A, 69, 355
- Gavazzi et al. (1984) Gavazzi, G., Tarenghi, M., Jaffe, W., Boksenberg, A., Butcher, H. 1984, A&A, 137, 235
- Gavazzi (1987) Gavazzi, G. 1987, ApJ, 320, 96
- Gavazzi & Jaffe (1987) Gavazzi, G., Jaffe, W. 1987, A&A, 186, L1
- Gavazzi (1989) Gavazzi, G. 1989, ApJ, 346, 59
- Gavazzi et al. (1995) Gavazzi, G., Contursi, A., Carrasco, L., et al. 1995, A&A, 304, 325
- Gavazzi et al. (1998) Gavazzi, G., Catinella, B., Carrasco, L., Boselli, A., Contursi, A. 1998, AJ, 115, 1745
- Gavazzi et al. (2001a) Gavazzi, G., Boselli, A., Mayer, L., et al. 2001, ApJ, 563, L23
- Gavazzi et al. (2001b) Gavazzi, G., Marcelin, M., Boselli, A., et al. 2001, A&A, 377, 745
- Gavazzi et al. (2003a) Gavazzi, G., Cortese, L., Boselli, A., et al. 2003a, ApJ, 597, 210
- Gavazzi et al. (2003b) Gavazzi, G., Boselli, A., Donati, A., Franzetti, P., Scodeggio, M. 2003b, A&A, 400, 451
- Gavazzi et al. (2006) Gavazzi, G., Boselli, A.; Cortese, L., et al. 2006, A&A, 446, 839
- Gavazzi et al. (2010) Gavazzi, G., Fumagalli, M., Cucciati, O., Boselli, A. 2010, A&A, 517, A73
- Gavazzi et al. (2011) Gavazzi, G., Savorgnan, G., Fumagalli, Mattia 2011, A&A, 534, A31
- Gavazzi et al. (2013) Gavazzi, G., Consolandi, G., Dotti, M., et al. 2013, A&A, 558, A68
- Gavazzi et al. (2014) Gavazzi, G., Franzetti, P., Boselli, A. 2014, (arXiv:1401.8123)
- Grebenev et al. (1995) Grebenev, S. A., Forman, W., Jones, C., Murray, S. 1995, ApJ, 445, 607
- Gu et al. (2013) Gu, L., Yagi, M., Nakazawa, K., et al. 2013, ApJ, 777, L36
- Gunn & Gott (1972) Gunn, J.E., Gott, J.R.,III 1972, ApJ, 176, 1
- Hester et al. (2010) Hester, J.A., Seibert, M., Neill, J.D., Wyder, T.K., Gil de Paz, A., et al. 2010, ApJ, 716, L14
- Hinshaw et al. (2013) Hinshaw, G., Larson, D., Komatsu, E., et al. 2013, ApJS, 208, 19
- Hoopes et al. (1999) Hoopes, C.G., Walterbos, R. A. M., Rand, R. J. 1999, ApJ, 522, 669
- Hota et al. (2007) Hota, A., Saikia, D.J., Irwin, J.A. 2007, MNRAS, 380, 1009
- Hummel & Saikia (1991) Hummel, E., Saikia, D. J. 1991, A&A, 249, 43
- Icke (1985) Icke, V. 1985, A&A, 144, 115
- Iglesias-Páramo et al. (2002) Iglesias-Páramo, J., Boselli, A., Cortese, L., Vílchez, J. M., Gavazzi, G. 2002, A&A, 384, 383
- Iye et al. (2004) Iye, M., et al. 2004, PASJ, 56, 381
- Jachym et al. (2014) Jáchym, P., Combes, F., Cortese, L., Sun, M., Kenney, J.D.P. 2014, ApJ, 792, 11
- Jones et al. (1979) Jones, C., Mandel, E., Schwarz, J., et al. 1979, ApJ, 234, L21
- Kapferer et al. (2008) Kapferer, W., Kronberger, T., Ferrari, C., Riser, T., & Schindler, S. 2008, MNRAS, 389, 1405
- Kapferer et al. (2009) Kapferer, W., Sluka, C., Schindler, S., Ferrari, C., & Ziegler, B. 2009, A&A, 499, 87
- Kronberger et al. (2008) Kronberger, T., Kapferer, W., Ferrari, C., Unterguggenberger, S., & Schindler, S. 2008, A&A, 481, 337
- Keel et al. (2012) Keel, W. C., Lintott, C. J., Schawinski, K., et al. 2012, AJ, 144, 66
- Kenney et al. (1995) Kenney, J.D.P., Rubin, V.C., Planesas, P., Young, J.S. 1995, ApJ, 438, 135
- Kenney & Koopmann (1999) Kenney, J.D.P., Koopmann, R.A. 1999, AJ, 117, 181
- Kenney et al. (2008) Kenney, J.D.P., Tal, T., Crowl, H.H., Feldmeier, J., Jacoby, G.H. 2008, ApJ, 687, L69
- Kenney et al. (2014) Kenney, J.D.P., Geha, M., Jáchym, P., et al. 2014, ApJ, 780, 119
- Koda et al. (2015) Koda, J., Yagi, M., Yamanoi, H., Komiyama, Y. 2015, ApJ, 807, L2
- Kotanyi & Ekers (1983) Kotanyi, C. G., Ekers, R. D. 1983, A&A, 122, 267
- Kriwattanawong et al. (2011) Kriwattanawong, W., Moss, C., James, P.A., Carter, D. 2011, A&A, 527, A101
- Lang et al. (2010) Lang, D., Hogg, D. W., Mierle, K., Blanton, M., Roweis, S. 2010, AJ, 139, 1782
- Larson et al. (1980) Larson, R. B., Tinsley, B. M., Caldwell, C. N. 1980, ApJ, 237, 692
- Lintott et al. (2008) Lintott, C. J., Schawinski, K., Slosar, A., et al. 2008, MNRAS, 389, 1179
- Lintott et al. (2009) Lintott, C. J., Schawinski, K., Keel, W., et al. 2009, MNRAS, 399, 129
- Miley et al. (1980) Miley, G. 1980, ARA&A, 18, 165
- Miyazaki et al. (2002) Miyazaki, S., Komiyama, Y., Sekiguchi, M., et al. 2002, PASJ, 54, 833
- Moore et al. (1996) Moore, B., Katz, N., Lake, G., Dressler, A., Oemler, A. 1996, Nature, 379, 613
- Moore et al. (1999) Moore, B., Lake, G., Quinn, T., Stadel, J. 1999, MNRAS, 304, 465
- Nulsen (1982) Nulsen P.E.J. 1982, MNRAS, 198, 1007
- Oosterloo & van Gorkom (2005) Oosterloo, T., van Gorkom, J. 2005, A&A, 437, L19
- Osterbrock & Ferland (2006) Osterbrock, D.E., Ferland, G.J. 2006, Astrophysics of gaseous nebulae and active galactic nuclei, 2nd. ed. (Sausalito, CA: University Science Books)
- Peng et al. (2002) Peng, C.Y., Ho, L.C., Impey, C.D., Rix, H.-W. 2002, AJ, 124, 266
- Peng et al. (2010) Peng, C.Y., Ho, L.C., Impey, C.D., Rix, H.-W. 2010, AJ, 139, 2097
- Piffaretti et al. (2011) Piffaretti, R., Arnaud, M., Pratt, G. W., Pointecouteau, E., Melin, J.-B. 2011, A&A, 534, A109
- Poggianti et al. (2016) Poggianti, B., et al. 2016, AJ, 151, 78
- Randall et al. (2008) Randall, S., Nulsen, P., Forman, W. R., et al. 2008, ApJ, 688, 208
- Röser et al. (2008) Röser, S., Schilbach, E., Schwan, H., et al. 2008, A&A, 488, 401
- Sakai et al. (2012) Sakai, S., Kennicutt, R.C., Jr., Moss, C. 2012, ApJS, 199, 36
- Sakai et al. (2002) Sakai, S., Kennicutt, R.C., Jr., van der Hulst, J.M., Moss, C. 2002, ApJ, 578, 842
- Salomé et al. (2006) Salomé, P., Combes, F., Edge, A.C., et al. 2006, A&A, 454, 437
- Salomé et al. (2011) Salomé,, P., Combes, F., Revaz, Y., et al. 2011, A&A, 531, A85
- Schlalfy & Finkbeiner (2011) Schlafly, E.F., Finkbeiner, D.P. 2011, ApJ, 737, 103
- Schellenberger & Reiprich (2015) Schellenberger, G., Reiprich, T. H. 2015, A&A, 583, L2
- Scott et al. (2010) Scott, T.C., Bravo-Alfaro, H., Brinks, E., et al. 2010, MNRAS, 403, 1175
- Scott et al. (2013) Scott, T.C., Usero, A., Brinks, E., et al. 2013, MNRAS, 429, 221
- Scott et al. (2015) Scott, T. C., Usero, A., Brinks, E., et al. 2015, MNRAS, 453, 328
- Smith et al. (2004) Smith, R.J., et al. 2004, AJ, 128, 1558
- Smith et al. (2010) Smith, R.J., Lucey, J.R., Hammer, D., et al. 2010, MNRAS, 408, 1417
- Schlegel et al. (1998) Schlegel, D. J., Finkbeiner, D. P. & Davis, M., 1998, ApJ, 500, 525
- Strickland & Stevens (2000) Strickland, D.K., Stevens, I.R. 2000, MNRAS, 314, 511
- Strickland et al. (2002) Strickland, D. K., Heckman, T. M., Weaver, K. A., Hoopes, C. G., Dahlem, M. 2002, ApJ, 568, 689
- Strickland et al. (2004) Strickland, D. K., Heckman, T. M., Colbert, E. J. M., Hoopes, C. G., Weaver, K. A. 2004, ApJ, 606, 829
- Sun & Murray (2002) Sun, M., Murray, S. S. 2002, ApJ, 577, 139
- Sun & Vikhlinin, (2005) Sun, M., Vikhlinin, A. 2005, ApJ, 621, 718
- Sun et al. (2006) Sun, M., Jones, C., Forman, W., et al. 2006, ApJ, 637, L81
- Sun et al. (2007) Sun, M., Donahue, M., Voit, G. M. 2007, ApJ, 671, 190
- Sun et al. (2010) Sun, M., Donahue, M., Roediger, E., et al. 2010, ApJ, 708, 946
- Tonnesen & Bryan (2010) Tonnesen, S., Bryan, G. L. 2010, ApJ, 709, 1203
- Tonnesen et al. (2011) Tonnesen, S., Bryan, G. L., Chen, R. 2011, ApJ, 731, 98
- Tonnesen & Bryan (2012) Tonnesen, S., Bryan, G. L. 2012, MNRAS, 422, 1609
- Toomre & Toomre (1972) Toomre, A., Toomre, J. 1972, ApJ, 178, 623
- van Dokkum et al. (2015a) van Dokkum, P. G., Abraham, R., Merritt, A., et al. 2015, ApJ, 798, L45
- van Dokkum et al. (2015b) van Dokkum, P. G., Romanowsky, A. J., Abraham, R., et al. 2015, ApJ, 804, L26
- Veilleux et al. (2005) Veilleux, S., Cecil, G., Bland-Hawthorn, J. 2005, ARA&A, 43, 769
- Vollmer (2003) Vollmer, B. 2003, A&A, 398, 525
- Wang et al. (2004) Wang, Q.D., Owen, F., Ledlow, M. 2004, ApJ, 611, 821
- West et al. (2000) West, M.J., Blakeslee, J.P. 2000, ApJ, 543, L27
- Yagi et al. (2007) Yagi, M., Komiyama, Y., Yoshida, M., et al. 2007, ApJ, 660, 1209
- Yagi et al. (2010) Yagi, M., Yoshida, M., Komiyama, Y., et al. 2010, AJ, 140, 1814
- Yagi et al. (2012) Yagi, M. 2012, PASP, 124, 1374
- Yagi et al. (2013a) Yagi, M., Suzuki, N., Yamanoi, H. et al. 2013a, PASJ, 65, 22
- Yagi et al. (2013b) Yagi, M., Gu, L., Fujita, Y., et al. 2013bApJ, 778, 91
- Yagi et al. (2015a) Yagi, M., Gu, L., Koyama, Y., et al. 2015, AJ, 149, 36
- Yagi et al. (2015b) Yagi, M., Utsumi, Y., Komiyama, Y. 2015, to appear in ADASS XXV.
- Yagi et al. (2016) Yagi, M., Koda, J., Komiyama, Y., Yamanoi, H. 2016, ApJS, 225, 11
- Yoshida et al. (2002) Yoshida, M., Yagi, M., Okamura, S., et al. 2002, ApJ, 567, 118
- Yoshida et al. (2004) Yoshida, M., Ohyama, Y., Iye, M., et al. 2004, AJ, 127, 3653
- Yoshida et al. (2008) Yoshida, M., Yagi, M., Komiyama, Y., et al. 2008, ApJ, 688, 918
- Yoshida et al. (2012) Yoshida, M., Yagi, M., Komiyama, Y., et al. 2012, ApJ, 479, 43
- Yoshida et al. (2016) Yoshida, M., Yagi, M., Ohyama, Y., et al. 2016, ApJ, 820, 48
- Zhang et al. (2013) Zhang, B., Sun, M., Ji, L., et al. 2013 ApJ, 777, 122


| filter | PSF size (FWHM) | SBlim(ABmag arcsec-2)aaSBlim represents 1- fluctuation of the surface brightness measured in random apertures of 2 arcsec diameter. | Date(UT) | exposure |
| B | 0”.7 | 28.5 | 2014-05-01 | 8600sec |
| R | 1”.2 | 27.9 | 2014-04-30 | 560 sec |
| 2014-04-30 | 10300 sec | |||
| 2014-05-01 | 5300 sec | |||
| i | 1”.1 | 27.4 | 2014-05-01 | 10180 sec |
| NB | 0”.7–0”.9 | 27.7 | 2014-04-30 | 15900 sec |
| 2014-05-01 | 5900 sec |
| ID/parent | size | area | SB | redshift | H flux | mass | type |
|---|---|---|---|---|---|---|---|
| (1) | (2) | (3) | (4) | (5) | (6) | (7) | (8) |
| orphan1 | 3313 | 128 | 26.60.1 | 0.0217 ccParent galaxy is uncertain, and the cluster redshift is used. Derived H flux and mass would have large error. | (3.40.2) ccParent galaxy is uncertain, and the cluster redshift is used. Derived H flux and mass would have large error. | (5.40.3) ccParent galaxy is uncertain, and the cluster redshift is used. Derived H flux and mass would have large error. | 3 |
| orphan2ddFrom Gavazzi et al. (2003a) | 365 | 27 | 26.70.1 | 0.0217 ccParent galaxy is uncertain, and the cluster redshift is used. Derived H flux and mass would have large error. | (4.00.2) ccParent galaxy is uncertain, and the cluster redshift is used. Derived H flux and mass would have large error. | (3.10.2) ccParent galaxy is uncertain, and the cluster redshift is used. Derived H flux and mass would have large error. | 3 |
| 2MASX J11443212 | |||||||
| +2006238 | 3313bbObject is near the edge of the observed region, and the full extent of the cloud is uncertain | 177bbObject is near the edge of the observed region, and the full extent of the cloud is uncertain | 23.90.3 | 0.02402 | (62) bbObject is near the edge of the observed region, and the full extent of the cloud is uncertain | (2.80.9) bbObject is near the edge of the observed region, and the full extent of the cloud is uncertain | 2 |
| CGCG 097-092 | 3511 | 91 | 23.20.3 | 0.02157 | (52) | (1.60.5) | 3 |
| (without core) | 2310 | 68 | 26.90.1 | 0.02157 | (1.40.2) | (2.20.3) | |
| CGCG 097-093 | 3119 | 232 | 24.90.5 | 0.01633 | (43) | (32) | 1 |
| CGCG 097-122 | 3428 | 380 | 23.80.5 | 0.01824 | (1.50.8) | (1.00.5) | 1 |
| (BIG+tail) | 334145 | 3306 | 25.00.5 | 0.0275ddFrom Gavazzi et al. (2003a) | (53) | (85) | |
| (tail only) | 18445 | 486 | 26.70.5 | 0.0275ddFrom Gavazzi et al. (2003a) | (21) | (32) | |
| CGCG 097-073 | 8428 | 559 | 24.30.2 | 0.02429 | (1.30.3) | (1.00.2) | 1 |
| CGCG 097-079 | 13517 | 285 | 23.20.1 | 0.02342 | (1.70.2) | (5.20.6) | 1 |
| CGCG 097-087 | 16620 | 910 | 23.10.2 | 0.02218 | (5.81.1) | (2.30.4) | 1 |
| CGCG 097-087N | 1211 | 72 | 24.70.6 | 0.02516aaFrom Iglesias-Páramo et al. (2002) | (1.20.8) | (86) | 1 |
(1) Name of the cloud.
(2) Size of minimum bounding rectangle of isophote of 2.5 10-18 erg s-1 cm-2 arcsec-2. Unit is kpckpc.
(3) Projected area in the isophote. Unit is kpc2.
(4) Mean surface brightness in the isophote. Unit is mag arcsec-2.
(5) Redshift used for calculating H flux. Taken from SDSS DR12(Alam et al., 2012) unless otherwise noted.
(6) H flux. Unit is erg s-1 cm-2.
(7) Mass of the cloud. Unit is ,
where is a volume filling factor.
(8) Morphological type (see Section 4.4.)
| parent | d | redshift | NucAc | EW(H) | log(M∗) | type | |||
| (1) | (2) | (3) | (4) | (5) | (6) | (7) | (8) | (9) | (10) |
| CGCG 097-073 | 739 | 0.02429 | HII | 15.5 | 0.38 | 111.0 | -19.5 | 9.213 | 1 |
| CGCG 097-079 | 682 | 0.02342 | HII | 15.6 | 0.28 | 129.0 | -19.4 | 8.963 | 1 |
| CGCG 097-087 | 467 | 0.02218 | 14.6 | 0.61aaFrom GOLDMine Database(Gavazzi et al., 2003b) | 77.0 | -20.4 | 9.784 | 1 | |
| CGCG 097-087N | 473 | 0.02516bbFrom Iglesias-Páramo et al. (2002) | 16.5 | 0.43 | 19.0 | -18.5 | 9.111 | 1 | |
| CGCG 097-092 | 754 | 0.02157 | HII | 14.9 | 0.45 | 45.17 | -20.1 | 9.544 | 3 |
| 2MASX J11443212 | |||||||||
| +2006238 | 580 | 0.02402 | HII | 15.1 | 0.82 | -19.9 | 9.869 | 2 | |
| CGCG 097-093 | 230 | 0.01633 | HII | 15.1 | 0.26 | 9.0 | -19.9 | 9.143 | 1 |
| CGCG 097-122 | 518 | 0.01824 | HII | 14.1 | 0.64 | -20.9 | 9.95 | 1 | |
| (BIG) | |||||||||
| CGCG 097-120 | 102 | 0.01871 | AGN | 13.0 | 0.73 | 4.0 | -22.0 | 10.41 | 1 |
| CGCG 097-114 | 78 | 0.02825 | HII | 15.4 | 0.36 | 36.0 | -19.6 | 9.229 | 1 |
| CGCG 097-125 | 123 | 0.02742 | HII | 14.3 | 0.76 | 23.0 | -20.7 | 10.27 | 1 |
| SDSS J114501.81 | |||||||||
| +194549.4 | 166 | 0.02742 | BAD | 16.4 | 0.52 | -18.6 | 9.111 | 3? | |
| (SDSS J114513.76 | |||||||||
| +194522.1) | 244 | 0.02754 | HII | 15.3 | 0.69 | 12.0 | -19.7 | 9.678 |
(1) Name of the galaxy.
(2) Projected distance from the cluster center. Unit is kpc.
(3) Redshift. Taken from SDSS DR12(Alam et al., 2012) unless otherwise noted.
(4) Nuclear activity from spectroscopy(Gavazzi et al., 2011).
(5) r-band magnitude from SDSS DR12
(6) g-r color from SDSS DR12
(7) Equivalent width of H from GOLDMine Database(Gavazzi et al., 2003b).
(8) r-band absolute magnitude calculated from the photometry in SDSS DR12(Alam et al., 2012).
(9) Log of estimated stellar mass in units of M☉
assuming Chabrier IMF.
(10) Morphological type (see Section 4.4.)
| ID | RA(2000) | DEC(2000) | H fluxaaH flux within the isophote of 10-18 erg s-1 cm-2 arcsec-2. Unit is erg s-1 cm-2. Assuming z=0.0275 for B1–B6, and z=0.0217 for O1. | BbbMeasured within H isophote, and not directly comparable to UV magnitudes. | RbbMeasured within H isophote, and not directly comparable to UV magnitudes. | ibbMeasured within H isophote, and not directly comparable to UV magnitudes. | FUV | NUV |
|---|---|---|---|---|---|---|---|---|
| B1 | 11h44m45.s3 | +19∘49’36” | 3 | 22.8 | 22.9 | 23.0 | 22.430.17 | 22.650.26 |
| B2ccBlended with red (probably fore/background) objects. | 11h44m44.s4 | +19∘49’39” | 5 | 23.0 | 22.6 | 22.4 | 22.900.25 | 22.400.24 |
| B3 | 11h44m42.s2 | +19∘49’50” | 2 | 23.6 | 23.9 | 24.4 | 21.980.18 | 23.340.35 |
| B4ccBlended with red (probably fore/background) objects. | 11h44m39.s4 | +19∘49’49” | 2 | 23.1 | 22.5 | 22.6 | 22.360.21 | 22.920.24 |
| B5ccBlended with red (probably fore/background) objects. | 11h44m40.s3 | +19∘50’46” | 3 | 23.1 | 22.6 | 22.8 | 22.300.19 | 21.780.18 |
| B6 | 11h44m32.s7 | +19∘51’24” | 3 | 23.6 | 23.3 | 23.7 | 22.330.16 | 22.670.32 |
| O1 | 11h44m25.s2 | +20∘09’45” | 6 | 20.5 | 20.2 | 19.9 | 21.790.15 | 21.490.11 |
| name | survey area[Mpc2] | member | blue member | EIG parentaaOnly mag ones are counted. | blue parentaaOnly mag ones are counted. |
|---|---|---|---|---|---|
| Coma | 1.2 | 202 | 15 | 12 | 8 |
| A1367 | 1.7 | 120 | 19 | 11 | 6 |
Appendix A Mass estimation of the ionized gas clouds
Using the photometric properties of the clouds given in Table 2, we estimated their masses as follows. We assume that the cloud is optically thin, and the volume of the cloud is calculated as , where is the projected area given in Table 2, and is the mean length along the line of sight. Assuming a roughly cylindrical morphology, is approximated by , where and are the length and the width of the bounding rectangle, respectively. The volume is thus calculated as . The case B recombination coefficient of H at K is cm3 s-1(Osterbrock & Ferland, 2006). The H flux given in Table 2 () is then calculated as
| (A1) |
where is the mean electron density, is the Planck constant, is the frequency of H, and is the luminosity distance to the gas, 100 Mpc. And the mass () is calculated as
| (A2) | |||||
where is the volume filling factor of the ionized gas, and is the proton mass. The calculated mass of the clouds is given in Table 2. If the cloud distribution has inclination against the tangential plane, the derived mass should be divided by , but this effect is smaller than other uncertainties.
Appendix B Notes on known EIGs
B.1 CGCG 097-073 and 097-079
The two are well known for their prominent tails (e.g., Gavazzi & Jaffe, 1987; Gavazzi, 1989; Boselli et al., 1994; Gavazzi et al., 1995, 1998, 2001a; Scott et al., 2010). The Subaru images as Figure 8 is shown as Figure 20. In Boselli & Gavazzi (2014), we showed a preliminary result from the same data as this paper.
B.2 CGCG 097-087 and 097-087N
CGCG 097-087 (UGC 6697) is also the best-studied galaxy in Abell 1367 (e.g., Gavazzi & Jaffe, 1987; Gavazzi, 1989; Boselli et al., 1994; Gavazzi et al., 1995, 1998, 2001b; Scott et al., 2010). Gavazzi et al. (2001b) presented H image and spectra of the galaxy and a part of the tail with a detailed investigation.
In the Subaru H data (Figure 21, we found that the tail of CGCG 097-087 extends more than 150 kpc from the core, more than twice as long as previously known in H (Gavazzi et al., 1995) and in other wavelengths (Sun & Vikhlinin,, 2005; Scott et al., 2010).
In the Subaru H data, CGCG 097-087N shows clear twin tails without stellar counterpart toward CGCG 097-087 (Figure 21). Zoomed up images before PSF matching are shown as Figure 22. The existence of the tails that overlap on the CGCG 097-087 disk may be a hint to understand the complex velocity field of the CGCG 097-087 disk (Gavazzi et al., 1984, 2001b).
CGCG 097-087 shows a quite red color ( = 1.81) in DR12 catalog. We checked the SDSS database to find that the center of the galaxy suffers heavy dust extinction and SDSS extracted the region. The color therefore does not reflect its stellar population. We therefore used the color from GOLDMine Database (Gavazzi et al., 2003b) for the galaxy, which measured SDSS images with the method by Consolandi et al. (2016). The adopted color of CGCG 097-087 is .
B.3 EIG parents in BIG
For statistical discussion of EIG parents, the assignment of the parent galaxy of the complex H clouds around BIG is needed. From previous studies, it is known that CGCG 097-125 and CGCG 097-114 show a clear H tail and were identified as the parents. CGCG 097-120 ( = 5609 km s-1; from SDSS DR12) has been thought as an accidental overlap, since the measured recession velocity of the H clouds around BIG are as high as 8000 – 8800 km s-1 (Cortese et al., 2006), However, a recent spectroscopic observation by MUSE/VLT revealed that CGCG 097-120 is interacting with surrounding H gas, and showing a smoothly connected distribution of the H velocity (Consolandi, G. et al. in preparation). Thus at least these three are parent galaxies of EIGs.
Another possible parent of EIGs around BIG is SDSS J114501.81+194549.4, which shows clear poststarburst feature from SDSS DR12 spectrum at km s-1. The EIG just south of the galaxy may be connected with the galaxy. The galaxy is thus counted as an EIG parent in Table 5.
Yet another possible parent of EIG around BIG is SDSS J114513.76+194522.1 ( km s-1) about 150 kpc east of the BIG complex. The galaxy shows a sign of stripping toward west, though no extended H feature is seen around it. Moreover the South clouds of BIG (Cortese et al., 2006) show a sign that they come from far east of BIG. These are, however, currently weak evidence. Thus we did not count the galaxy in Table 5 and did not plot in Figures 15 and 16, but showed it in Table 3 with parentheses as a reference.
Other spectroscopically confirmed dwarfs and knots by Sakai et al. (2002) and Cortese et al. (2006) are fainter than the magnitude limit of the catalog () used in the statistical analysis of this study. The previous studies (Sakai et al., 2002; Gavazzi et al., 2003a; Cortese et al., 2006) discussed the possibility that the dwarfs could have been formed in the stripped gas from giant galaxies. The dwarfs would not be parent galaxies of EIGs but rather children. We therefore do not count them as parent galaxies of EIGs.