Rotating starburst cores in massive galaxies at
Abstract
We present spatially resolved ALMA observations of the CO emission line in two massive galaxies at on the star-forming main sequence. Both galaxies have compact dusty star-forming cores with effective radii of kpc and kpc in the 870 m continuum emission. The spatial extent of star-forming molecular gas is also compact with kpc and kpc, but more extended than the dust emission. Interpreting the observed position-velocity diagrams with dynamical models, we find the starburst cores to be rotation-dominated with the ratio of the maximum rotation velocity to the local velocity dispersion of ( km s-1) and ( km s-1). Given that the descendants of these massive galaxies in the local universe are likely ellipticals with nearly an order of magnitude lower, the rapidly rotating galaxies would lose significant net angular momentum in the intervening time. The comparisons among dynamical, stellar, gas, and dust mass suggest that the starburst CO-to-H2 conversion factor of (K km s-1pc-2)-1 is appropriate in the spatially resolved cores. The dense cores are likely to be formed in extreme environments similar to the central regions of local ultraluminous infrared galaxies. Our work also demonstrates that a combination of medium-resolution CO and high-resolution dust continuum observations is a powerful tool for characterizing the dynamical state of molecular gas in distant galaxies.
Subject headings:
galaxies: evolution — galaxies: high-redshift — galaxies: ISM1. Introduction
Massive quiescent galaxies often have dense cores (Fang et al., 2013; van Dokkum et al., 2014) while the morphology of star-forming galaxies is typically dominated by exponential disks rather than central bulges (e.g., Wuyts et al., 2011a). Massive star-forming galaxies are expected to transform their morphology from disk-dominated to bulge-dominated. Understanding the formation history of the bulge component is a critical step toward revealing the origin of the Hubble sequence. At the peak epoch of galaxy formation (), the most massive, , star-forming galaxies still have extended disks, but are rapidly building up their central cores through dusty, compact starbursts (Tadaki et al., 2017; Barro et al., 2016). Bulge formation in a short period of 1 Gyr at is also corroborated by observations of old stellar populations and enhanced [/Fe] ratios in massive quiescent galaxies at (e.g., Belli et al., 2015; Onodera et al., 2015). All these findings suggest that central cores of massive galaxies have a different formation history than outer disks. The next step is to characterize the kinematics of these dense cores in the process of formation, which will shed light on their formation mechanisms and subsequent evolution.
At high-redshift, the kinematics of dusty star-forming cores in massive galaxies are difficult to study. While H studies with near-infrared spectrographs have made significant progress in understanding the kinematics of core formation (e.g., Nelson et al. 2014; Barro et al. 2014; E. Wisnioski et al. 2017, in preparation), the H line is not an ideal tool for investigating the kinematics of forming cores because of dust attenuation. Multi-wavelength high-resolution imaging and emission line maps reveal that the central regions in massive high-redshift galaxies are often strongly attenuated by dust (Tacchella et al., 2017; Nelson et al., 2016). CO line observations provide a more robust means of obtaining kinematic information for dusty objects, as well as the molecular gas properties (e.g., Tacconi et al., 2008; Ivison et al., 2013).
In local ultraluminous infrared galaxies (ULIRGs), molecular gas is concentrated into rotating nuclear disks or rings (e.g., Downes & Solomon, 1998). Moreover, the physical condition of the gas is totally different from that in normal star-forming galaxies. In normal star-forming regions, CO emission mainly comes from an ensemble of self-gravitating molecular clouds. Although the CO line is typically optically thick in each virialized molecular cloud, it is possible to count the number of clouds and estimate the total molecular gas mass. We use the CO-to-H2 conversion factor of (K km s-1pc-2)-1 including a correction for Helium since it is calibrated by virial mass measurements, optically thin dust emission and -ray observations in the Milky-Way disk (see review in Bolatto et al. 2013).
A CO-based gas mass with the Galactic conversion factor, however, often equals or exceeds a dynamical mass in local ULIRGs and SMGs, which could imply a smaller conversion factor (e.g., Downes & Solomon, 1998; Tacconi et al., 2008). This variation of could be caused by a high star formation rate (SFR) surface density in extreme environments. The intense UV radiation heats the nearby dust and the gas temperature increases through efficient energy exchange with hot dust (Narayanan et al., 2012). Then, the CO surface brightness increases more rapidly than the gas mass surface density.
In this letter, we report results from CO observations of two massive galaxies at using Atacama Large Millimeter/submillimeter Array (ALMA) to study the spatial distribution and the kinematics of molecular gas in the starburst cores. We assume a Chabrier initial mass function (IMF; Chabrier 2003) and adopt cosmological parameters of =70 km s-1 Mpc-1, =0.3, and =0.7.
2. Observations
We focus on the most massive star-forming galaxies with since this mass range is important for formation of dense cores (e.g., Tadaki et al., 2017). We select two galaxies at (U4-16795 and U4-16504) from Subaru narrow-band imaging in the SXDF field (Tadaki et al., 2013). The narrow-band based redshift has uncertainties of . The two galaxies are located within the primary beam of ALMA Band-3 receivers (a beam width at half power of ′) as the projected separation is 97. Both galaxies have a compact dusty star-forming core, which is probed by 870 m dust continuum emission (Tadaki et al., 2017). We compute the stellar mass using the FAST spectral energy distribution fitting code (Kriek et al., 2009) and the 3D-HST multi-wavelength photometric catalog (Skelton et al., 2014) using the stellar population synthesis models of Bruzual & Charlot (2003), exponentially declining star formation histories, and dust attenuation law of Calzetti et al. (2000). The total stellar mass is for U4-16795 and for U4-16504. In deep HAWK-I/-band maps (Fontana et al., 2014), 81% and 71% of the total fluxes come from the central 15 aperture region for U4-16795 and U4-16504, respectively. We take into account these factors when comparing the stellar mass with other masses (Section 4.2).
U4-16795 is detected in a deep -PACS 160 m map from archival data (see Lutz et al. 2011 for the methodology) and U4-16504 is detected in a deep -MIPS 24 m map (PI: J. Dunlop). Following the recipes of Wuyts et al. (2011b), we derive SFRs of (SFR/yr for U4-16795 and (SFR/yr for U4-16504 from a combination of the rest-frame 2800 Å and infrared luminosities. The targets are located on the massive end of the star-forming main sequence at (e.g., Speagle et al., 2014).
We observe the CO emission line ( GHz) of the two massive galaxies with ALMA Band-3 receivers covering the frequency range of 95–99 and 107–111 GHz. The calibration is processed through the Common Astronomy Software Application package (CASA; McMullin et al. 2007). We use the tclean task with natural weighting to make a channel map with a velocity width of 50 km s-1 and dirty continuum maps excluding the frequency range of the CO line. The synthesized beamsize is 066055. The rms levels are 147 Jy beam-1 in the channel map and 8.1 Jy beam-1 in the continuum map.
| ID | aafootnotemark: | bbfootnotemark: | bbfootnotemark: | bbfootnotemark: | ccfootnotemark: | |||
|---|---|---|---|---|---|---|---|---|
| (Jy km s-1) | (K km s-1pc-2) | () | () | () | () | () | ||
| [] | [] | [] | ||||||
| U4-16795 | 2.5236 | 0.720.06 | 10.37 | 11.17 | 11.01 | 10.28 | ||
| U4-16504 | 2.5267 | 0.720.05 | 10.37 | 11.10 | 11.01 | 10.27 |
-
a
Velocity-integrated CO fluxes within the 15 aperture. The uncertainties are estimated from the standard deviation of 200 random aperture photometry measurements.
-
b
Stellar mass and CO-based gas mass within the 15 aperture.
-
c
The 5 limit of 3 mm continuum-based gas mass within the 15 aperture through the gas-to-dust ratio of 120. The range corresponds to the dust emissivity of =0.4-1.5 g-1cm2.
3. Results and analysis
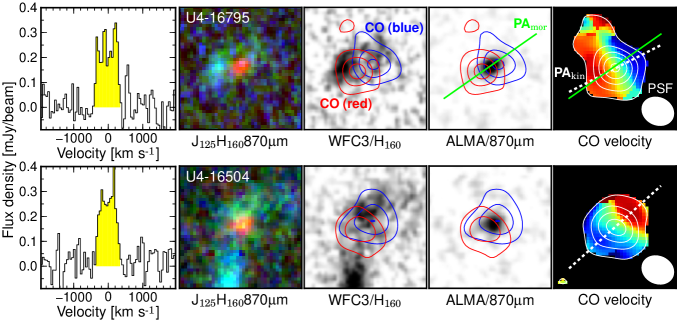
We robustly detect CO emission in both galaxies as seen in the spatially-averaged spectra within a 15 aperture (Figure 1). We measure total fluxes within a 15 aperture in the velocity-integrated maps to derive the CO line luminosities (Table 1). Both galaxies show a spatial offset between the blue- and red-shifted CO components with a velocity width of 150 km s-1 (Figure 1). The two central positions determine the kinematic major axis of the molecular gas disks. We also derive line-of-sight velocities by fitting a Gaussian function to the CO line spectrum in each spatial pixel. The velocity field maps show a monotonic gradient along the kinematic major axis (Figure1), suggesting rotation of the molecular gas. In this section, we construct the dynamical model of the dusty star-forming cores through the following three steps: (1) determining a minor-to-major axis ratio () of the 870 m continuum emission, (2) measuring an effective radius () of the CO line emission, and (3) exploring the best-fit dynamical model.
3.1. Spatial extent of dust
02-resolution 870 m continuum maps are available for both galaxies (Tadaki et al., 2017). In SMGs at high-redshift, the dust emission is well described by an elliptical exponential disk (Hodge et al., 2016). We derive effective radii, , along the major axis of the 870 m continuum emission assuming an inclined disk with an exponential profile while Tadaki et al. (2017) have adopted circular disk models (). We use the UVMULTIFIT tool to fit the visibility amplitudes to models in the plane (Martí-Vidal et al., 2014). For U4-16795, the best-fit values and fitting errors are kpc, and position angle of PAmor=35. Note that the morphological major axis of the 870 m continuum emission is well aligned with the kinematics major axis of the CO line emission (PAmor-PA), supporting ordered rotation (Wisnioski et al., 2015). We also perform the visibility fitting for U4-16504 with an elliptical disk, but could not obtain meaningful constraints on the axis ratio. Circular disk models give an effective radius of kpc.
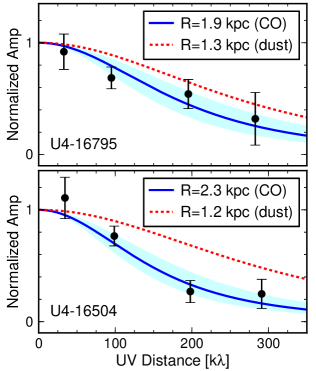
3.2. Spatial extent of molecular gas
Next, we derive effective radii of the CO line emission using the axis ratio of the dust emission. We fix to and PA for U4-16795, and for U4-16504. Figure 2 shows the observed visibility amplitudes and the best-fit models. The effective radii are kpc for U4-16795 and kpc for U4-16504, which are larger than those of the 870 m continuum emission. This result naively suggests that the dust is more concentrated than the molecular gas, which is consistent with negative radial gradients in dust-to-gas mass ratio seen in nearby star-forming galaxies (Magrini et al., 2011). On the other hand, galaxy centers tend to have higher dust temperatures compared to the outer region (Galametz et al., 2012), making the dust mass size larger than the 870 m size. High-resolution ALMA observations at high-frequency band (e.g., 450 m) will allow us to determine the radial gradient in dust temperature (section 4.1) and identify if the apparent size difference originates in the dust properties or the intrinsic gradients of dust-to-gas mass ratio.
3.3. Molecular gas kinematics
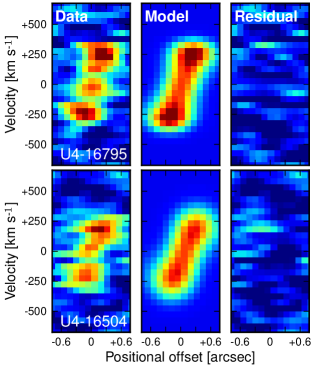
We find that both massive galaxies observed here exhibit signatures of disk-like rotation in their CO velocity fields (Figure 1). Assuming that the molecular gas is in rotating disks, we investigate the kinematic properties by fitting dynamical models to the data in the position-velocity (PV) diagram along the kinematic major axis (Figure 3). We use the DYSMAL code (Davies et al., 2011) to generate PV diagrams for an exponential disk, spatially convolved with a 066055 Gaussian beam. We take into account the effect of pressure support, reducing the observed rotation velocity (e.g., Wuyts et al., 2016; Burkert et al., 2010). The effective radii of the gas disks are fixed to those measured in Section 3.2. For U4-16795, we infer an inclination, , from the axis ratio of the 870 m dust continuum emission as for symmetric oblate disks with an intrinsic thickness of 0.25 (van der Wel et al., 2014). The inclination is dex (corresponding to °). This uncertainty propagates to the dynamical mass estimate as . As the effective radius and the inclination are fixed, the remaining free parameters in the model are dynamical mass, , and local velocity dispersion, . For U4-16504, we adopt the average of possible inclinations () in the case of isotropically oriented disks (see Appendix of Law et al. 2009). As the standard deviation is derived as (/=0.22, we adopt the uncertainty of 0.09 dex.
In the PV diagrams, we use the pixels with a flux above 3 to calculate the chi-squared values between the data and the models. Figure 3 shows the best-fit models to minimize the chi-squared value along with the residual maps after subtracting the model from the data. The best fit models for the two galaxies have dynamical masses for U4-16795 and for U4-16504. These uncertainties are based on the reduced-chi squared values corresponding to a p-value above 5%. In the dynamical mass measurements, after taking into account the uncertainties of effective radius and inclination, our final uncertainties are +0.13 dex (-0.12 dex) for U4-16795 and +0.17 dex (-0.15 dex) for U4-16504.
We also derive the rotation velocity and local velocity dispersion from the best fit models. We find km s-1 and for U4-16795 and km s-1 and km s-1 for U4-16504. We note that they have a larger local velocity dispersion than the mean value (=50 km s-1) in a large sample of rotation-dominated galaxies at (Wisnioski et al., 2015). This means that both dusty star-forming cores are rotation-dominated with the ratio of the maximum rotation velocity to local velocity dispersion of for U4-16795 and for U4-16504.
4. Dust and gas mass estimates
4.1. Dust mass
Rest-frame 850 m continuum emission is a good indicator of dust mass, . For galaxies at , rest-frame 850 m (3 mm in the observed frame) fluxes are often extrapolated from 1 mm fluxes using a modified-blackbody radiation (MBB) model with dust temperature of 25 K and the dust emissivity, , with an index of (e.g., Scoville et al., 2016) as
| (1) |
where is the luminosity distance. Making 870 m maps with the same synthesized beam as the 3 mm maps, we measure peak fluxes of mJy beam-1 for U4-16795 and mJy beam-1 for U4-16504. They correspond to 77% and 78% of the total flux within a 15 aperture. Although the MBB models give the extrapolated 3 mm fluxes of Jy beam-1 for U4-16795 and Jy beam-1 for U4-16504, we do not detect the 3 mm continuum emission above 5 significance.
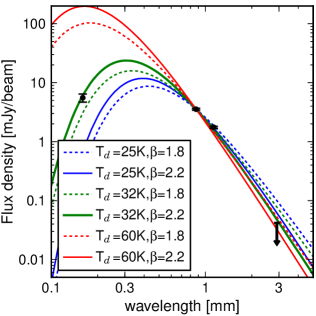
Focusing on U4-16795, we evaluate the assumption of and . We also use the ALMA 1.1 mm flux (mJy beam-1; Tadaki et al. 2015). Figure 4 shows several MBB models with different dust temperature and emissivity index. The 5 upper limit at 3 mm rejects the models with 25 K, suggesting a higher or a steeper . MBB models with an emissivity index in the usual range (; Dunne & Eales 2001, e.g.,) require a much higher dust temperature of K to explain the faint 3 mm flux while they are inconsistent with the 160 m flux. Therefore, we reasonably assume 32 K and to explain all data points. In the range of the dust emissivity of =0.4-1.5 g-1cm2 (Dunne et al., 2003), the 3 mm-based dust mass is for U4-16795 and for U4-16504. If we use the 870 m flux assuming 25 K and , the estimated dust mass would become larger by 0.5 dex.
4.2. Gas mass
We estimate the CO-based gas masses using two conversion factors, (K km s-1pc-2)-1 (Galactic value) and (K km s-1pc-2)-1 (starburst value; Downes & Solomon 1998). We then compare the gas masses derived with these two different conversion factors to the dynamical and stellar masses. The CO emission line is assumed to be thermalized (Bolatto et al., 2015). These mass measurements are summarized in Table 1. If we adopt the Galactic conversion factor, the baryonic mass fraction, defined as , exceeds unity. Monte Carlo simulations incorporating the uncertainties of gas, stellar and dynamical mass show that the probability of the baryonic mass fraction being less than one is 2.3% for U4-16795 and 17.1% for U4-16504. In the case of the starburst conversion factor, the probability is increased to 24.7% and 55.3%, respectively.
We also independently constrain the gas mass from the 3 mm-based dust mass, assuming a gas-to-dust ratio of 120 (Wilson et al., 2008). The 5 upper limit is (Table 1). The two independent approaches suggest that the starburst conversion factor is appropriate in the compact dusty star-forming region. Adopting the starburst conversion factor to derive the CO-based gas mass, we find the gas-to-dynamical mass fraction to be for U4-16795 and for U4-16504 and the gas depletion timescale to be Myr and Myr, respectively. When the uncertainties of the conversion factor are taken into consideration, those in the gas mass estimate become larger.
5. Discussion and Summary
Using ALMA observations of CO emission, we find that the compact molecular gas in the star-forming cores of two massive galaxies is rapidly rotating. This has implications for both the formation and subsequent evolution of the cores of massive galaxies. The formation mechanism appears to be dissipative and the observed rotation indicates that at least some angular momentum is preserved in the star-forming molecular gas. Simulations show this could happen due to a gas-rich merger or disk instabilities (e.g., Zolotov et al., 2015; Wellons et al., 2015).
The two massive star-forming galaxies are both rotation-dominated with and . Kinematic studies of massive quiescent galaxies suggest they are rotating (Newman et al., 2015), although with lower than found here for their progenitors. Additionally, the descendants of these galaxies in the local universe are slow rotators with nearly an order of magnitude lower (Cappellari, 2016), suggesting that the galaxies we observe need to lose significant net angular momentum in the intervening time. Our results support a picture in which net angular momentum is initially reduced during the quenching process and further during a growth phase by dry mergers.
We find that the molecular gas of the two massive galaxies at is compact with kpc. Such a concentration of star-forming gas is consistent with a scenario in which a wet compaction events (radial transport of gas) could build the cores of massive galaxies (Zolotov et al., 2015). The two galaxies host even more compact starbursts with a high SFR surface density as traced by the dust continuum emission, rapidly building up dense cores and transforming the galaxy morphology from disk-dominated to bulge-dominated (Tadaki et al., 2017). If the gas mass in these galaxies is as low as our data suggest, we may be witnessing the end of the growth of these dense cores due to star formation.
Our independent measurements of dynamical, stellar, gas and dust mass suggest that the starburst CO-to-H2 conversion factor is appropriate for the spatially resolved cores. These dense cores are likely to be formed in extreme environments like central regions of local ULIRGs. The same conclusion is obtained by recent [C i] observations of a star-forming galaxy in the similar mass and redshift range (Popping et al., 2017) and CO observations of starburst galaxies above the main-sequence (Sargent et al., 2014). On the other hand, it is not clear yet that the starburst conversion factor is appropriate for entire galaxies. Tacconi et al. (2017) investigated the variations in molecular gas properties for 650 galaxies over by compiling CO and dust continuum data and does not find the presence of such a large change in the conversion factor. A statistical study of the kinematics of the molecular gas is an essential next step for getting a consensus on this issue. However, high-spatial resolution CO observations suffer from missing flux and are more time-consuming compared to dust continuum observations. A combination of medium-resolution CO and high-resolution dust continuum observations is reasonable in terms of observing time and a powerful tool for characterizing the dynamical state of molecular gas in distant galaxies.
We thank the referee for constructive comments. This paper makes use of the following ALMA data: ADS/JAO.ALMA#2013.1.00742.S. ALMA is a partnership of ESO (representing its member states), NSF (USA) and NINS (Japan), together with NRC (Canada), NSC and ASIAA (Taiwan), and KASI (Republic of Korea), in cooperation with the Republic of Chile. The Joint ALMA Observatory is operated by ESO, AUI/NRAO and NAOJ. K.T. was supported by the ALMA Japan Research Grant of NAOJ Chile Observatory, NAOJ-ALMA-57. This paper is produced as a part of our collaborations through the joint project supported by JSPS and DAAD under the Japan - German Research Cooperative Program.
References
- Barro et al. (2014) Barro, G., Trump, J. R., Koo, D. C., et al. 2014, ApJ, 795, 145
- Barro et al. (2016) Barro, G., Kriek, M., Pérez-González, P. G., et al. 2016, ApJ, 827, L32
- Belli et al. (2015) Belli, S., Newman, A. B., & Ellis, R. S. 2015, ApJ, 799, 206
- Bolatto et al. (2013) Bolatto, A. D., Wolfire, M., & Leroy, A. K. 2013, ARA&A, 51, 207
- Bolatto et al. (2015) Bolatto, A. D., Warren, S. R., Leroy, A. K., et al. 2015, ApJ, 809, 175
- Bruzual & Charlot (2003) Bruzual, G., & Charlot, S. 2003, MNRAS, 344, 1000
- Burkert et al. (2010) Burkert, A., Genzel, R., Bouché, N., et al. 2010, ApJ, 725, 2324
- Calzetti et al. (2000) Calzetti, D., Armus, L., Bohlin, R. C., et al. 2000, ApJ, 533, 682
- Cappellari (2016) Cappellari, M. 2016, ARA&A, 54, 597
- Chabrier (2003) Chabrier, G. 2003, PASP, 115, 763
- Davies et al. (2011) Davies, R., Förster Schreiber, N. M., Cresci, G., et al. 2011, ApJ, 741, 69
- Downes & Solomon (1998) Downes, D., & Solomon, P. M. 1998, ApJ, 507, 615
- Dunne et al. (2003) Dunne, L., Eales, S., Ivison, R., Morgan, H., & Edmunds, M. 2003, Nature, 424, 285
- Dunne & Eales (2001) Dunne, L., & Eales, S. A. 2001, MNRAS, 327, 697
- Fang et al. (2013) Fang, J. J., Faber, S. M., Koo, D. C., & Dekel, A. 2013, ApJ, 776, 63
- Fontana et al. (2014) Fontana, A., Dunlop, J. S., Paris, D., et al. 2014, A&A, 570, A11
- Galametz et al. (2012) Galametz, M., Kennicutt, R. C., Albrecht, M., et al. 2012, MNRAS, 425, 763
- Hodge et al. (2016) Hodge, J. A., Swinbank, A. M., Simpson, J. M., et al. 2016, ApJ, 833, 103
- Ivison et al. (2013) Ivison, R. J., Swinbank, A. M., Smail, I., et al. 2013, ApJ, 772, 137
- Kriek et al. (2009) Kriek, M., van Dokkum, P. G., Labbé, I., et al. 2009, ApJ, 700, 221, 221
- Law et al. (2009) Law, D. R., Steidel, C. C., Erb, D. K., et al. 2009, ApJ, 697, 2057
- Lutz et al. (2011) Lutz, D., Poglitsch, A., Altieri, B., et al. 2011, A&A, 532, A90
- Magrini et al. (2011) Magrini, L., Bianchi, S., Corbelli, E., et al. 2011, A&A, 535, A13
- Martí-Vidal et al. (2014) Martí-Vidal, I., Vlemmings, W. H. T., Muller, S., & Casey, S. 2014, A&A, 563, A136
- McMullin et al. (2007) McMullin, J. P., Waters, B., Schiebel, D., Young, W., & Golap, K. 2007, in Astronomical Society of the Pacific Conference Series, Vol. 376, Astronomical Data Analysis Software and Systems XVI, ed. R. A. Shaw, F. Hill, & D. J. Bell, 127
- Narayanan et al. (2012) Narayanan, D., Krumholz, M. R., Ostriker, E. C., & Hernquist, L. 2012, MNRAS, 421, 3127
- Nelson et al. (2014) Nelson, E., van Dokkum, P., Franx, M., et al. 2014, Nature, 513, 394
- Nelson et al. (2016) Nelson, E. J., van Dokkum, P. G., Momcheva, I. G., et al. 2016, ApJ, 817, L9
- Newman et al. (2015) Newman, A. B., Belli, S., & Ellis, R. S. 2015, ApJ, 813, L7
- Onodera et al. (2015) Onodera, M., Carollo, C. M., Renzini, A., et al. 2015, ApJ, 808, 161
- Popping et al. (2017) Popping, G., Decarli, R., Man, A. W. S., et al. 2017, ArXiv e-prints, arXiv:1703.05764
- Sargent et al. (2014) Sargent, M. T., Daddi, E., Béthermin, M., et al. 2014, ApJ, 793, 19
- Scoville et al. (2016) Scoville, N., Sheth, K., Aussel, H., et al. 2016, ApJ, 820, 83
- Skelton et al. (2014) Skelton, R. E., Whitaker, K. E., Momcheva, I. G., et al. 2014, ApJS, 214, 24
- Speagle et al. (2014) Speagle, J. S., Steinhardt, C. L., Capak, P. L., & Silverman, J. D. 2014, ApJS, 214, 15
- Tacchella et al. (2017) Tacchella, S., Carollo, C. M., Forster Schreiber, N. M., et al. 2017, ArXiv e-prints, arXiv:1704.00733
- Tacconi et al. (2008) Tacconi, L. J., Genzel, R., Smail, I., et al. 2008, ApJ, 680, 246
- Tacconi et al. (2017) Tacconi, L. J., Genzel, R., Saintonge, A., et al. 2017, ArXiv e-prints, arXiv:1702.01140
- Tadaki et al. (2013) Tadaki, K.-i., Kodama, T., Tanaka, I., et al. 2013, ApJ, 778, 114
- Tadaki et al. (2015) Tadaki, K.-i., Kohno, K., Kodama, T., et al. 2015, ApJ, 811, L3
- Tadaki et al. (2017) Tadaki, K.-i., Genzel, R., Kodama, T., et al. 2017, ApJ, 834, 135
- van der Wel et al. (2014) van der Wel, A., Chang, Y.-Y., Bell, E. F., et al. 2014, ApJ, 792, L6
- van Dokkum et al. (2014) van Dokkum, P. G., Bezanson, R., van der Wel, A., et al. 2014, ApJ, 791, 45, 45
- Wellons et al. (2015) Wellons, S., Torrey, P., Ma, C.-P., et al. 2015, MNRAS, 449, 361
- Wilson et al. (2008) Wilson, C. D., Petitpas, G. R., Iono, D., et al. 2008, ApJS, 178, 189
- Wisnioski et al. (2015) Wisnioski, E., Förster Schreiber, N. M., Wuyts, S., et al. 2015, ApJ, 799, 209
- Wuyts et al. (2011a) Wuyts, S., Förster Schreiber, N. M., van der Wel, A., et al. 2011a, ApJ, 742, 96
- Wuyts et al. (2011b) Wuyts, S., Förster Schreiber, N. M., Lutz, D., et al. 2011b, ApJ, 738, 106
- Wuyts et al. (2016) Wuyts, S., Förster Schreiber, N. M., Wisnioski, E., et al. 2016, ApJ, 831, 149
- Zolotov et al. (2015) Zolotov, A., Dekel, A., Mandelker, N., et al. 2015, MNRAS, 450, 2327