Near-Infrared MOSFIRE Spectra of Dusty Star-Forming Galaxies at
Abstract
We present near-infrared and optical spectroscopic observations of a sample of 450m and 850m-selected dusty star-forming galaxies (DSFGs) identified in a 400 arcmin2 area in the COSMOS field. Thirty-one sources of the 114 targets were spectroscopically confirmed at , identified primarily in the near-infrared with Keck MOSFIRE and some in the optical with Keck LRIS and DEIMOS. The low rate of confirmation is attributable both to high rest-frame optical obscuration in our targets and limited sensitivity to certain redshift ranges. The median spectroscopic redshift is , comparable to for the larger parent DSFG sample; the median stellar mass is M⊙, star-formation rate is 16050 M⊙ yr-1, and attenuation is . The high-quality photometric redshifts available in the COSMOS field allow us to test the robustness of photometric redshifts for DSFGs. We find a subset (11/31%) of DSFGs with inaccurate () or non-existent photometric redshifts; these have very distinct spectral energy distributions from the remaining DSFGs, suggesting a decoupling of highly obscured and unobscured components. We present a composite rest-frame 4300–7300Å spectrum for DSFGs, and find evidence of 20030 km s-1 gas outflows. Nebular line emission for a sub-sample of our detections indicate that hard ionizing radiation fields are ubiquitous in high- DSFGs, even more so than typical mass or UV-selected high- galaxies. We also confirm the extreme level of dust obscuration in DSFGs, measuring very high Balmer decrements, and very high ratios of IR to UV and IR to H luminosities. This work demonstrates the need to broaden the use of wide bandwidth technology in the millimeter to spectroscopically confirm larger samples of high- DSFGs, as the difficulty in confirming such sources at optical/near-infrared wavelengths is exceedingly challenging given their obscuration.
Subject headings:
galaxies: evolution galaxies: high-redshift galaxies: infrared galaxies: starbursts submillimeter: galaxies1. Introduction
The most challenging observational hurdle in the study of extremely obscured galaxies has been obtaining accurate spectroscopic redshifts (Chapman et al., 2003; Swinbank et al., 2004; Chapman et al., 2005). These redshifts present a major bottleneck in understanding the physics of these extreme star-formers, and limit our ability to test evolutionary models derived from simulations (e.g. Lacey et al., 2015; Narayanan, 2015). Gaining insight into the physics of Dusty Star-Forming Galaxies (DSFGs) is of crucial importance in constraining massive galaxy formation and the buildup of stellar mass at early times, when these systems dominate cosmic star-formation (see reviews of Casey, Narayanan & Cooray, 2014; Blain et al., 2002).
Since the first identification of submillimeter-luminous galaxies with the Submillimeter Common User Bolometric Array (SCUBA) instrument (Smail, Ivison & Blain, 1997; Hughes et al., 1998; Barger et al., 1998), the characterization of DSFGs has been a top priority of extragalactic astrophysics. The large beamsize of SCUBA at the James Clerk Maxwell Telescope (JCMT) made the immediate identification of DSFGs’ multiwavelength counterparts difficult. However, the correlation between radio and FIR luminosity in starburst galaxies (Helou, Soifer & Rowan-Robinson, 1985; Condon, 1992) provided a means of using radio interferometric positions to identify the likely source of FIR/submillimeter emission (Yun, Reddy & Condon, 2001; Chapman et al., 2004, 2005). Yet, redshift identification was still a challenge. Optical/near-infrared photometric redshifts are often out of reach for these highly obscured galaxies, and obtaining spectroscopic redshifts required the most sensitive optical and near-IR spectrographs on the largest telescopes, such as the Low Resolution Imaging Spectrometer (LRIS) on Keck (Oke et al., 1995). With star-formation rates exceeding 100 M⊙ yr-1, only 0.5% of rest-frame UV/optical starlight, and optical/ultraviolet emission features, are unobscured by dust (Howell et al., 2010; Casey et al., 2014).
The most comprehensive survey of spectroscopic redshifts for DSFGs was presented in Chapman et al. (2005). They present 75 redshifts for submillimeter galaxies (SMGs111In this paper and in recent years, we have adopted the term DSFG as a more general name for SMGs. SMGs have been formally defined in the past as having an 850m flux density in excess of 2 mJy, while DSFG represents any galaxy directly detected at wavelengths 70m–2 mm with current and past facilities, with the exclusion of ALMA which is much more sensitive.) peaking at . This sample was the primary sample pursued for follow-up, from CO molecular gas studies (Greve et al., 2005; Tacconi et al., 2006, 2008; Engel et al., 2010; Bothwell et al., 2010, 2013; Casey et al., 2011), to rest-frame optical follow-up (Swinbank et al., 2004; Menéndez-Delmestre et al., 2013; Alaghband-Zadeh et al., 2012), to mid-infrared follow-up from Spitzer IRS (Pope et al., 2008; Menéndez-Delmestre et al., 2009; Coppin et al., 2010), and high-resolution radio continuum mapping (Biggs & Ivison, 2008; Casey et al., 2009). These studies pointed out that the 850m-selected DSFG population is primarily made up of major galaxy mergers at the tip of the luminosity function and could be more heterogeneous in triggering mechanism at intermediate luminosities. Nevertheless, they exhibit exceptional star-formation rates which are predominantly short-lived (Bothwell et al., 2013; Swinbank et al., 2014) and result in the formation of the most massive galaxies in the Universe.
| Slitmask | Obs. | Mask Position | Exp. Time | Exp. Time | NS2 | Nall | N() | %-DSFGs conf. |
|---|---|---|---|---|---|---|---|---|
| Name | Date | -band [s] | -band [s] | DSFGs | [%] | |||
| cosm1 | 21-Dec-12 | 10:00:10.2502:19:44.71 | 2880 | 1920 | 12 | 25 | 3 | 25% |
| cosm2 | 21-Dec-12 | 10:00:18.9402:24:28.70 | 2520 | 1200 | 10 | 24 | 4 | 40% |
| cosm3 | 21-Dec-12 | 10:00:23.3902:30:37.29 | 2520 | 720 | 12 | 24 | 1 | 8% |
| cosm4 | 31-Dec-13 | 10:00:31.9102:20:13.00 | 3600 | 2880 | 16 | 21 | 9 | 56% |
| cosm5 | 19-Jan-14 | 10:00:51.1302:20:57.92 | 3240 | 1440 | 10 | 25 | 4 | 40% |
| cosm6 | 31-Dec-13 | 10:00:01.1502:24:35.91 | 3600 | 1920 | 13 | 23 | 3 | 23% |
| cosm7 | 31-Dec-13 | 09:59:51.5402:21:07.69 | 2880 | 1320 | 14 | 25 | 6 | 43% |
| cosm8 | 19-Jan-14 | 10:00:15.1602:16:38.68 | 3600 | 2400 | 15 | 26 | 4 | 27% |
| cosm9 | 19-Jan-14 | 10:00:00.6702:28:15.20 | 3600 | 2880 | 16 | 24 | 5 | 31% |
| cosm10 | 19-Jan-14 | 10:01:00.0502:24:59.20 | 2880 | 10 | 24 | 0 | 0% | |
| TOTAL | 102 | 31 | 29.8% |
Table Description. Our MOSFIRE observations consisted of 10 slitmask configurations, nine of which were observed in both - and -band. The exposure time and number of targets per mask varied as a function of real-time observing decisions based on accessibility of the field, intermittent cloud cover, and higher-priority vs. lower-priority targets. The number of Scuba-2 sources that were targeted per slitmask is given in while the total number of targets on that slitmask is given in . The number of DSFGs that were spectroscopically confirmed on the slitmask, a subset of , is given in the N() DSFGs column. The percentage of DSFGs with spectroscopic confirmations on the given slitmask is given in the last column, ranging from 0–56%, and averaging 29.8%.
Though those with spectroscopic identification have proved very valuable to DSFG research, there are still few constraints on the 50% of the population of DSFGs which have not been detected via Lyman- emission or other rest-frame ultraviolet tracers. Do they lie at higher redshifts? Are they significantly more obscured by dust? Are their physical triggering mechanisms different from those with detectable UV/optical emission features? To address the unknown selection bias the UV/optical (and radio detected) sub-sample may place on our interpretation of DSFGs, the ALESS Survey has set out to meticulously characterize an unbiased population of 870m-selected DSFGs with rest-frame UV/optical spectroscopy and submillimeter interferometry from the Atacama Large Millimeter Array (ALMA Weiß et al., 2009; Wardlow et al., 2011; Hodge et al., 2013). Spectroscopic success rates for DSFGs with known interferometric positions is 50% using optical/near-infrared (Danielson et al., 2017). While ALMA has ushered in a new era of spectroscopically confirming DSFGs via direct emission of CO and [CII] at long wavelengths, this unfortunately is still prohibitively expensive for large samples of unlensed galaxies (c.f. Vieira et al., 2013).
We have embarked on an independent spectroscopic follow-up campaign of DSFGs selected at 450m and 850m using the SCUBA-2 instrument in the COSMOS field (Casey et al., 2013). Due to the extreme obscuration present in DSFGs at rest-frame UV wavelengths, our spectroscopic campaign has primarily focused on rest-frame optical features detectable with the superbly sensitive MOSFIRE instrument on Keck (McLean et al., 2012). Though only a subset of DSFGs in this sample have interferometric measurements from ALMA and the Plateau de Bure Interferometer, 62% of the DSFGs in the sample are detected at 450m, which has a significantly smaller beamsize (7″) than 850m (15″) or 870m on LABOCA (19″).
Here we present the results of this spectroscopic survey. In § 2 we describe the spectroscopic data. In § 3 we present an analysis of the sample’s redshifts, contrasting photometric and spectroscopic identifications, and we discuss individual source characteristics in § 4. In § 5 we present a composite rest-frame optical spectrum comprised of 20 DSFGs, and we compare to previous composites presented for DSFG samples. In § 6 we present an analysis of the sample’s Active Galactic Nuclei (AGN) using X-ray coverage in the field. In § 7 we present nebular line diagnostics for the handful of galaxies and use them to analyze possible physical drivers of line emission. In § 8 we discuss the H luminosities of the DSFGs we sample, in relation to their SFRs measured at long wavelengths. In § 9 we present our conclusions. Throughout, we assume a CDM cosmology with =71 km s-1 Mpc-1 and =0.27 (Hinshaw et al., 2009). We also assume a Chabrier initial mass function (IMF; Chabrier, 2003).
2. Observations & Data
The parent sample for spectroscopic follow-up we use in this analysis is the full set of 165 Scuba-2-identified DSFGs in COSMOS, as summarized in Casey et al. (2013). The 1- sensitivity of the Scuba-2 maps used were 4.13 mJy and 0.80 mJy at 450m and 850m respectively. Of the 165 independent sources identified, 78 were detected above 3.6 at 450m and 99 above the same threshold at 850m. And additional eight sources were identified at marginal significance at both 450m and 850m. About 2/3 of the sample are detected in both 450m and 850m bands. With positional uncertainties of 1–2.5 ″, optical/near-infrared counterparts were identified directly from submillimeter positions weighted by a -value. Sixty-one percent of the entire sample has ‘high confidence’ OIR counterparts identified using this method, with 5% contamination; the remaining 39% of the parent sample is less well matched. The targets which were observed spectroscopically were not biased towards either secure or low confidence populations. We discuss the relationship of the spectroscopic sample to the parent sample more in § 3 and refer the reader to Casey et al. (2013) for more details.
Our near-infrared spectroscopic follow-up campaign was carried out on the Keck 1 MOSFIRE instrument on 2012 December 21, 2013 December 31 and 2014 January 19. Observing conditions for these nights were all favorable, with clear skies and 0″.5–0″.7 seeing. We observed ten MOSFIRE masks, all designed in the MAGMA mask design software package for MOSFIRE in -band, and nine of the same masks in -band all using an ABBA 1″.5 nod pattern. Individual exposures in -band were 120 s while individual exposures in -band were 180 s. Observation details are given in Table 1. Total on-source integration times varied from 720–2880 s in the -band and 2520–3600 s in the -band. No -band or -band observations were taken. To maximize the number of high priority targets per mask, we made some minor sacrifices in spectral coverage; on average each primary target had complete wavelength coverage from 1.45–1.75m in -band and from 1.92–2.40m in -band. We used the MOSPY Data Reduction Pipeline (DRP) package for spectral reduction. In total, 102 DSFG targets were observed with MOSFIRE.
We also present observations obtained with the DEIMOS instrument on Keck II, following-up the same SCUBA-2 selected sample at optical wavelengths. DEIMOS observations were carried out on 10-11 December 2012, 07 February 2013, and 28 October 2014. Conditions were suboptimal on 10-11 December 2012 with intermittent cloud cover and 1.1-1.3″ seeing. Conditions on 07 February 2013 were poor and completely weathered out during the LST when the COSMOS field was accessible. We used the 600 lines mm-1 grating with a 7200 Å blaze angle (resulting in dispersion of 0.65 Å) and the GG455 filter to block out higher-order light. Wavelength coverage varied with sources’ positions on the slit-mask, averaging 4800–9500 Å. Twelve sources were observed with DEIMOS that were not observed with MOSFIRE, but the majority of DEIMOS observations overlapped with MOSFIRE targets.

All spectra, from MOSFIRE and DEIMOS, were extracted using the iraf routine apall. Apertures were set interactively, depending on the seeing and whether or not the galaxy is spatially resolved on the slit, and background is subtracted using simultaneously-fit sky apertures. Sources are corrected for a trace only when continuum emission is of significant signal-to-noise across the entire spectral region, otherwise a fixed aperture is assumed. Optimal extraction is set with variance weighting.
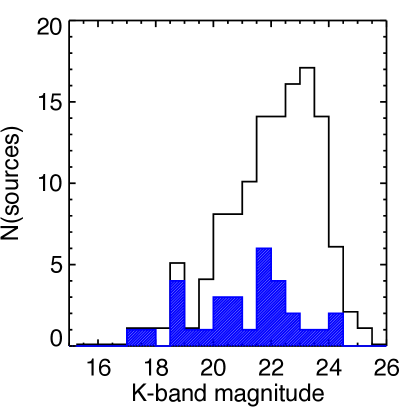
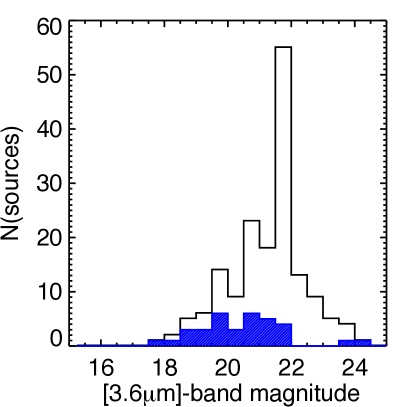
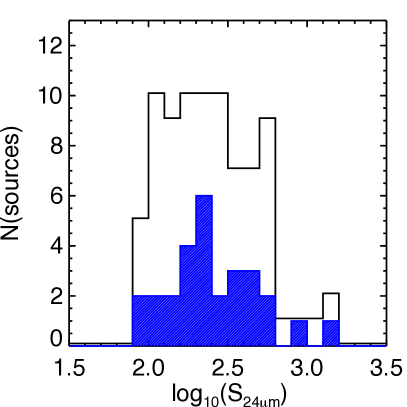
Figure 1 compares the characteristics of the parent sample of SCUBA-2 galaxies with the sources which have been spectroscopically confirmed. While one might expect the strongest correlation with -band magnitude (as this is the wavelength regime of the MOSFIRE spectroscopy), we see a relatively uniform distribution in magnitude for confirmed sources. Though this does suggest a lower fraction of confirmations at fainter magnitudes, the distributions are not statistically inconsistent with the parent sample. The distribution in 24m flux densities is similarly uncorrelated with spectroscopic confirmation. The statistics for 1.4 GHz radio emission is similar, yet has fewer sources than our 24m distribution. We attribute the lack of correlation to our spectroscopic follow-up strategy which was intended to not be biased with relative near-infrared or optical luminosity. The selection of targets was focused on maximizing the number of SCUBA-2 targets per mask and so represents a spatial selection on 6′ scales, not noticeably biased with respect to sample characteristics.
We also make use of the extensive multi-wavelength ancillary data available in the COSMOS field (Capak et al., 2007), including over 30 optical and near-infrared photometry and associated photometric redshifts (Ilbert et al., 2013; Lagache, 2015), spectroscopic redshifts (Lilly et al., 2009), X-ray imaging from Chandra (Civano et al., 2012), Herschel PEP/PACS and HerMES/SPIRE 100–500m catalogs (Lutz et al., 2011; Oliver et al., 2012; Lee et al., 2013), and deep radio continuum mapping at 1.4 GHz (Schinnerer et al., 2007) and 3.0 GHz (Smolcic et al., 2016). It should be emphasized that the quality of photometry in the COSMOS field is superb and provides a unique opportunity to test the reliability of high quality photometric redshifts for highly obscured galaxies. Seven of our spectroscopically-confirmed sources also have 1.1 mm ALMA dust continuum maps available from the ALMA archive, programs #2013.1.00118.S, 2013.1.00151.S, and 2011.1.00539.S. Five of the seven sources were correctly identified using multiwavelength counterparts (71%), as we discuss further in § 4.1. Those that were incorrectly identified were still detected, but submm counterparts were misidentified. The ALMA 1.1 mm maps range in RMS from 0.08–0.15 mJy/beam, sources are detected with a median S/N=10, and the median ratio between 850m flux density and 1.1 mm flux density is 3.90.6.
3. Photometric Redshift Analysis
Since COSMOS has some of the most precisely constrained photometric redshifts for even the faintest sources, we are able to assess the quality of those photometric redshifts for highly obscured sources like DSFGs (e.g. Wardlow et al., 2011). While our original sample in Casey et al. (2013) made use of the then-current COSMOS team photometric redshift catalog (Ilbert et al., 2013), in this analysis we update those photometric redshifts to the most current catalog (Laigle et al., 2016).
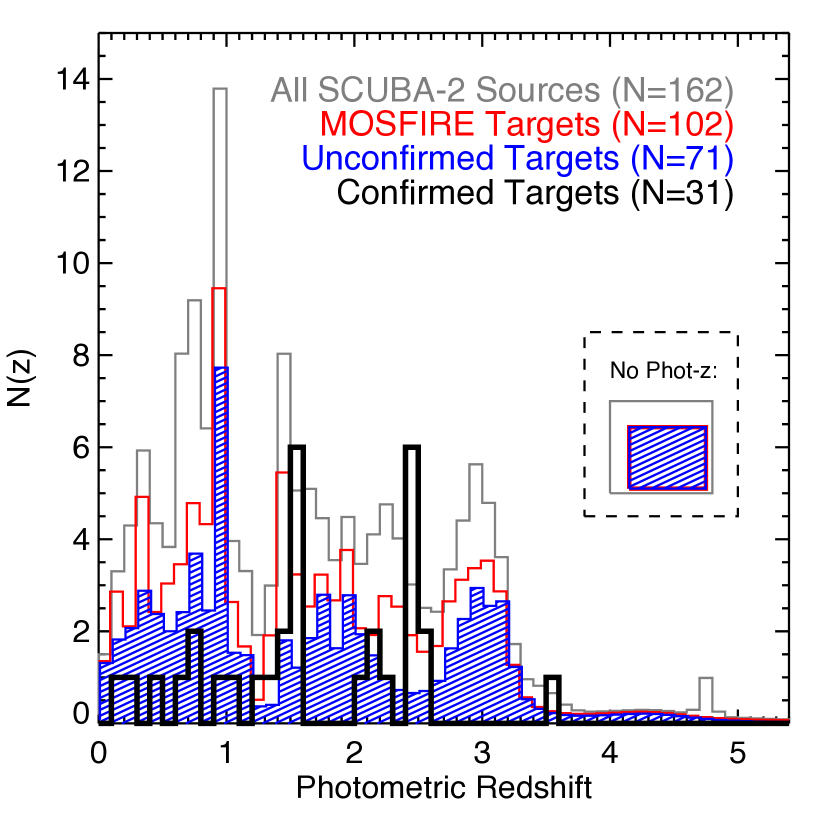
Figure 2 shows the distribution of photometric redshifts (phot-’s) for the parent sample of 162 SCUBA-2 sources in the COSMOS field. This includes both 450m and 850m-selected sources, as well as ‘marginal’ detections identified at both wavelengths (denoted with a preceding ‘m’), at a signal-to-noise of in both filters (see Casey et al., 2013). It should be noted that this redshift distribution is significantly different than the distribution of either the 450m or 850m sources, who peak at and respectively. The median of this parent distribution is , similar to the results of Roseboom et al. (2013). We attribute this to the inclusion of the marginally detected 450m and 850m sources to our spectroscopic follow-up sample: these sources are less submillimeter luminous and so are likely at lower redshifts (see also Béthermin et al., 2015).
Figure 2 also shows the phot-z distribution for sources targeted by our MOSFIRE campaign (102 sources), and those which have not been confirmed (71 sources) and confirmed (31 sources). Those sources which have been spectroscopically confirmed do trend towards redshift ranges which are well-suited to the identification of strong emission and absorption features in the observed - and -bands (i.e. and ). Many sources with photometric redshifts outside of this range did show continuum emission in our - and -band observations, but the lack of discernable emission or absorption feature makes redshift identification not possible. sSources with photometric redshifts in our optimum range without spectroscopic confirmations are on average 1 magnitude fainter in the near-infrared than those that have been spectroscopically confirmed. The lack of spectroscopic confirmation, however, is probably attributable to a mix of luminosity, geometry,
![[Uncaptioned image]](/html/1703.10168/assets/x8.png)
Figure 4 — continued.
and inaccurate photometric redshifts for dust-obscured sources.
Figure 3 illustrates the correlation of photometric redshift with spectroscopic redshift. For confirmed DSFGs with photometric redshifts in COSMOS, these photometric redshifts prove to be fairly reliable, with an average 0.05, only moderately worse than the average for ‘normal,’ less obscured galaxies. This is encouraging, as it demonstrates that high-quality photometric redshifts and a broad range of templates that include a range of star-formation histories can accurately reflect a DSFG’s redshift. However, the distribution of is broadened relative to normal galaxies with many examples of catastrophic failures: 4 sources have and 7 lack any photometric redshift solution.
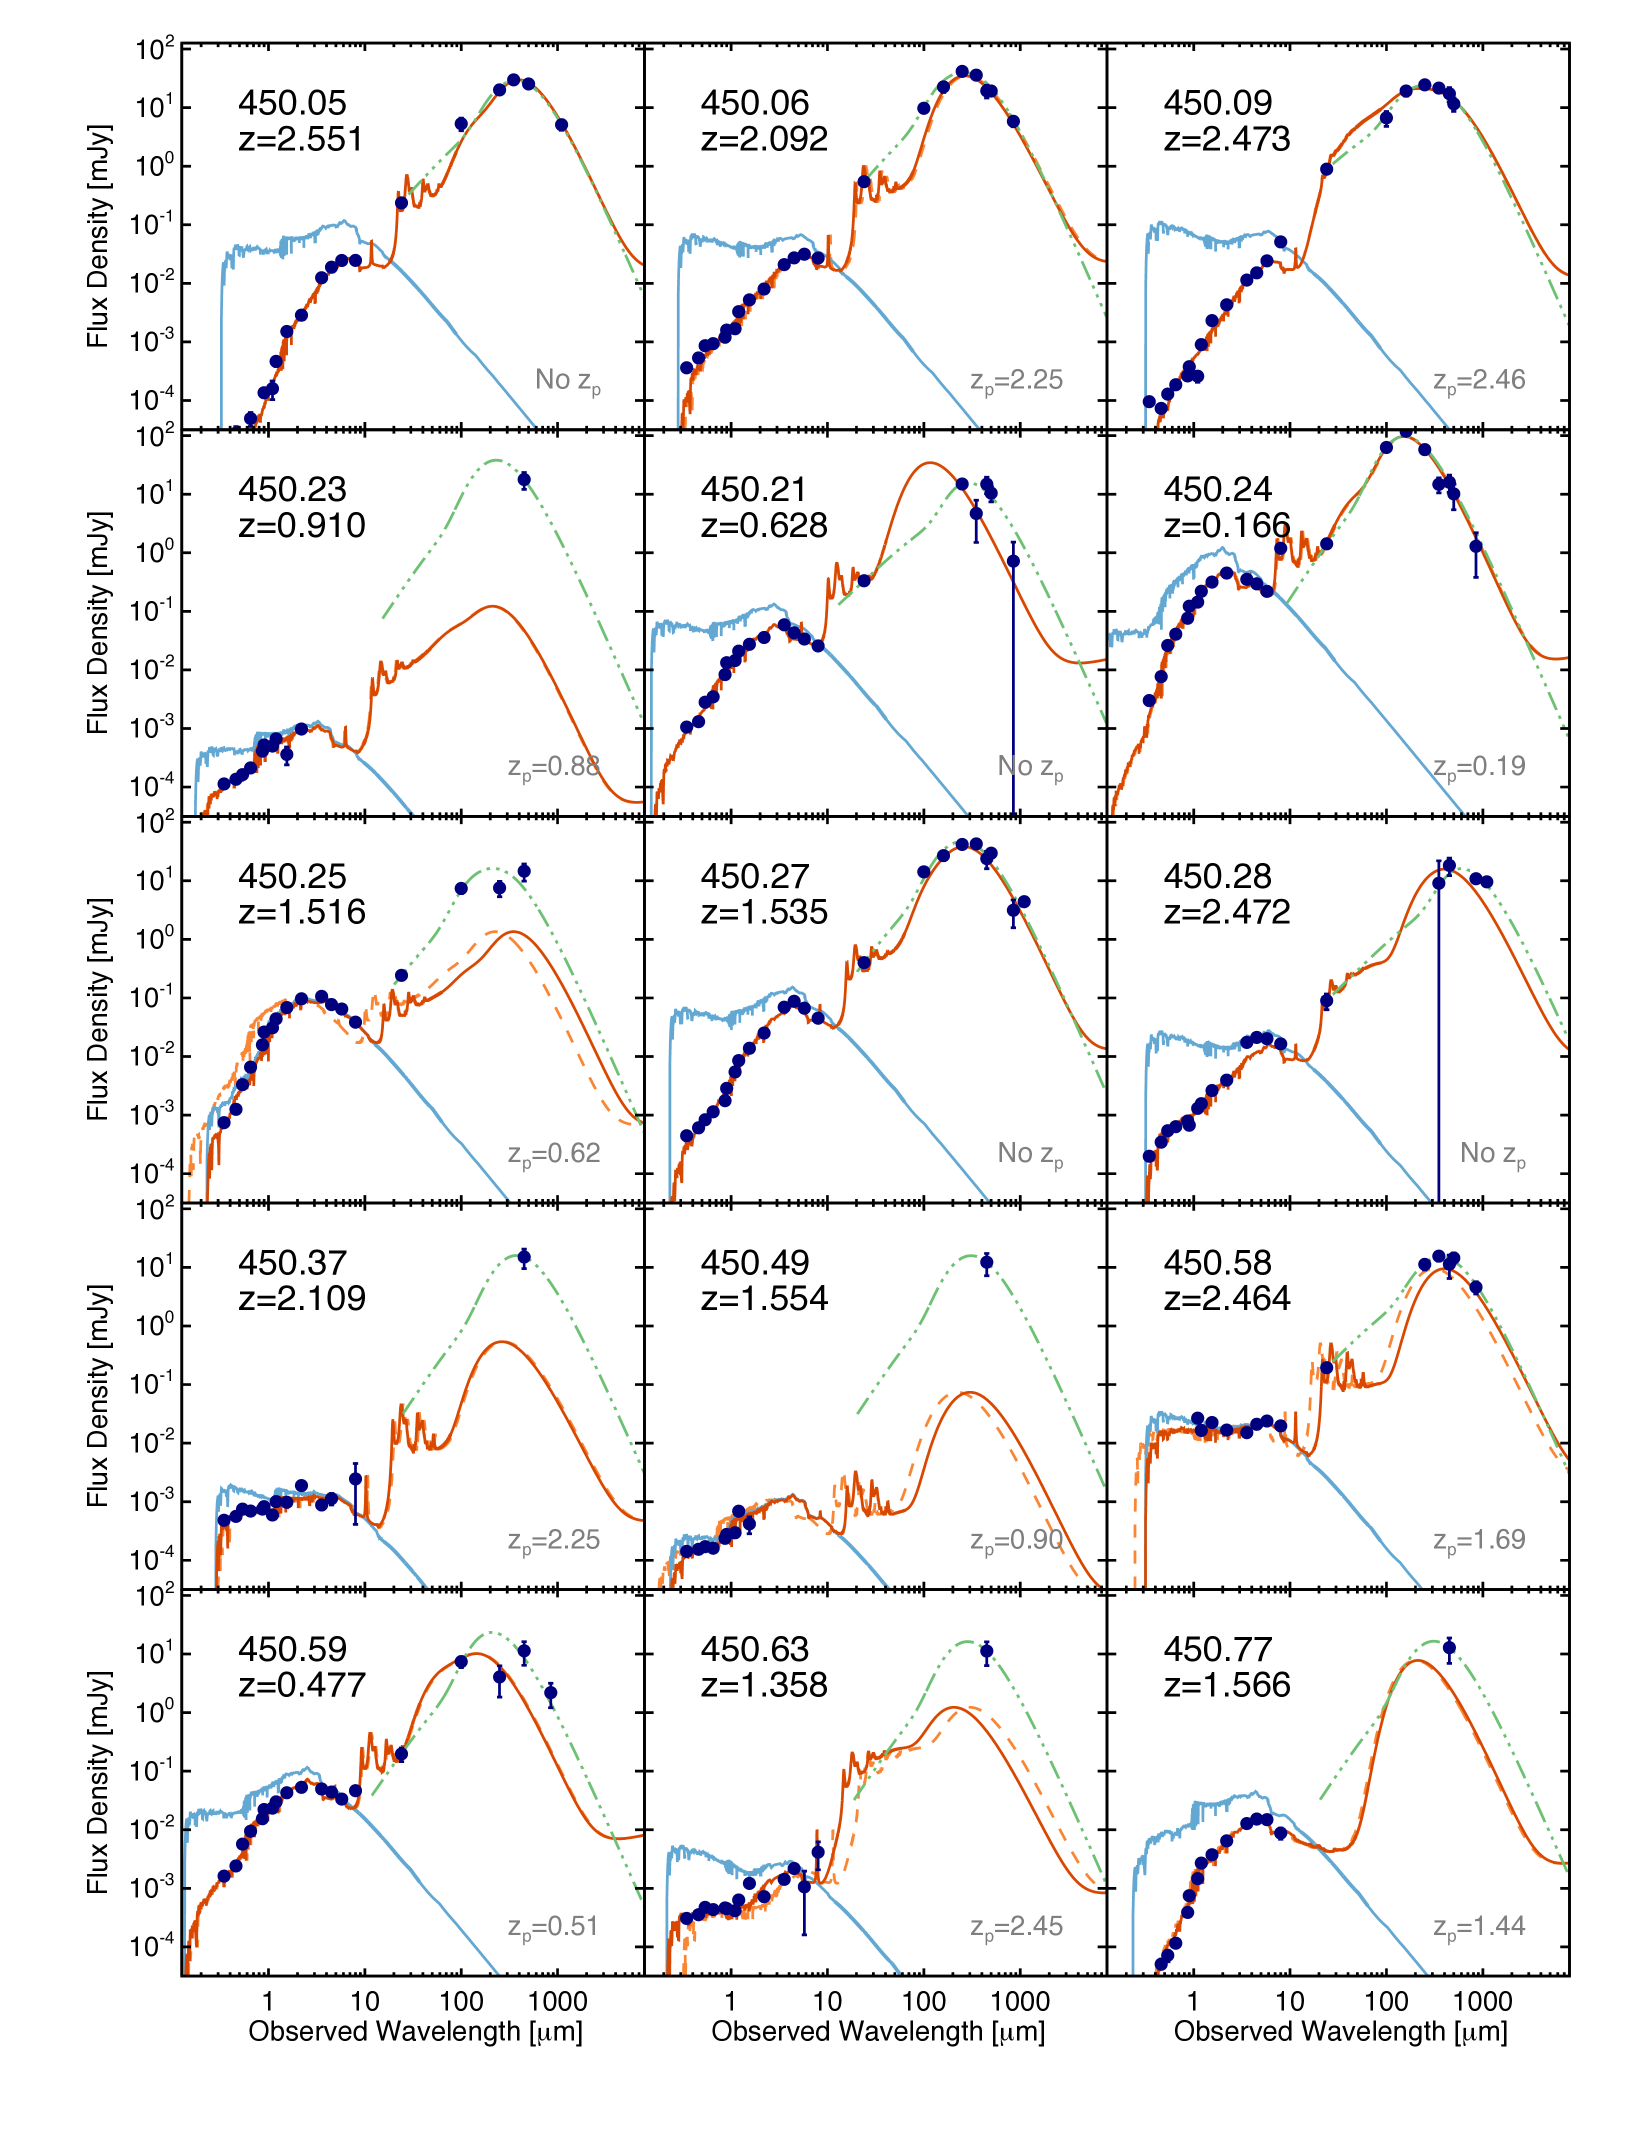
What gives rise to such inaccuracies in DSFGs’ photometric redshifts in some cases but not others? We investigate the possible causes of such inaccuracies by fitting spectral energy distributions (SEDs) to the UV through millimeter photometry using the MAGPHYS code (da Cunha, Charlot & Elbaz, 2008). We use the updated version (da Cunha et al., 2015), equipped to fit SEDs of high-redshift, potentially burst-dominated galaxies like DSFGs. The SED fits are shown in Figure 4.
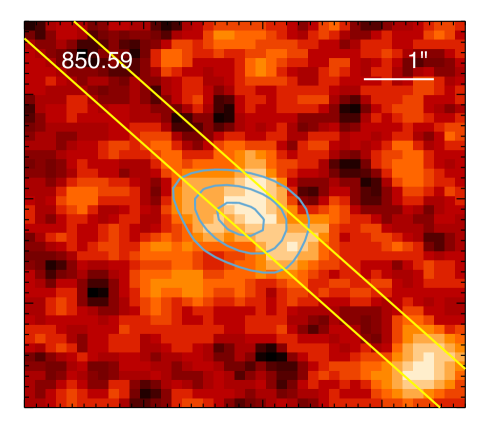
Geometric effects are the most likely culprit causing significant photometric inconsistencies, leading to poorer photometric redshift estimation. For example, we identify five galaxies with MAGPHYS fits that are not well matched from UV through IR in Figure 4: 450.23, 450.25, 450.49, 450.63 and 850.59. Despite the balance of UV attenuation with IR luminosity used in MAGPHYS to match photometry across all bands, the IR luminosity in these systems is dramatically underestimated by the best-fit Bruzual & Charlot (2003) templates. Of these sources, only 450.23 has an adequate photometric redshift estimate (), and it sits at . The other sources all have very poor photometric redshift estimates () or none at all. While two of these sources only have far-IR identifications at 450m, and so could be false identifications as DSFGs, three are robustly identified at both far-IR and optical/near-IR wavelengths. Thus, we attribute the cases of catastrophic photometric redshift failures primarily to a geometric decoupling of unobscured and obscured emission.
Included in Figure 4 are far-infrared/millimeter SED fits generated using a modified black body plus mid-infrared powerlaw, as an independent assessment of the infrared luminosity, dust temperature, and dust mass. We use the SED fitting procedure outlined in Casey (2012), using an emissivity spectral index of . When there are fewer than 4 far-IR photometric points, the mid-infrared powerlaw slope is fixed to and when there are fewer than 2 far-IR photometric points, the dust temperature of the fit is fixed to K. A number of galaxies, particularly those highlighted in the previous paragraph, are not well fit at long wavelengths using the MAGPHYS energy balance approach but are much better characterized at those wavelengths with this simple SED approach. We use these simple SEDs to characterize the IR luminosities, dust temperatures, and dust masses of the sample, as given in Table 2.
| Source | Identifying Features | M⋆ | Mdust | LIR | SFR | |||
|---|---|---|---|---|---|---|---|---|
| [ M⊙] | [ M⊙] | [ L⊙] | [ M⊙ yr-1] | [m] | ||||
| 450.05 | 2.551 | H, Ly | (3.4) | (1.4) | (6.3) | 593 | 10414 | 5.43.2 |
| 450.06 | 2.092 | H, [NII],SII, CIII], FeII, MgII | (1.1) | (4.9) | (7.7) | 724 | 846 | 2.320.06 |
| 450.09 | 2.473 | H, H | (2.2) | (3.00.5) | (8.3) | 783 | 7311 | 2.910.13 |
| 450.14 | 1.523 | H, [NII] | 2.8 | 2.7 | 1.4 | 128 | 10843 | 2.300.38 |
| 2.462 | H, [NII] | … | … | … | … | … | … | |
| 450.21 | 0.628 | Pa | (3.1) | (2.8) | (1.4) | 13 | 17630 | 1.500.24 |
| 450.23 | 0.9104 | [OII] | (5.7) | (3.2) | (7) | 63 | 18238 | 2.760.74 |
| 450.24 | 0.1658 | Pa, Pa, H2 | (4.0) | (1.7) | (5.60.4) | 5.20.4 | 1324 | 3.760.20 |
| 450.25 | 1.516 | H, [NII], SII | (3.4) | (9.0) | (1.7) | 157 | 8413 | 1.750.18 |
| 450.27 | 1.535 | H, [NII], SII, FeII, MgII | (3.0) | (4.5) | (4.00.5) | 373 | 976 | 2.390.06 |
| 450.28 | 2.472 | H, H | (6.6) | (3.8) | (2.4) | 229 | 14740 | 1.780.25 |
| 450.37 | 2.109 | H,SII, [OIII], H | (2.0) | (9.0) | (1.4) | 132 | 6634 | 1.590.84 |
| 450.49 | 1.554 | H | (2.3) | (9.0) | (8) | 75 | 6634 | 2.230.95 |
| 450.58 | 2.464 | H | (2.1) | (7.1) | (3.2) | 302 | 29314 | 3.9 |
| 450.59 | 0.4768 | [OII], H, H | (2.3) | (6.8) | (1.1) | 11 | 10519 | 1.660.20 |
| 450.63 | 1.358 | H | (4.8) | 9 | (6) | 59 | 90 | 1.911.00 |
| 450.77 | 1.566 | H | (4.9) | 9 | (8) | 79 | 90 | 2.851.07 |
| 850.04 | 1.436 | H | (3.0) | (2.8) | (1.10.2) | 106 | 16710 | 2.000.08 |
| 850.20 | 2.484 | H, [NII] | (3.2) | (3.2) | (1.20.2) | 1096 | 675 | 2.590.07 |
| 850.25 | 2.438 | H | (2.8) | (1.1) | (5.5) | 514 | 10315 | 2.100.15 |
| 850.36 | 0.224 | H, [OII] | (2.8) | (1.3) | (8.2) | 0.77 | 27146 | 2.040.34 |
| 850.44 | 2.470 | H, [NII], [OIII], H,H,Ly | (1.8) | (2.0) | (2.8) | 263 | 9126 | 1.410.25 |
| 850.45 | 1.258 | H, [NII] | (4.7) | (4.3) | (5.4) | 51 | 14025 | 2.220.22 |
| 850.59 | 3.584 | Ly | (5.8) | (5.1) | (3.5) | 333 | 9240 | 1.490.34 |
| 850.60 | 1.457 | H, [NII], Sii | (2.1) | (2.40.4) | (2.3) | 218 | 968 | 2.960.09 |
| 850.82 | 2.508 | H | (1.8) | (2.8) | (5.0) | 471 | 8024 | 2.710.23 |
| 850.89 | 2.104 | H, [NII], [OIII], H | (1.8) | (6.8) | (3.7) | 347 | 10419 | 1.540.18 |
| 850.95 | 1.556 | H, [NII], NaD | (3.8) | (2.8) | (2.0) | 189 | 10228 | 1.660.29 |
| 850.97 | 0.731 | [OII] | (1.5) | (4.7) | (2.8) | 5.8 | 10915 | 2.91.1 |
| m450.87 | 2.282 | H, [OIII] | (2.0) | (6.5) | (5.4) | 512 | 9413 | 3.210.18 |
| m450.133 | 0.728 | Pa, H, [OIII], [OII],MgII | (6.3) | (7.5) | (2.5) | 23 | 12724 | 0.730.21 |
| m450.173 | 1.003 | [OII], NeV, NeIII, H, MgII | (2.2) | (1.6) | (6.5) | 61 | 11620 | 1.380.26 |
Table Notes — Source names are as in Casey et al. (2013), and the positions of the sources are given in their Tables 6-7; in all of the cases above, the most likely multiwavelength counterpart was chosen (counterpart 1/N). The redshift identification is given to three significant digits unless the source was particularly low redshift with bright emission features which allow for a more precise redshift constraint. The ‘Identifying Features’ column indicates which spectral features were used as the primary lines in identifying the sources’ spectroscopic redshift. Stellar mass estimates are generated with the help of Magphys energy balance code as described in § 3. Mdust, LIR, SFR and are all derived using a simple modified blackbody plus mid-infrared powerlaw (Casey, 2012), as shown in Figure 4. We quote instead of dust temperature as the former is more directly tied to observational constraints and the latter is heavily dependent on model assumptions. The SFR quoted here is derived from using a Chabrier IMF (Kennicutt & Evans, 2012). The last column, , is the log of the IRX ratio, defined as /. For example, a DSFG with will have an IR luminosity 100 times its UV luminosity.
4. Characteristics of the Spectroscopic Sample
In this section we describe some of the unique characteristics of the spectroscopically-confirmed COSMOS DSFGs listed in Table 2. The sample is naturally heterogeneous, and thus requires some individual and subset remarks to fully capture the physical nature of their evolution and the source of their obscured emission. We group sources by common characteristics, and include some remarks on ambiguous and mis-identifications at the end of this section.
4.1. Unlensed DSFGs above L⊙
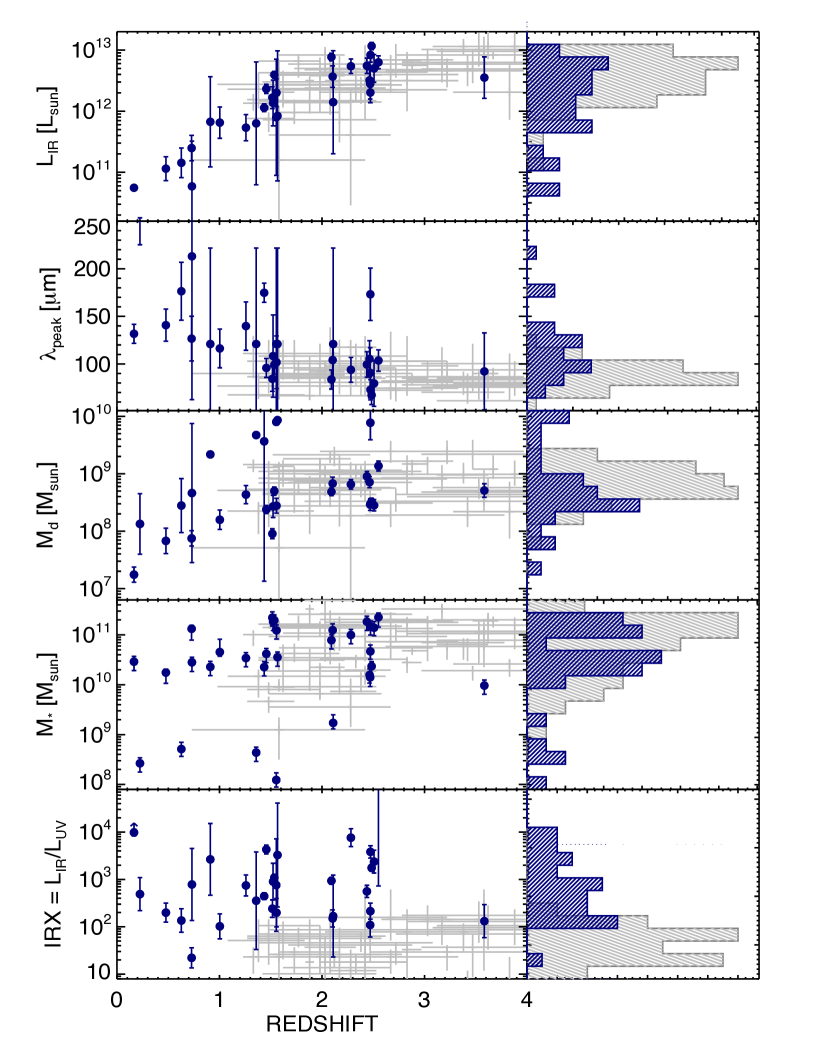
DSFGs that have intrinsic infrared luminosities exceeding L⊙ can be characterized as bona-fide DSFGs: luminous dusty galaxies, predominantly at a redshift beyond . Twenty-nine galaxies in our sample fall into this luminosity regime and range in redshift from 450.24 at to 850.89 at , with a median redshift of . Their luminosities, dust temperature constraints, dust masses, and ratios are shown in Figure 5. The median peak of the rest-frame far-infrared SED is 1169m, which translates to 36 K dust temperature using our model assumptions. On average, the sample is 130 times more luminous in the far-infrared/submillimeter than in the UV/optical, consistent with most luminous DSFGs. Figure 5 also compares our spectroscopic sample with the ALESS photometric sample of da Cunha et al. (2015); our sample sits at lower redshifts, and thus reaches to slightly lower luminosities, slightly cooler dust temperatures, lower dust masses, and yet higher obscurations of their rest-frame UV emission.
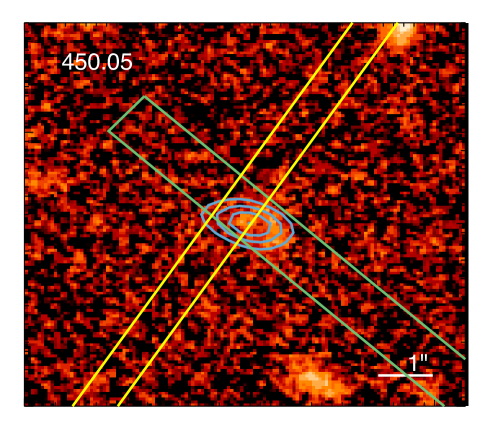
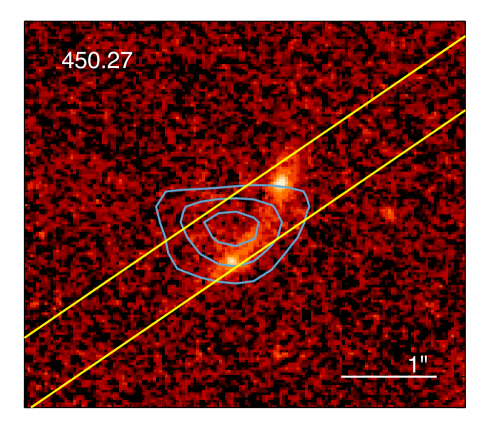
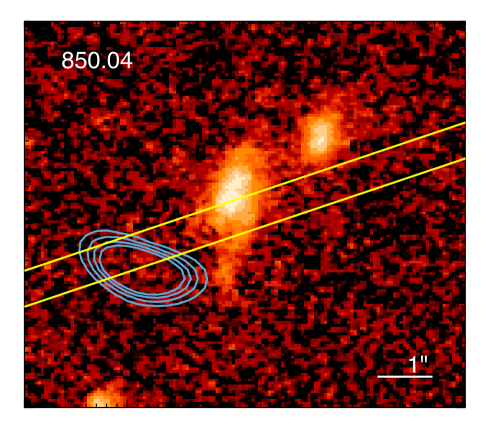
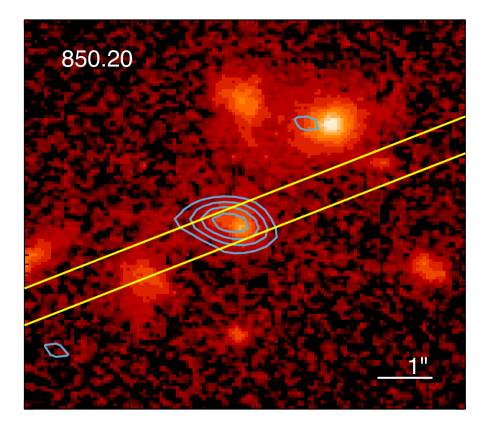
The median dust mass is (4.41.0)108 M⊙, which is about 0.90.4% of the median stellar mass, (4.92.1) M⊙. Assuming an average gas-to-dust ratio of 100 (Scoville et al., 2014), this would imply molecular gas reservoirs averaging 4 M⊙. With a median star-formation rate of 22060 M⊙ yr-1, the inferred representative gas depletion time for this population is 180 Myr, though we stress the importance of measuring this directly with emission from cold molecular gas. Five sources in this category also have archival ALMA 1.1 mm dust continuum data pinpointing their submillimeter emission to the positions of our MOSFIRE follow-up and are shown in Figure 6. Two additional sources have ALMA 1.1 mm imaging which reveal misidentifications, as discussed in § 4.4.
4.2. Low-redshift DSFGs
Two sources identified in our sample sit at very low redshifts . 850.36 has a measured spectroscopic redshift of from the zCOSMOS survey (Lilly et al., 2007); its identification as the origin of the submillimeter emission is unambiguous. The optical morphology is clearly consistent with a major merger with double nuclei and an extended, asymmetrical disk. While we did target this source with MOSFIRE on the same mask as other higher priority DSFGs, the wavelength coverage failed to overlap with expected prominent features like Pa and Pa.
Source 450.24 also has a prior spectroscopic confirmation at (Lilly et al., 2007), and here we obtained a near-infrared spectrum which is more consistent with a redshift of based on detection of Pa, Pa and H2 features. We measure a Paschen decrement between Pa and Pa of 8.72.5, with the significant uncertainty caused by flux calibration between bands, and the Pa detection near the edge of -band close to telluric features. While highly uncertain, this ratio is still significantly higher than the expected theoretical intensity ratio of 2.16 for case B recombination temperature of 104 K, suggesting significant dust obscuration.
Source 450.21 has a strong emission line detection at 2.087m, though this is not in agreement with a previously reported spectroscopic redshift of (John Silverman, private communication). We assign this source a tentative redshift of .
4.3. Spatially Superimposed
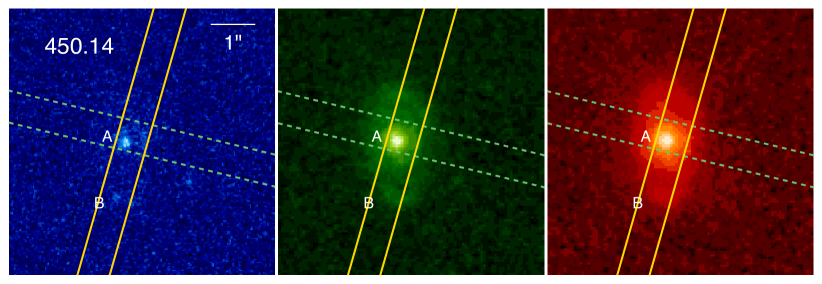
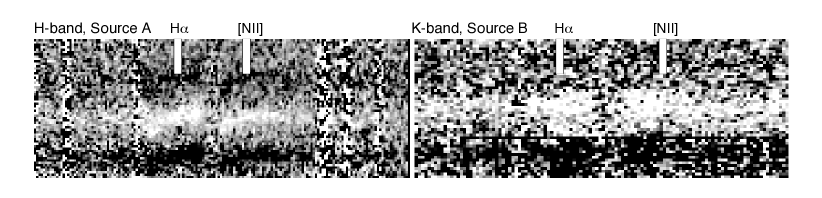
One DSFG in our sample is an ambiguous potential overlap of two sources at different redshifts. The optical/near-infrared counterpart to the submillimeter source is shown in Figure 7; it consists of a central compact source with two fainter arcs to the north and south. We have unequivocally identified the central compact source at a redshift of . The arcs are much more visible in the WFC3 imaging of the source, suggesting a higher redshift solution might be more plausible. This target was placed on two different MOSFIRE masks, and one happened to align with the southern faint arc. We tentatively suggest that this fainter arc is a background source sitting at as identified by two anomalous emission features in the -band spectrum consistent with H and [NII] at this alternate redshift. Figure 7 also shows the sources’ 2D spectrum, zoomed in to the H features in - and -bands for the respective redshifts of the central source and potential background source. Though the detection of H and [NII] are only tentative for the identification, there is also a tentative corresponding detection of [OIII] in -band at the same redshift. This source will require more substantial follow-up to determine if the spatial superposition is genuine. Other similar spatially overlapping sources have been found in submillimeter redshift surveys (e.g. the ALESS sample; Danielson et al., 2017).
4.4. Mis-identifications
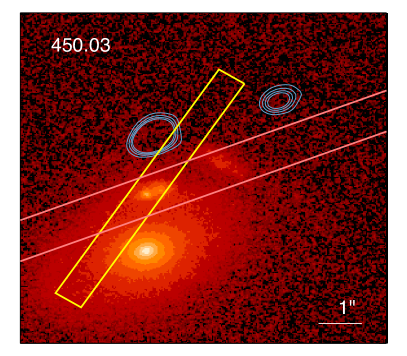
Inevitably the positional uncertainty in bolometer maps will lead to some mis-identifications and ambiguities which propagate to spectroscopic follow-up campaigns. Here we present two mis-identifications, along with two ambiguous cases that are likely mis-identifications. All are shown in Figure 8.
Source 450.03 (Figure 8, left) is best known as AzTEC-2 in the literature (Younger et al., 2007, 2009), and has extensive follow-up, both interferometric and spectroscopic. Unfortunately spectroscopic efforts to-date have failed to yield a redshift identification. At the time of our MOSFIRE and DEIMOS campaign, it seemed like the interferometric source (at 1.1mm) was inconsistent with the 450m position identified in Casey et al. (2013), so the possibility remained that they were separate sources. More recent high-frequency follow-up from ALMA at 850m indicates this is not the case, however, and the position of the DSFG sits about 1-1.5″ to the north of our spectroscopic target. While we have confirmed our original target sits at , and there is a possible detection of a CO line at the same redshift (Jimenez et al., in preparation) our confirmation does not spatially align with the DSFG, and so we do not include it in further analysis for this paper or sample. The possibility remains this DSFG is associated with the system at but requires further analysis.
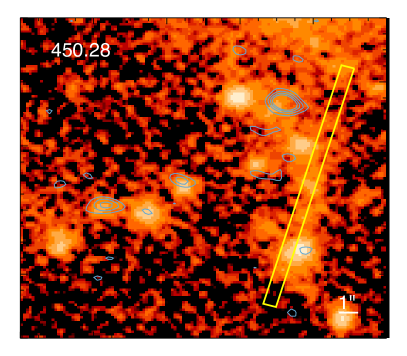
Source 450.28 (Figure 8, middle left) is a member of a complex blend of submm sources; the prior measurements of this area at 850m and 1.2 mm only reveal a single source (see Bertoldi et al., 2007; Casey et al., 2013), while 450m imaging breaks the emission into two distinct peaks. Our MOSFIRE follow-up targeted the most likely counterpart for the western source, 450.28, and confirms a redshift for that source of 2.472 (a member of the protocluster discussed in Casey et al., 2015). However, more recent ALMA follow-up reveals this source is mis-identified, and instead, three sources dominate the ALMA emission to the north and east. While formally resulting in a mis-identification, this complex is physically associated with the structure identified at , confirmed through multiple transitions of CO at . This region is discussed at length in Wang et al. (2016) as a potential virialized protocluster core at , where they present an extended X-ray detection and eleven possible CO(1-0) detections in the broader redshift range of the protocluster. Further CO(1-0) observations of this region is being analyzed to determine redshifts and further map this complex region (Champagne et al., in preparation).
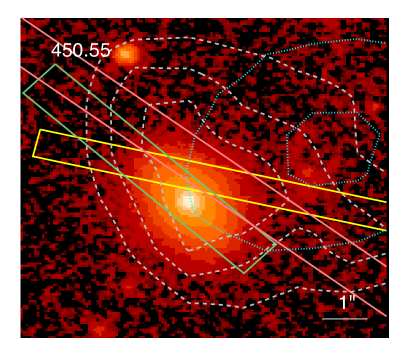
Source 450.55 (Figure 8, middle right) is likely a blend of a background galaxy which is exceedingly faint, even at near-infrared wavelengths, and a foreground galaxy, confirmed at . The submillimeter source is more consistent with the background source to the west of the bright foreground source, yet the foreground source is 24m-bright, and so was earlier identified as the likely submillimeter counterpart. Deblending of this source was unfortunately not attempted before the spectroscopic campaign was underway, so we have not obtained a secure redshift for this DSFG.
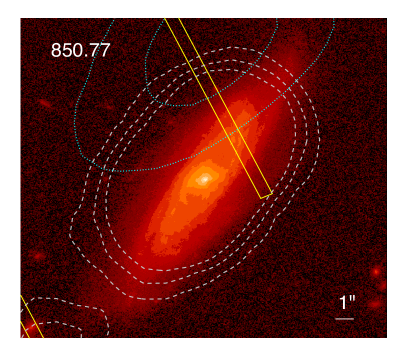
The last case of a mis-identification is 850.77. This submillimeter source is offset to the north of a very bright foreground spiral galaxy at . The spiral is clearly the dominant source of 24m emission in the region, and so was mistaken as a potential counterpart to the 850m source. Deep imaging does not reveal any obvious optical/near-infrared counterpart, and so this source remains ambiguous and without a redshift identification; it is also not detected at 450m.
5. DSFG Composite Spectrum
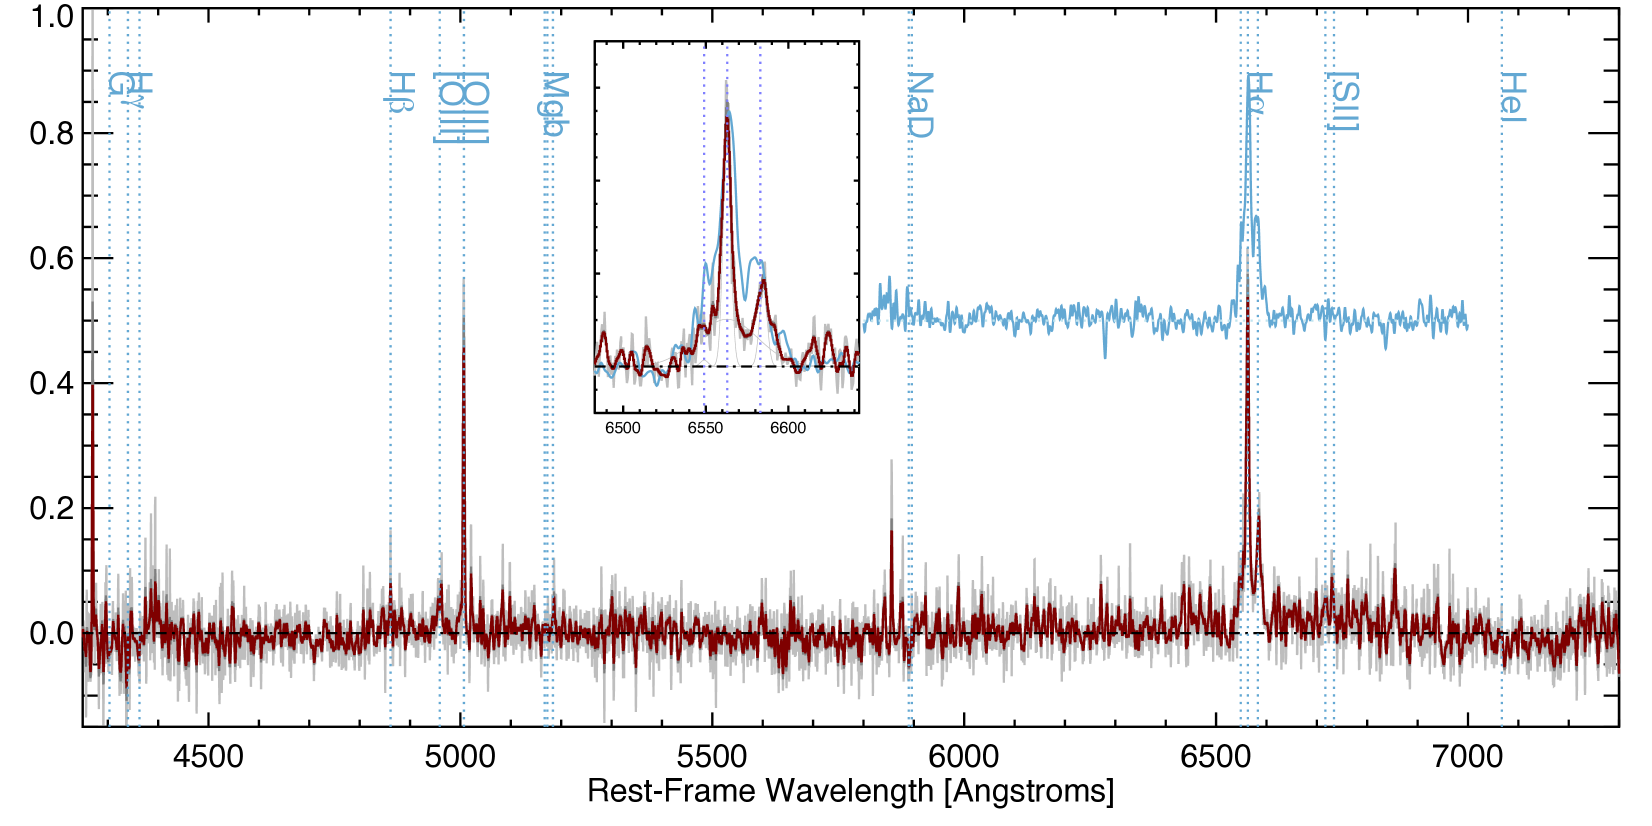
With many rest-frame optical spectra of DSFGs in hand, stacking provides a useful means of inferring the aggregate spectral characteristics of the DSFG population, including features which are too weak to measure in individual DSFG spectra. We construct a rest-frame optical spectrum for the 20 DSFGs with H detections by first shifting all spectra into the rest-frame using the systemic redshift measured from H emission. The redshifts for the galaxies included in the composite range from 1.262.55, with a median redshift of . Because the continuum emission varies dramatically from source to source, we first remove continuum emission before stacking. For high signal-to-noise continuum (10) we fit the continuum using a third order polynomial, and for low signal-to-noise continuum, we use a linear fit. Continuum-subtracted spectra are combined using an unweighted co-addition. We test several combination methods, including weighting individual spectra by the strength of H emission, weighting by signal-to-noise of H, weighting by the spectrum’s inverse-variance (measured using each spectrum’s extracted 1D flux error array), and co-adding the spectra without special weighting. All combinations produce similar spectra, but the unweighted spectrum, scaled by flux, produces the most uniform, high signal-to-noise result. We check to ensure the final spectrum is not dominated by the brightest sources; the brightest H source, 850.44, contributes 16% to the final stack. The median contribution is 3.5%, and the minimum contributor (faintest) contributes 1%.
The resulting rest-frame optical composite for DSFGs is shown in Figure 9, extending from rest-frame wavelengths 4300-7300Å. We compare this fit to a similar composite derived in Swinbank et al. (2004) for 23 850m-selected DSFGs (i.e. SMGs). Given the spectral coverage of Keck NIRSPEC which was used for the SMG sample the Swinbank et al. composite covered a much narrower rest-frame wavelength range. We simultaneously fit H and [NII] emission in the range 6550–6600Å using four co-added Gaussian fits, with the narrow band component of H and the two [NII] features at a fixed width. The H line is best fit with both a broad and narrow component, rather than a single fit. The narrow component has a FWHM of km s-1 (comparable to the results of Swinbank et al.), while the broad component is km s-1. The narrow-to-broad flux ratio is 0.610.03, nearly identical to the ratio found in the Swinbank et al. composite.
The [NII]/ H ratio for the composite is 0.330.02, consistent with a star-formation origin. We detect both [SII] features at 6716Å and 6731Å, and measure the [SII]/ H ratio at 0.150.01, consistent with an H ii region origin (Veilleux & Osterbrock, 1987). We also use the ratio of the two sulfur lines to infer the mean electron density in DSFGs. A ratio of [SII]6716/ [SII]6731 = 0.860.12 implies an electron density of 900300 cm-3. This density is well above the 10 cm-3 low density regime (see Figure 5.8 of Osterbrock & Ferland, 2006) of many lower luminosity galaxies, and even 200 cm-3 densities seen in high- star-forming galaxies (Strom et al., 2016), implying a dense interstellar medium (ISM) consistent with DSFGs’ relatively compact, high SFR-density, and high gas-density characteristics. The measured ratio of H to H emission in the composite, i.e. the Balmer decrement, is 21.02.4 which translates to an . This is, of course, substantially higher than the theoretically expected H/ H =2.86 from case B recombination, and the dramatic difference is directly attributable to the extreme obscuration present in the DSFG population.
The composite spectrum also shows notable Na absorption blueshifted by 20030 km s-1, indicative of gas outflows. This blueshift is consistent with the measured 24050 km s-1 blueshift observed in Mg II and Fe II features in slightly lower redshift DSFGs (Banerji et al., 2011), indicative of large-scale outflowing interstellar gas and consistent with the momentum-driven wind model. This is also broadly consistent with the local relation of SFR to ISM outflow velocity from Martin et al. (2005).
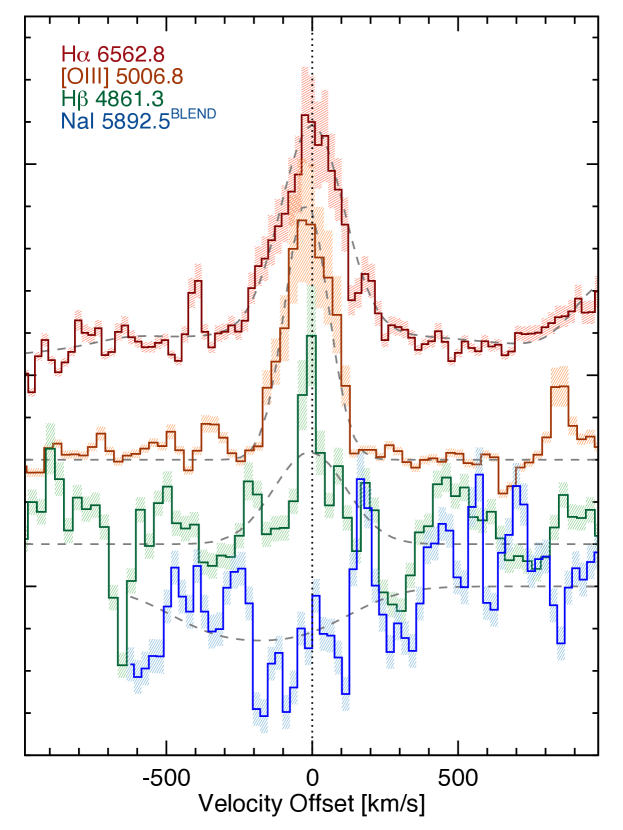
In Figure 10 we compare the line profiles of H, [OIII], H and Na I from the composite spectrum. The measured [OIII] 5007Å width is notably narrower than the width of H, at 74.03.7 km s-1, though the H line width is consistent with the H width. The [OIII]/ H ratio is 5.170.78. As we show in the next sub-section, we use both the [NII]/ H and [OIII]/ H ratios to place our composite spectrum, as well as individual DSFGs with bright features, on a nebular emission line diagram, and compare it to literature sources at low and high-redshift.
6. AGN Content
AGN can significantly impact rest-frame optical line diagnostics. Here we summarize the contribution of AGN to the spectroscopically confirmed population of DSFGs. Only four of the 31 spectroscopically-confirmed sources are X-ray detected: 450.58, 850.36, 850.89 and m450.133. Their integrated rest-frame 0.5-8 keV luminosities are 8.01043 erg s-1, 3.11041 erg s-1, 2.01044 erg s-1 and 1.11044 erg s-1, respectively. The low luminosity for 850.36 (at ) is consistent with a star-formation origin, while the other sources are consistent with luminous AGN. Sources not detected in X-ray data but showing signatures of bright AGN include 450.09, discussed in Casey et al. (2015) as being radio-loud, just under the classic FR II classification luminosity. As shown in Figure 4, 450.09 is one of two sources with a clear powerlaw through mid-infrared wavelengths, consistent with AGN-heated torus dust. The other is 850.59. Together, these rather clear AGN indicators in the X-ray and radio account for 10% of the confirmed DSFG sample, a noticeably lower fraction than found at higher luminosities.
While most of our DSFGs lack obvious AGN signatures, some of the remaining DSFGs in our sample may contain AGN that contribute at a lower level to a galaxy’s bolometric luminosity. While we do have 20 DSFGs for which an N [NII]/ H ratio is measurable, nearly half the sample (9) have [NII]/ H, consistent with solar or super-solar metallicity, shock-heating or AGN. As revealed from our composite spectrum in Figure 9, there is an underlying broad H line profile with 2000 km s-1 width confirming the presence of AGN, albeit at a level which does not dominate the bolometric luminosity of our sources, but further demonstrates the link between luminous starbursts and their nuclear activity.
7. Nebular Emission Diagnostics
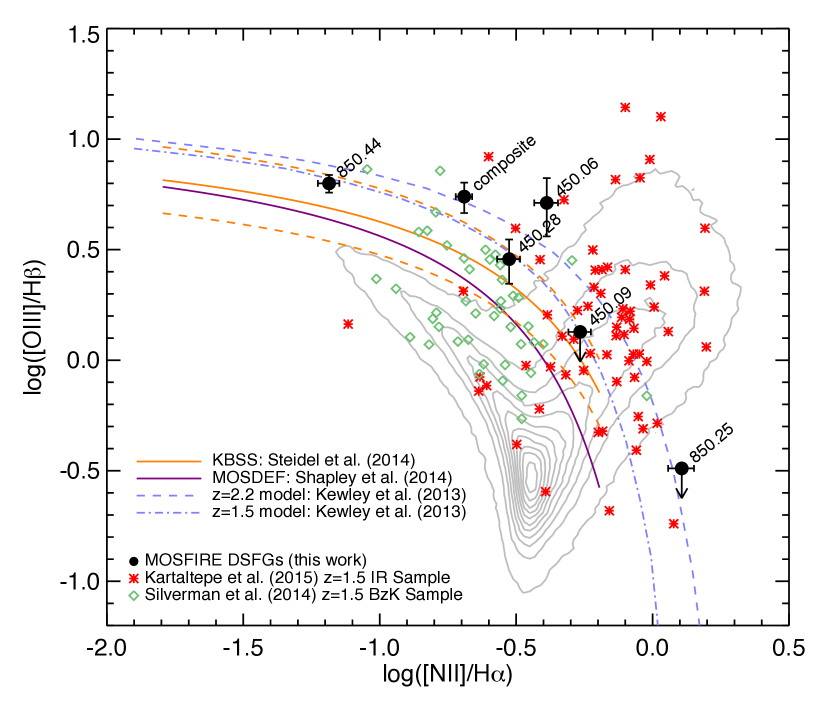
Five DSFGs have sufficiently high-S/N spectra with independent detections of H, [NII], [OIII] and H to place in the context of the strong-line Baldwin-Phillips-Terlevich (BPT) classification (Baldwin, Phillips & Terlevich, 1981), used to infer the dominant mode of excitation for strong nebular emission in both low and high redshift galaxies. While this sample is insufficient to independently fit as a population, it does provide some context for a handful of typical high- DSFGs, and provides some promise that future MOSFIRE surveys of larger DSFG samples could become a useful technique for understanding the galaxies’ internal physical drivers. This is particularly useful in understanding the origins of Hii region ionization, either from AGN or UV radiation from young stars (Kewley et al., 2001).
Figure 11 shows our DSFGs in context with other high- samples. The largest galaxy samples with these nebular line diagnostics are drawn from the Keck Baryonic Sky Survey (KBSS; Steidel et al., 2014; Strom et al., 2016) and from the MOSFIRE Deep Evolution Field (MOSDEF; Shapley, Reddy et al., 2014). Both populations show elevated [OIII]/ H ratios, with differences between the star-forming tracks due to sample selections: in the rest-frame UV for KBSS vs. in the observed near-IR for MOSDEF. We also draw comparisons with BzK-selected star-formers (Silverman et al., 2015) and Herschel-PACS selected DSFGs (Kartaltepe et al., 2015). Our composite spectrum and 3/5 individual sources are on the upper envelope of Steidel et al. (2014) sample fits and the Kewley et al. (2013) model. While the Kartaltepe et al. work presents the largest sample of DSFGs’ with these optical line characteristics to-date, our DSFGs here are more in-line with BzK galaxies and seem to probe a different regime. Indeed, AGN are a significant contributor to the IR luminosity for Herschel-PACS samples, and as our selection is at 450m/850m, this work is more sensitive to pure starbursts. The general observation of higher [OIII]/ H ratios, in excess of those observed by Steidel et al. (2014) and Shapley, Reddy et al. (2014) is attributed to even harder ionizing radiation fields in these starbursting systems with low metallicity.
As discussed in Masters, Faisst & Capak (2016) and Strom et al. (2016), the N/O ratio seems to be rather fundamental, holding a tight relation with mass-metallicity. At high stellar masses (which our DSFGs are) we observe an even higher [NII]/ H ratio at a given [OIII]/ H. Our results are also consistent with those of Stanway et al. (2014) who argue that high [OIII]/ H ratios can be accounted for with binary stellar evolution models in short-lived (100 Myr) starbursts.
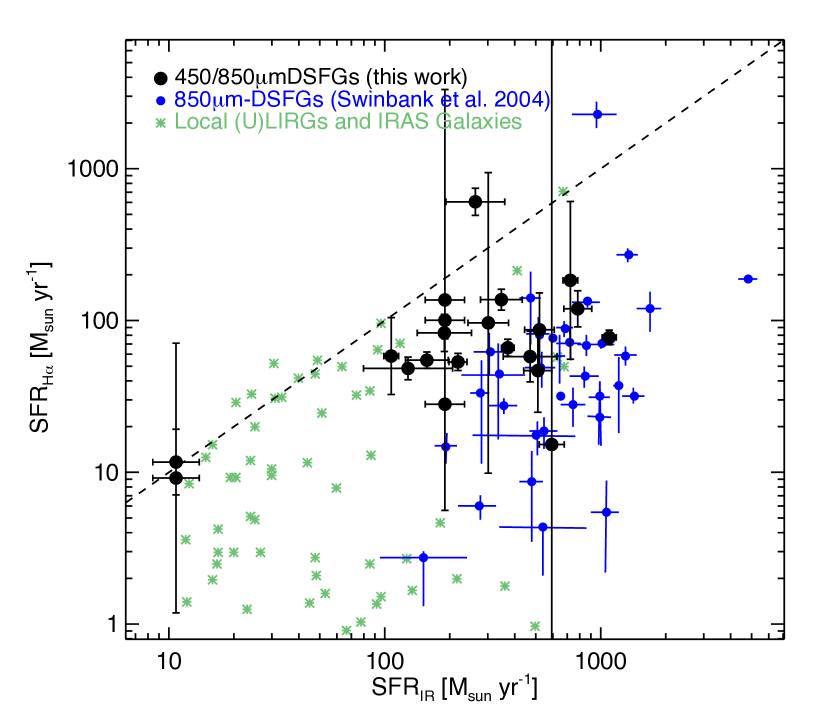
8. Extinction in DSFGs
DSFGs are known to be among the most heavily extinguished sources at rest-frame ultraviolet and optical wavelengths, and here we explore where this sample of DSFGs sit with respect to other DSFG samples in terms of H extinction. Figure 12 plots the integrated infrared-based star-formation rate against the H based star-formation rate, as inferred directly from H line luminosity (Kennicutt, 1998). Compared to the Swinbank et al. sample of 850m-selected DSFGs, our sample is a bit less luminous at far-infrared wavelengths, yet similarly bright (or brighter) in H luminosity. Swinbank et al. attribute the factor of 147 discrepancy between IR and H SFR indicators to obscuration of the rest-frame optical, albeit not as significant as the much stronger discrepancy between IR and rest-frame UV, which is typically a factor of 120 (IRX; Chapman et al., 2005). As our sample is, on average, less luminous and less extreme than the Swinbank sample, the average H SFR deficit we measure is only 1.30.1, in comparison. In other words, H in our sample is recovering about 77% of the total SFR of our DSFGs, while in the more luminous Swinbank et al. DSFG sample, only 7% is recovered. This type of extinction is reminiscent of similar effects seen at rest-frame UV wavelengths. For example, in Casey et al. (2014) we showed that the IRX ratio (or more specifically the deviation from the IRX- relationship) is a strong function of galaxies’ total star-formation rates. As SFR increases, attenuation becomes more severe due to geometric effects decoupling UV and IR emission. In Figure 13, we show that the H SFR deficit tracks the IRX ratio well, with the highest-obscuration UV sources are those DSFGs whose H emission most dramatically underestimates the total SFR.
9. Conclusions
This paper has presented new spectroscopic observations of DSFGs in the COSMOS field which were initially selected via their emission at submillimeter wavelengths, at 450m and 850m. Of 114 sources initially targeted by both DEIMOS and MOSFIRE observations, we have spectroscopically confirmed 31. The vast majority of the sources identified were through MOSFIRE near-infrared spectroscopy (where we targeted 102 sources), with a few sources revealed by LRIS and DEIMOS optical spectroscopy.
The vast majority (71/102) of our MOSFIRE spectroscopic targets did not yield redshift identifications. From their photometric redshifts, we estimate about 60% of these failures are likely caused by the sources sitting outside the optimum redshift range where bright emission lines are detectable in MOSFIRE - and -bands, while the other 40% are likely too obscured at rest-frame optical wavelengths to be detected in, e.g., H emission. Archival ALMA dust continuum data exist for seven sources from our spectroscopic survey; five of the seven sources (71%) were correctly identified using multiwavelength counterparts.

Because the COSMOS field has some of the highest quality photometric redshifts available thanks to 30 bands of deep imaging, we assess the quality of photometric redshifts in DSFGs, and conclude that half are of high quality, , the other half are poor fits (no photometric redshift or ), which we attribute to geometric decoupling of the galaxies’ unobscured and obscured emission. Indeed, the sources whose photometric redshifts fail catastrophically have the most significant offset between rest-frame optical/near-infrared SED characteristics and far-infrared/submm characteristics.
We have constructed a composite spectrum of 20 DSFGs in the rest-frame optical spanning 4300–7300Å, much wider wavelength coverage than the previous DSFG composite spectra thanks to the sensitivity of the MOSFIRE instrument and our deep spectroscopic observations in both - and -bands. We detect H, [NII], [SII], Na D, [OIII], and H in our composite and conclude that the DSFGs, in aggregate, are star-formation dominated as measured from their [NII]/ H ratio, have relatively high electron densities 1000 cm-3, and unsurprisingly are significantly obscured, with a Balmer decrement of 21.02.4. A handful of individual sources are detected at high-S/N across several nebular emission tracers to allow characterization on the BPT diagram. We find our sample of DSFGs more skewed towards star-formation driven ionization rather than luminous AGN, but with harder ionizing radiation fields than lower redshift galaxies and lower-SFR galaxies at similarly high redshifts.
In line with the observation that our sample is, on average, less extreme than previously studied samples of DSFGs with H observations, we find that their H star-formation rates only underestimate the total SFR of the system by a factor of 1.30.1, in contrast to much larger factors 10. The most extreme H SFR deficits align with the most extreme IRX, or , ratios.
Overall, this survey, like the ALESS survey (Danielson et al., 2017), has revealed that spectroscopic redshifts the classic “bottleneck” of DSFG analysis are just as elusive today as they have been in the past decade. While newer, sensitive wide-bandwidth technology has come online at long wavelengths in recent years (most notably the Atacama Large Millimeter Array), there have not yet been large spectroscopic programs pursued in the millimeter to ease pressure from optical/near-infrared facilities in spectroscopically characterizing DSFGs. Until then, optical/near-infrared facilities will still be the most efficient source of DSFG spectroscopy despite the population’s high obscuration.
References
- Alaghband-Zadeh et al. (2012) Alaghband-Zadeh, S. et al. 2012, MNRAS, 3329.
- Baldwin, Phillips & Terlevich (1981) Baldwin, J. A., Phillips, M. M., and Terlevich, R. 1981, PASP, 93, 5.
- Banerji et al. (2011) Banerji, M. et al. 2011, MNRAS, 418, 1071.
- Barger et al. (1998) Barger, A. J. et al. 1998, Nature, 394, 248.
- Bertoldi et al. (2007) Bertoldi, F. et al. 2007, ApJS, 172, 132.
- Béthermin et al. (2015) Béthermin, M. et al. 2015, A&A, 576, L9.
- Biggs & Ivison (2008) Biggs, A. D. and Ivison, R. J. 2008, MNRAS, 385, 893.
- Blain et al. (2002) Blain, A. W. et al. 2002, Phys. Rep., 369, 111.
- Bothwell et al. (2010) Bothwell, M. S. et al. 2010, MNRAS, 405, 219.
- Bothwell et al. (2013) Bothwell, M. S. et al. 2013, MNRAS, 429, 3047.
- Bruzual & Charlot (2003) Bruzual, G. and Charlot, S. 2003, MNRAS, 344, 1000.
- Capak et al. (2007) Capak, P. et al. 2007, ApJS, 172, 99.
- Casey (2012) Casey, C. M. 2012, MNRAS, 425, 3094.
- Casey et al. (2009) Casey, C. M. et al. 2009, MNRAS, 399, 121.
- Casey et al. (2011) Casey, C. M. et al. 2011, MNRAS, 415, 2723.
- Casey et al. (2013) Casey, C. M. et al. 2013, MNRAS, 436, 1919.
- Casey et al. (2015) Casey, C. M. et al. 2015, ApJ, 808, L33.
- Casey, Narayanan & Cooray (2014) Casey, C. M., Narayanan, D., and Cooray, A. 2014, Phys. Rep., 541, 45.
- Casey et al. (2014) Casey, C. M. et al. 2014, ApJ, 796(1), 95.
- Chabrier (2003) Chabrier, G. 2003, PASP, 115, 763.
- Chapman et al. (2005) Chapman, S. C. et al. 2005, ApJ, 622, 772.
- Chapman et al. (2003) Chapman, S. C. et al. 2003, ApJ, 588, 186.
- Chapman et al. (2004) Chapman, S. C. et al. 2004, ApJ, 614, 671.
- Civano et al. (2012) Civano, F. et al. 2012, ApJS, 201, 30.
- Condon (1992) Condon, J. J. 1992, ARA&A, 30, 575.
- Coppin et al. (2010) Coppin, K. et al. 2010, ApJ, 713, 503.
- da Cunha, Charlot & Elbaz (2008) da Cunha, E., Charlot, S., and Elbaz, D. 2008, MNRAS, 388, 1595.
- da Cunha et al. (2015) da Cunha, E. et al. 2015, ApJ, 806, 110.
- Danielson et al. (2017) Danielson, A. L. R. et al. 2017, MNRAS submitted.
- Engel et al. (2010) Engel, H. et al. 2010, ApJ, 724, 233.
- Flores et al. (2004) Flores, H. et al. 2004, A&A, 415, 885.
- Franceschini et al. (2003) Franceschini, A. et al. 2003, MNRAS, 343, 1181.
- Greve et al. (2005) Greve, T. R. et al. 2005, MNRAS, 359, 1165.
- Helou, Soifer & Rowan-Robinson (1985) Helou, G., Soifer, B. T., and Rowan-Robinson, M. 1985, ApJ, 298, L7.
- Hinshaw et al. (2009) Hinshaw, G. et al. 2009, ApJS, 180, 225.
- Hodge et al. (2013) Hodge, J. A. et al. 2013, ApJ, 768, 91.
- Howell et al. (2010) Howell, J. H. et al. 2010, ApJ, 715, 572.
- Hughes et al. (1998) Hughes, D. H. et al. 1998, Nature, 394, 241.
- Ilbert et al. (2013) Ilbert, O. et al. 2013, A&A, 556, A55.
- Kartaltepe et al. (2015) Kartaltepe, J. S. et al. 2015, ApJ, 806, L35.
- Kennicutt & Evans (2012) Kennicutt, R. C. and Evans, N. J. 2012, ARA&A, 50, 531.
- Kennicutt (1998) Kennicutt, Jr., R. C. 1998, ApJ, 498, 541.
- Kewley et al. (2013) Kewley, L. J. et al. 2013, ApJ, 774, 100.
- Kewley et al. (2001) Kewley, L. J. et al. 2001, ApJ, 556, 121.
- Lacey et al. (2015) Lacey, C. G. et al. 2015, ArXiv e-prints.
- Lagache (2015) Lagache, G. 2015, IAU General Assembly, 22, 2256451.
- Laigle et al. (2016) Laigle, C. et al. 2016, ApJS, 224, 24.
- Lee et al. (2013) Lee, N. et al. 2013, ApJ, 778, 131.
- Lilly et al. (2009) Lilly, S. J. et al. 2009, ApJS, 184, 218.
- Lilly et al. (2007) Lilly, S. J. et al. 2007, ApJS, 172, 70.
- Lutz et al. (2011) Lutz, D. et al. 2011, A&A, 532(90).
- Martin et al. (2005) Martin, D. C. et al. 2005, ApJ, 619, L1.
- Masters, Faisst & Capak (2016) Masters, D., Faisst, A., and Capak, P. 2016, ApJ, 828, 18.
- McLean et al. (2012) McLean, I. S. et al. 2012, in Ground-based and Airborne Instrumentation for Astronomy IV, volume 8446 of Proc. SPIE, 84460J.
- Menéndez-Delmestre et al. (2009) Menéndez-Delmestre, K. et al. 2009, ApJ, 699, 667.
- Menéndez-Delmestre et al. (2013) Menéndez-Delmestre, K. et al. 2013, ApJ, 767, 151.
- Narayanan (2015) Narayanan, D. 2015, in IAU Symposium, ed. B. L. Ziegler, F. Combes, H. Dannerbauer, and M. Verdugo, volume 309 of IAU Symposium, 214.
- Oke et al. (1995) Oke, J. B. et al. 1995, PASP, 107, 375.
- Oliver et al. (2012) Oliver, S. J. et al. 2012, MNRAS, 424, 1614.
- Osterbrock & Ferland (2006) Osterbrock, D. E. and Ferland, G. J. 2006, University Science Books, 35(1), 40.
- Pope et al. (2008) Pope, A. et al. 2008, ApJ, 675, 1171.
- Roseboom et al. (2013) Roseboom, I. G. et al. 2013, MNRAS, 436, 430.
- Schinnerer et al. (2007) Schinnerer, E. et al. 2007, ApJS, 172, 46.
- Scoville et al. (2014) Scoville, N. et al. 2014, ApJ, 783, 84.
- Shapley, Reddy et al. (2014) Shapley, A. E., Reddy, N. A., et al. 2014, ApJ.
- Silverman et al. (2015) Silverman, J. D. et al. 2015, ApJS, 220, 12.
- Smail, Ivison & Blain (1997) Smail, I., Ivison, R. J., and Blain, A. W. 1997, ApJ, 490, L5+.
- Smolcic et al. (2016) Smolcic, V. et al. 2016, ArXiv e-prints.
- Stanway et al. (2014) Stanway, E. R. et al. 2014, MNRAS, 444, 3466.
- Steidel et al. (2014) Steidel, C. C. et al. 2014, ApJ, 795, 165.
- Strom et al. (2016) Strom, A. L. et al. 2016, ArXiv e-prints.
- Swinbank et al. (2014) Swinbank, A. M. et al. 2014, MNRAS, 438, 1267.
- Swinbank et al. (2004) Swinbank, A. M. et al. 2004, ApJ, 617, 64.
- Tacconi et al. (2006) Tacconi, L. J. et al. 2006, ApJ, 640, 228.
- Tacconi et al. (2008) Tacconi, L. J. et al. 2008, ApJ, 680, 246.
- Veilleux & Osterbrock (1987) Veilleux, S. and Osterbrock, D. E. 1987, ApJS, 63, 295.
- Vieira et al. (2013) Vieira, J. D. et al. 2013, Nature, 495, 344.
- Wang et al. (2016) Wang, T. et al. 2016, ApJ, 828, 56.
- Wardlow et al. (2011) Wardlow, J. L. et al. 2011, MNRAS, 415, 1479.
- Weiß et al. (2009) Weiß, A. et al. 2009, ApJ, 705, L45.
- Younger et al. (2007) Younger, J. D. et al. 2007, ApJ, 671, 1531.
- Younger et al. (2009) Younger, J. D. et al. 2009, MNRAS, 394, 1685.
- Yun, Reddy & Condon (2001) Yun, M. S., Reddy, N. A., and Condon, J. J. 2001, ApJ, 554, 803.