A blowout jet associated with one obvious extreme-ultraviolet wave and one complicated coronal mass ejection event
Abstract
In this paper, we present a detailed analysis of a coronal blowout jet eruption which was associated with an obvious extreme-ultraviolet (EUV) wave and one complicated coronal mass ejection (CME) event based on the multi-wavelength and multi-view-angle observations from Solar Dynamics Observatory and Solar Terrestrial Relations Observatory. It is found that the triggering of the blowout jet was due to the emergence and cancellation of magnetic fluxes on the photosphere. During the rising stage of the jet, the EUV wave appeared just ahead of the jet top, lasting about 4 minutes and at a speed of 458 - 762 km s-1. In addition, obvious dark material is observed along the EUV jet body, which confirms the observation of a mini-filament eruption at the jet base in the chromosphere. Interestingly, two distinct but overlapped CME structures can be observed in corona together with the eruption of the blowout jet. One is in narrow jet-shape, while the other one is in bubble-shape. The jet-shaped component was unambiguously related with the outwardly running jet itself, while the bubble-like one might either be produced due to the reconstruction of the high coronal fields or by the internal reconnection during the mini-filament ejection according to the double-CME blowout jet model firstly proposed by Shen et al. (2012b), suggesting more observational evidence should be supplied to clear the current ambiguity based on large samples of blowout jets in future studies.
1 Introduction
Many kinds of jet activities have been observed in different layers of the solar atmosphere with various spectral lines, such as the photosphere jets, chromospheric H surges (Roy, 1973; Liu & Kurokawa, 2004), low coronal extreme ultraviolet (EUV) and X-ray jets (Shibata et al., 1992; Jiang et al., 2007b; Li et al., 2015; Liu et al., 2015; Shen et al., 2011), and white-light jets observed by coronagraphs in the outer corona. They are thought to play an important role in explaining the problems of coronal heating and the acceleration of fast solar wind (e.g., Shibata et al., 1992; Jiang et al., 2007b; Tian et al., 2014; Liu et al., 2015). Shimojo et al. (1996, 1998) analyzed X-ray jets and found important common characteristics. For example, the lifetime ranges from a few minutes to more than ten hours; the length ranges from a few 104 to 4 105 km; and the width ranges from 5 103 to 1 105 km; the velocity varies from 10 km s-1 to 1000 km s-1 and with an average velocity of about 200 km s-1; 72% of jets occur at the mixed polarity regions being mostly associated with small flares.
In the case of solar jets, however, the eruption properties are very different in dominant scales, velocities, configurations, and temperatures, while they have similar physical mechanism in nature. It is believed that jet eruptions are associated with magnetic flux emergence (Jiang et al., 2007b; Raouafi et al., 2016; Shen et al., 2017b). For example, Chae et al. (1999) presented several active-region EUV jets that were thought to be caused by the magnetic cancellation between the newly emerging and the pre-existing opposite magnetic polarities. Liu & Kurokawa (2004) analyzed a surge that was driven by emerging magnetic fluxes associated with low reconnection on the photosphere. Magnetic reconnection is thought to play an important role in the acceleration of solar jets (Shibata et al., 1994; Shen et al., 2011). Shibata et al. (1992) presented a standard two-dimensional jet model, in which an emerging magnetic bipole consecutively presses against the ambient opposite polarity open fields and the magnetic reconnection between open and closed fields that produces the jet. In recent years, this model has been widely tested in two-dimensional and three-dimensional simulations and subsequently adopted by the scientific community (Yokoyama & Shibata, 1995, 1996; Pariat et al., 2009; Archontis & Hood, 2010; Moreno-Insertis & Galsgaard, 2013; Li et al., 2017; Tian et al., 2017; Zhu et al., 2017).
By using high resolution multi-wavelengths observations, Moore et al. (2010) found a new type of coronal jet that was dubbed “blowout jets” by the authors. For a typical blowout jet, it consists of a brighter base and a broader spire compared to the standard jet configuration. In the sample studied in Moore et al. (2010), the authors found that about one-third of the jets are blowout jets, while the other two-third are standard jets. Shen et al. (2012b) firstly reported the existence of mini-filament eruption in the base of a blowout jet, and the authors augured that the formation of the cool component in the jet was due to the eruption of the mini-filament, rather than the cooling of the hot plasma flow as previously thought (e.g., Schmieder et al., 1994; Jiang et al., 2007a). Recently, Shen et al. (2017b) further confirmed their result by using high resolution observations taken by the one-meter New Vacuum Solar Telescope. Moore et al. (2013) expanded upon their earlier work (Moore et al., 2010) and found that about half of the jets are indeed blowout jets. The authors used not only X-ray but also EUV observations in Moore et al. (2013), and confirmed the results found in Shen et al. (2012b), namely that almost all blowout jets were accompanied by the eruption of mini-filament (or cool material) in the jet base. Many new studies further proposed that standard and blowout jets are fundamentally the same phenomenon, and all coronal jets are originated from mini-filament eruptions (e.g., Shen et al., 2012b; Zheng et al., 2012b; Shen et al., 2012a, 2017b, 2017a). These investigations highly suggested the importance of mini-filament eruptions for coronal jets.
Based on the jet model proposed by Moore et al. (2010), the dichotomy of coronal jets might be observed in the outer corona in coronagraphs. Specifically, a standard jet will be observed as a single jet-like coronal mass eruptions (CMEs), while a blowout jet implies the production of a jet-like and a simultaneous bubble-like CMEs. For standard jets, the corresponding CMEs in coronagraphs have been reported in various previous studies (e.g., Wang et al., 1998; Wang & Sheeley, 2002; Liu et al., 2005; Liu, 2008; Hong et al., 2011; Liu et al., 2015). However, so far the observations of the corresponding simultaneous CMEs for coronal blowout jets is still very scarce. Liu et al. (2011) reported the on-disk observations of a blowout jet that showed a loop-blob structure, and the authors conjectured that the erupting loop and blob might be a miniature version of CMEs in the low corona as speculated by Moore et al. (2010). The intriguing paired jet-like and bubble-like CMEs evolving from a single blowout coronal jet was firstly reported by Shen et al. (2012b) by using the stereoscopic high resolution observations taken from three different view angles. The authors proposed that the jet-like CME was directly produced by the external magnetic reconnection between open fields and the closed fields that confines the mini-filament, which is similar to the CMEs produced by standard jets. The external reconnection removes the field overlying the mini-filament and therefore results in the rising and eruption of the mini-filament, which subsequently evolves into the bubble-like CME in coronagraphs.
Global propagating extreme ultraviolet (EUV) waves were firstly detected by the Extreme-ultraviolet Imaging Telescope (EIT) onboard the Solar and Heliospheric Observatory spacecraft (SOHO; Delaboudinière et al., 1995; Moses et al., 1997; Thompson et al., 1998). In the recent two decades, most of the reported EUV waves were accompanied by large-scale energetic flares, and they were thought to be fast-mode magnetosonic waves driven by CMEs (Shen & Liu, 2012a, b; Shen et al., 2013, 2014a, 2014b; Li & Zhang, 2012; Yang et al., 2013). In addition, less energetic miniature eruptions can also lead to the appearance of EUV waves. Previous studies suggested that small-scale EUV waves are often associated with miniature eruptions such as micro-sigmoid, mini-filament, and coronal jets (e.g., Zheng et al., 2012b, c, 2013a, 2013b; Shen et al., 2017a). These miniature EUV waves have similar observational characteristics with their large-scale counterparts, and they were also regarded as fast-mode magnetosonic waves in nature. Previous studies indicated that micro EUV waves are often driven by expanding newly formed or pre-existing coronal loops caused by miniature eruptions such as micro-sigmoid, mini-filament, and coronal jets (e.g., Zheng et al., 2012a, b, c). Shen et al. (2017a) recently reported the detailed formation process of a micro EUV wave associated with a mini-filament eruption, in which the authors observed the separation of the EUV wave from the expanding coronal loop caused by the erupting mini-filament. Although miniature eruptions do not cause CMEs in coronagraphs due to their insufficient energy nature, the eruption structures including expanding loops and micro-sigmoids can be regarded as the initial state of CMEs in the low corona. Consequently, one can consider this EUV wave as driven by CME, similar to large-scale EUV waves.
In this paper, we present the observational analysis of an intriguing coronal blowout jet that occurred on 2011 March 09 in NOAA active region 11166, which was accompanied by a micro EUV wave and a paired simultaneous jet-like and bubble-like CMEs. This particular event not only confirms the observational results previously presented in Shen et al. (2012b) but also provides new clues for understanding the physics of coronal blowout jets. The paper is organized as follows: observations are introduced in Section 2; main observational results are presented in Section 3; discussions and conclusions are given in Section 4.
2 Observations
The coronal blowout jet was simultaneously observed by SDO, STEREO Ahead (STA), and STEREO Behind (STB) from three different view angles, and the positions of the three satellite are shown in Figure 1. On 2011 March 09 at 22:00:00 UT, the separation angle between STA and STB was about , while that between STA (STB) and SDO was about (). Since the event was close to the disk center in the field-of-view (FOV) of SDO, it was on the west and east disk limb in the FOVs of STA and STB, respectively. In addition, the eruption direction of the blowout jet is indicated by the green arrow in Figure 1. The Helioseismic and Magnetic Imager (HMI; Scherrer et al. 2012) onboard SDO provides full-disk line-of-sight (LOS) magnetograms with a pixel width of and a precision of 10 G with a 45 second cadence, while the Atmospheric Imaging Assembly (AIA; Lemen et al. 2012) onboard the SDO has 12-second cadence and exposures of 0.12-2 seconds, and it images the Sun up to 1.3 R☉ in seven EUV and three Ultraviolet (UV) wavelength bands with a pixel width of . The seven EUV wavelengths, 131 Å, 171 Å, 193 Å, 211 Å, 335 Å, and 94 Å, are due to strong iron lines with temperature range from 0.6 MK to 16 MK. The Extreme Ultraviolet Imager (EUVI; Howard et al. 2008) of the Sun Earth Connection Coronal and Heliospheric Investigation (SECCHI; Howard et al. 2008) onboard STEREO takes full-disk 304 Å images, which have a 5 and 10 minute cadence and a pixel width of . The inner coronagraphs (COR1) and the outer coronagraphs (COR2) (Thompson et al. 2003) onboard STA and STB take images with a cadence of 5 and 15 minutes, and their FOVs are from 1.4 to 4 R☉ and 2.5 to 15.6 R☉, respectively.
3 Results
3.1 The EUV Wave
The eruption of the blowout jet was accompanied by a GOES C9.4 flare, whose start, peak, and end times were at 22:03:00, 22:12:00, and 22:14:00 UT, respectively. The eruption of the jet started at about 22:05:00 UT and ended at about 22:25:00 UT, with hence a lifetime of about 21 minutes. It is interesting that an arc-shaped EUV wave appeared on the southeastern side of the jet at about 22:06:34 UT, which lasted for about 4 minutes. The EUV wave can be observed in the AIA 193, 171, and 211 Å images. The propagating EUV wave is shown in Figure 2 (a1) and (b1) with the AIA 171 and 193 Å running difference images, and the wavefront has been highlighted by green dashed curves. For detailed evolution process of the EUV wave, one can see the associated animation (animation1.mpeg) available in the online journal. Some important parameters of the jet and the EUV wave are also listed in Table 1. It is noted that the EUV wave only existed during the earlier stage of the jet’s evolution.
We use a semi-automatic method to obtain stack plots from wide sectors on the solar surface (see Liu et al. 2010). In Figure 3, four sectors of A – D are overlaid on the AIA 193 Å full-disk running difference image at 22:08:19 UT, and the position of the wavefront is also overlaid on the image as a dashed green curve. The stacked plots are made from AIA 171, 193, and 211 Å running difference images along the four sectors are plotted in Figure 4. In each stack plot, the propagating EUV wave can be observed as an inclined ridge. The slope of the ridge represents the velocity of the EUV wave, and it can be obtained by fitting the ridge with a linear function. The measurement results show that the EUV wave had different velocities in different directions. In stacked plots along Sector A (Figure 4 (a)–(c)), the wave signal only appeared in the 211 Å plot, and the wave velocity was about 458 km s-1. In stacked plots along Sector B (Figure 4 (d)–(f)), the EUV wave appeared in the 193 and 211 Å plots, which had a faster velocity of about 625 km s-1. The EUV wave is best detected along Sectors C (Figure 4 (g)–(i)) and D (Figure 4 (j)–(l)), and the velocities along the two directions were about 744 km s-1 and 762 km s-1, respectively.
3.2 The simultaneous CME event
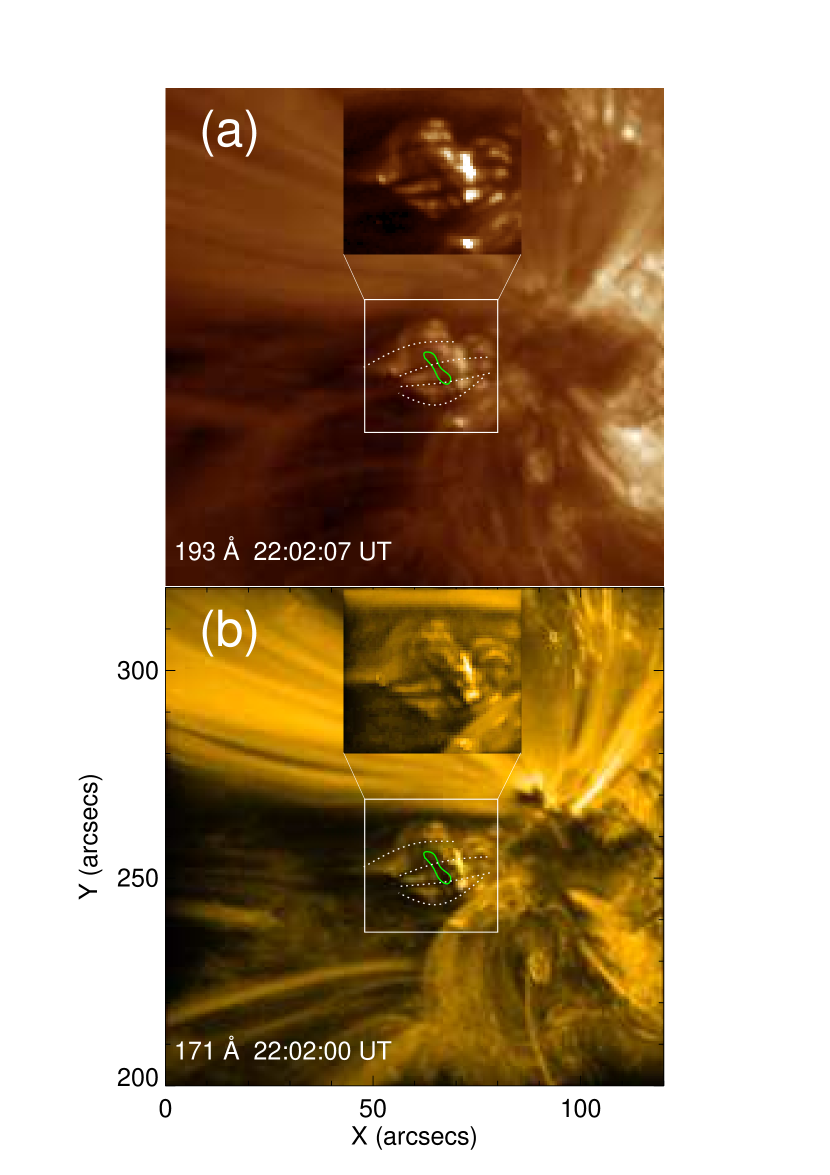
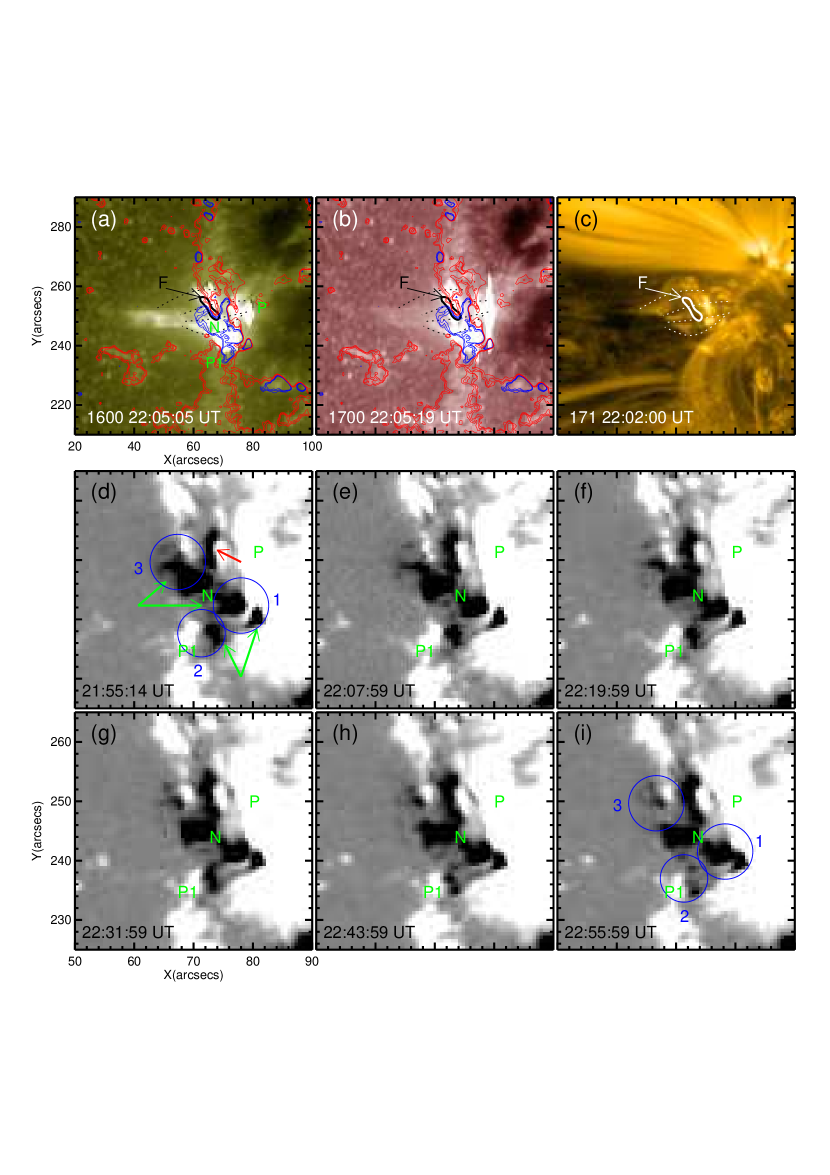
The close up view of the jet’s pre-eruption source region is shown in Figure 5 with the AIA 171 and 193 Å images. A mini-filament can be observed in the north-south direction, which was confined by a group of overlying loops. In Figure 5, the profile of the mini-filament is outlined with a green contour, while the overlying closed loops are indicated with dashed white curves. In the meantime, the details of the mini-filament and the overlying loops are also magnified in the insets (see animation2.mpeg; available in the accompanying online material).
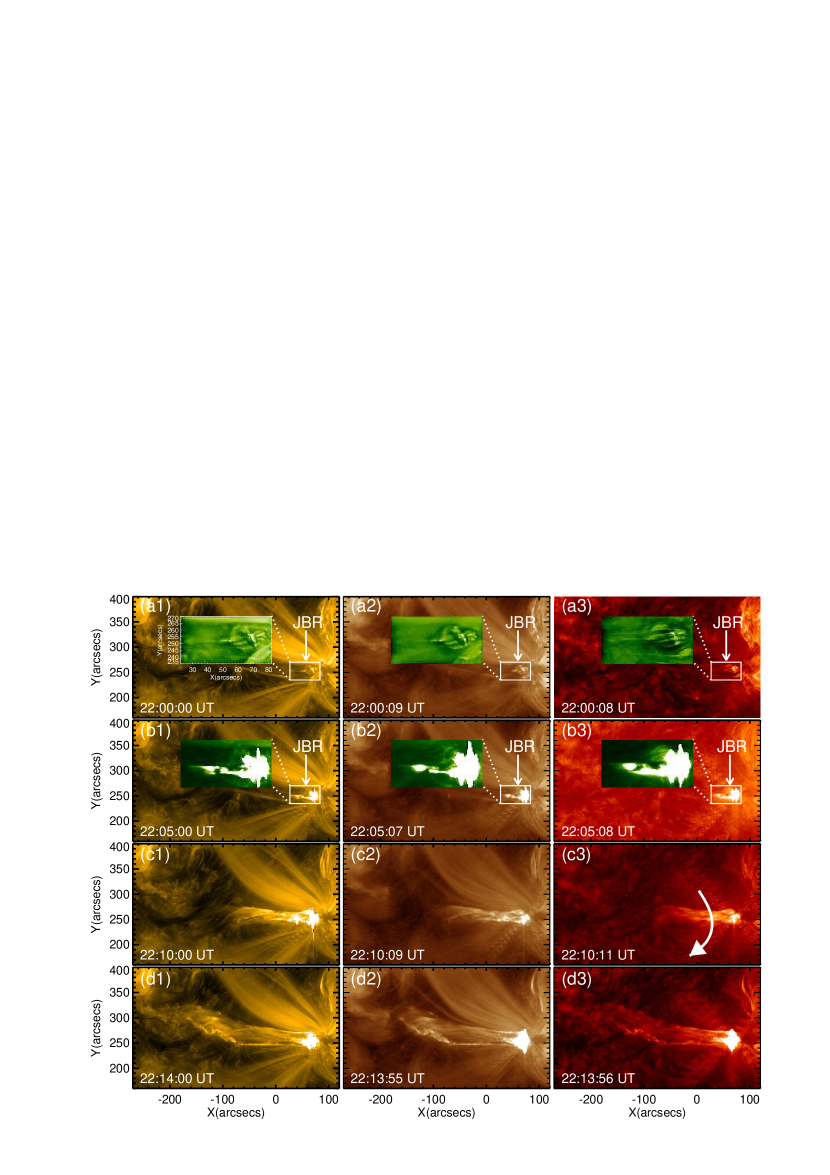
The evolution of the jet is shown in Figure 6 by using the AIA 171 Å, 193 Å, and 304 Å observations. In the top row of Figure 6, the mini-filament can be well identified in the insets which are running difference images of the box regions. The eruption of the jet started at about 22:05:00 UT causing an obvious brightening of the source region (see the second row of Figure 6). The eruption of the jet showed clear untwisting motion, with the rotation direction indicated by the white arrow in Figure 6 (c2). According to Shibata & Uchida (1986); Pariat et al. (2009, 2010); Shen et al. (2011), the untwisting motion of jets can be attributed to the releasing of magnetic twist stored in the emerging closed bipole into the ambient open magnetic fields through magnetic magnetic reconnection. In addition, the rotation motion is also a typical characteristic of coronal blowout jets (e.g., Shen et al., 2012b; Moore et al., 2013). The violent eruption of the jet is displayed in the the bottom two rows of Figure 6. At about 22:18:33 UT, the jet body split into two parts, in which the preceding part continued to move outward, while the following part started to fall back (see the arrows in Figure 2 (a2) and (b2)). During the violent eruption phase of the jet, dark material can be identified in the jet body (see the third row of Figure 6). This indicates the eruption of the mini-filament confined by the closed loops at the jet base region. Furthermore, it is noted that the brightening first occurred close to the south edge of the closed-loop system, which suggests that the magnetic reconnection occurred between the closed-loop system and the ambient open field lines on the south of the eruption source region.
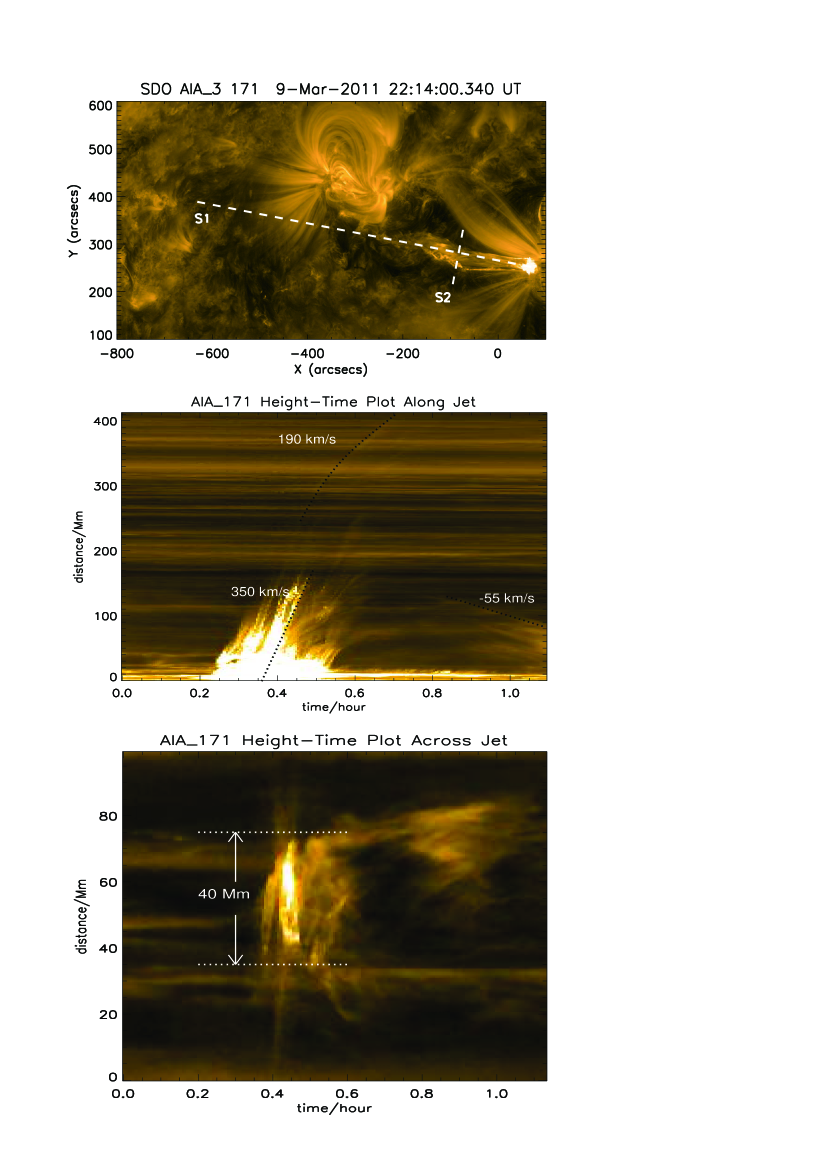
The kinematics of the jet is studied with time-distance plots along and across the jet’s main axis. The time-distance plots made from AIA 171 Å observations along the dashed lines (S1 and S2) in Figure 7 (a) are shown in Figure 7 (b) and (c), respectively. The maximum length and width of the jet were measured about 435 and 40 Mm, respectively. The main ejection speed of the jet was about 350 km s-1, while the speeds of the preceding and following parts of the jet were about 190 and -55 km s-1, respectively.
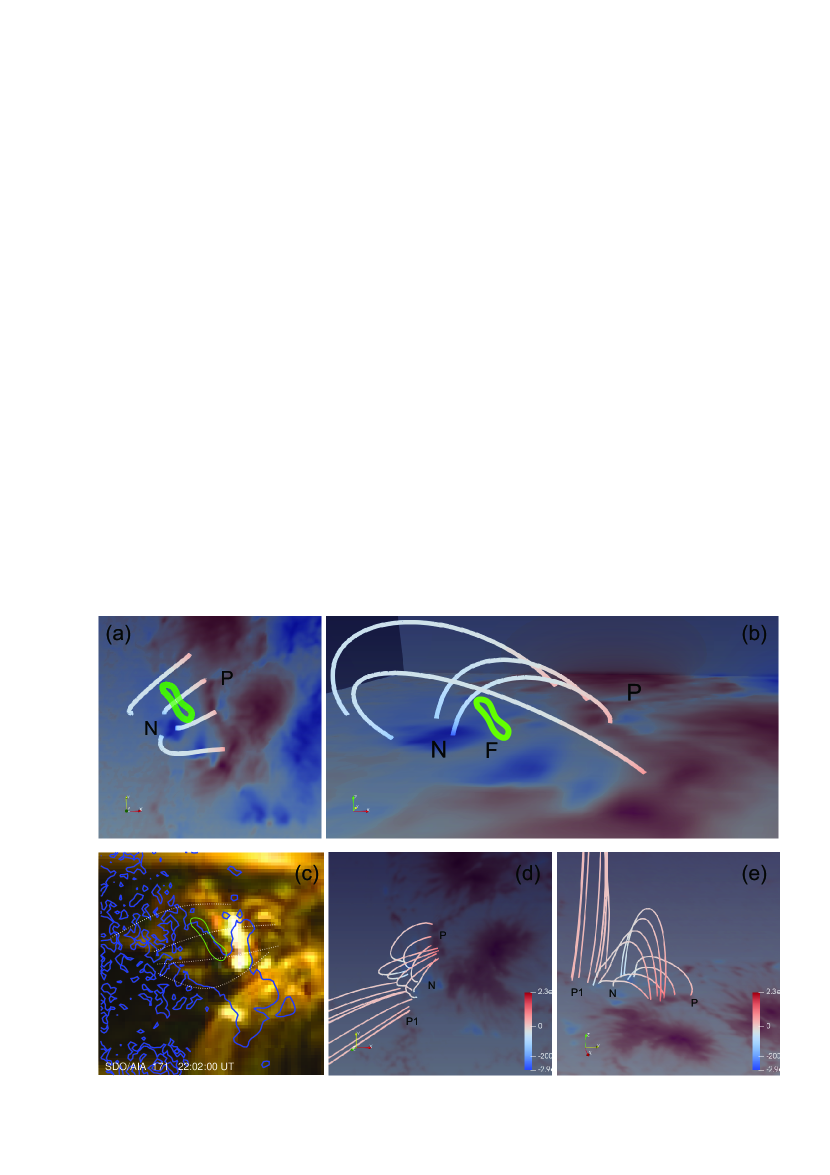
Figure 8 reports the results based on the force-field extrapolation (FFE) method (Zhu et al., 2013, 2016) applied to HMI vector magnetograms. Due to the small size of the mini-filament, it is hard to determine this filament structure in the FFE model. However, the closed and the ambient open fields can be well identified. We plot the profile of the mini-filament on the HMI LOS magentogram overlaid with the extrapolated field lines and the AIA 171 Å image at 22:02:00 UT (see Figure 8 (a) – (c)), which indicate that the mini-filament laid on the neutral line and was confined by the closed loops. Panels (d) and (e) show the extrapolated closed and the ambient open field lines as seen from different viewpoints, with the magnetic polarities are also marked as “P”, “N”, and “P1”, respectively. The extrapolated magnetic configuration is well consistent with the observational results revealed by the AIA 171 Å images as highlighted in Figure 6.
In the top row of Figure 9, the contours of the positive (red) and negative (blue) magnetic fields are overlaid on the AIA 1600 and 1700 Å images, in which the contour levels are G, G, G. The profile of the mini-filament is also overlaid on the AIA 1600 and 1700 Å images as a black contour, which indicates that the mini-filament laid on the magnetic neutral line between polarities of P and N. The HMI LOS magnetograms are displayed in the bottom two rows of Figure 9.
From (d) to (i), we use a series of HMI LOS magnetograms to emphasize the emergence and cancellation of the negative fluxes at the jet base. In panel (d), the green arrows indicate the cancellation of negative flux region and the red arrow indicates the emergence negative flux region, respectively. In order to indicate the detail of the cancellation, we plot three blue circles to display the very evident magnetic cancellation regions (see labels “1”, “2”, and “3”). From (d) to (i), we can clearly recognize the negative flux cancellation and negative emergence evolution at the jet base region (JBR). From (d) to (i) (from 21:55:59 UT to 22:55:59 UT), the region, indicated by a red arrow in panel (d), also shows the cancellation feature. In panel (i), the three circles present very evident cancellation feature. This may indicate that magnetic cancellation and emergence occurred at the JBR during the jet eruption in the whole stage and that the cancellation is more intense and quick than emergence. This is clear in the online animation made from SDO/HMI time sequence of images (animation4.mpeg).
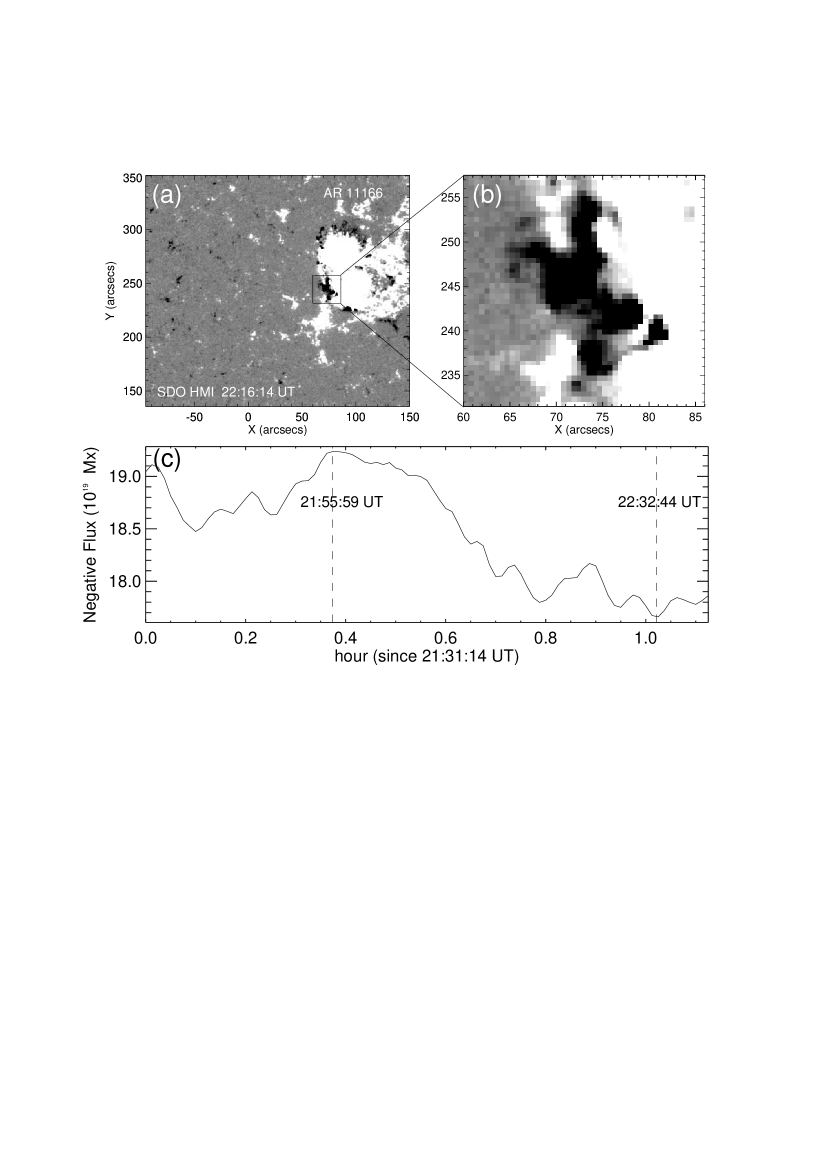
In Figure 10, the right panel is the magnified view of a sub-region highlighting the position of the jet base. The flux variation of the negative component, within the marked box, is reported in panel (c) from 21:31:14 UT to 22:38:44 UT. The maximum peak was at 21:55:59 UT, with a maximum reached absolute value of about 1019 Mx. The minimum was at around 22:32:44 UT, with a minimum absolute amount of about 1019 Mx.
It is important to pay more attention to the negative flux region because the positive flux region is too large and complex to precisely measure the positive flux evolution. In the box in panel (a) of Figure 10, the negative flux is isolated, but the positive flux is not isolated (it crosses the boundary of the box). Therefore, in order to look for evidence of flux emergence or cancelation at the base of the jet around the time of jet onset, we track the changes with time of the negative flux with the box in Figure 10 (a). Figure 10 b shows a close-up of the box region, and panel(c) reports the changes with time of the negative flux in that box. From Figures 9 and 10, the cancellation during the jet eruption appears to be more intensive and rapid than during the emergence process within the time of interest. The magnetic cancellation can usually produce enough energy able to drive a large-scale jet eruption (Liu & Kurokawa, 2004).
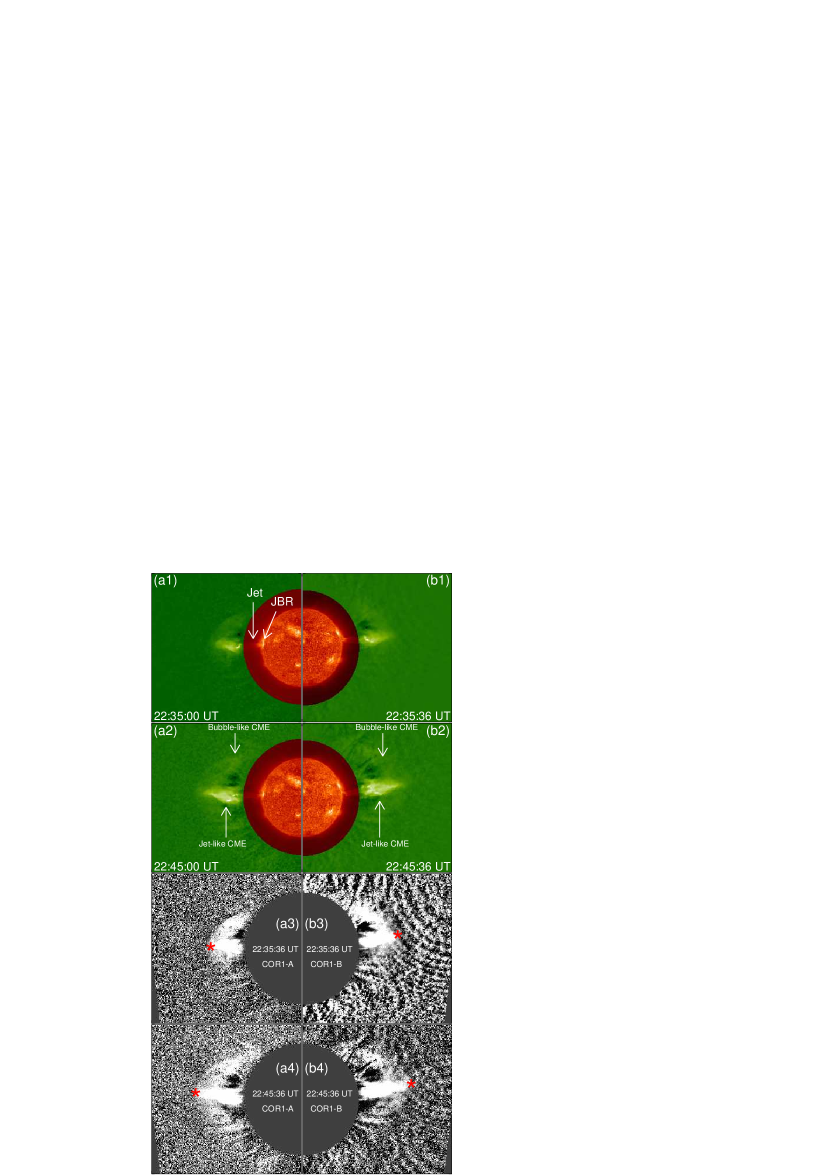
Interestingly, two different shaped CME structures, including a bubble-like and a jet-like structure, are observed to develop simultaneously with the top of the blowout jet that appeared in the FOVs of the COR1 Ahead and the COR1 Behind of the STEREO mission. The separation angles from Earth was nearly 90 for both STEREO A and B, and the two satellites have successfully photographed the blowout jet eruption. Using the STEREO EUVI 304 Å and COR1 images, we can further investigate this CME event. From the two viewpoints of STEREO satellites, one can observe the intriguing blowout jet and its different characteristics.
The EUVI 304 Å images and the COR1 running difference images are also used to show the evolution of the two simultaneous CME components in Figure 11. Panels (a1), (a2), (b1) and (b2) report the EUVI 304 Å and COR1 combined images. The JBR and the jet are highlighted in panel (a1) in the FOV of the COR1 instrument. Panels (a3), (a4), (b3) and (b4) illustrate the two CME components with running difference images. From this figure, the bubble-like component and the jet-like component seem to overlap symmetrically from the viewpoints of the two STEREO spacecrafts, and they could be distinguished from time 22:35 UT to 22:55 UT in the FOVs of COR1 Ahead and Behind of STEREO (see animation5.mpeg). In panels (b3) and (b4), the red “” mark denotes the top of the jet-like component. It is noted that this top point seemed to surpass the bubble-like CME component at some time, such as at 22:45 (b4). The animation5 displays the whole stage of the double CME components evolution in FOVs of COR1. Especially, the bubble-like CME component seemed to catch up with the top of the jet-like component at about 22:55 UT. Then their apexes simultaneously escaped from the FOVs of COR1, and are hardly distinguishable afterwards. From Table 1, the projected speed of the bubble-like component was faster than that of the jet-like one, averagely. Out of the FOVs of COR1, the apex of the bubble-like component was measured as surpassing the jet-like component, because in the two FOVs of STEREO/COR2 (an online movie highlights the process 111 https://cdaw.gsfc.nasa.gov/movie/makejavamovie.php?img1=stbcor2&img2=stacor2&stime =201103100000&etime=201103100400) the bubble-like component was always ahead of the jet-like component before they disappeared from the field of view early on March 10. From the observations presented here, we can not decide whether the two CME components belong to a same CME.
4 Discussion and Conclusions
Solar jet activities have been studied widely with its direct relationship to large-scale coronal activities (e.g., Liu, 2008; Shen et al., 2012b; Chen et al., 2015; Liu et al., 2015; Alzate & Morgan, 2016), but the association of jet eruptions with EUV waves and CME events have been rarely reported. In this paper, we present one interesting blowout jet which can show close relation to both EUV wave and CME productions. During this blowout jet event, a C9.4 flare occurred. The evolution of the blowout jet has been analyzed in detail with the multi-angle observations from the STEREO/EUVI/COR1/COR2 and SDO/AIA/HMI instruments which had simultaneously captured the whole process of the eruption. In our jet event, some special observational characteristics are found. Firstly, the blowout jet was associated with an EUV wave running ahead at its top. Secondly, the blowout jet eruption was associated with a mini-filament pre-existed at the base. Thirdly, clear CME evidence was found associated with the blowout jet, with one bubble-like CME front overlapped with one jet-like ’core’ seen from the STEREO LOS.
Additionally, from COR1 and COR2’s FOVs we can also clearly observe the evolution of the two CME components. Especially, and according to Table 1, the bubble-like component velocity was faster than the jet-like component after 22:45 UT. At about 04:00 UT on 10 March 2011, both the two CME components disappeared in the FOVs of COR2 A and B1.
At 22:25 UT, the jet preceding part became increasingly blurred out of the FOV of SDO. We use then the STEREO COR1 data to observe the two bright CME components. From the SDO LOS, the jet projection on the disk of the Sun appears like a baseball bat. From the STEREO viewing angle, the jet-like CME component resembles a candle flame, whose top seems very close to the bubble-like structure. In Table 1, the bubble-like and the jet-like CME components’ velocities are listed to be 220 km s-1 and 168 km s-1, respectively.
Shibata et al. (1992) presented a standard X-ray jet model, and Moore et al. (2010) further compared the standard jet model and the blowout jet model. The blowout jet model is more complex than the standard jet model. Moore et al. (2010, 2015) pointed out that a standard jet could not possess enough free energy to produce a CME, contrary to the blowout jet events. On the other hand, due to the interior complex field at the blowout jet base, the highly sheared fields can drive more interchange reconnections which will cause the blowout jet to be heated to EUV and X-ray emission regions in a short time scale.
In the study of Moore et al. (2013), a spinning motion in the eruptive growth phase was always observed for large X-ray jets. The cool component (mini-filament and other dark material encompassed the closed-loop system) was easily observed from the SDO/AIA 171, 193 and 304 Å wavelengths. Similarly, in our study we also notice a discernible spinning motion from 22:05 UT to 22:15 UT based on the movie (animation3.mpeg) during the mini-filament rising period. The blowout jet erupted with a C9.4 flare within the JBR. The eruption of the flare was so strong that a saturation effect was found within the data.
Our main findings are summarized as follows:
(1) In the jet base region, a bright arch patch was observed corresponding to magnetic flux cancellation process on the photosphere with an occurrence of a C9.4 flare. The initiation of the blowout jet occurred at almost the same time as the start of the brightening. These phenomena are explained as the manifestations of the external reconnection of the blowout jet in the lower atmosphere, while the reconnection site was possibly located under the upper chromosphere.
(2) On the one hand, the wave front expansion speed ranges from 458 km s-1 to 762 km s-1 in different directions, roughly of the order of the average surface projected expansion speeds for fast-mode waves (Wang, 2000). These speeds appear greater than typical EUV waves speeds of 200-400 km s-1(Klassen et al., 2000; Thompson & Myers, 2009). The EUV wave was faster than the blowout jet speed (190-350 km s-1), and the EUV wave front was easily distinguishable from the bubble-like CME structure. On the other hand, the wave was possibly triggered by the blowout jet or by the flare, but we favor the explanation that it was triggered by the blowout jet due to their close timing and location relations. The wave departed far from the flare center and showed a close location relative to the rapid blowout jet (animation1.mpeg). All the findings provide the evidence that the EUV wave was a fast-mode MHD wave and driven by the blowout jet.
(3) The blowout jet displayed both cool and hot components inside. The cool component (see Figure 6 dark material) was identified from the erupting mini-filament, while the hot component was considered as the hot outflow generated by the external reconnection. This motion was observed at the beginning of the erupting blowout jet. The untwisting motion can be interpreted by using the reconnection models that use induced magnetic unwinding as the driving mechanism (Shibata & Uchida, 1986; Pariat et al., 2009, 2010). The average speed of the jet was about 350 km s-1. At about 22:18 UT, the blowout jet split into two parts, and the speeds of the preceding and following parts of the jet were about 190 and -55 km s-1, respectively.
(4) From the STEREO/Ahead and Behind two viewpoints, a simultaneous bubble-like and a jet-like CME components appeared in the FOVs of COR1 and COR2. We find that the jet-like component was the extension of the hot component of the blowout jet body in the outer corona, while the bubble-like component was associated with the eruption of a mini-filament at the jet base. Physically, we suggested that the bubble-like front was produced either due to the reconstruction of the high coronal fields or by the internal reconnection during the mini-filament ejection according to the double-CME blowout jet model by Shen et al. (2012b). From Table 1, the bubble-like CME component velocity is faster than that of the jet-like component.
Worth to note here that this blowout jet eruption may present another case to support the scenario argued by Shen et al. (2012b) and Zheng et al. (2013a), in which an EUV wave and two different CME components (one bubble-like and one jet-like) can be produced and associated with each other in the blowout jet model. In other words, simultaneous bubble-like CME and jet-like CME may be related to the same coronal blowout jet. Nonetheless, the association phenomenon of a blowout jet with either EUV wave or CME event is still rather rare and unclear. We need more similar investigations to figure out the key process of the blowout jets in the future studies.
References
- Alzate & Morgan (2016) Alzate, N., & Morgan, H. 2016, ApJ, 823, 129
- Archontis & Hood (2010) Archontis, V., & Hood, A. W. 2010, A&A, 514, A56
- Chae et al. (1999) Chae, J., Qiu, J., Wang, H., & Goode, P. R. 1999, ApJ, 513, L75
- Chen et al. (2015) Chen, J., Su, J., Yin, Z., et al. 2015, ApJ, 815, 71
- Delaboudinière et al. (1995) Delaboudinière, J.-P., Artzner, G. E., Brunaud, J., et al. 1995, Sol. Phys., 162, 291
- Hong et al. (2011) Hong, J., Jiang, Y., Zheng, R., et al. 2011, ApJ, 738, L20
- Howard et al. (2008) Howard, R. A., Moses, J. D., Vourlidas, A., et al. 2008, Space Sci. Rev., 136, 67
- Jiang et al. (2007a) Jiang, Y., Chen, H., Shen, Y., Yang, L., & Li, K. 2007a, Sol. Phys., 240, 77
- Jiang et al. (2007b) Jiang, Y. C., Chen, H. D., Li, K. J., Shen, Y. D., & Yang, L. H. 2007b, A&A, 469, 331
- Klassen et al. (2000) Klassen, A., Aurass, H., Mann, G., & Thompson, B. J. 2000, A&AS, 141, 357
- Lemen et al. (2012) Lemen, J. R., Title, A. M., Akin, D. J., et al. 2012, Sol. Phys., 275, 17
- Li et al. (2017) Li, H., Jiang, Y., Yang, J., et al. 2017, ApJ, 836, 235
- Li & Zhang (2012) Li, T., & Zhang, J. 2012, ApJ, 760, L10
- Li et al. (2015) Li, X., Yang, S., Chen, H., Li, T., & Zhang, J. 2015, ApJ, 814, L13
- Liu et al. (2011) Liu, C., Deng, N., Liu, R., et al. 2011, ApJ, 735, L18
- Liu et al. (2015) Liu, J., Wang, Y., Shen, C., et al. 2015, ApJ, 813, 115
- Liu et al. (2010) Liu, W., Nitta, N. V., Schrijver, C. J., Title, A. M., & Tarbell, T. D. 2010, ApJ, 723, L53
- Liu (2008) Liu, Y. 2008, Sol. Phys., 249, 75
- Liu & Kurokawa (2004) Liu, Y., & Kurokawa, H. 2004, ApJ, 610, 1136
- Liu et al. (2005) Liu, Y., Su, J. T., Morimoto, T., Kurokawa, H., & Shibata, K. 2005, ApJ, 628, 1056
- Moore et al. (2010) Moore, R. L., Cirtain, J. W., Sterling, A. C., & Falconer, D. A. 2010, ApJ, 720, 757
- Moore et al. (2013) Moore, R. L., Sterling, A. C., Falconer, D. A., & Robe, D. 2013, ApJ, 769, 134
- Moore et al. (2015) Moore, R. L., Sterling, A. C., & Falconer, D. A. 2015, ApJ, 806, 11
- Moreno-Insertis & Galsgaard (2013) Moreno-Insertis, F., & Galsgaard, K. 2013, ApJ, 771, 20
- Moses et al. (1997) Moses, D., Clette, F., Delaboudinière, J.-P., et al. 1997, Sol. Phys., 175, 571
- Pariat et al. (2009) Pariat, E., Antiochos, S. K., & DeVore, C. R. 2009, ApJ, 691, 61
- Pariat et al. (2010) —. 2010, ApJ, 714, 1762
- Raouafi et al. (2016) Raouafi, N. E., Patsourakos, S., Pariat, E., et al. 2016, Space Sci. Rev., 201, 1
- Roy (1973) Roy, J. R. 1973, Sol. Phys., 28, 95
- Scherrer et al. (2012) Scherrer, P. H., Schou, J., Bush, R. I., et al. 2012, Sol. Phys., 275, 207
- Schmieder et al. (1994) Schmieder, B., Golub, L., & Antiochos, S. K. 1994, ApJ, 425, 326
- Shen et al. (2014a) Shen, Y., Ichimoto, K., Ishii, T. T., et al. 2014a, ApJ, 786, 151
- Shen & Liu (2012a) Shen, Y., & Liu, Y. 2012a, ApJ, 754, 7
- Shen & Liu (2012b) —. 2012b, ApJ, 752, L23
- Shen et al. (2012a) Shen, Y., Liu, Y., & Su, J. 2012a, ApJ, 750, 12
- Shen et al. (2012b) Shen, Y., Liu, Y., Su, J., & Deng, Y. 2012b, ApJ, 745, 164
- Shen et al. (2011) Shen, Y., Liu, Y., Su, J., & Ibrahim, A. 2011, ApJ, 735, L43
- Shen et al. (2013) Shen, Y., Liu, Y., Su, J., et al. 2013, ApJ, 773, L33
- Shen et al. (2017a) Shen, Y., Liu, Y., Tian, Z., & Qu, Z. 2017a, ApJ, 851, 101
- Shen et al. (2014b) Shen, Y., Liu, Y. D., Chen, P. F., & Ichimoto, K. 2014b, ApJ, 795, 130
- Shen et al. (2017b) Shen, Y., Liu, Y. D., Su, J., Qu, Z., & Tian, Z. 2017b, ApJ, 851, 67
- Shibata et al. (1994) Shibata, K., Nitta, N., Strong, K. T., et al. 1994, ApJ, 431, L51
- Shibata & Uchida (1986) Shibata, K., & Uchida, Y. 1986, Sol. Phys., 103, 299
- Shibata et al. (1992) Shibata, K., Ishido, Y., Acton, L. W., et al. 1992, PASJ, 44, L173
- Shimojo et al. (1996) Shimojo, M., Hashimoto, S., Shibata, K., et al. 1996, PASJ, 48, 123
- Shimojo et al. (1998) Shimojo, M., Shibata, K., Yokoyama, T., & Hori, K. 1998, in ESA Special Publication, Vol. 421, Solar Jets and Coronal Plumes, ed. T.-D. Guyenne, 163
- Thompson & Myers (2009) Thompson, B. J., & Myers, D. C. 2009, ApJS, 183, 225
- Thompson et al. (1998) Thompson, B. J., Plunkett, S. P., Gurman, J. B., et al. 1998, Geophys. Res. Lett., 25, 2465
- Thompson et al. (2003) Thompson, W. T., Davila, J. M., Fisher, R. R., et al. 2003, in Proc. SPIE, Vol. 4853, Innovative Telescopes and Instrumentation for Solar Astrophysics, ed. S. L. Keil & S. V. Avakyan, 1–11
- Tian et al. (2014) Tian, H., DeLuca, E. E., Cranmer, S. R., et al. 2014, Science, 346, 1255711
- Tian et al. (2017) Tian, Z., Liu, Y., Shen, Y., et al. 2017, ApJ, 845, 94
- Wang (2000) Wang, Y.-M. 2000, ApJ, 543, L89
- Wang & Sheeley (2002) Wang, Y.-M., & Sheeley, Jr., N. R. 2002, ApJ, 575, 542
- Wang et al. (1998) Wang, Y.-M., Sheeley, Jr., N. R., Socker, D. G., et al. 1998, ApJ, 508, 899
- Yang et al. (2013) Yang, L., Zhang, J., Liu, W., Li, T., & Shen, Y. 2013, ApJ, 775, 39
- Yokoyama & Shibata (1995) Yokoyama, T., & Shibata, K. 1995, Nature, 375, 42
- Yokoyama & Shibata (1996) —. 1996, PASJ, 48, 353
- Zheng et al. (2012a) Zheng, R., Jiang, Y., Yang, J., et al. 2012a, ApJ, 747, 67
- Zheng et al. (2013a) —. 2013a, ApJ, 764, 70
- Zheng et al. (2012b) —. 2012b, ApJ, 753, 112
- Zheng et al. (2012c) —. 2012c, ApJ, 753, L29
- Zheng et al. (2013b) Zheng, R.-S., Jiang, Y.-C., Yang, J.-Y., et al. 2013b, MNRAS, 431, 1359
- Zhu et al. (2017) Zhu, X., Wang, H., Cheng, X., & Huang, C. 2017, ApJ, 844, L20
- Zhu et al. (2016) Zhu, X., Wang, H., Du, Z., & He, H. 2016, ApJ, 826, 51
- Zhu et al. (2013) Zhu, X. S., Wang, H. N., Du, Z. L., & Fan, Y. L. 2013, ApJ, 768, 119
| Event | Start Time | Flare222https://www.solarmonitor.org/?date=20110309 | Speed | Angular | End Time | Dur. Time | |
|---|---|---|---|---|---|---|---|
| 2011-Mar-09 | (UT) | class | (km s-1) | inclination (∘) | (UT) | (min) | |
| Jet | 22:05:00 | C9.4 | 190/350333the main ejection speed of the jet is about 350 km s-1 and the preceding part average velocity is about 190 km s-1, respectively. | 40 5 | 22:25:00 | 20 | |
| Wave | 22:06:34 | 458-762 | 22:10:34 | 4 | |||
| CME components | 22:25:00 | 220/168444the bubble-like CME component average velocity is about 220 km s-1 and the jet-like is about 168 km s-1 | 04:00:00+1 day | 355 |