Molecular Origin of Limiting Shear Stress of Elastohydrodynamic Lubrication Oil Film Studied by Molecular Dynamics
Abstract
All-atom molecular dynamics simulations of an elastohydrodynamic lubrication oil film are performed to study the effect of pressure. Fluid molecules of n-hexane are confined between two solid plates under a constant normal force of 0.1–8.0 GPa. Traction simulations are performed by applying relative sliding motion to the solid plates. A transition in the traction behavior is observed around 0.5–2.0 GPa, which corresponds to the viscoelastic region to the plastic–elastic region, which are experimentally observed. This phase transition is related to the suppression of the fluctuation in molecular motion.
Highlights
-
1.
A mechanism for the limited shear-stress transition of an elastohydrodynamic lubrication (EHL) oil film is proposed.
-
2.
The spatial structure and velocity profile showed gradual changes.
-
3.
Suppression of the fluctuation is found in the EHL regime.
1 Introduction
Machine elements in which large loads are transmitted, such as a traction-drive continuously variable transmission (CVT), work in the elastohydrodynamic lubrication (EHL) regime [1]. The molecular dynamic behavior of the oil film for EHL is not well-understood since the long trajectories of ensembles of a large number of fluid molecules are required to analyze the drastic phase transition induced by a high pressure. Typical practical EHL conditions include a film thickness on the order of a submicron and a shear rate less than 106 /s for a submicron thick film [2]. Although this film thickness exceeds the range of van der Waals structural forces of the solid plates, the behavior of the fluid layer differs from that of the bulk, i.e., the traction coefficients (the tangential traction force divided by the normal load) cannot be easily deduced from the bulk shear viscosity.
In this letter, we report molecular dynamics (MD) simulations to study the effect of pressure. The hydrocarbon molecules are confined between two solid atom layers, and the pressure is added as a normal force to the solid atom layers. The solid atom layers move at a constant velocity so that shear is induced in the fluid film. Previous simulation of a submicron-thickness oil film showed quantitative agreement between experiment and simulation [2, 3]. Here, we extend our study to examine the effect of an external pressure, in molecular level. In an EHL oil film, for an increasing external pressure, traction, i.e., the friction coefficient, saturates and does not depend on the shear rate at some pressure, which is called the limiting shear stress. Although this transition is assumed to have a relationship with glass transition from liquid-like state to solid-like state, the state of the fluid in EHL film is not the same as in a static condition of materials [4]. Moreover, the mechanism of the glass transition is under discussion, especially for hydrocarbons. For example, mode-coupling theory is a candidate for explaining the glass transition of particles, and the internal degrees of freedom coupled with the intermolecular interaction are very complex to model [5]. An all-atom non-equilibrium MD simulation is an effective tool to simulate the phase behavior under shear for understanding these phenomena. We use -hexane fluid molecule as a typical hydrocarbon oil, in order to obtain a universality of the origin of limiting shear stress.
2 Method
All-atom MD simulations of a lubricating oil film confined between solid walls under shear conditions are executed using the following procedure. -hexane is chosen as the fluid molecule so that the general behaviors of the hydrocarbon oils are simulated. The related sliding speed of the solid walls is set to = 1.0 m/s, which is the usual driving condition in macroscopic machine elements such as a CVT.
In the MD simulation, the hydrocarbon molecules are dynamically treated using the AMBER force field [6]. On the and axes, periodic boundary conditions are adopted for the hexahedron simulation cell, where is the sliding direction, and is the direction of the fluid film thickness. The temperature is controlled at 350 K using the Nosé–Hoover thermostat [7]. All molecules are connected to a heat bath. While this has been shown to affect the rheology of the confined fluids at shear rates above (in reduced Lennard–Jones units), the low shear rates here, a maximum of , suggest that such artifacts should be negligible [8, 9]. Each simulation step corresponds to 0.5 fs, and the time integral due to the motion of the atoms and molecules is calculated by the reversible reference system propagation algorithm (rRESPA) [10] method. The solid plate of an alpha-ferrous crystal is modeled as a solid atom layer with a lattice of in the directions, and the lattice parameter is set to 2.87 Å. The fluid–solid interface is the (100) surface, and the vibrations of each solid atom are suppressed. The Lennard–Jones parameter for solid atoms is then set to 12.14 kcal/mol [2] in order to suppress boundary slip [3].
Constant shear states under a constant pressure and constant sliding velocity are obtained using the following procedure. A set of fluid molecules is first arranged in a lattice configuration. The molecules are then moved by the MD simulation under the periodic boundary conditions in the , and directions at a constant temperature of 350 K until a thermal equilibrium is obtained. Next, several sets of thermal equilibrium fluids are arranged in the direction between two solid plates. Fluid molecules are compressed by the MD simulation under the periodic boundary conditions in the and directions by applying a constant pressure, , to the plates. The stress in the plates is in the direction. A shear in the direction is then applied by the relative sliding motion of the Fe plates at the constant velocity, . The number of atoms is set to 576, which corresponds to a film thickness of 10 nm at 1 GPa to simulate a sufficiently thick oil film. If the oil film thickness is too small, the solid like behavior, such as stick-slip occur [2]. The film thickness is calculated from the average of the difference between the highest and lowest fluid molecules in the fluid film. The simulation code is parallelized and tested on a massively parallel computer, which was described in our previous work [2, 3].
3 Results and Discussion
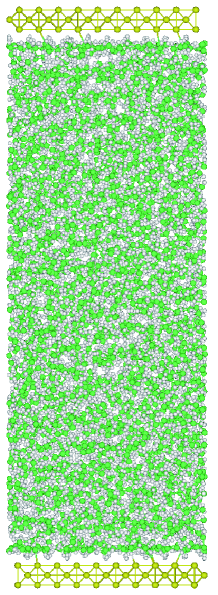
The effect of the external pressure is studied by simulations of a 50-ns-long trajectory for each . Snapshot of the simulation of an -hexane film in steady shear state with the relative sliding speed of = 1.0 m/s, and at external pressure GPa, is shown in Fig. 1. The highly layered fluid molecules are found in the vicinity of the wall which is already reported in our previous work [2, 3]. In comparison with snapshots in other external pressures (they are shown in the graphical abstract), the film thickness is small and the density of the fluid molecules is high.
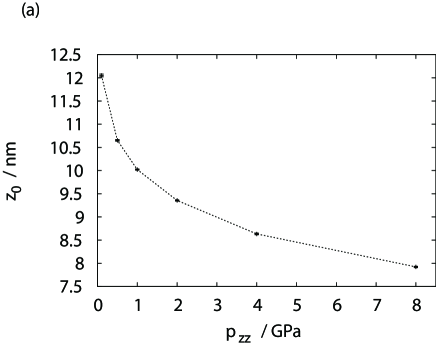
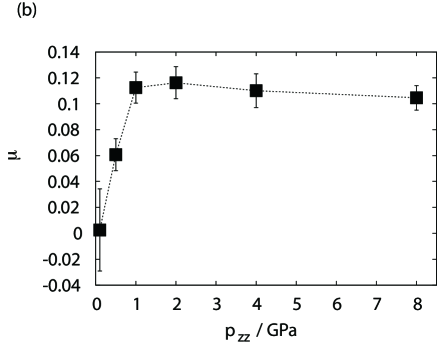
Figure 2a shows the external pressure dependence of the film thickness. The film thickness decreases monotonically with the increase in the external pressure. This tendency resembles that observed in experiments [11]. In more detail, there would be a step decrease in the film thickness, which is shown for the liquid-solid transition in the bulk. In our simulation, however, finding the precise transition point is out of scope, since the system is under confinement and shear, we cannot compare with the experiment directly. The comparision of the static phase transition with the experiments in many kind of fluid molecules will be shown in the our next paper. Figure 2b shows the external pressure dependence of the traction coefficient. The traction coefficient is calculated from the average force acting on both solid sheets divided by the external pressure . The traction coefficient first increases monotonically with the increase in the external pressure and plateaus when GPa. Although the shear rate differs in our simulation since the number of molecules is fixed so that the film thickness decreases owing to the increase in the external pressure, the simulation results show saturation of the shear stress. The limiting shear stress observed in the experiments is reproduced in the simulation, and a transition in the change in the traction coefficients is observed around = 0.5–1.0 GPa. This pressure regime may correspond to the melting pressure of -hexane at 350K [12]. Although the range of critical almost corresponds to the experimental range, the critical traction coefficient cannot predicted quantitatively since the film thickness is very different under the experimental conditions and simulation conditions [2]. Therefore, we discuss the origin of the limiting shear stress qualitatively in the following.
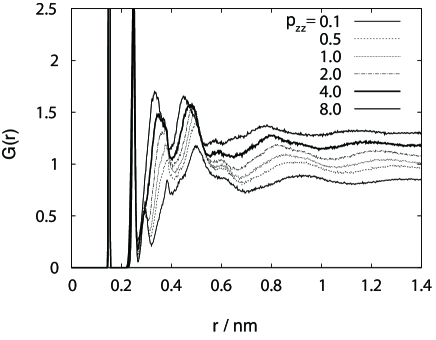
From the experiments, this transition corresponds to a phase transition from the viscoelastic region to the plastic–elastic region [4]. In order to analyze the molecular mechanism of the phase transition, radial distribution functions (RDFs) are suitable for describing the static structural change in the ensemble of fluid molecules. Figure 3 shows the RDFs of the carbon atoms in the fluid molecules at the center of the fluid film. The molecules are chosen such that they are located 25% to 75% of the distance between plates. Note that the first and second peaks correspond to the peaks between atoms in their own molecules. The outer region (r 0.3 nm) shows the peaks in the intermolecular distribution of carbon atoms. In the RDFs, liquid-like distributions that have a single peak or two peaks in the outer region are found at a low pressure of = 0.1–0.5 GPa. As the pressure increases, the sharpness of the peaks in the outer region increases, and shifts in the peaks are observed. This is due to the increase in the density of the oil film. In other words, a decrease in the free volume of hydrocarbon molecules occurs, and the internal bond length between each internal atom is preserved within the simulated range of external pressures. From the viewpoint of the phase transition, however, the change in the RDFs is gradual, and an obvious transition in the curves around = 1.0 GPa is not observed. This means that the transition is not only related to the arrangement of the molecules.
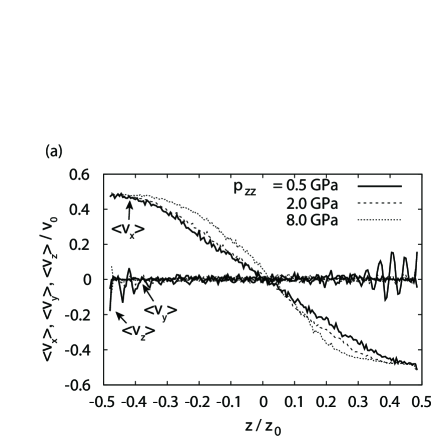
In order to discuss the dynamic motion of the molecules, the velocity profiles at a low pressure ( = 0.5 GPa), high pressure ( = 2.0 GPa), and very high pressure ( = 8.0 GPa) are plotted in Fig. 4a. , and are the velocities in the , and directions, respectively, and denotes the time average. At every external pressure , and are very low owing to the conservation of momentum. The small oscillation of observed in the vicinity of both walls may due to the structuring of the fluid molecules [2, 3]. The velocity profiles for differ for the external pressures. Newtonian-like profiles are observed at a low pressure, whereas non-Newtonian profiles are observed more strongly at higher pressures, which suggests an increase in the elastic interactions between molecules. The difference, however, is to small to explain the dramatic change in the traction behavior.
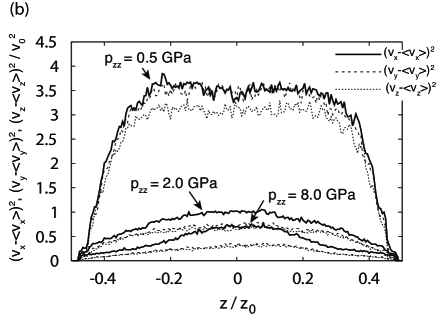
The differences in the molecular motion at low and high pressures are clearly shown in the profiles of the velocity fluctuation, which are shown in Fig. 4b. At a low pressure of =0.5 GPa, the degree of fluctuation in the velocity is three times larger than that at a high pressure. Moreover, plateau regions, i.e. regions in which the fluctuation curves are saturated are observed at the center of the oil film. This means that the effect of the wall is in a limited region from the wall, and the motions of the molecules do not depend on the film thickness. The and curves are almost identical and exhibit larger values than the curves. This means that the fluctuations in the molecules are suppressed stronger in the direction than in the directions owing to the system confinement. Thus, the molecules can change positions in either the or directions, which is described by the Eyring viscosity [13].
At high pressures of =2.0 and 8.0 GPa, a plateau region is not observed, which indicates that the effect of the wall, reaches the center of the film in EHL regime. This is not because the local pressure at the center of the film change as the normal pressure increase. The region of the correlation, such as the momentum correlation length in our previous paper [3], which is more than 50 nm under =1.0 GPa, has changed due to the increase of the external pressure. Here, the curves of and are identical. This means that fluctuation in the direction is suppressed, as in direction, so that the molecules are caught at fixed positions. In the direction, the shear field causes a larger fluctuation than in the other directions. The bump shown in the curve of at =8.0 GPa may be related to the larger shear field at the center of the oil film. This suggests that the plasticity is related to the suppression of fluctuation in the molecular motion.
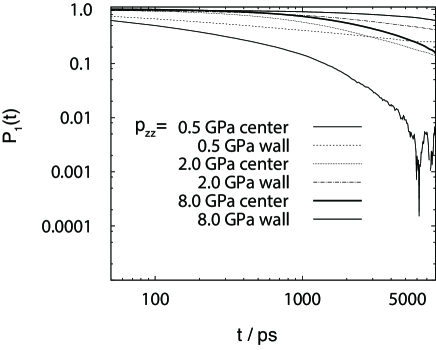
This tendency is also observed from an analysis of the segment (bond) motions. In Fig. 5, the autocorrelation functions of each segment of the -hexane molecules are plotted for the ensemble of molecules in the vicinity of the solid walls and at the center of the fluid layers at a low pressure of = 0.5 GPa and high pressures of = 2.0 and 8.0 GPa. Here, is a unit vector of , and is the angle between at times and . Long-time tails of the correlation functions are observed in the vicinity of the walls. The relaxation times of the segment motions calculated from fitting the curves at the center of the fluid are 312, 2,294, and 3,846 ps at = 0.5, 2.0, and 8.0 GPa, respectively. At the wall, the relaxation times are 1,245, 10,913, and 23,161 ps at = 0.5, 2.0, and 8.0 GPa, respectively. The longer relaxation times observed for higher pressures at the center of the films are consistent with the explanation of the velocity fluctuation in Fig. 4b. At high pressures of = 2.0 and 8.0 GPa, the shear field does not induce a relative positional change in the molecular structure in the and directions so that the correlations between the bonds are almost fixed not only in the vicinity of the walls but at the center of the film.
The MD simulations have demonstrated that the EHL transition is not clearly observed from the change in the static liquid structure to the solid-like structure shown in Fig. 3. The dynamics of the average velocity in Fig. 4a show slight differences. A change is clearly observed for the velocity fluctuation in Fig. 4b. The velocity fluctuation is suppressed by a factor of more than three at a high pressure, and the bulk region of the velocity fluctuation disappeared. This change is also shown from the analysis of the segment motions in Fig. 5.
We have not taken into consideration of occurence of shear bands [4], which is one of the explanation to the internal slip hypothesis for pressure independent shear stress. However, we have already obtained some characteristic features of the limiting shear stress in EHL film. From the continuous velosity profile in Fig. 4a, the shear localization or slip, which is related to the shear band is not found. In our simulation, the saturation of the traction coefficient is related to the bump of the velocity fluctuation at the center of the fluid film, which is shown in the curve of = 8.0 GPa in Fig. 4b. The excess shear force may be canceled by the increase of the fluctuation in direction at the center. The relation between our mechanism and experimentally observed shear bands would be explained in the long time simulation in realistic oil film thickness.
In our simulation, the temperature is set to a constant value of 350 K using the Nosé–Hoover thermostat for every molecule in the system. Although the shear softening effect by heating a viscoelastic fluid by shear field [14] is not treated in the simulation, we already succeeded in reproducing the saturation in the traction coefficient reported by experiments.
In order to explain all experimental phenomena, the heat transport within the film thickness under the experimental conditions may also be studied in future simulations.
4 Conclusions
All-atom MD simulations are used to calculate the effect of pressure under confinement and sliding. The limiting shear stress of the EHL molecular oil film is reproduced by the simulation. This phase transition is related to the suppression of the fluctuation in the molecular motion.
Acknowledgement
This work was partially supported by the Next Generation Super Computing Project, Nanoscience Program, Ministry of Education, Culture, Sports, Science and Technology, Japan. We also thank Prof. Dr. Shi-aki Hyodo, Dr. Shuzo Sanda and Prof. Dr. Yuichi Nakamura for useful discussions.
References
References
- [1] D. Dowson, G. Higginson (Eds.), Elasto-Hydrodynamic Lubrication (SI Edition), si edition Edition, International Series on Materials Science and Technology, Pergamon, 1977.
- [2] H. Washizu, T. Ohmori, Molecular dynamics simulations of elastohydrodynamic lubrication oil film, Lubrication Sciences 22 (2010) 323.
- [3] H. Washizu, S. Hyodo, S. Ohmori, N. Nishino, A. Suzuki, Macroscopic no-slip boundary condition confirmed in full atomistic simulation of oil film, Tribology Online 9 (2) (2014) 45–50.
- [4] S. Bair (Ed.), High pressure rheology for quantitative elastohydrodynamics, Elsevier, 2007.
- [5] K. Miyazaki, D. Reichman, R. Yamamoto, Supercooled liquids under shear: Theory and simulation, Phys. Rev. E 70 (011501).
- [6] W. D. Cornell, P. Cieplak, C. I. Bayly, I. Gould, K. M. Jr, D. Ferguson, D. Spellmeyer, T. Fox, J. Caldwell, P. Kollman., A second generation force field for the simulation of proteins and nucleic acids, J. Am. Chem. Soc. 117 (1995) 5179–5197.
- [7] S. Nose, A unified formulation of the constant-temperature molecular dynamics methods, J. Chem. Phys. 81 (1984) 511.
- [8] R. Khare, J. de Pablo, A. Yethiraj, Molecular simulation and continuum mechanics study of simple fluids in non-isothermal planar couette flows, J. Chem. Phys. 107(7) (1997) 2589–2596.
- [9] M. L. Greenfield, H. Ohtani, Packing of simulated friction modifier additives under confinement, Langmuir 21 (2005) 7568–7578.
- [10] M. Tuckerman, B. J. Berne, G. J. Martyna, Reversible multiple time scale molecular-dynamics, J. Chem. Phys. 97 (3) (1992) 1990.
- [11] P.W. Bridgman, Viscosities to 30,000 Kg/cm2: Further Rough Compressions to 40,000 Kg/cm2, Especially Certain Liquids, Proceedings of the American Academy of Arts and Sciences (1949) 138.
- [12] P. Morawski, J.A.P. Coutinho, U. Domanska, High pressure (solid + liquid) equilibria of n-alkane mixtures: experimental results, correlation and prediction, Fluid Phase Equilibria 230 (2005) 72–80.
- [13] H. Eyring, Viscosity, plasticity, and diffusion as examples of absolute reaction rates, J. Chem. Phys. 4 (1936) 283.
- [14] H. Kobayashi, Y. Fujita, Mechanisms for three kinds of limiting shear stresses appearing in the traction modes of viscous, viscoelastic, and glassy states of lubricants, J. Appl. Phys. 115 (2014) 223509.