New constraints on the millimetre emission of six debris disks
Abstract
The presence of dusty debris around main sequence stars denotes the existence of planetary systems. Such debris disks are often identified by the presence of excess continuum emission at infrared and (sub-)millimetre wavelengths, with measurements at longer wavelengths tracing larger and cooler dust grains. The exponent of the slope of the disk emission at sub-millimetre wavelengths, ‘’, defines the size distribution of dust grains in the disk. This size distribution is a function of the rigid strength of the dust producing parent planetesimals. As part of the survey ‘PLAnetesimals around TYpical Pre-main seqUence Stars’ (PLATYPUS) we observed six debris disks at 9-mm using the Australian Telescope Compact Array. We obtain marginal ( 3-) detections of three targets: HD 105, HD 61005, and HD 131835. Upper limits for the three remaining disks, HD 20807, HD 109573, and HD 109085, provide further constraint of the (sub-)millimetre slope of their spectral enery distributions. The values of (or their limits) derived from our observations are all smaller than the oft-assumed steady state collisional cascade model (), but lie well within the theoretically expected range for debris disks to 4. The measured values for our targets are all 3.3, consistent with both collisional modelling results and theoretical predictions for parent planetesimal bodies being ‘rubble piles’ held together loosely by their self-gravity.
keywords:
stars: circumstellar matter – stars: planetary systems – stars: individual: HD 105, HD 20807, HD 61005, HD 109085, HD 109573, HD 131835.1 Introduction
The debris disks observed around main sequence stars are the remnants of primordial proto-planetary disks (Williams & Cieza 2011; Wyatt et al. 2015), their constituent dust produced through the collisional attrition of asteroidal and cometary bodies, or deposition by sublimation from comets (Wyatt 2008; Matthews et al. 2014). The size distribution of dust grains in a disk is observationally estimated by measuring the slope of the sub-millimetre emission from the disk (Beckwith et al. 1990; Gáspár et al. 2012). This slope is a function of the dust emissivity, stellar luminosity (Burns et al. 1979), and the collisional state of the disk (Krivov 2010).
Collisional models of disks produce different predictions for the grain size distribution depending on the dynamical state or physical condition of the colliding planetesimals. In the steady state scenario, a collisional cascade results from inelastic collisions and fragmentation that results in the dust grains following a power law size distribution, i.e. , with a of 3.5 (Dohnanyi 1969). That standard model assumes a single constant tensile strength and velocity dispersion of the colliding bodies independent of their size. Such a scenario is unlikely to be true in nature.
In the Solar system, the size distribution of the largest bodies is a two component power law with a break at a radius of 100 km (Bernstein et al. 2004, 2006; Fraser & Kavelaars 2009; Fuentes & Holman 2008; Fuentes et al. 2009). Above this radius the bodies have not been subject to disruptive collisions and the size distribution exponent, , is steeper than below it where . For bodies below the break radius the size distribution exponent is representative of collisional population whose binding energy is dominated by gravity (Pan & Sari 2005). At smaller radii, around 0.1 to 1 km, material strength dominates over gravitational binding energy and a different applies to the size distribution of those bodies (Benz & Asphaug 1999). However, direct observation of Edgeworth-Kuiper belt bodies 1 km in size is difficult due to the faintness of these bodies with typical albedoes 6 per cent. For the smallest grains, a size distribution exponent of is consistent with the non-detection of thermal emission from the disk (Vitense et al. 2012), although smaller values cannot be ruled out by the available data.
The assumed physical condition of dust parent bodies has a large impact on the derived size distribution of dust grains, varying from 3 to 4 for most models. As above, treating the dust-producing planetesimal bodies as ‘rubble piles’ held together by gravity with little internal strength produces values around 3.0 to 3.3 (Pan & Sari 2005). The collisional modelling code ‘Analysis of Collisional Evolution’ (Krivov et al. 2013), with size dependent grain strength, orientation, and mutual gravity between colliding bodies, produces values 3.3 to 3.4 (Löhne et al. 2012; Schüppler et al. 2014, 2015). Including (one or more) refinements to the physics of the collisional modelling such as size-dependent tensile strength laws, mutual gravitation, and size-dependent velocity distributions resulting from viscous stirring and collisional damping (Kenyon & Bromley 2004; Pan & Sari 2005; Löhne et al. 2008; Gáspár et al. 2012; Pan & Schlichting 2012) tends to produce steeper grain size distributions (higher ) of up to 3.8 to 4 when the tensile strength or velocity dispersion of the colliding bodies are steep functions of their size.
The theoretical expectation that will lie in the range 3 to 4 is borne out for the majority of disks. Observations at millimetre wavelengths using the Green Bank Telescope (Greaves et al. 2012), the Australian Telescope Compact Array (Ricci et al. 2012, 2015), and the Jansky Very Large Array (MacGregor et al. 2016) demonstrated that most systems fell within the range of . At far-infrared wavelengths, Pawellek et al. (2014) modelling of 34 resolved debris disks gave an error-weighted mean value of 3.92 0.07, whilst at millimetre wavelengths MacGregor et al. (2016) obtain an error-weighted value for 3.36 0.02 from a sample of 15 disks. However, a number of pathological cases have been identified. For these disks the values of determined from modelling of their spectral energy distributions (SEDs) lie well beyond the range of theoretically expected values. Such ‘steep SED’ disks identified at far-infrared and sub-millimetre wavelengths, e.g. Ertel et al. (2012), Montesinos et al. (2016), and Marshall et al. (2016), have values between 5 and 10, much higher than theoretical predictions.
The underlying nature of these disks with steep slopes is an open question. To better address this, determination of the slope values exhibited by disks across a broad range of spectral types and ages is required. Here we report results from PLAnetesimals around TYpical and Pre-main seqUence Stars (PLATYPUS), an ongoing survey of debris disks at 9 mm with the Australian Telescope Compact Array (ATCA). The targets in this work are six debris disk host stars spanning a broad range of stellar luminosities and ages.
In Section 2 we present the new observations made for the PLATYPUS survey, along with a summary of our data reduction and image analysis procedures. In Section 3 we present the results of our analysis, and combine these six targets with results from previously published phases of the PLATYPUS survey to examine the whole sample. In Section 4 we discuss the survey results, both for individual targets and in aggregate. Finally, we present our conclusions and recommendations for future work in Section 5.
2 Observations and analysis
2.1 Observations
| Target | R.A. | Dec. | Sp. | Age | Ref. | |
|---|---|---|---|---|---|---|
| (h m s) | (d m s) | (pc) | Type | (Myr) | ||
| HD 105 | 00 05 52.54 | -41 45 11.0 | 39.4 | G0 V | 27 | 1,2 |
| HD 20807 | 03 18 12.82 | -62 30 22.9 | 12.0 | G0 V | 2000 | 3 |
| HD 61005 | 07 35 47.46 | -32 12 14.0 | 35.3 | G8 V | 90 | 4 |
| HD 109085 | 12 32 04.22 | -16 11 45.6 | 54.7 | F2 V | 1500 | 5 |
| HD 109573 | 12 36 01.03 | -39 52 10.3 | 72.8 | A0 V | 8 | 6 |
| HD 131835 | 14 56 54.47 | -35 41 43.7 | 122.7 | A2 V | 17 | 7 |
A search for continuum emission at 9 mm from six debris disks was undertaken by ATCA using the Compact Array Broadband Backend digital filter bank (Wilson et al. 2011). These observations comprise the second part of the PLATYPUS survey (program ID C2694, P.I. Maddison), the previous results having been presented in Ricci et al. (2012, 2015). The targets selected here by-and-large are older and host fainter disks than those targets previously examined in comparable works (Ricci et al. 2015; MacGregor et al. 2016). A summary of relevant stellar parameters is given in Table 1. Positions are the stellar optical position in the ICRS at J=2000 epoch. Distances were taken from the re-reduction of the Hipparcos catalogue (van Leeuwen 2007). Ages were taken from the literature.
Predicted 9-mm flux densities for the targets ranged from 50 to 150 Jy, and were based on modified blackbody models fitted to available far-infrared and sub-millimetre photometry. The integration times were between 290 and 360 mins, equivalent to an rms of 15 Jy/beam, chosen to ensure detection of the disks’ emission based on extrapolations from available measurements. Apart from HD 61005, which has been observed at 9 mm (MacGregor et al. 2016), none of the targets have flux density measurements beyond 1.3 mm. This is especially important for HD 105 and HD 20807, whose sub-millimetre SEDs are particularly poorly constrained. As an additional complication, HD 109085 hosts a large, extended disk and the total disk emission might therefore be resolved out with the array configuration used in these observations. The remaining disks were expected to be point-like at the resolution of our ATCA observations.
| Date | Target | Calibrators | |||
|---|---|---|---|---|---|
| (2015) | Bandpass | Flux | Phase | (mins) | |
| Apr 4 | HD 109573 | 0537-441 | 1934-638 | 1144-379 | 350 |
| Apr 5 | HD 109085 | 0537-441 | 1934-638 | 1213-172 | 330 |
| Apr 6 | HD 131835 | 1424-418 | 1934-638 | 1451-375 | 300 |
| Jul 13 | HD 61005 | 0537-441 | 1934-638 | 0745-330 | 310 |
| Jul 14 | HD 105 | 1613-586 | 1934-638 | 2326-477 | 290 |
| Jul 15 | HD 20807 | 1921-293 | 1934-638 | 0308-611 | 390 |
Observations were taken in two three-day spans covering 2015 April 4 to 6 (HD 109573, HD 109085, and HD 131835) and 2015 July 13 to 15 (HD 61005, HD 105, and HD 20807). All targets were observed using the compact H214 configuration, with baselines between 82 and 247 m, giving a synthetic beam FWHM of 5″ 4″. This angular resolution is sufficient to resolve the nearest/largest disks in the sample, given sufficient signal-to-noise to interpret the emission. The ATCA comprises six 22-m antennae, one of which is located at a fixed position 6 km from the others. In our analysis we have opted not to include data from the fixed antenna due to the increased phase noise on the much longer baselines. A summary of the observations is presented in Table 2.
2.2 ATCA data reduction
The ATCA observations were reduced in the Miriad software environment (version 1.5), following the recommended protocols for millimetre data as given in Chapter 4 of the ATCA Users Guide111https://www.narrabri.atnf.csiro.au/observing/users_guide/html/atug.html. Flagging of radio frequency interference was undertaken using the package pgflag in automated mode. The degree of RFI varied strongly with the baseline under consideration and the date of observation, but the fraction of discarded data was around 15 to 30 per cent. We used the standard packages invert, mfclean, and restor to create images from each dataset. Initially, the two sidebands taken of each target (2 GHz bandwidth centred on 33 and 35 GHz) were reduced separately to examine each individually for reduction artefacts (e.g. from phase errors) or elevated noise. Finding none, we combined the two sidebands into a single map with a reference frequency of 34 GHz (9 mm) to reduce the overall noise of the final image. Source flux densities and uncertainties were measured using the package imfit, which fits a reconstructed PSF to a given position in the image and derives the peak flux and residual noise.
3 Results
| Target | Beam size | Beam P.A. | a |
|---|---|---|---|
| (″) | (°) | (Jy/beam) | |
| HD 105 | 5.0 3.9 | 79.4 | 42 14 |
| HD 20807 | 5.2 4.4 | 76.5 | 54 |
| HD 61005 | 5.1 3.9 | 81.3 | 59 13 |
| HD 109085 | 5.4 4.0 | 79.3 | 36 |
| HD 109573 | 5.1 3.9 | 79.2 | 63 |
| HD 131835 | 5.0 3.8 | 80.9 | 53 17 |
Notes: aUpper limits are 3-.
We combined the newly acquired ATCA 9-mm photometry with observations from the literature spanning optical to millimetre wavelengths to produce SEDs for analysis. The optical data come from the Hipparcos catalogue (Perryman et al. 1997); near-infrared photometry are taken from the 2MASS (Cutri et al. 2003) and AllWISE (Wright et al. 2010) catalogues; mid- and far-infrared photometry were taken by Spitzer and Herschel (Donaldson et al. 2012; Eiroa et al. 2013; Duchêne et al. 2014; Moór et al. 2015; Morales et al. 2016); the (sub-)millimetre data were from APEX, JCMT, and SMA (Nilsson et al. 2010; Ricarte et al. 2013; MacGregor et al. 2016). A summary of the ATCA photometry used in the disk modelling is presented in Table 3.
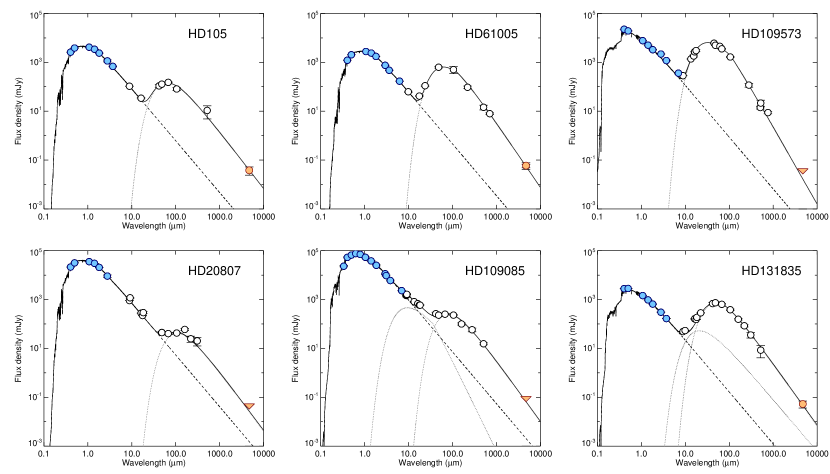
The target spectra are presented in Fig. 1. The stellar component of the model was estimated by scaling a Castelli-Kurucz photospheric model (Castelli & Kurucz 2004) of appropriate spectral type to optical and near-infrared photometry up to 10 m, typically the and W3 measurements. The disk contribution to the total flux was treated as a single temperature modified blackbody with a break wavelength and exponent such that up to the emission was blackbody-like, but beyond the blackbody emission was multiplied by a factor . The disk temperature, , and were determined from a least-squares fit to the star-subtracted photometry beyond 50m weighted by the uncertainties. For HD 109085 and HD 131835, an additional warm blackbody component was used to fit the mid-infrared emission prior to fitting the cold component, adopting the properties taken from Duchêne et al. (2014) and Moór et al. (2015), respectively.
Having fitted the target SEDs we then proceeded to derive the exponent of the dust grain size distribution following MacGregor et al. (2016). To summarise briefly, we calculated the slope of a Planck function, , from our observations at 9 mm and the next longest wavelength, typically 850 m or 1.3 mm:
| (1) |
is the Boltzmann constant, is the Planck constant, is the disk temperature, and are the frequencies of our two (sub-)millimetre observations. We also calculated the slope of the millimetre emission, in similar fashion:
| (2) |
are the disk fluxes at the two frequencies of interest, . Eqn. 2 assumes that both measurements used to derive the slope are in the Rayleigh-Jeans limit, which is valid for our debris disks. The value of , the exponent of the grain size distribution, can be derived from these two quantities through the relation: . The relation holds for values of in the expected range of 3 to 4 that is typical for debris disks, and so should be valid here. In this relation the parameter is taken from Draine (2006) who derived the relation between and for grains in protoplanetary disks. The value of is dependent on the assumed composition with a range of 1.3, from material produced by the pyrolisis of cellulose at 800 C (”cel800” Jaeger et al. 1994), to 2.0, derived for simple models of insulators and conductors (Draine 2004). Whilst values outside this range have been identified in specific cases (e.g. Bösch 1978; Agladze et al. 1996) their applicability to isolated small particles are not certain; small spheres are expected to have , but we here adopt a range of 1.3 to 2.0 as a conservative approach (see Sect. 2 Draine 2006). For astronomical silicate, an oft-assumed debris dust material, the appropriate value is 1.8 and we use this value to calculate the values presented here. The range of for a disk resulting from selection of different values may be treated as a systematic uncertainty in the value of , and are given separately in the table. The results of the disk fitting process and dervied values are presented in Table 4.
Using this relation we can also calculate the expected values for these disks based on the value from the modified blackbody fits. Rearranging the relation above we obtain, . For HD 105, the best-fit value of . From this we calculate that , assuming a value of and a systematic component to the uncertainty coming from the range of possible values of . Similarly, in the case of HD 131835 we find that and correspondingly .
| Target | Instrument | Flux | Reference | ||||
|---|---|---|---|---|---|---|---|
| (mm) | (mJy) | ||||||
| HD 105 | 0.87 | APEX | 10.7 5.9 | 1 | 2.41 0.16 | 1.94 0.07 | 3.26 0.17 |
| HD 20807 | 0.50 | SPIRE | 20.3 7.7 | 2 | 2.05 0.10 | 1.79 0.28 | 3.15 |
| HD 61005 | 1.30 | SMA | 7.2 1.5 | 3 | 2.48 0.08 | 2.05 0.05 | 3.24 0.09 |
| HD 109085 | 0.85 | SCUBA2 | 14.3 1.1 | 4 | 2.10 0.07 | 1.90 0.12 | 3.11 |
| HD 109573 | 0.85 | SCUBA2 | 14.4 1.9 | 4 | 2.73 0.10 | 1.98 0.02 | 3.42 |
| HD 131835 | 0.87 | APEX | 8.5 4.4 | 5 | 2.17 0.13 | 1.95 0.05 | 3.12 0.14 |
Notes: Values of and for targets with non-detections at 9 mm were calculated based on the 3- upper limit.
4 Discussion
4.1 Individual results
4.1.1 HD 105
HD 105 is a young G0 V star at a distance of 40 pc that hosts a moderately bright debris disk (). As a member of the Tucana-Horologium association (Torres et al. 2000; Zuckerman & Webb 2000) the system’s age of 30 Myr is reasonably well determined. Its debris disk was marginally resolved in far-infrared Herschel/PACS imaging observations and found to have a radius of 52 au (Donaldson et al. 2012). HD 105 might therefore be considered an analogue of the young Sun. The solitary sub-millimetre photometric point at 870 m from APEX (Nilsson et al. 2010) only provides weak constraint on the disk sub-millimetre emission, and lies 1- above the best-fit model obtained with our new 9-mm flux measurement of 42 14 Jy. A value of was derived for the grain size distribution exponent for this disk.
4.1.2 HD 20807
HD 20807 is another nearby Sun-like star (G1 V), lying at 12 pc. It was identified as a debris disk host star and thought to be resolved by Herschel/PACS observations (Eiroa et al. 2013). The putative disk is thought to be non-axisymmetric, potentially due to the presence of a sub-stellar companion on a wide orbit (Faramaz et al. 2014). Herschel/SPIRE measurements in the sub-millimetre reveal a flat spectrum out to m, offering no clues as to the point of turnover or steepness of the decline in disk emission. Subsequent analysis of the same Herschel data have cast doubt upon the interpretation of HD 20807 as a debris disk host star, with Moro-Martín et al. (2015) finding no evidence for a far-infrared excess. We obtained a 3- upper limit of 54 Jy/beam from the ATCA measurements, and a corresponding lower limit of . The beam size of ATCA in compact mode and Herschel/PACS are comparable, so the non-detection of this target may be due to dilution of the total disk flux over multiple beams or, potentially, due to the absence of any disk around the star in the first place.
4.1.3 HD 61005
HD 61005 (the moth) is a very well studied young debris disk system around a late G-type star at a distance of 35 pc. Its disk is bright, having been imaged in scattered light (Hines et al. 2007), and resolved at millimetre wavelengths (Ricarte et al. 2013; MacGregor et al. 2016). The disk exhibits a pronounced asymmetry that has been attributed to either interaction with the interstellar medium (Maness et al. 2009), or the presence of planetary companion perturbing the disk (Buenzli et al. 2010; Esposito et al. 2016). We obtained a 9-mm flux density of 59 14 Jy for this system. This is completely consistent with the 9-mm flux obtained by MacGregor et al. (2016). Using our 9-mm measurement in combination with the SCUBA-2 flux density at 850 m we obtained for the disk. This is marginally steeper than the earlier derivation of MacGregor et al. (2016) () using the 1.3-mm SMA flux density (7.2 1.5 mJy) to calculate , for which we obtain (as presented in Table 4.
4.1.4 HD 109085
HD 109085 ( Crv), a 1.5 Gyr-old F2 V star at a distance of 55 pc, hosts a disk with an inner warm component that is anomalously bright for its age. The disk was resolved into two distinct components by Herschel/PACS (Duchêne et al. 2014). The outer belt was recently resolved at millimetre wavelengths by ALMA observations that also identified CO emission from the inner regions of the disk (Marino et al. 2017). This places it (along with HD 131835) amongst the small number of debris disks that also have detectable gas (Greaves et al. 2016). Interpretation of its mid-infrared spectrum revels evidence of primordial material, believed to originate from icy planetesimals scattered from the outer belt to the inner regions of the system (Lisse et al. 2012). We obtained an upper limit of 36 Jy/beam with ATCA. Due to the extended nature of the source, covering an area of 3 beams, the outer belt’s surface brightness is too low to be detectable with the sensitivity of ATCA. However, our measurement was a meaningful constraint to the outer disk as resolved in Marino et al. (2017). We thus obtained a lower limit of ; this value was calculated taking into account the area of the disk.
4.1.5 HD 109573
HD 109573 (HR 4796 A), an 8 Myr old A-type star at 73 pc, is the most distant of our targets. It was the second disk to be spatially resolved (after Pictoris) being imaged at mid-infrared wavelengths (Jayawardhana et al. 1998; Koerner et al. 1998). The disk has also been imaged successfully in scattered light, being dubbed the ‘eye of Sauron’ (Schneider et al. 2009). The disk has a narrow radial width (R/R 14 per cent Rodigas et al. 2015) and its structure has been interpreted as indicating the presence of a shepherding planetary companion (Thalmann et al. 2011). Given the disk’s emission is well-sampled, and its small angular extent, we expected that this system would yield a clear detection in our 9-mm observations. However, we only obtained a 3- upper limit of 63 Jy/beam equating to a limit on . This is well within the expected range of 3 to 4 for debris disks. We attribute the non-detection of this system to the elevated millimetre photometry from APEX (21.5 6.6 mJy Nilsson et al. 2010) and JCMT/SCUBA (19.1 3.4 mJy, Greaves et al. 2000) compared to the more recent JCMT/SCUBA2 measurement (14.4 1.9 mJy, Holland in prep.) that biased the modified blackbody fit.
4.1.6 HD 131835
HD 131835 is a young (17 Myr old), massive analogue to the Pictoris system. Sub-millimetre observations of the disk detected the presence of CO gas in the disk (Moór et al. 2015), making it only one of a handful of such systems (see e.g. Greaves et al. 2016). It has recently been imaged in scattered light by GPI, revealing a broad (75 to 210 au), inclined (75) disk around the host star (Hung et al. 2015). The disk was also marginally resolved by Herschel/PACS far-infrared observations, suggesting an extent of 170 au (Moór et al. 2015). Here we obtained the first measurement of the disk continuum emission 9 mm, with a flux of 53 17 Jy. The corresponding . This disk has the shallowest sub-millimetre slope amongst the disks measured here; this could be attributed to the influence of gas in the disk moderating the collisions between dust grains.
4.2 Comparision with previous work
The values obtained for the newly detected disks were smaller than the average value for mm-detected disks calculated in MacGregor et al. (2016) (3.36 0.02), and that of the commonly-adopted steady state collisional cascade of Dohnanyi (1969). Combining values for the three detected disks in the sample we found an error-weighted of 3.15 0.09. If we add the three non-detections (treating the 3- upper limit at 9-mm as a detection), the mean increases to 3.26 0.05, and is still smaller than the value of MacGregor et al. (2016). The lower sensitivity of ATCA compared to VLA at the same wavelength would account for our detection of disks with smaller values, as these disks have a greater contribution from larger grains to their total emission and would therefore be relatively brighter.
At first glance the values are also discrepant with those obtained by Gáspár et al. (2012). An assumption of that work was that millimetre emission from the disk is dominated by grains with , such that the relationship between and is . This is contrary to the results of Draine (2006). We have recalculated the values of for the nine disks examined in Gáspár et al. (2012) using the same method employed here and in MacGregor et al. (2016). A side-by-side comparison of the derived values for using the same photometry are given in Table 5.
| Target | ||
|---|---|---|
| Pic | 3.63 | 3.53 0.10 |
| Eri | 3.14 | 2.53 0.18 |
| PsA | 3.62 | 3.21 0.07 |
| HD 8907 | 3.00 | 2.64 0.20 |
| HD 104860 | 3.07 | 2.70 0.22 |
| HD 107146 | 3.34 | 3.11 0.12 |
| HR 8799 | 3.21 | 4.11 0.33 |
| Lyr | 4.01 | 3.61 0.17 |
| HD 207129 | 3.42 | 3.74 0.38 |
In all cases except two, the values of are found to be smaller using the method applied here and in MacGregor et al. (2016) than by that of Gáspár et al. (2012). In combination, the revised disk measurements have a mean . The revised values we obtain are more in line with the findings of MacGregor et al. (2016) and numerical results (e.g. Schüppler et al. 2014, 2015) than with the modelling results of far-infrared excesses (Pawellek et al. 2014). In the two instances where our method yields a steeper than Gaspar et al., i.e. HR 8799 and HD 207129, we note the longer wavelength of the sub-millimetre SED used to calculate is poorly constrained, being represented by sub 2- detections in each case; better quality sub-millimetre photometry would likely yield a flatter size distribution (smaller ).
Three of the disks, Eri, HD 8907, and HD 104860, have values . These are outside the generally expected range of 3 to 4 for debris disks, and beyond the regime where the relations derived in Draine (2006) were found to hold. In MacGregor et al. (2016) they identified one system, HD 141569, with similar properties (). They attributed its small size distribution exponent to the fact that it was a young, gas-rich protoplanetary disk system unlike the debris disks that made up the majority of their sample. Here, such a line of reasoning does not hold as all three are well-known debris disk systems.
We therefore investigated the impact of more recent, higher quality photometry than that presented in Gáspár et al. (2012). Using recent millimetre photometry from the SMA (Steele et al. 2016) and LMT (Chavez-Dagostino et al. 2016), we recalculated the values of these three disks and found them consistent with the remainder of the sample, with ( Eri), (HD 8907), and (HD 104860). With the revised measurements, the mean value of Gaspar et al.’s sample changes to , completely consistent with MacGregor et al. (2016).
5 Conclusions
We set out to measure the continuum emission from six debris disks at millimetre wavelengths using the ATCA in order to constrain the slope of their submillimetre emission and thereby better determine the planetesimal properties in those systems. Our observations have demonstrated the capability of ATCA to detect continuum emission from relatively faint debris disks () that are most representative of the bulk of known, cool circumstellar disks.
We detected three of the six disks at s/n 3 in our observations. Two of the targets, HD 105 and HD 131835, were detected for the first time at millimetre wavelengths. HD 61005 had been previously observed at 9 mm with a comparable flux density to the measurement presented here. Upper limits for the remaining three targets (HD 20807, HD 109085, and HD 109573) placed strong constraints on the slope of the disks’ sub-millimetre emission.
We found that the exponents of the size distribution, , for the three detected disks were smaller than both the steady state collisional cascade model of Dohnanyi (1969), and also smaller than the mean value obtained for the sample of 15 debris disks examined in MacGregor et al. (2016). For the detected disks, the values are most consistent with theoretical models wherein the planetesimals are treated as ‘rubble piles’ without any rigid strength (Pan & Sari 2005), and for the most part consistent with collisional modelling results of Löhne et al. (2012) and Schüppler et al. (2014, 2015). The lower limits on the values of HD 20807 and HD 109085 are both high enough that we cannot rule out consistency with MacGregor et al. (2016), whilst the upper limit on HD 109573’s value is low enough such that the disk grain size distribution must be steeper than is typical for millimetre-detected disks. Given the brightness of HD 109573’s disk at sub-millimetre wavelengths and its relatively compact nature, further study at comparable wavelengths and higher sensitivity (e.g. 9-mm observations on the Jansky VLA) should be expected to yield a detection of the disk.
Acknowledgments
The authors would like to thank the referee for their careful and considerate comments that improved the manuscript. JPM would like to thank Paul Jones for helpful discussions on the ATCA data reduction process. JPM is supported by a UNSW Vice-Chancellor’s Postdoctoral Research Fellowship. This research has made use of the SIMBAD database, operated at CDS, Strasbourg, France. This research has made use of NASA’s Astrophysics Data System. The Australia Telescope Compact Array is part of the Australia Telescope National Facility which is funded by the Australian Government for operation as a National Facility managed by CSIRO.
Facilities: ATCA
References
- Agladze et al. (1996) Agladze N. I., Sievers A. J., Jones S. A., Burlitch J. M., Beckwith S. V. W., 1996, ApJ, 462, 1026
- Beckwith et al. (1990) Beckwith S. V. W., Sargent A. I., Chini R. S., Guesten R., 1990, AJ, 99, 924
- Benz & Asphaug (1999) Benz W., Asphaug E., 1999, Icarus, 142, 5
- Bernstein et al. (2004) Bernstein G. M., Trilling D. E., Allen R. L., Brown M. E., Holman M., Malhotra R., 2004, AJ, 128, 1364
- Bernstein et al. (2006) Bernstein G. M., Trilling D. E., Allen R. L., Brown M. E., Holman M., Malhotra R., 2006, AJ, 131, 2364
- Bösch (1978) Bösch M. A., 1978, Physical Review Letters, 40, 879
- Buenzli et al. (2010) Buenzli E., et al., 2010, A&A, 524, L1
- Burns et al. (1979) Burns J. A., Lamy P. L., Soter S., 1979, Icarus, 40, 1
- Castelli & Kurucz (2004) Castelli F., Kurucz R. L., 2004, ArXiv Astrophysics e-prints,
- Chavez-Dagostino et al. (2016) Chavez-Dagostino M., et al., 2016, MNRAS, 462, 2285
- Cutri et al. (2003) Cutri R. M., et al., 2003, VizieR Online Data Catalog, 2246
- Desidera et al. (2011) Desidera S., et al., 2011, A&A, 529, A54
- Dohnanyi (1969) Dohnanyi J. S., 1969, J. Geophys. Res., 74, 2531
- Donaldson et al. (2012) Donaldson J. K., et al., 2012, ApJ, 753, 147
- Draine (2004) Draine B. T., 2004, Astrophysics of Dust in Cold Clouds. p. 213, doi:10.1007/3-540-31636-1˙3
- Draine (2006) Draine B. T., 2006, ApJ, 636, 1114
- Duchêne et al. (2014) Duchêne G., et al., 2014, ApJ, 784, 148
- Eiroa et al. (2013) Eiroa C., et al., 2013, A&A, 555, A11
- Ertel et al. (2012) Ertel S., et al., 2012, A&A, 541, A148
- Esposito et al. (2016) Esposito T. M., et al., 2016, AJ, 152, 85
- Faramaz et al. (2014) Faramaz V., et al., 2014, A&A, 563, A72
- Fraser & Kavelaars (2009) Fraser W. C., Kavelaars J. J., 2009, AJ, 137, 72
- Fuentes & Holman (2008) Fuentes C. I., Holman M. J., 2008, AJ, 136, 83
- Fuentes et al. (2009) Fuentes C. I., George M. R., Holman M. J., 2009, ApJ, 696, 91
- Gáspár et al. (2012) Gáspár A., Psaltis D., Rieke G. H., Özel F., 2012, ApJ, 754, 74
- Greaves et al. (2000) Greaves J. S., Mannings V., Holland W. S., 2000, Icarus, 143, 155
- Greaves et al. (2012) Greaves J. S., Hales A. S., Mason B. S., Matthews B. C., 2012, MNRAS, 423, L70
- Greaves et al. (2016) Greaves J. S., et al., 2016, MNRAS, 461, 3910
- Hines et al. (2007) Hines D. C., et al., 2007, ApJ, 671, L165
- Hung et al. (2015) Hung L.-W., et al., 2015, ApJ, 815, L14
- Jaeger et al. (1994) Jaeger C., Mutschke H., Begemann B., Dorschner J., Henning T., 1994, A&A, 292, 641
- Jayawardhana et al. (1998) Jayawardhana R., Fisher S., Hartmann L., Telesco C., Piña R., Fazio G., 1998, ApJ, 503, L79
- Kenyon & Bromley (2004) Kenyon S. J., Bromley B. C., 2004, AJ, 127, 513
- Koerner et al. (1998) Koerner D. W., Ressler M. E., Werner M. W., Backman D. E., 1998, ApJ, 503, L83
- Krivov (2010) Krivov A. V., 2010, Research in Astronomy and Astrophysics, 10, 383
- Krivov et al. (2013) Krivov A. V., et al., 2013, ApJ, 772, 32
- Lisse et al. (2012) Lisse C. M., et al., 2012, ApJ, 747, 93
- Löhne et al. (2008) Löhne T., Krivov A. V., Rodmann J., 2008, ApJ, 673, 1123
- Löhne et al. (2012) Löhne T., et al., 2012, A&A, 537, A110
- MacGregor et al. (2016) MacGregor M. A., et al., 2016, ApJ, 823, 79
- Mallik et al. (2003) Mallik S. V., Parthasarathy M., Pati A. K., 2003, A&A, 409, 251
- Maness et al. (2009) Maness H. L., et al., 2009, ApJ, 707, 1098
- Marino et al. (2017) Marino S., et al., 2017, MNRAS, 465, 2595
- Marshall et al. (2016) Marshall J. P., Booth M., Holland W., Matthews B. C., Greaves J. S., Zuckerman B., 2016, MNRAS, 459, 2893
- Matthews et al. (2014) Matthews B. C., Krivov A. V., Wyatt M. C., Bryden G., Eiroa C., 2014, Protostars and Planets VI, pp 521–544
- Montesinos et al. (2016) Montesinos B., et al., 2016, preprint, (arXiv:1605.05837)
- Moór et al. (2015) Moór A., et al., 2015, ApJ, 814, 42
- Morales et al. (2016) Morales F. Y., Bryden G., Werner M. W., Stapelfeldt K. R., 2016, ApJ, 831, 97
- Moro-Martín et al. (2015) Moro-Martín A., et al., 2015, ApJ, 801, 143
- Nilsson et al. (2010) Nilsson R., et al., 2010, A&A, 518, A40
- Pan & Sari (2005) Pan M., Sari R., 2005, Icarus, 173, 342
- Pan & Schlichting (2012) Pan M., Schlichting H. E., 2012, ApJ, 747, 113
- Pawellek et al. (2014) Pawellek N., Krivov A. V., Marshall J. P., Montesinos B., Ábrahám P., Moór A., Bryden G., Eiroa C., 2014, ApJ, 792, 65
- Perryman et al. (1997) Perryman M. A. C., et al., 1997, A&A, 323, L49
- Ricarte et al. (2013) Ricarte A., Moldvai N., Hughes A. M., Duchêne G., Williams J. P., Andrews S. M., Wilner D. J., 2013, ApJ, 774, 80
- Ricci et al. (2012) Ricci L., Testi L., Maddison S. T., Wilner D. J., 2012, A&A, 539, L6
- Ricci et al. (2015) Ricci L., Maddison S. T., Wilner D., MacGregor M. A., Ubach C., Carpenter J. M., Testi L., 2015, ApJ, 813, 138
- Rodigas et al. (2015) Rodigas T. J., et al., 2015, ApJ, 798, 96
- Schneider et al. (2009) Schneider G., Weinberger A. J., Becklin E. E., Debes J. H., Smith B. A., 2009, AJ, 137, 53
- Schüppler et al. (2014) Schüppler C., Löhne T., Krivov A. V., Ertel S., Marshall J. P., Eiroa C., 2014, A&A, 567, A127
- Schüppler et al. (2015) Schüppler C., et al., 2015, A&A, 581, A97
- Stauffer et al. (1995) Stauffer J. R., Hartmann L. W., Barrado y Navascues D., 1995, ApJ, 454, 910
- Steele et al. (2016) Steele A., Hughes A. M., Carpenter J., Ricarte A., Andrews S. M., Wilner D. J., Chiang E., 2016, ApJ, 816, 27
- Thalmann et al. (2011) Thalmann C., et al., 2011, ApJ, 743, L6
- Torres et al. (2000) Torres C. A. O., da Silva L., Quast G. R., de la Reza R., Jilinski E., 2000, AJ, 120, 1410
- Vitense et al. (2012) Vitense C., Krivov A. V., Kobayashi H., Löhne T., 2012, A&A, 540, A30
- Williams & Cieza (2011) Williams J. P., Cieza L. A., 2011, ARA&A, 49, 67
- Wilson et al. (2011) Wilson W. E., et al., 2011, MNRAS, 416, 832
- Wright et al. (2010) Wright E. L., et al., 2010, AJ, 140, 1868
- Wyatt (2008) Wyatt M. C., 2008, ARA&A, 46, 339
- Wyatt et al. (2015) Wyatt M. C., Panić O., Kennedy G. M., Matrà L., 2015, Ap&SS, 357, 103
- Zuckerman & Webb (2000) Zuckerman B., Webb R. A., 2000, ApJ, 535, 959
- van Leeuwen (2007) van Leeuwen F., 2007, A&A, 474, 653