AA \jyearYYYY
Monolayer FeSe on SrTiO3
Abstract
Epitaxial engineering of solid-state heterointerfaces is a leading avenue to realizing enhanced or novel electronic states of matter. As a recent example, bulk FeSe is an unconventional superconductor with a modest transition temperature () of 9 K. When a single atomic layer of FeSe is grown on SrTiO3, however, its can skyrocket by an order of magnitude to 65 K or 109 K. Since this discovery in 2012, efforts to reproduce, understand, and extend these findings continue to draw both excitement and scrutiny. In this review, we first present a critical survey of experimental measurements performed using a wide range of techniques. We then turn to the open question of microscopic mechanisms of superconductivity. We examine contrasting indications for both phononic (conventional) and magnetic/orbital (unconventional) means of electron pairing, and speculations about whether they could work cooperatively to boost in a monolayer of FeSe.
doi:
10.1146/((please add article doi))keywords:
superconductivity, iron pnictides and chalcogenides, oxides, thin-film interfaces1 INTRODUCTION
Interface engineering lies at the vanguard of current research in condensed matter physics and novel materials. From a fundamental perspective, quantum-size and electron correlation effects are enhanced in reduced dimensionality, often resulting in unexpected phenomena. From a technological perspective, as the pace of electronics miniaturization fast approches the limit of conventional semiconductors, alternative paradigms, such as atomically-thin materials and interfaces with manifestly quantum behavior, are needed to assume the mantle of next-generation electronics. With improving ability to assemble atomically-sharp interfaces “bottom up” through molecular beam epitaxy (MBE) or mechanical stacking of 2D-layered materials, many possibilites abound.
As the central example of this review, interface engineering holds promise in tuning, boosting, or generating superconducting states of matter – low-temperature quantum phases in which electrons form Cooper pairs and charge transport is lossless. Since its discovery in 1911, superconductivity has continued to fascinate and baffle condensed matter physicists, while the goal of realizing room-temperature superconductivity remains elusive. Within the past decade, various examples of interface superconductivity have been observed. When two insulating oxides, LaAlO3 and SrTiO3, are put togther, a superconducting electron gas is formed at the interface, albeit with a low transition temperature () of 200 mK [1]. When a bilayer of insulating La2CuO4 and metallic La1.55Sr0.45CuO4 is formed, the aggregate system displays a exceeding 50 K [2]. And as the latest example, when a single-unit-cell (1UC) layer of FeSe is deposited on SrTiO3 [3], its skyrockets up to 65 K [4, 5, 6, 7] or 109 K [8], an order of magnitude above its bulk of 9 K. In this review, we will cover key experimental and theoretical developments related to 1UC FeSe/SrTiO3 up to early 2016. We focus on measurements of basic properties and questions of superconducting mechanisms.
1.1 Approaching the 2D limit with FeSe
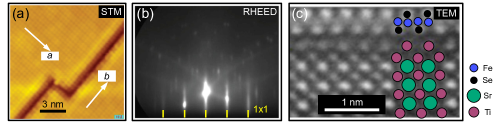
FeSe posesses the simplest structure among the iron-based superconductors, consisting of superconducting Se-Fe-Se triple layers stacked by van der Waals forces, with no buffer layers [9]. Figure 1a shows the structure of one triple layer, which includes Fe atoms arranged in a square lattice and Se atoms staggered above and below the Fe-plane. Due to the staggering, the primitive UC contains two Fe atoms (and two Se atoms). However, since the low-energy bands of FeSe are dominated by Fe orbitals, many theories or spectroscopies reference the 1-Fe UC for convenience.
By virtue of its structural simplicity, FeSe should be the prototypical iron-based superconductor to investigate, except it proved difficult to synthesize in high quality at first. Its superconducting polymorph occupies a narrow region in the Fe-Se alloy phase diagram [10], complicating common melt and self-flux growths. In 2011, Song et al. used MBE to grow pristine FeSe films on graphitized SiC [11, 12]. Using scanning tunneling microscopy (STM), they resolved clean surfaces with only one atomic defect per 70,000 Se sites. Measurements of tunneling conductance (), which is proportional to the local density of states, revealed two signatures of a superconducting state: (1) A V-shaped gap of = 2.2 meV, representing the binding energy of paired electrons, that disappeared above 10 K (Figure 1b); (2) vortices in the presence of a perpendicular magnetic field. Although MBE-grown films are not amenable to many bulk and thermodynamic probes, they have other advantages. Both the monolayer limit and interface interactions with different substrates can be readily examined.
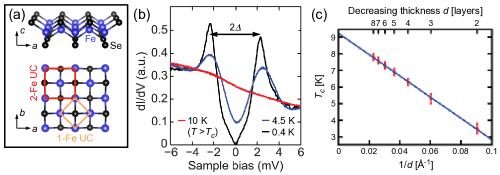
Song et al. found that the FeSe films interacted weakly with the graphitized SiC substrate (islands could be displaced by an STM tip), and were thereby close to the free-standing limit [12]. Upon decreasing film thickness, , as measured by the gap-closing temperature, dropped from 7.8 K (8UC-thick FeSe) to below 2.2 K (1UC-thick FeSe), the base temperature of their experiment (Figure 1c). The drop exhibited a dependence, being the film thickness and being a critical value. This thin-film behavior was explained long ago as resulting from a general, surface boundary condition with the Ginzburg-Landau equation [13]. Thus in 2011, it did not appear that the 2D limit of FeSe would be a promising regime to explore, unless new microscopic effects could be introduced.
1.2 Monolayer FeSe gets an oxide boost
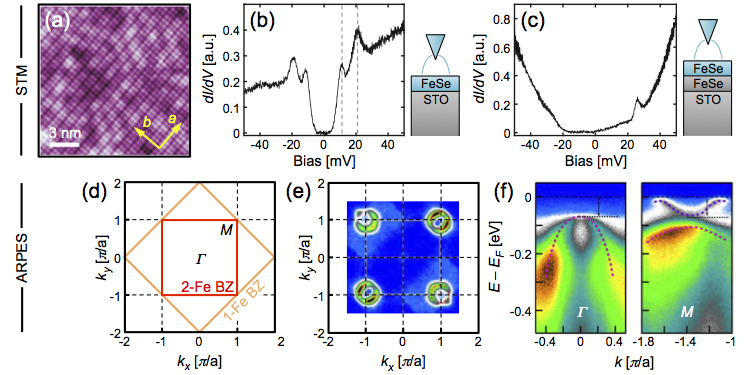
It came as a great surprise a year later that monolayer FeSe could undergo an order-of-magnitude enhancement when grown epitaxially on SrTiO3(001). The lattice mismatch between bulk FeSe (a = 3.77 Å [14]) and SrTiO3 (a = 3.905 Å [15]) is roughly 3%. STM measurements by Wang et al. revealed a topographic period-doubling (Figure 2a) and a large U-shaped, double-gap structure (9.0 meV and 20.1 meV) in 1UC FeSe/SrTiO3 (Figure 2b), with closing temperature above their experimental limit of 42.9 K. Intriguingly, this superconductivity boost did not persist or even proximitize low- superconductivity in a second UC of FeSe deposited on the heterostructure. STM measurements, whose probing depth is likely limited to the surface FeSe layer, instead showed a semiconducting spectrum on the second FeSe layer (Figure 2c). This observation points to an underlying interface effect, one that is atomically localized to the first UC of FeSe on SrTiO3. Wang et al. speculated that electron-phonon coupling could be enhanced at the interface and boost , based on their previous work with Pb/Si(111) and In/Si(111) films [16].
Due to technical challenges, Wang et al. could measure transport only in a Si-capped, 5UC FeSe/SrTiO3 heterostructure. They measured zero resistance at some temperature lower than 30 K, and extrapolated a resistive onset temperature around 53 K. (As shown by STM spectroscopy in Figure 2b,c, the superconducting signal originates from the interface FeSe layer only.)
Angle-resolved photoemission spectroscopy (ARPES) measurements in the same year provided initial insights into the role of the interface. ARPES can map filled-state band structure in momentum space. Liu et al. [17] found that the Fermi surface (FS) of 1UC FeSe/SrTiO3 comprises nearly-circular electron pockets at the Brillouin zone (BZ) corner (Figure 2d,e). In contrast to bulk FeSe [18, 19, 20, 21], where additional hole FSs exist at the zone center , here the corresponding hole pocket is sunken 65-80 meV below the Fermi energy () (Figure 2f). Assuming doubly-degenerate electron pockets, a Luttinger count yields 0.10 electrons/Fe atom. Thus, relative to its bulk, 1UC FeSe appears to be electron-doped from the substrate. To provide further support for the superconducting nature of 1UC FeSe/SrTiO3, Liu et al. resolved nearly-isotropic gaps on the electron pockets at each point, of values 132 meV and 152 meV for two samples. They found the gap-closing temperature to be 555 K.
Before proceeding, we reiterate that monolayer FeSe/SrTiO3 is not monolayer FeSe. A giant enhancement is present only in the former, due to some effect introduced by the SrTiO3.
2 EXPERIMENTAL CHALLENGES
A foremost challenge related to 1UC FeSe/SrTiO3 has been the characterization of its growth, atomic structure, and superconducting metrics. As a point of emphasis, bulk probes are not effective for this system. Not only is the cross section of a single UC layer miniscule, but also FeSe exhibits extreme air sensitivity, hampering ex-situ measurements. Thus, the basic goal of determining represents a nontrivial endeavor requiring customized and integrated instrumentation in ultra-high-vacuum. Example apparatuses include combined MBE-ARPES-STM systems, double chalcogen-MBE/oxide-MBE chambers, and customized in-situ, four-point probes.
In this section, we review various experiments related to film characterization, categorized under three questions: What is ? What are the necessary growth conditions? What is the interface structure? We attempt to reflect the sentiments of the scientific community by conveying both the excitement related to the spectacular findings of tour-de-force experiments, and scrutiny related to the challenging nature of these feats and of film quality/homogeneity.
2.1 What is ?
Table 1 presents a comparison of measurements across different probes, heterostructures, and laboratories. Among various in-situ ARPES measurements [4, 5, 6], there is consensus in a gap-closing temperature 65 K. Some variation exists with the degree of post-growth annealing [4] (see Subsection 2.2 for details). Enhancement of up to 75 K is possible if extra tensile strain is introduced through an additional KTaO3 substrate [22].
| Technique | Definition | Heterostructure | Value [K] | Ref. |
| in-situ | ||||
| STM | Gap-closing | 1UC FeSe/Nb:SrTiO3 | 42.9 | [3] |
| STM | Gap-closing | 1UC FeSe/SrTiO3 | 50.1 | [23] |
| ARPES | Gap-closing | 1UC FeSe/Nb:SrTiO3 | 655 | [4] |
| ARPES | Gap-closing | 1UC FeSe/Nb:SrTiO3 | 605 | [5] |
| ARPES | Gap-closing | 1UC FeSe/Nb:SrTiO3/KTaO3 | 70 | [24] |
| ARPES | Gap-closing | 1UC FeSe/Nb:BaTiO3/KTaO3 | 752 | [22] |
| ARPES | Gap-closing | 1UC FeSe/Nb:SrTiO3 | 587 | [6] |
| 4-probe | Zero resistance | 1UC FeSe/Nb:SrTiO3 | 109 | [8] |
| ex-situ | ||||
| Transport | Zero resistance | Si/5UC FeSe/SrTiO3 | 30 | [3] |
| Onset | 53 | |||
| Transport | Zero resistance | Si/10UC FeTe/1UC FeSe/SrTiO3 | 23.5 | [25] |
| Onset | 40.2 | |||
| Magnetization | Onset | Si/10UC FeTe/1UC FeSe/SrTiO3 | 21 | [25] |
| Magnetization | Onset | Si/10UC FeTe/3-4UC FeSe/SrTiO3 | 2045 | [26] |
| Magnetization | Onset | 10UC FeTe/1UC FeSe/Nb:SrTiO3 | 85 | [27] |
| Magnetization | Onset | Se/2UC FeSe/2UC Fe0.96Co0.04Se/ | 65 | [7] |
| 1UC FeSe/Nb:SrTiO3 |
A more robust proof of superconductivity would include (1) a zero-resistance state and (2) the Meissner effect (perfect diamagnetism). Due to air sensitivity, ex-situ transport and thermodynamic measurements require film capping, with amorphous Se [28], amorphous Si [3], or epitaxial FeTe [25]. In all cases, film characteristics were degraded. Transport measurements of capped heterostructures have found a zero-resistance state below 20 K, and a rough onset temperature possibly up to 50 K. Similarly, magnetization measurements of capped samples have suffered from weak signals, broadened onset temperatures, or low superconducting volume fractions.
Given that many potential applications require some degree of atmosphere exposure, it remains crucial to investigate why capping, particularly epitaxial FeTe, has not worked well. FeTe possesses the same crystal structure as FeSe and its layers interact via van der Waals forces, so naively it should not create a severe disturbance of the FeSe layer below. Several hypotheses have been put forward. Ultrafast spectroscopy revealed an acoustic phonon mode in FeTe that may relax phonon-mediated pairing in FeSe [29]. Alternatively, cross-sectional TEM revealed that intermixing with the capping layer can occur, whereby Te atoms substitute Se atoms in the FeSe monolayer [30]. As a third possibility, Zhao et al. proposed that FeTe may hole-dope FeSe, reducing [31].
In Table 1, we distinguish heterostructures that have conducting, Nb-doped SrTiO3 from those that do not (undoped, bulk-insulating SrTiO3). In general, transport measurements require an insulating SrTiO3 substrate, but there are speculations that Nb-doped SrTiO3 produces higher quality films. Sun et al. [27] hinted that “high quality FeSe films are easier to be achieved by MBE growth on conductive STO [SrTiO3] substrates comparing to insulating STO substrates since the conductive STO substrate shows more flat and homogeneous surface for sample growth.”
2.1.1 In-situ, micro-four-point measurements
In late 2014, Ge et al. reported an astonishing new record above 100 K in 1UC FeSe/SrTiO3 [8]. Here, we review their experiment in detail. The authors converted a commercial cryogenic STM into an in-situ, micro-four-point probe by replacing the single STM tip with a set of four Cu/Au wires, separated by 10-100 m (Figure 3a). The four probes were collectively brought towards the sample at a 20∘ incline using the STM positioning system, until Ohmic contact with the sample was established for each probe. Figure 3c shows several four-point - curves, which transition from a nonlinear (superconducting, zero resistance) to linear (normal state, Ohmic) line shape as the temperature was raised above .
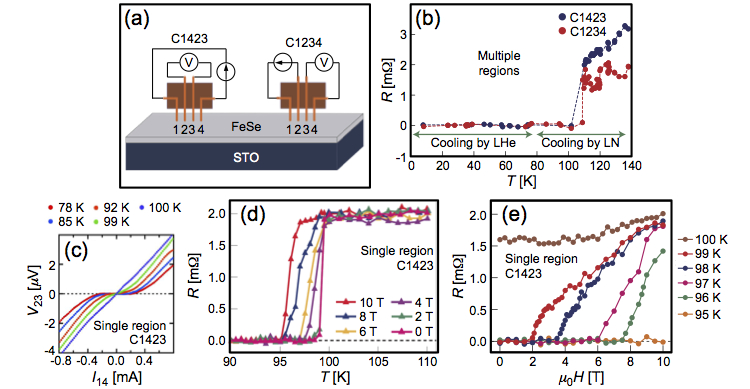
Due to sample inhomogeneity or film damage from probes, linear - curves were sometimes observed below . As a result, Ge et al. compiled resistance vs. temperature (-) plots in two manners. First, they acquired four-point - measurements from separate locations for each temperature (Figure 3b). As long as one - curve per temperature showed signs of zero resistance, that temperature was deemed to be below . With this method, Ge et al. determined to be 109 K. Alternatively, they were also able to construct - plots from measurements at one location, with a sequence of decreasing magnetic fields (Figure 3d). With this second method, they demonstrated a similar of 99 K. The magnetoresistance measurements in Figure 3e were also acquired at a fixed location.
We enumerate questions that have been raised about this experiment, and the authors’ responses:
-
1.
Question: Is the result reproducible on multiple samples?
Response: Ten different samples show similar results. Data from four samples are shown in the paper. -
2.
Question: Is it possible that the authors simply lost a current lead contact as they cooled, resulting in a sudden drop of the measured to zero?
Response: No, the authors measured full - curves at each temperature and magnetic field (), and extracted a -dependent and -dependent critical current (e.g. see Figure 3d,e). -
3.
Question: Is it possible that the actual of the sample is lower than the recorded , giving the appearance of higher ?
Answer: No, careful calibration measurements show that the temperature of the sample is never more than 2 K less than the recorded temperature. -
4.
Question: SrTiO3 undergoes a structural transition at 105 K. Could this be responsible for the resistive transition observed at 109 K?
Response: The authors performed a control experiment on bare, Nb-doped SrTiO3, and showed that the structural transition produced a negligible signature in the - plot [Figure 3b of Ref. [8]]. -
5.
Question: Don’t the measured values of = 109 K and = 1.3 107 A/cm2 appear unexpectedly large?
Response: The authors performed a control experiment on optimally-doped Bi2Sr2CaCu2O8+δ, and found = 90 K, 6000 A/cm2, in line with expectations. Their value is an order of magnitude higher than that of capped 1UC FeSe/SrTiO3 films [25], but similar to that of YBa2Cu3O7-x films [33]. -
6.
Question: Shouldn’t there be a Berezinsky-Kosterlitz-Thouless (BKT) effect that broadens the resistive transition for a 2D superconductor? Why is the resistance drop so sharp (Figure 3b), such that there are no data points within the transition [34]?
Response: Below , conduction is 2D and restricted to the superconducting FeSe monolayer. Above , conduction is shorted through the Nb-doped SrTiO3 substrate, which is 3D and has a much lower resistivity than normal-state FeSe. Thus, the BKT transition is masked by shorting through the metallic substrate. It is also possible that there could be a proximity effect downward into SrTiO3, such that the total system is not exactly 2D. The authors were able to collect data points within this sharp transition (Figure 3d). -
7.
Question: In light of the previous question, why not use an insulating SrTiO3 substrate?
Response: The authors cited practical challenges [8]: “Further limits exist for detecting films grown on an insulating substrate, as the feedback required to control the contact between the film and the tip is extremely difficult.” -
8.
Question: Why doesn’t the resistance change when the contact separation is increased tenfold [34]?
Response: When the probe separation distances are uniform, the resistance should scale with probe separation in both an infinite 2D conductor and a half-infinite 3D conductor. However, when the probe distances are unequal, their relationship to the overall resistance is more complicated [see Supplemental Information of Ref. [8]]. -
9.
Question: How could the resistive transition be higher than the gap-closing temperature measured in-situ by ARPES?
Response: ARPES averages signal over a beam spot size, but the in-situ four-point probe may pick up filamentary superconductivity. Indeed, the authors found non-superconducting regions below , but this could be attributed to both intrinsic sample inhomogeneity or film damage from probes. Alternatively, if the out-of-plane coherence length is short, superconductivity might be stronger at the bottom of the FeSe triple layer than at the top. ARPES and STM measure the top, but transport accesses the lowest-resistivity part, which may be located at the buried interface. -
10.
Question: Is it possible that the apparent decreasing with increasing is simply due to gradual sample damage as is increased?
Response: No, the authors showed the same result with increasing and decreasing at a fixed location.
Despite intense scrutiny, we remain unaware of fatal flaws with the experiment by Ge et al. Nevertheless, there are increasing calls for duplication of this result, as well as complementary in-situ magnetization measurements of the Meissner effect [34, 35]. The latter will require specific instrumentation, but will surely fill in an important piece of the puzzle.
2.2 What are the necessary growth conditions?
An accurate atomic structure is prerequisite to reliable modeling of electronic properties, and yet the former represents another significant experimental challenge for 1UC FeSe/SrTiO3. Although SrTiO3 is a workhorse substrate for MBE growth, it is notorious for its numerous nearly-degenerate surface reconstructions that sensitively depend on preparation conditions. With the (001) surface alone, O deficiency can drive the following reconstructions: 21, 22, (42), (44), 44, (62), 26.6∘, 33.7∘ [36]. Yet some feature of this complex surface interfaced with 1UC FeSe must generate a giant enhancement in . Here, we examine and clarify growth procedures for 1UC FeSe/SrTiO3. The overall challenge is to identify which steps are necessary and which are supplemental. In the following subsection, we review various measurements of the interface atomic structure.
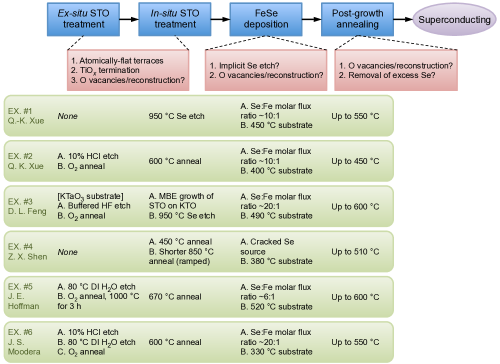
Figure 4 presents a flowchart with typical growth recipes for 1UC FeSe/SrTiO3. The recipes can be delineated into a few “primary” steps, which we discuss in turn.
2.2.1 SrTiO3 treatment (in situ and ex situ)
Commerically available crystals of SrTiO3 arrive with contaminated surfaces. In their original report, Wang et al. introduced a novel strategy to clean Nb-doped SrTiO3: they annealed the substrates in their MBE chamber at 950 ∘C for 30 minutes, under a Se flux. [3]. This treatment produced atomically-flat terraces amenable to STM imaging (albeit lacking atomic resolution). Subsequently, Bang et al. hypothesized that this process created Se substitutions of surface O atoms [38]. These Se substitutions would then nucleate the growth of the first FeSe monolayer, leaving behind O vacancies that stabilize binding and donate electron carriers.
Later films grown on insulating SrTiO3 involved more conventional and better documented preparation protocols, involving an ex-situ H2O/acid etch followed by a high-temperature O2 anneal in a tube furnace [25]. The H2O/acid etch is believed to preferentially remove SrO, which has ionic bonding character, and leave behind a TiO2-terminated surface [39, 40, 41]. It is thus unclear whether the previously-employed Se etch is a necessary procedure for growing epitaxial FeSe on SrTiO3. Despite the explicit absence of this step here, it is possible that Se substitutions are still generated during the deposition of 1UC FeSe.
2.2.2 FeSe deposition
To grow stoichiometric FeSe, two conditions are typically employed [12]. First, since Se is significantly more volatile than Fe, the substrate temperature is set between the source temperatures: . At least for growth on “inert,” graphitized SiC, this condition was rationalized as follows: Impinging Fe atoms with temperature will be adsorbed with sticking coefficient close to unity, while impinging Se atoms can stick only if they bind to free Fe on the substrate. Second, to compensate for high Se losses and to mitigate excess Fe clustering, typical molar flux ratios / range from 5 to 20. We note that with these two conditions (moderate substrate temperature 400-500 ∘C, excess Se flux), there may still be a sizeable Se chemical potential at the SrTiO3 surface driving the kinds of Se reactions proposed by Bang et al., but further investigations by STM or other techniques are needed.
2.2.3 Post-growth annealing
Post growth, the FeSe monolayer on SrTiO3 becomes superconducting only after an additional vacuum anneal. He et al. used ARPES measurements to show that in this process, the FeSe monolayer is progressively doped with electron carriers [4]. The electron doping induces a non-rigid band transformation that eventually leaves the FS with only electron pockets and opens up a gap. The source of electron doping remains an open question. He et al. suggested that the electron doping could arise from O vacancies in SrTiO3 created during annealing. Berlijn et al. investigated the possibility of Se vacancies, but their calculations revealed Se vacancies to be hole dopants, not electron dopants [42]. More recently, cross-sectional TEM imaging by Li et al. suggested the presence of interstital Se atoms trapped at the FeSe/SrTiO3 interface during growth, which are subsequently released upon annealing. The authors proposed that the removal of these interstitial Se atoms allows O vacancies in SrTiO3 to effectively donate electron carriers to the FeSe monolayer [43].
Overall, some elements of “correct” SrTiO3 pre-treatment and post-growth annealing appear necessary to produce superconducting 1UC FeSe/SrTiO3, but many aspects of the growth procedure could be clarified through more systematic investigations.
2.3 What is the interface structure?
We begin by comparing and contrasting three tools that have been applied to probe the interface atomic structure.
-
1.
Scanning tunneling microscopy (STM): real-space, atomic-resolution imaging of surface
Pro: An in-situ technique commonly integrated with a MBE chamber.
Con: An indirect technique that requires additional modeling to make inferences about the buried interface. -
2.
Electron diffraction: low-energy (LEED) or reflection high-energy (RHEED): momentum-space information of surface atomic structure
Pro: An in-situ technique that can also monitor real-time growth (RHEED).
Con: Phase information is unavailable. The interface signal may sometimes be buried after FeSe deposition [6]. -
3.
Transmission electron microscopy (TEM): real-space, atomic-resolution imaging of exposed cross-section
Pro: Direct atomic-resolution imaging of the interface cross-section.
Con: An ex-situ technique that requires capping (commonly FeTe). As evinced by Ref. [30, 43], Te atoms from the cap may unintentionally intermix and substitute at least the top-layer Se atoms of 1UC FeSe. The size mismatch between Se and Te can strain the monolayer film, possibly altering its original binding structure to SrTiO3. Additionally, the technique averages over each column of atoms in the 10-100 nm thick section being studied.
2.3.1 21 reconstruction
The first hint of any interface superstructure was the appearance of dark stripes with 21 periodicity in STM topographic images (Figure 5a) [3, 38]. To explain this structure, Bang et al. proposed an atomic model where half the O atoms on the surface TiO2 layer are stripped off, and the bottom-layer Se atoms of the FeSe monolayer are laterally registered with the O vacancy sites [38]. The authors argued that such arrangement could increase the binding energy, electron-dope the FeSe monolayer, and cause the FeSe monolayer to relax with a 21 superstructure. In addition, since there are two equivalent O sites within a TiO2 UC, the model could naturally explain the observation of half-UC phase shifts that occur either discontinuously at a trench [44] (Figure 5a), or continuously within a few nanometers of a domain boundary [45].
2.3.2 More reconstructions
Lee et al. grew 1UC FeSe on SrTiO3 with neither in-situ Se etching nor ex-situ treatment [6]. They simply annealed as-bought substrates up to 830 ∘C in their MBE chamber, until RHEED measurements detected superstructure spots, typically but not necessarily [47] (Figure 5b). Subsequent deposition of FeSe and post-growth anneal resulted in superconducting samples with 11 diffraction spots.
Peng et al. found a qualitatively different behavior in 1UC FeSe/BaTiO3 [22]. After annealing BaTiO3 at 950 ∘C under Se flux, their LEED images exhibited 33 spots. Curiously, growth of 1UC FeSe produced three distinct domains: one domain commensurate with the BaTiO3 11 UC, with expanded lattice constant 3.99 Å; two domains rotated by 18.5∘, commensurate with a BaTiO3 33 supercell, with smaller lattice constant 3.78 Å. Furthermore, ARPES detected superconducting gaps in all three regions, with closing temperature ranging from 70-75 K.
More recent experiments have detected superconducting gaps in 1UC FeSe on STO(110) [48, 49], anatase TiO2(001) [50], and rutile TiO2 [51], with different lattice constants and surface reconstructions (prior to growth). Taken together (Table 2), the variety may imply that neither lattice constant nor the lateral atomic registry between 1UC FeSe and its underlying substrate are critical factors behind the enhanced superconductivity of this heterostructure.
| Substrate | Lattice constant | Reconstruction | Ref. |
| [Bulk FeSe: = 3.77 Å] | |||
| SrTiO3(001) | = 3.90 Å | 21 [STM] | [3, 38, 46, 44, 45] |
| [RHEED] | [6, 47] | ||
| [various] | [52] | ||
| SrTiO3(110) | = 3.90 Å | 41 [STM] | [48] |
| = 5.52 Å | 61 [STM] | [48] | |
| 31 [LEED] | [49] | ||
| BaTiO3(001) | = 3.99 Å | 33 [LEED] | [24] |
| Anatase TiO2(001) | = 3.78 Å | 41 [STM] | [50] |
2.3.3 Double-TiOx termination
Perhaps what matters is the vertical structure of the interface. Using cross-sectional TEM, Li et al. [43] imaged a double-TiOx termination at the interface of FeTe/1UC FeSe/SrTiO3 (Figure 5c). Zou et al. [52] also uncovered a double-TiOx termination using x-ray diffraction, LEED and RHEED. Although such termination had long been proposed as a candidate model for the 21 surface reconstruction [53], it had largely been neglected in atomic models of 1UC FeSe/SrTiO3 until this point. Roughly speaking, the extra TiOx termination is half as polar as a bulk TiO2 layer, and helps SrTiO3 mitigate a divergence of the electrostatic potential towards its bulk [54]. Structural and ferroelectric properties are likely modified near this double-TiOx termination. Zou et al. argued that the double-TiOx termination faciliates epitaxial growth of FeSe through stronger binding, and also improves charge transfer from oxygen vacancies [52].
Li et al. also used TEM imaging to extract the structural parameters of their FeTe-capped sample. They found the 1UC FeSe to have a 9.5% reduced chalcogen height with 2.5% in-plane lattice tensile strain (compared to bulk values). Furthermore, within a 10 nm cross section, the authors imaged a lateral half-UC shift between the bottom Se atoms and topmost Ti atoms. If this feature is characteristic of uncapped 1UC FeSe/SrTiO3, then it suggests that the heterostructure has local bond disorder due to lattice incommensuration. We note that STM measurements do reveal spectral and gap inhomogeneity even in pristine regions of FeSe with no in-plane, atomic-scale defects [55]. Further systematic investigations and correlation of disorder with growth procedures is needed.
3 ELECTRONIC STRUCTURE AND PAIRING
Having surveyed a range of experiments characterizing the basic properties of 1UC FeSe/SrTiO3, we turn to the question of electronic structure and pairing. Superconductors are typically categorized into one of two paradigms: conventional or unconventional (Table 3). In a conventional superconductor, electrons are bound into Cooper pairs by attractive interactions mediated by phonons. The resulting energy gap has -wave angular symmetry and a uniform sign throughout the BZ. In an unconventional superconductor, many believe that quantum fluctuations from a proximate phase (e.g. magnetism) provide the glue to bind electrons. Since these fluctuations are often repulsive, the resulting gap function harbors sign changes throughout the BZ (to be further discussed in Subsection 3.4). This latter class of superconductors, which includes the cuprates and iron pnictides, has long been associated with higher values. However, the tables have turned with the recent discovery of 203 K conventional superconductivity in pressurized H3S [56].
| Conventional | Unconventional | |
|---|---|---|
| 203 K | 164 K | |
| Maximum | pressurized H3S [56] | pressurized HgBa2Ca2Cu3O8+δ [57] |
| Pairing mechanism | Phononic | Electronic (magnetic/orbital) |
| Gap structure | Sign-preserving | Sign-changing |
Within months of the 2008 discovery of iron pnictide superconductors, Mazin et al. [58] and Kuroki et al. [59] proposed an unconventional mechanism of pairing in these compounds. The basic premise was that first, the electron-phonon coupling constant was too small [60, 58]; second, the proximity of the superconductor to an antiferromagnetic metal hinted at the role of spin fluctuations; and third, the multiband FS of these compounds, comprising electron pockets at the zone corner and hole pockets at the zone center , could be crucial. The authors then argued that repulsive spin fluctuations, with wave vector spanning the separated electron and hole pockets, could pair electrons if the gap function reversed sign across the pockets with an overall “” symmetry (Figure 6). Though not free from controversy [61], this framework prevailed in the early years of iron pnictide superconductors.

Fast-forwarding to the present, 1UC FeSe/SrTiO3 poses several theoretical conundrums. First, its FS includes electron pockets (Figure 2e), but not the hole pockets necessary for pairing. Second, it appears to exhibit traits of both conventionality and unconventionality. In this section, we review contrasting indications for both phononic (Subsection 3.1) and electronic (spin/orbital, Subsection 3.2) mechanisms of pairing. We then evaluate ARPES and STM measurements of gap symmetry and structure (Subsection 3.3). Finally, we discuss multiband, multiboson scenarios of pairing that enable phonons and spin/orbital fluctuations to operate constructively to enhance (Subsection 3.4). These latter ideas are far from being a fait accompli, but exemplify a potential “best-of-both-worlds” path towards creating higher- superconductors.
3.1 Phononic mechanisms
In their original report, the discoverers of 1UC FeSe/SrTiO3 proposed some sort of interface-enhanced electron-phonon coupling as the mechanism for high- superconductivity. Here, we discuss subsequent ARPES experiments by Lee, Schmitt, Moore et al. that lent support to this notion [6].
3.1.1 Replica bands
What Lee, Schmitt, Moore et al. discovered in their ARPES measurements was that each primary electronic band of 1UC FeSe/SrTiO3 possessed a fainter replica band offset by 100 meV [6]. These faint bands were near-duplicates of their primary counterparts, without being offset in momentum or smeared (Figure 7a,b). In addition, the replica bands persisted at least to 120 K, well above the gap-opening temperature ( = 587 K). Such replicas were absent in FeSe films two UC or thicker (Figure 7c,d), pointing to an interfacial origin of these features. Similar phenomenology was observed by Peng et al. in 1UC FeSe/BaTiO3 [22].
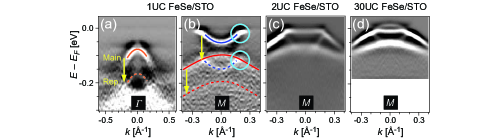
In their interpretation of the replica bands, Lee, Schmitt, Moore et al. first excluded the possibility of quantum-well states arising from 2D confinement. There is no reason for such states to have identical dispersions. Furthermore, quantum-well states exhibit a well-behaved dependence on layer, in contrast to the abrupt disappearance of replica bands in 2UC FeSe/SrTiO3. Instead, the authors attributed the replica bands to bosonic shake-off, in analogy to vibrational shake-off observed in photoemission spectroscopy of H2 molecules. They identified the boson with an optical O phonon band calculated for bulk SrTiO3 [62]. Subsequent calculations of slab SrTiO3 pointed to a surface phonon mode involving polar vibrations of vertical Ti-O bonds [63]. These theoretical comparisons were later corroborated by ARPES measurements that also found replica bands on bare SrTiO3 [64]. However, for an electron-phonon coupling to produce nearly-identical bands with no momentum smearing, it must be sharply peaked at = 0. This differs from the usual assumption of a constant in theories of phonon-mediated superconductivity, and some modeling is needed to understand its origin.
3.1.2 Model of interface electron-phonon coupling
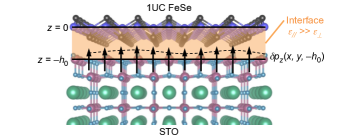
To explain how the electron-phonon coupling could become sharply peaked at = 0, Lee, Schmitt, Moore et al. presented the following model [6, 65]: Assume we have a 2D sheet of FeSe at = 0, and a layer of dipole moments below at the SrTiO3 surface, (Figure 8). The dipole moments come from vertical stretching of surface Ti-O bonds and are represented by . From an electrostatics calculation, these moments induce a potential at the FeSe layer,
| (1) |
where , are the in-plane and perpendicular dielectric constants in the interface region. Taking the Fourier transform yields
| (2) |
It follows that , where . Intuitively, the 0 coupling hinges upon (1) the FeSe monolayer being sufficiently removed from the dipole layer (large ), and (2) the interface region screening lateral charge imbalance much more effectively than vertical charge imbalance (large ).
Calculations by Rademaker et al. showed that a ratio of 0.1 was needed for replica bands to duplicate primary band features without significant momentum smearing [66]. If we take to be 0.20 Å-1 [17] and to be 4.9 Å [43], the distance between the surface TiO2 layer and the Fe-plane, then 1 and we require 100 in the interface region. While one should be wary of interpreting the model interface too literally, an argument suggests that it should contain contributions from both SrTiO3 and FeSe, with the former having in its 3D bulk limit, and the latter having due to its 2D nature [65].
Alternative speculations regarding the replica bands include O impurity bands [67], or some form of Raman scattering involving SrTiO3 phonon modes [68]. No model details have been presented for impurity bands, and it is unclear whether sufficient cross section and viable selection rules exist for Raman scattering. Peaks and dips have been detected in STM filled- and empty-state spectra [Supplemental Material of Ref. [37]], but the authors have not confirmed their identity as replica bands.
3.1.3 FeSe phonon modes
In their initial STM measurements of 1UC FeSe/SrTiO3, Wang et al. reported two gaps in the point spectrum, at 9 meV and 20.1 meV respectively [3]. This finding appeared to contradict early ARPES measurements of a single isotropic gap on the zone corner electron pockets, with = 132 meV in one film and 152 meV in another film [17]. Coh et al. offered an alternative explanation for the double-gap signature in terms of two FeSe phonon modes, which they argued could enhance when a monolayer of FeSe is locked to a SrTiO3 substrate [69]. Following this report, Tang et al. examined point spectra of 1UC FeSe/SrTiO3 and K-coated 2-4 UC FeSe/SrTiO3 [70]. They identified positive-energy dips around 11 meV and 21 meV as FeSe phonon modes.
3.2 Electronic mechanisms
A feature of the interface phonon-coupling model is that it does not depend at all on 1UC FeSe, as long as the heterostructure has an interface dielectric constant that is sufficiently anisotropic. On one hand, such generality could be desirable for reproducing this mechanism in other systems. On the other hand, the model leaves open the possibility of preexisting pairing interactions within FeSe that are subsequently strengthened by SrTiO3.
Two foil systems suggest that interface phonon coupling plays a secondary role to a primary pairing mechanism within FeSe that is enhanced by electron doping. The first is an FeSe-intercalate, (Li1-xFex)OHFeSe. Fe antisite substitutions increase electron transfer from buffer LiOH layers to FeSe [71], resulting in 40 K superconductivity [72]. Importantly, ARPES and STM measurements resolved low-energy bands that are nearly identical to those of 1UC FeSe/SrTiO3 and gaps of similar magnitudes [73, 74, 75, 76]; however, no replica bands were visible. The second system involves coating FeSe with K adatoms, which inject electrons into the surface FeSe layer [77, 78, 79, 80, 70, 81, 82]. The resulting superconducting phase has a gap-closing temperature up to 48 K, close to the 65 K value of 1UC FeSe/SrTiO3. The electronic transition induced by progressive K deposition is rather rich and provides clues of unconventional mechanisms of pairing.
3.2.1 Clues from the electron-doping phase diagram
In the paradigm of unconventional superconductors, pairing is likely mediated by quantum fluctuations from nearby electronic phases. Hence, we glean inspiration from the electron-doping phase diagram of FeSe, keeping in mind that it may not be fully representative of 1UC FeSe/SrTiO3.
The first striking feature in the electron-doping phase diagram of FeSe is that evolves through two domes [82]: a low- phase is first suppressed, eventually giving way to a higher- phase (Figure 9). In general, domes are hallmarks of unconventional superconductivity, less naturally explained within a purely phononic framework [67]. Song et al. also found that the higher- phase is insensitive to the disorder of nonmagnetic K adatoms, a point whose implications we revisit in Subsection 3.3.
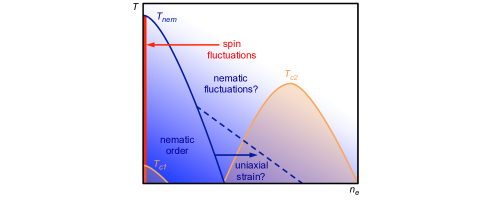
A second observation is that nematic order is suppressed preceding the high- phase [77, 78], although a smaller overlapping tail of the nematic phase may persist due to remnant uniaxial strain from underlying bulk FeSe [79]. Nematic order is generally defined as broken rotational symmetry that preserves the translational symmetry of the crystal. In stoichiometric FeSe, nematic order is manifested as a small orthorhombic distortion [87] and a large splitting of the Fe and bands [5, 18, 19, 20, 21, 88], without concomitant magnetic order [89]. Given the proximity and possible overlap of the nematic phase, it is tempting to ask whether nematic quantum criticality could be at play. Nematic fluctuations would provide attractive interactions that help bind electrons [90, 91, 92, 93, 94, 95], much like the aforementioned SrTiO3 phonons.
3.2.2 Nematic fluctuations
Since 1UC FeSe bound to SrTiO3 is nominally tetragonal, nematic order should be globally suppressed. However, if there truly exists a large underlying nematic susceptibility that produces fluctuations, then nanoscale patches of such fluctuations might be pinned around crystalline imperfections that locally break tetragonal symmetry.
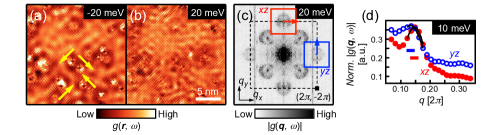
Using STM as a nanoscale probe, Huang et al. investigated quasiparticle interference (QPI) patterns generated around anistropic defects in 1UC FeSe/SrTiO3 [55] (Figure 10). Since QPI anisotropy can arise from random disorder or experimental artifacts, the authors developed a realistic, -matrix model to specifically detect orbital anisotropy of Fe and bands. By sampling multiple spatial regions of a film, they excluded orbital ordering with domain size larger than = 20 nm 20 nm, Fermi wave vector difference larger than = 0.014 , and energy splitting larger than = 3.5 meV. The lack of detectable ordering pinned around defects disfavors scenarios of a proximate nematic quantum critical point in 1UC FeSe/SrTiO3, in contrast to K-coated FeSe (Figure 9).
3.2.3 Spin fluctuations
Given the importance of spin fluctuations in many iron pnictide superconductors, their role in pairing should also be considered in 1UC FeSe/SrTiO3 [96]. Several inelastic neutron scattering measurements found that in stoichiometric FeSe, there are stripe spin fluctuations that are enhanced below the orthorhombic transition temperature [84, 85, 86] (Figure 9). However, magnetic order is absent, owing to some sort of frustration [97, 98, 99] or quadrupolar order [100]. The nature of spin excitations in 1UC FeSe/SrTiO3 remains an important open question, especially since both doping and the Se height may tune exchange interactions. Some experimental ingenuity is required, as ex-situ neutron scattering measurements are likely not feasible on 1UC films. One possible approach is the use of STM to map the magnetic-field dependence of impurity signatures, in comparison with theoretical modeling [101].
3.3 Gap symmetry and structure
We shift gears and consider pairing from the viewpoint of gap symmetry and structure. In general, such questions have proven more challenging to address in the iron-based superconductors than in the cuprates. Unlike the cuprates, with a single Cu band and universal gap symmetry, the multiband FS the of iron-based superconductors can allow a variety of gap structures across their member compounds. Even within the same compound, such as KFe2As2, different pairing symmetries can be tuned by pressure [102]. To add to the challenge, many candidate gap structures share the same angular symmetry [103], and thus cannot be differentiated by the corner junction experiments that proved instrumental in revealing the -wave gap of YBa2Cu3O7-x [104]. ARPES can resolve gap magnitudes on each specific band, but not their signs. STM QPI measurements carry phase-sensitive information, but can be challenging to interpret or normalize [105].
With these complications in mind, there is less likely to be a clear,“smoking-gun” experiment revealing the gap symmetry of 1UC FeSe/SrTiO3. A more likely scenario is that through multiple experimental measurements, consensus will begin to converge upon a candidate gap function.
3.3.1 The candidates
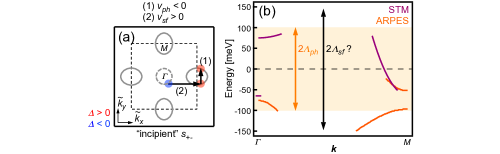
Given the Fermi surface of 1UC FeSe/SrTiO3, with only electron pockets, the primary gap symmetry candidates are “plain” , “nodeless” , “bonding-antibonding” , and “incipient” (Figure 11). Nodal candidates are inconsistent with the fully-gapped structures detected by STM and ARPES (Figure 2b).
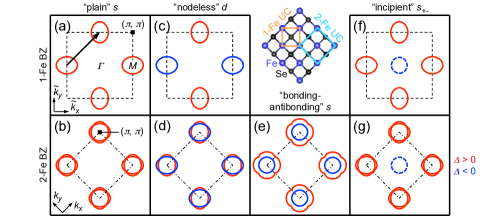
“Plain” gap symmetry (Figure 11a,b) will be discussed in Subsection 3.3.3. “Nodeless” (Figure 11c,d), which appears most similar to the gap in cuprates, is strictly defined in a 1-Fe, “pseudocrystal momentum” BZ () that only exists when FeSe has exact glide-plane symmetry. When the gap structure is folded into the proper 2-Fe BZ, it is no longer -wave with respect to regular crystal momentum (). In addition, nodes are technically created when opposite-sign gaps meet at the pocket crossings [106]. However, based on microscopic details, the nodal quasiparticle weight could be weak and elude spectroscopic detection [107, 108].
If the folded pockets in the 2-Fe BZ hybridize and detach from each other, then nodes will certainly be avoided, leading to a “bonding-antibonding” scenario (Figure 11e). Here, the inner and outer pockets host gaps of opposite sign.
3.3.2 ARPES measurements
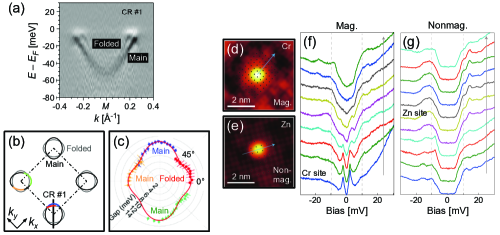
Early ARPES investigations of 1UC FeSe/SrTiO3 reported isotropic gaps ( = 13-15 meV) on nearly-circular electron pockets [17, 4, 5, 6]. To resolve finer structure, Peng et al. grew 1UC FeSe on SrTiO3/KTaO3, whose expanded lattice constant increased pocket ellipticity [24]. Alternatively, Zhang et al. changed photon polarizations to selectively probe bands of different orbital characters [110]. In both cases, the authors observed two pockets at each corner (main and folded), with no signs of hybridization (Figure 12a-c). Momentum distribution cuts across the intersection of the main and folded pockets revealed a single band, with no detectable splitting. Furthermore, gap measurements on equivalent segments of the main and folded pockets showed identical structure. Such lack of sizeable hybridization remains to be understood, given that both spin-orbit coupling or the SrTiO3 substrate can break glide-plane symmetry. More importantly, it also disfavors scenarios of “bonding-antibonding” -wave pairing. The authors in both reports also resolved gap anisotropy, with minima directed along the Fe-Se axes. These measurements will provide useful feedback for theoretical gap function calculations.
3.3.3 STM measurements
Fan et al. employed a multi-pronged STM approach, involving phase-sensitive QPI and defect imaging, to build support for “plain” -wave superconductivity in 1UC FeSe/SrTiO3 [45]. In particular, the authors found that magnetic adatoms (Cr, Mn) induced in-gap bound states, while non-magnetic adatoms did not (Zn, Ag, K) (Figure 12d-g). This observation is consistent with an underlying gap structure without sign changes, but not a fool-proof guarantee of such. Anderson’s theorem states that a superconductor with a sign-preserving gap should be robust against the disorder of nonmagnetic impurities. Taken in its equivalent, contrapositive form, the observation of in-gap states induced by nonmagnetic impurities would thereby signal a sign-changing gap. However, the converse statement (“robustness against nonmagnetic impurities” “sign-preserving gap”) is not logically identical to the original theorem, so it lacks a“smoking-gun” nature [103, 111]. In the case of 1UC FeSe/SrTiO3, with the “nodeless” and “bonding-antibonding” gap structures, the opposite-sign gaps reside on normal-state Fermi pockets with different orbital characters. Given that the impurities in the Fan et al. experiment outside the Fe-plane, they may have had insufficient interorbital scattering strength to produce a pair-breaking effect. This complication is alleviated in the case of pairing in the iron pnictides. Since both the electron and hole pockets hosting opposite-sign gaps share the same orbital characters, interband scattering mixing the signs is easier.
Despite these caveats, the preponderance of current experiments favor same-sign gaps on all Fermi pockets of 1UC FeSe/SrTiO3 above the other possibilities.
3.4 Multiband, multiboson scenarios of pairing
In this final subsection, we examine pairing scenarios in which multiple bosons work cooperatively across multiple bands to boost . More specifically, we consider various ways in which attractive interactions (e.g., mediated by phonons) and repulsive interactions (e.g., mediated by spin fluctuations) can fit under the same roof in 1UC FeSe/SrTiO3 [112, 6, 94, 109].
The basic picture can be explained from the gap equation of a one-band superconductor in the weak-coupling limit:
| (3) |
Here, is an effective potential that scatters a Cooper pair from (, ) to (, ), is the Bogoliubov quasiparticle energy, is the normal-state quasiparticle energy, and is the gap function. Since any such must obey Eq. 3 self-consistently, its form is determined by as follows:
-
1.
Attractive interactions () increase the gap amplitude if they connect segments of the FS hosting same-sign gaps ( and , or and ).
-
2.
Repulsive interactions () increase the gap amplitude if they connect segments of the FS hosting opposite-sign gaps ( and , or and ).
Attractive and repulsive interactions can therefore simultaneously increase the gap amplitude, if the interactions connect different segments of the FS, with appropriate signs in the gap function. In the limit of forward scattering (), attractive interactions have the form , and from Eq. 3, increase the gap amplitude irrespective of the gap sign or functional form.
Figure 13 illustrates a pairing framework for 1UC FeSe/SrTiO3 involving multiple bosons. We postulate the existence of a “primary” interband interaction peaked around , connecting the disparate electron pockets and dictating the overall gap symmetry (Figure 13a,b). This interaction could be a repulsive antiferromagnetic spin fluctuation, stabilizing -wave pairing, or an attractive antiferroorbital fluctuation, stabilizing -wave pairing. Then in addition, there may be “enhancer” intraband interactions that are necessarily attractive and peaked around (Figure 13c,d). These interactions universally boost pairing irrespective of the underlying gap symmetry, and may come from SrTiO3 phonons [6], and/or nematic fluctuations.
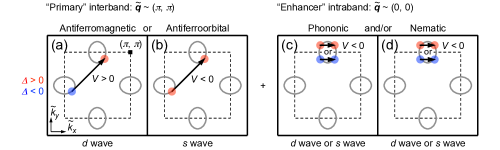
Although this pairing framework is appealing due to its inclusive nature, we emphasize that other than the SrTiO3 phonon mode, there have been no experimental indications of the other interactions shown in Figure 13. Some suggest that DFT calculations of 1UC FeSe/SrTiO3 with checkerboard antiferromagnetism [] best resemble experimental data [113, 114, 69], thus motivating the possible existence of related spin fluctuations. Others take the orbitally-ordered state of bulk FeSe as a hint of possible ferroorbital [nematic, ] or antiferroorbital [] fluctuations [93, 94].
3.4.1 Pairing involving incipient bands
Alternatively, we recall that inelastic neutron scattering measurements have detected stripe spin fluctuations [] in bulk FeSe [84, 85, 86], similar to many iron pnictide compounds. At first glance, it is unclear whether such interactions, if they persist in 1UC FeSe/SrTiO3, would be useful for pairing. The usual hole pocket at the BZ center, located away from the Fermi electron pockets, is sunken 65-80 meV below the Fermi energy (Figure 2). However, ARPES measurements have demonstrated that in LiFeAs, a superconducting gap can develop on a sunken hole pocket 10 meV below the Fermi energy [115]. Motivated by this observation, Chen et al. proposed a “bootstrap” mechanism of pairing involving incipient bands in 1UC FeSe/SrTiO3 [109].
The basic picture proposed by Chen et al. is illustrated in Figure 14a. In the weak-coupling limit, interactions such as spin fluctuations between a Fermi sheet and an incipient band cannot open up a superconducting gap by themselves. However, if there are preexisting interactions, such as phonons, that stabilize a small gap within the Fermi sheet, then spin fluctuations from incipient bands can come into play and enhance pairing. In 1UC FeSe/SrTiO3, this mechanism results in “incipient” symmetry, where the Fermi electron pockets host same-sign gaps and the sunken hole pocket at the zone center hosts an opposite-sign gap. From the author’s calculations, incipient bands can boost by an order of magnitude, although numbers are sensitive to estimates of interaction strengths and cutoff.
An appealing feature of this model in the context of 1UC FeSe/SrTiO3 is that the Fermi electron pockets and sunken hole pocket barely or do not overlap in energy (depending on the degree of electron doping). Such a superconducting state would likely be immune to nonmagnetic impurities [116], as elastic scattering would not mix opposite-sign quasiparticles. Indeed, QPI measurements have confirmed that there is no electron-hole pocket scattering near the gap energy [37, 45]. Thus, the defect experiments by Fan et al. could also be consistent with “incipient” gap symmetry.
Recently, Huang et al. uncovered a electron pocket 80 meV above (Figure 14b), using empty-state STM measurements [37]. This pocket may be similar to one discovered in K-coated bulk FeSe0.55Te0.45 [117] and FeSe [78], or a shallow -electron Fermi pocket in 3D (Tl, Rb)yFe2-xSe2 [118]. Given that this pocket lies within the SrTiO3 phonon energy (100 meV), it may be interesting to explore whether it has any positive contribution to in 1UC FeSe/SrTiO3 [119].
4 SUMMARY AND OUTLOOK
In this review, we have surveyed key experimental and theoretical developments related to 1UC FeSe/SrTiO3 from its time of discovery, 2012, to early 2016. The major themes we have presented and developed can be captured in the following five statements:
-
1.
Monolayer FeSe on SrTiO3 exemplifies a dramatic interface effect, in which a unit-cell layer of free-standing FeSe is non-superconducting down to 2.2 K, but subsequently exhibits ranging from 65 K to 109 K when coupled to SrTiO3.
-
2.
Experiments probing an air-sensitive, monolayer film are demanding in nature, but this challenge motivates the development and use of improved in-situ instrumentation, such as four-probe STM, which in turn may lead to discoveries of new systems.
-
3.
Capping of 1UC FeSe/SrTiO3 has not yet been optimized. Not only is it crucial for protecting films from atmospheric exposure, it simultaneously provides a second interface that could yet be engineered to enhance electronic properties.
-
4.
Experiments have uncovered clues of both conventional and unconventional mechanisms of pairing in 1UC FeSe/SrTiO3. While the ARPES replica bands are best explained by cross-interface coupling to SrTiO3 phonon modes, more experiments verifying their nature and influence on are desirable [120]. And although accumulated experience with iron-based superconductors might suggest the importance of spin (and orbital) fluctuations, direct measurements of magnetic excitations in 1UC FeSe/SrTiO3 are still needed.
-
5.
Various pairing scenarios have been proposed in which multiple bosons, such as phonons and spin fluctutations, can work cooperatively in a multiband environment to enhance in 1UC FeSe/SrTiO3. Although these theories still require experimental confirmation, they represent an appealing “best-of-both-worlds” approach to finding and creating superconductors with even higher . Combined with the layered 2D architecture of 1UC FeSe/SrTiO3 in which these cooperative effects may be realized and engineered, many possibilies abound down the road.
DISCLOSURE STATEMENT
The authors are not aware of any affiliations, memberships, funding, or financial holdings that might be perceived as affecting the objectivity of this review.
ACKNOWLEDGMENTS
The authors would like to thank C.-Z. Chang, S. Coh, S. Fang, J.-F. Ge, P. J. Hirschfeld, E. Kaxiras, S. A. Kivelson, D.-H. Lee, I. I. Mazin, Z.-X. Shen, C.-L. Song, T. A. Webb, and K. Zou for valuable discussions that have informed many of the views and ideas presented in this review. Our work on 1UC FeSe/SrTiO3 was supported by the National Science Foundation under Grants No. DMR-0847433 and No. PHY-1231319 (STC Center for Integrated Quantum Materials), and the Gordon and Betty Moore Foundation’s EPiQS Initiative through Grant. No. GBMF4536. J. E. Hoffman acknowledges support from the Canadian Institute for Advanced Research.
References
- [1] Reyren N, Thiel S, Caviglia AD, Kourkoutis LF, Hammerl G, et al. 2007. Science 317:1196–1199
- [2] Gozar A, Logvenov G, Fitting Kourkoutis L, Bollinger AT, Giannuzzi LA, et al. 2008. Nature 455:782–5
- [3] Wang QY, Li Z, Zhang WH, Zhang ZC, Zhang JS, et al. 2012. Chin. Phys. Lett. 29:037402
- [4] He S, He J, Zhang W, Zhao L, Liu D, et al. 2013. Nat. Mater. 12:605–610
- [5] Tan S, Zhang Y, Xia M, Ye Z, Chen F, et al. 2013. Nat. Mater. 12:634–640
- [6] Lee JJ, Schmitt FT, Moore RG, Johnston S, Cui YT, et al. 2014. Nature 515:245–248
- [7] Zhang Z, Wang YH, Song Q, Liu C, Peng R, et al. 2015a. Sci. Bull. 60:1301–1304
- [8] Ge JF, Liu ZL, Liu C, Gao CL, Qian D, et al. 2015. Nat. Mater. 14:285–289
- [9] Hsu FC, Luo JY, Yeh KW, Chen TK, Huang TW, et al. 2008. Proc. Natl. Acad. Sci. 105:14262–14264
- [10] Okamoto H. 1991. J. Phase Equilib. 12:383–389
- [11] Song CL, Wang YL, Cheng P, Jiang YP, Li W, et al. 2011a. Science 332:1410–1413
- [12] Song CL, Wang YL, Jiang YP, Li Z, Wang L, et al. 2011b. Phys. Rev. B 84:020503
- [13] Simonin J. 1986. Phys. Rev. B 33:7830–7832
- [14] Böhmer AE, Hardy F, Eilers F, Ernst D, Adelmann P, et al. 2013. Phys. Rev. B 87:180505
- [15] Schmidbauer M, Kwasniewski A, Schwarzkopf J. 2012. Acta. Crystallogr. B 68:8–14
- [16] Zhang T, Cheng P, Li WJ, Sun YJ, Wang G, et al. 2010. Nat. Phys. 6:104–108
- [17] Liu D, Zhang W, Mou D, He J, Ou YB, et al. 2012a. Nat. Commun. 3:931
- [18] Shimojima T, Suzuki Y, Sonobe T, Nakamura A, Sakano M, et al. 2014. Phys. Rev. B 90:121111
- [19] Nakayama K, Miyata Y, Phan GN, Sato T, Tanabe Y, et al. 2014. Phys. Rev. Lett. 113:237001
- [20] Watson MD, Kim TK, Haghighirad AA, Davies NR, McCollam A, et al. 2015. Phys. Rev. B 91:155106
- [21] Zhang P, Qian T, Richard P, Wang XP, Miao H, et al. 2015b. Phys. Rev. B 91:214503
- [22] Peng R, Xu HC, Tan SY, Cao HY, Xia M, et al. 2014a. Nat. Commun 5:5044
- [23] Zhang W, Li Z, Li F, Zhang H, Peng J, et al. 2014a. Phys. Rev. B 89:060506
- [24] Peng R, Shen XP, Xie X, Xu HC, Tan SY, et al. 2014b. Phys. Rev. Lett. 112:107001
- [25] Zhang WH, Sun Y, Zhang JS, Li FS, Guo MH, et al. 2014b. Chin. Phys. Lett. 31:017401
- [26] Deng LZ, Lv B, Wu Z, Xue YY, Zhang WH, et al. 2014. Phys. Rev. B 90:214513
- [27] Sun Y, Zhang W, Xing Y, Li F, Zhao Y, et al. 2014. Sci. Rep. 4:6040
- [28] Cui YT, Moore RG, Zhang AM, Tian Y, Lee JJ, et al. 2015. Phys. Rev. Lett. 114:037002
- [29] Tian YC, Zhang WH, Li FS, Wu YL, Wu Q, et al. 2016. Phys. Rev. Lett. 116:107001
- [30] Li F, Ding H, Tang C, Peng J, Zhang Q, et al. 2015. Phys. Rev. B 91:220503
- [31] Zhao W, Zhang CZ, Jiang J, Moodera J, Chan M. 2016a. Bull. Am. Phys. Soc. 61:B11.00011
- [32] Ge JF. 2016. Private communication
- [33] Zhu Y, Tsai CF, Wang H. 2013. Supercond. Sci. Technol. 26:025009
- [34] Bozovic I, Ahn C. 2014. Nat. Phys. 10:892–895
- [35] Božović I. 2016. Nat. Phys. 12:22–24
- [36] Lin Y, Becerra-Toledo AE, Silly F, Poeppelmeier KR, Castell MR, Marks LD. 2011. Surf. Sci. 605:L51 – L55
- [37] Huang D, Song CL, Webb TA, Fang S, Chang CZ, et al. 2015. Phys. Rev. Lett. 115:017002
- [38] Bang J, Li Z, Sun YY, Samanta A, Zhang YY, et al. 2013. Phys. Rev. B 87:220503
- [39] Kawasaki M, Takahashi K, Maeda T, Tsuchiya R, Shinohara M, et al. 1994. Science 266:1540–1542
- [40] Ohnishi T, Shibuya K, Lippmaa M, Kobayashi D, Kumigashira H, et al. 2004. Appl. Phys. Lett. 85:272–274
- [41] Connell JG, Isaac BJ, Ekanayake GB, Strachan DR, Seo SSA. 2012. Appl. Phys. Lett. 101
- [42] Berlijn T, Cheng HP, Hirschfeld PJ, Ku W. 2014. Phys. Rev. B 89:020501
- [43] Li F, Zhang Q, Tang C, Liu C, Shi J, et al. 2016a. 2D Mater. 3:024002
- [44] Li Z, Peng JP, Zhang HM, Zhang WH, Ding H, et al. 2014. J. Phys. Condens. Matter 26:265002
- [45] Fan Q, Zhang WH, Liu X, Yan YJ, Ren MQ, et al. 2015. Nat. Phys. 11:946–952
- [46] Li N, Li Z, Ding H, Ji S, Chen X, Xue QK. 2013. Appl. Phys. Expr. 6:113101
- [47] Moore R. 2015. Bull. Am. Phys. Soc. 60:Z51.00001
- [48] Zhou G, Zhang D, Liu C, Tang C, Wang X, et al. 2016. Appl. Phys. Lett. 108
- [49] Zhang P, Peng XL, Qian T, Richard P, Shi X, et al. 2015a. arXiv:1512.01949
- [50] Ding H, Lv YF, Zhao K, Wang WL, Wang L, et al. 2016. Phys. Rev. Lett. 117:067001
- [51] Rebec S, Jia T, Zhang C, Hashimoto M, Lu D, et al. 2016. arXiv:1606.09358
- [52] Zou K, Mandal S, Albright SD, Peng R, Pu Y, et al. 2016. Phys. Rev. B 93:180506
- [53] Erdman N, Poeppelmeier KR, Asta M, Warschkow O, Ellis DE, Marks LD. 2002. Nature 419:55–58
- [54] Herger R, Willmott PR, Bunk O, Schlepütz CM, Patterson BD, Delley B. 2007. Phys. Rev. Lett. 98:076102
- [55] Huang D, Webb TA, Fang S, Song CL, Chang CZ, et al. 2016. Phys. Rev. B 93:125129
- [56] Drozdov AP, Eremets MI, Troyan IA, Ksenofontov V, Shylin SI. 2015. Nature 525:73–76
- [57] Gao L, Xue YY, Chen F, Xiong Q, Meng RL, et al. 1994. Phys. Rev. B 50:4260–4263
- [58] Mazin II, Singh DJ, Johannes MD, Du MH. 2008. Phys. Rev. Lett. 101:057003
- [59] Kuroki K, Onari S, Arita R, Usui H, Tanaka Y, et al. 2008. Phys. Rev. Lett. 101:087004
- [60] Boeri L, Dolgov OV, Golubov AA. 2008. Phys. Rev. Lett. 101:026403
- [61] Onari S, Kontani H. 2009. Phys. Rev. Lett. 103:177001
- [62] Choudhury N, Walter EJ, Kolesnikov AI, Loong CK. 2008. Phys. Rev. B 77:134111
- [63] Xie Y, Cao HY, Zhou Y, Chen S, Xiang H, Gong XG. 2015. Sci. Rep. 5:10011
- [64] Wang Z, McKeown Walker S, Tamai A, Wang Y, Ristic Z, et al. 2016. Nat. Mater. 3:1–6
- [65] Lee DH. 2015. Chin. Phys. B 24:117405
- [66] Rademaker L, Wang Y, Berlijn T, Johnston S. 2016. New J. Phys. 18:022001
- [67] Mazin II. 2015. Nat. Mater. 14:755–756
- [68] Kivelson SA. 2015. Private communication
- [69] Coh S, Cohen ML, Louie SG. 2015. New J. Phys. 17:073027
- [70] Tang C, Liu C, Zhou G, Li F, Ding H, et al. 2016. Phys. Rev. B 93:020507
- [71] Chen W, Zeng C, Kaxiras E, Zhang Z. 2016. Phys. Rev. B 93:064517
- [72] Lu XF, Wang NZ, Wu H, Wu YP, Zhao D, et al. 2015. Nat. Mater. 14:325–9
- [73] Zhao L, Liang A, Yuan D, Hu Y, Liu D, et al. 2016b. Nat. Commun. 7:10608
- [74] Niu XH, Peng R, Xu HC, Yan YJ, Jiang J, et al. 2015. Phys. Rev. B 92:060504
- [75] Du Z, Yang X, Lin H, Fang D, Du G, et al. 2016. Nat. Commun. 7:10565
- [76] Yan YJ, Zhang WH, Ren MQ, Liu X, Lu XF, et al. 2015. arXiv:1507.02577
- [77] Miyata Y, Nakayama K, Sugawara K, Sato T, Takahashi T. 2015. Nat. Mater. 14:775–779
- [78] Wen CHP, Xu HC, Chen C, Huang ZC, Lou X, et al. 2016. Nat. Commun. 7:10840
- [79] Ye ZR, Zhang CF, Ning HL, Li W, Chen L, et al. 2015. arXiv:1512.02526
- [80] Tang C, Zhang D, Zang Y, Liu C, Zhou G, et al. 2015. Phys. Rev. B 92:180507
- [81] Zhang WH, Liu X, Wen CHP, Peng R, Tan SY, et al. 2016. Nano Lett. 16:1969–1973. PMID: 26859620
- [82] Song CL, Zhang HM, Zhong Y, Hu XP, Ji SH, et al. 2016. Phys. Rev. Lett. 116:157001
- [83] Wen CHP, Xu HC, Chen C, Huang ZC, Pu YJ, et al. 2015. arXiv:1508.05848
- [84] Rahn MC, Ewings RA, Sedlmaier SJ, Clarke SJ, Boothroyd AT. 2015. Phys. Rev. B 91:180501
- [85] Wang Q, Shen Y, Pan B, Hao Y, Ma M, et al. 2015. Nat. Mater. 15
- [86] Wang Q, Shen Y, Pan B, Zhang X, Ikeuchi K, et al. 2015. arXiv:1511.02485
- [87] McQueen TM, Williams AJ, Stephens PW, Tao J, Zhu Y, et al. 2009. Phys. Rev. Lett. 103:057002
- [88] Zhang Y, Yi M, Liu ZK, Li W, Lee JJ, et al. 2015b. arXiv:1503.01556
- [89] Medvedev S, McQueen TM, Troyan IA, Palasyuk T, Eremets MI, et al. 2009. Nat. Mater. 8:630–3
- [90] Fernandes RM, Schmalian J. 2012. Supercond. Sci. Technol. 25:084005
- [91] Yamase H, Zeyher R. 2013. Phys. Rev. B 88:180502
- [92] Lederer S, Schattner Y, Berg E, Kivelson SA. 2015. Phys. Rev. Lett. 114:097001
- [93] Dumitrescu PT, Serbyn M, Scalettar RT, Vishwanath A. 2015. arXiv:1512.08523
- [94] Li ZX, Wang F, Yao H, Lee DH. 2016b. Sci. Bull. 61:925–930
- [95] Kang J, Fernandes RM. 2016. arXiv:1606.01170
- [96] Linscheid A, Maiti S, Wang Y, Johnston S, Hirschfeld PJ. 2016. arXiv:1603.03739
- [97] Glasbrenner JK, Mazin II, Jeschke HO, Hirschfeld PJ, Fernandes RM, Valentí R. 2015. Nat. Phys. 11:953–958
- [98] Wang F, Kivelson SA, Lee DH. 2015. Nature Physics 11:959–963
- [99] Chubukov AV, Fernandes RM, Schmalian J. 2015. Phys. Rev. B 91:201105
- [100] Yu R, Si Q. 2015. Phys. Rev. Lett. 115:116401
- [101] Gastiasoro MN, Eremin I, Fernandes RM, Andersen BM. 2016. arXiv:1607.04711
- [102] Tafti FF, Juneau-Fecteau A, Delage ME, René de Cotret S, Reid JP, et al. 2013. Nat. Phys. 9:349–352
- [103] Hirschfeld PJ, Korshunov MM, Mazin II. 2011. Rep. Prog. Phys. 74:124508
- [104] Wollman DA, Van Harlingen DJ, Lee WC, Ginsberg DM, Leggett AJ. 1993. Phys. Rev. Lett. 71:2134–2137
- [105] Hirschfeld PJ, Altenfeld D, Eremin I, Mazin II. 2015. Phys. Rev. B 92:184513
- [106] Mazin II. 2011. Phys. Rev. B 84:024529
- [107] Maier TA, Graser S, Hirschfeld PJ, Scalapino DJ. 2011. Phys. Rev. B 83:100515
- [108] Kreisel A, Wang Y, Maier TA, Hirschfeld PJ, Scalapino DJ. 2013. Phys. Rev. B 88:094522
- [109] Chen X, Maiti S, Linscheid A, Hirschfeld PJ. 2015. Phys. Rev. B 92:224514
- [110] Zhang Y, Lee JJ, Moore RG, Li W, Yi M, et al. 2015c. arXiv:1512.06322
- [111] Beaird R, Vekhter I, Zhu JX. 2012. Phys. Rev. B 86:140507
- [112] Xiang YY, Wang F, Wang D, Wang QH, Lee DH. 2012. Phys. Rev. B 86:134508
- [113] Bazhirov T, Cohen ML. 2013. J. Phys. Condens. Matter 25:105506
- [114] Zheng F, Wang Z, Kang W, Zhang P. 2013. Sci. Rep. 3:2213
- [115] Miao H, Qian T, Shi X, Richard P, Kim TK, et al. 2015. Nat. Commun. 6:6056
- [116] Chen X, Mishra V, Maiti S, Hirschfeld PJ. 2016. arXiv:1606.00501
- [117] Zhang P, Richard P, Xu N, Xu YM, Ma J, et al. 2014c. Appl. Phys. Lett. 105
- [118] Liu ZH, Richard P, Xu N, Xu G, Li Y, et al. 2012b. Phys. Rev. Lett. 109:037003
- [119] Shi X, Han ZQ, Peng XL, Richard P, Qian T, et al. 2016. arXiv:1606.01470
- [120] Zhang S, Guan J, Jia X, Liu B, Wang W, et al. 2016. arXiv:1605.06941